Review

Research Progress and Hotspot Analysis of Urban Heat Island Effects Based on Cite Space Analysis

1
College of Forestry, Guizhou University, Guiyang 550025, China
2
College of Life Sciences, Guizhou University, Guiyang 550025, China
*
Author to whom correspondence should be addressed.
Land 2023, 12(6), 1154; https://doi.org/10.3390/land12061154
Submission received: 7 May 2023 / Revised: 28 May 2023 / Accepted: 29 May 2023 / Published: 31 May 2023
(This article belongs to the Section Land–Climate Interactions)

Abstract

:
The urban heat island (UHI) effect has become a hot topic in the global urban ecological environment. Research on the UHI effect is of great significance for alleviating urban environmental problems. Therefore, it has attracted the extensive attention of a large number of researchers in the field of urban environmental issues, such as urban ecologists, urban climatologists, urban planners, geographers, relevant policy makers, etc. However, systematic reviews are lacking on UHI research in the context of rapid urbanization and global change in recent years. In this study, we used Cite Space software to analyze the development process and current situation of UHI research from multiple perspectives during 2008–2021, aiming to reveal research hotspots and predict future trends. We found that UHI has gradually become a multidisciplinary field, and has existed in a flourishing period since 2008 with the rapid development of a number of publications. A large amount of research has been carried out by relevant institutions and scholars in 85 countries from 2008 to 2021. The hotspot research frontier focuses on the influencing factors, mitigation measures, and quantitative analysis of the UHI effect. Based on these trends and the status of the field, we proposed further research directions to promote interdisciplinary integration, optimize quantitative monitoring methods, strengthen the impact of three-dimensional urban landscape and vegetation landscape patterns, and expand the study of the urban agglomeration scale. Our results provide a valuable reference and potential frontier for future research in the field of the UHI effect.

1. Introduction

With the rapid development of the population and economy, urbanization has become an inevitable trend in human society [1]. However, in the context of the continuous development of urbanization and the gradual warming of the global climate, rapid urbanization has greatly changed the underlying surfaces of cities. This has had a serious impact on the urban thermal environment, leading to a serious increase in urban heat island (UHI) effects [2,3].
Since the concept and phenomenon of UHI was first proposed by Howard in 1833 [4], the study of UHI has attracted more attention from scholars in recent decades. At present, the UHI has become a multidisciplinary cross-fusion issue, including meteorology, environmental science, ecology, resource application, building science, remote sensing, etc. Furthermore, due to the continuous advancement of urbanization and the enhancement of ecological protection awareness [5], sustainable urban development has become a vital goal of human society in the new era, and the UHI, as an important and serious urban environmental problem, has attracted more concern from relevant scholars and decision makers [6]. Previous studies have been conducted on the land surface temperature (LST) inversion algorithm [7,8,9], spatio-temporal variation [10,11], influence factors, and mitigation strategies of UHI [12,13], as well as the relationship between daytime LST and 2D/3D urban form [14], urban microclimate [15,16,17], etc. The relevant research has confirmed that the expansion of the influence range of the global UHI effects could not only cause an abnormal rise of the urban climate and prominent urban ecological problems [18], but also threaten the health and welfare of urban residents [19,20]. Therefore, it is necessary to synthesize the current research status to reveal the evolutionary trends and future potential directions in this field, so as to promote more scientific and in-depth research on the UHI effect and to provide references to mitigate effectively the urban environmental problems which it brings about.
In the present study, we analyzed the research on the UHI effect using data from a literature search of the Web of Science (WOS) core collection and the China National Knowledge Infrastructure (CNKI) databases from January 1980 to December 2021. We emphatically reviewed the academic achievements and progress in this field during the rapid development period (2008–2021). The bibliometric method and scientific knowledge graph method, made possible by the Cite Space 5.8.3 software, were used to study the evolution of the number of studies, as well as to assess research cooperation networks, subject categories, and frequently cited literature so as to analyze the overall progress in this field. Meanwhile, the research hotspots and frontiers were identified by keyword co-occurrence and emergent analysis, and the future potential research directions were proposed according to the synthetic analysis of the trend of studies in this field. The aim of this study is to provide a clear picture of the current situation, evolution process, hotspot topics, and future research directions in the field of the UHI effect, which will be helpful in improving the theoretical research on urban heat islands and provide references for new research directions and perspectives regarding them.

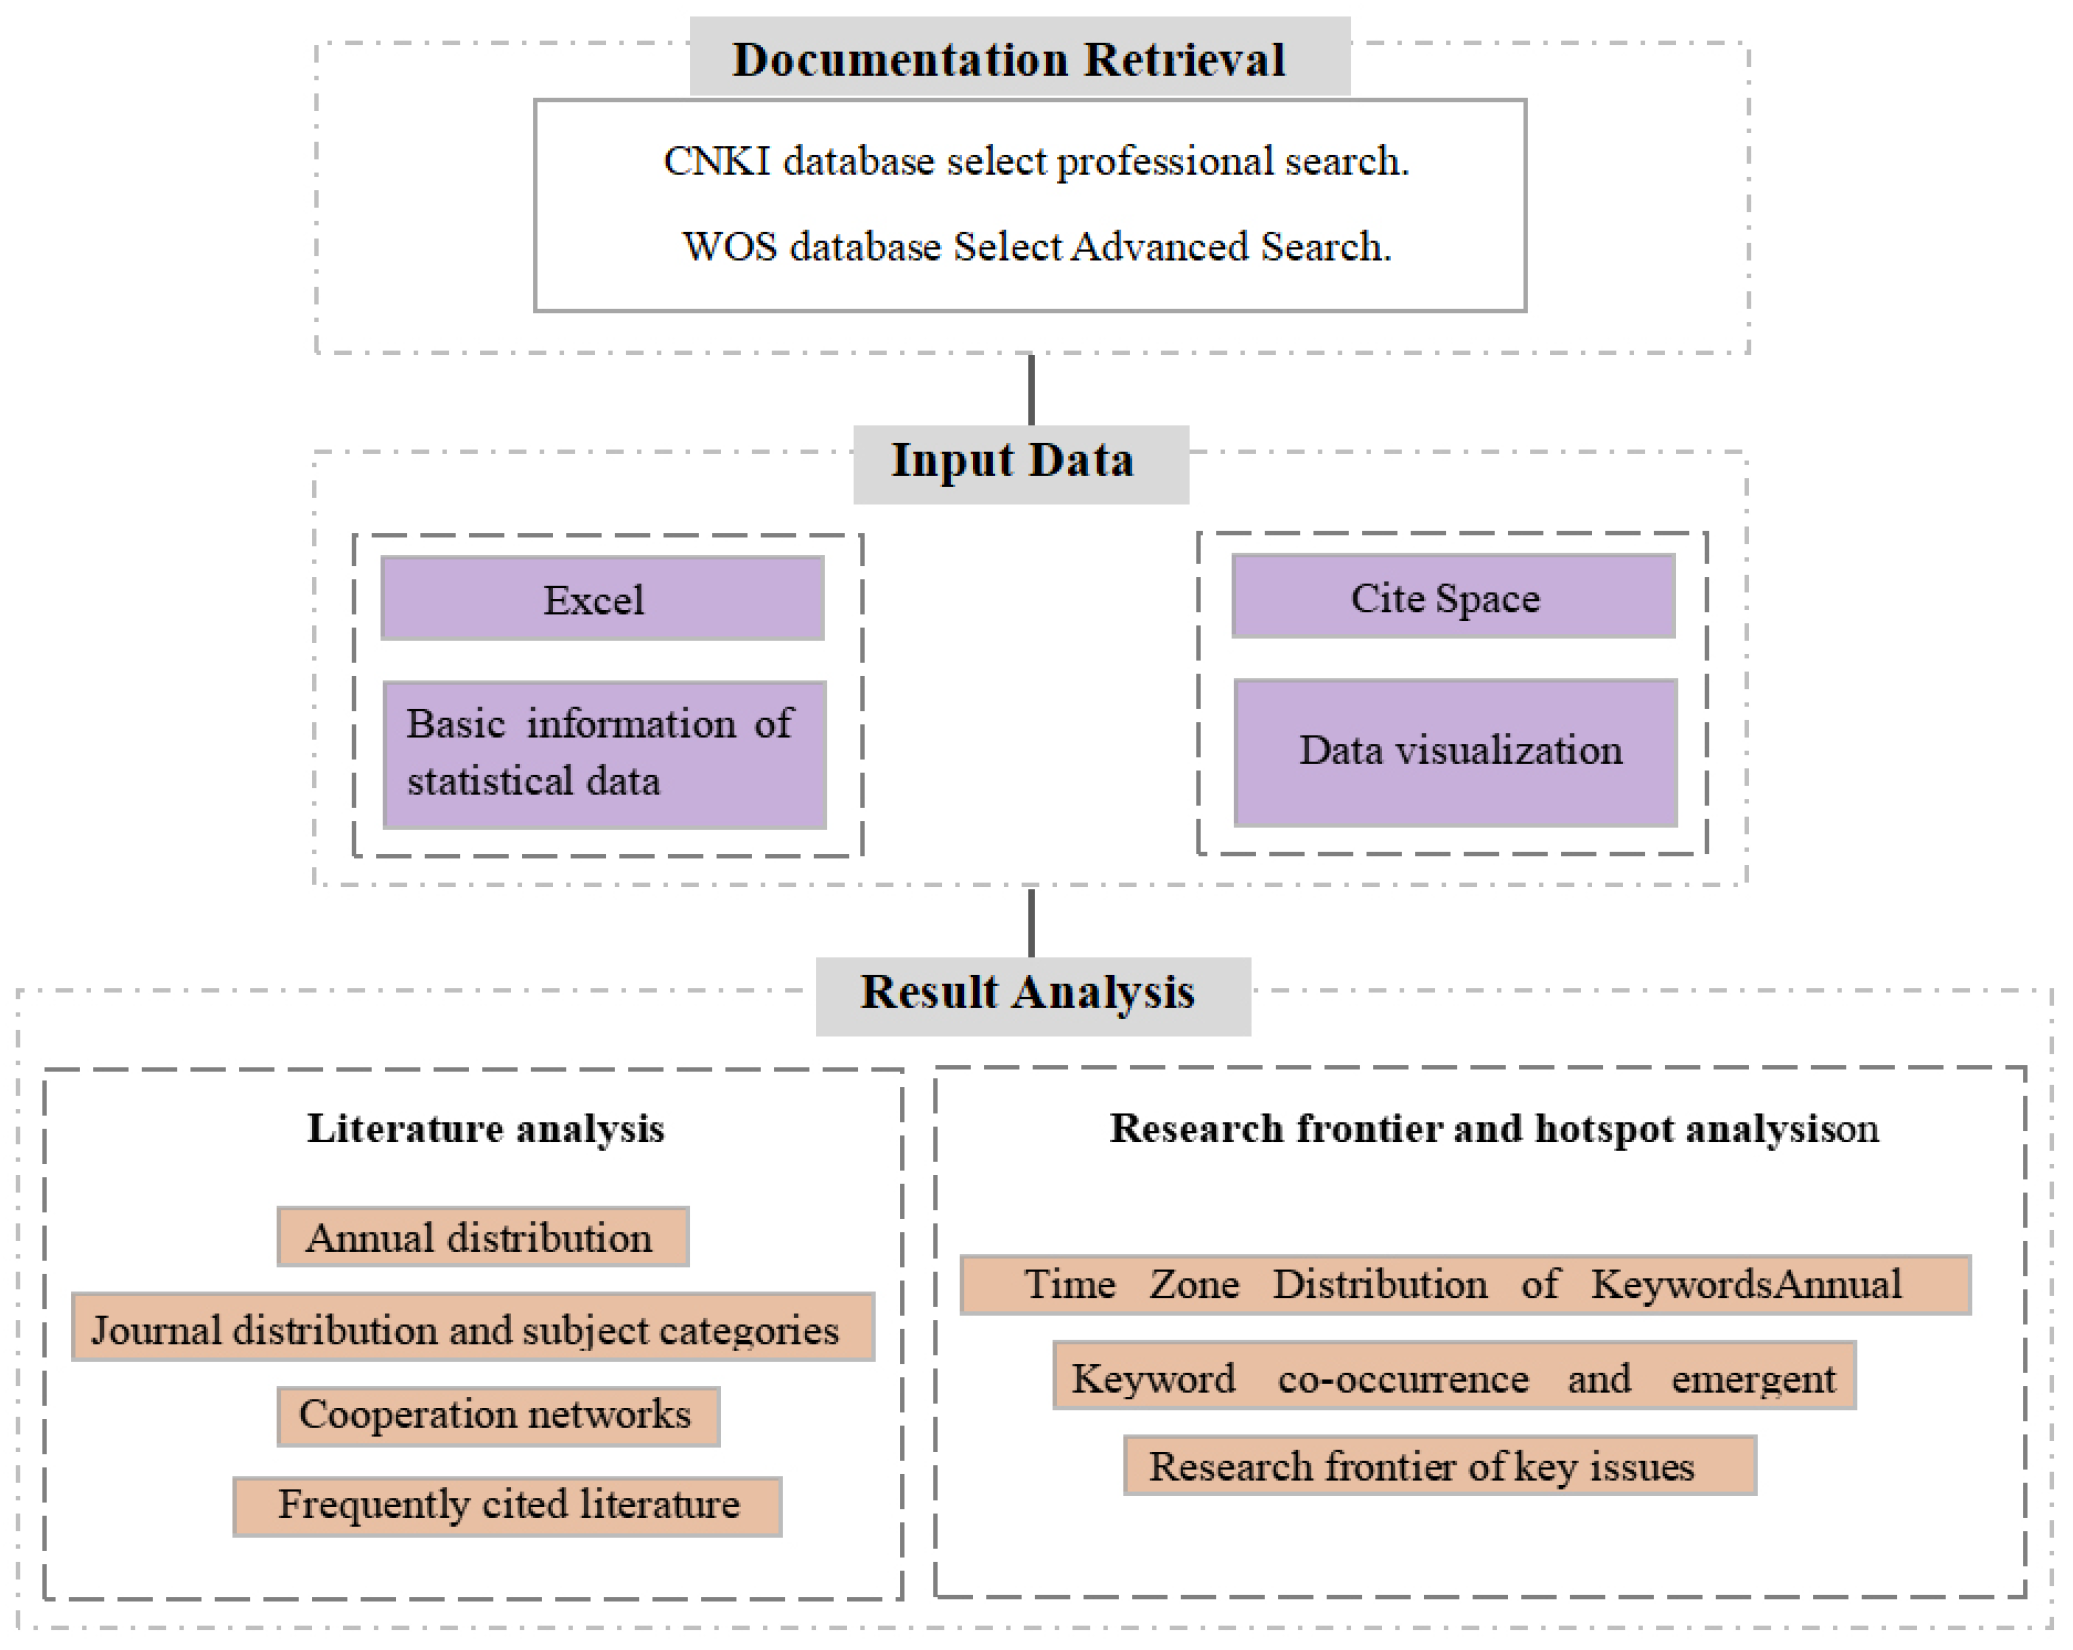
2. Materials and Methods

2.1. Database and Screening

The China National Knowledge Infrastructure (CNKI) is the largest Chinese database in the world, with a powerful full-text retrieval system in its network database, providing an essential way to retrieve Chinese data. Web of Science (WOS) is the world’s largest comprehensive academic information resource, covering the most disciplines and containing more than 10,000 of the world’s most influential high-quality core journals in multiple research fields [21]. In view of this, to increase the representativeness and accessibility of the data, the CNKI database and the WOS database were selected as the data acquisition sources using the data collected on 17 August 2022. Based on the CNKI database, SU% = ‘urban heat environment’ + ‘urban heat island’ + ‘urban heat effect’ + ‘urban surface temperature’ AND KY = ‘urban heat island’ + ‘urban surface temperature’ was used as the search statement to select all of the journals for professional search. The time span of the literature search was from 1 January 1980 to 31 December 2021. Based on the WOS database, the TI = (urban thermal environment OR urban heat island OR urban thermal effect OR urban land surface temperature) was used as the search statement, and the article type was selected for the advanced search, spanning from 1 January 2008 to 31 December 2021. A total of 4223 articles were retrieved from the two databases, including 1769 WOS articles and 2454 CNKI articles (1912 published from 2008 to 2021), which were used as the basic data for this study.

2.2. Analytical Methods

Due to the large data volume of this paper, it was difficult to extract their information manually, and data analysis needed to be carried out with the help of software. Therefore, Cite Space 5.8.3 software, jointly developed by Dr. Chen Chaomei and WISE Laboratory of Dalian University of Technology, was used in this study for data visualization analysis [22,23]. Cite Space Bibliometry tools combine the bibliometry method, the information visualization method, and the data mining method, and can explore the key paths and knowledge turning points of research hotspots and trend evolution in different disciplines [24]. Meanwhile, compared with other visualization software, CiteSpace has the advantages of simple operation, multiple mapping, high information content, automatic recognition mapping, and easy interpretation [15,16,17]. Therefore, the powerful visualization tool of this software was used to meet our research goals.
First of all, we used the traditional bibliometric method based on the Excel software of the two databases, the distribution of national published literature, journal distribution, high-frequency literature, and high-yield authors to create the corresponding charts so as to analyze the CNKI and WOS databases and assess the basic situation of urban heat island-related papers. Subsequently, Cite Space 5.8.3 software was used to explore the keyword co-occurrence network and discover the research hotspots in the field of urban heat islands in the two databases, CNKI and WOS. We accomplished this by setting the node type in the Cite Space 5.8.3 software to “key word”, the time period to 2008–2021, and the other settings to default. In addition, by choosing the temporal axis view of the software (time zone map) and emergent analysis (emergent map), it became possible to visualize the trend evolution of the subjects in this field. Firstly, the relevant charts from the two databases were interpreted and analyzed. Then, the differences between CNKI and WOS from 2008 to 2021 were compared and analyzed in terms of publication trend, journal distribution, subject categories, research hotspots, etc (Figure 1).

3. Results

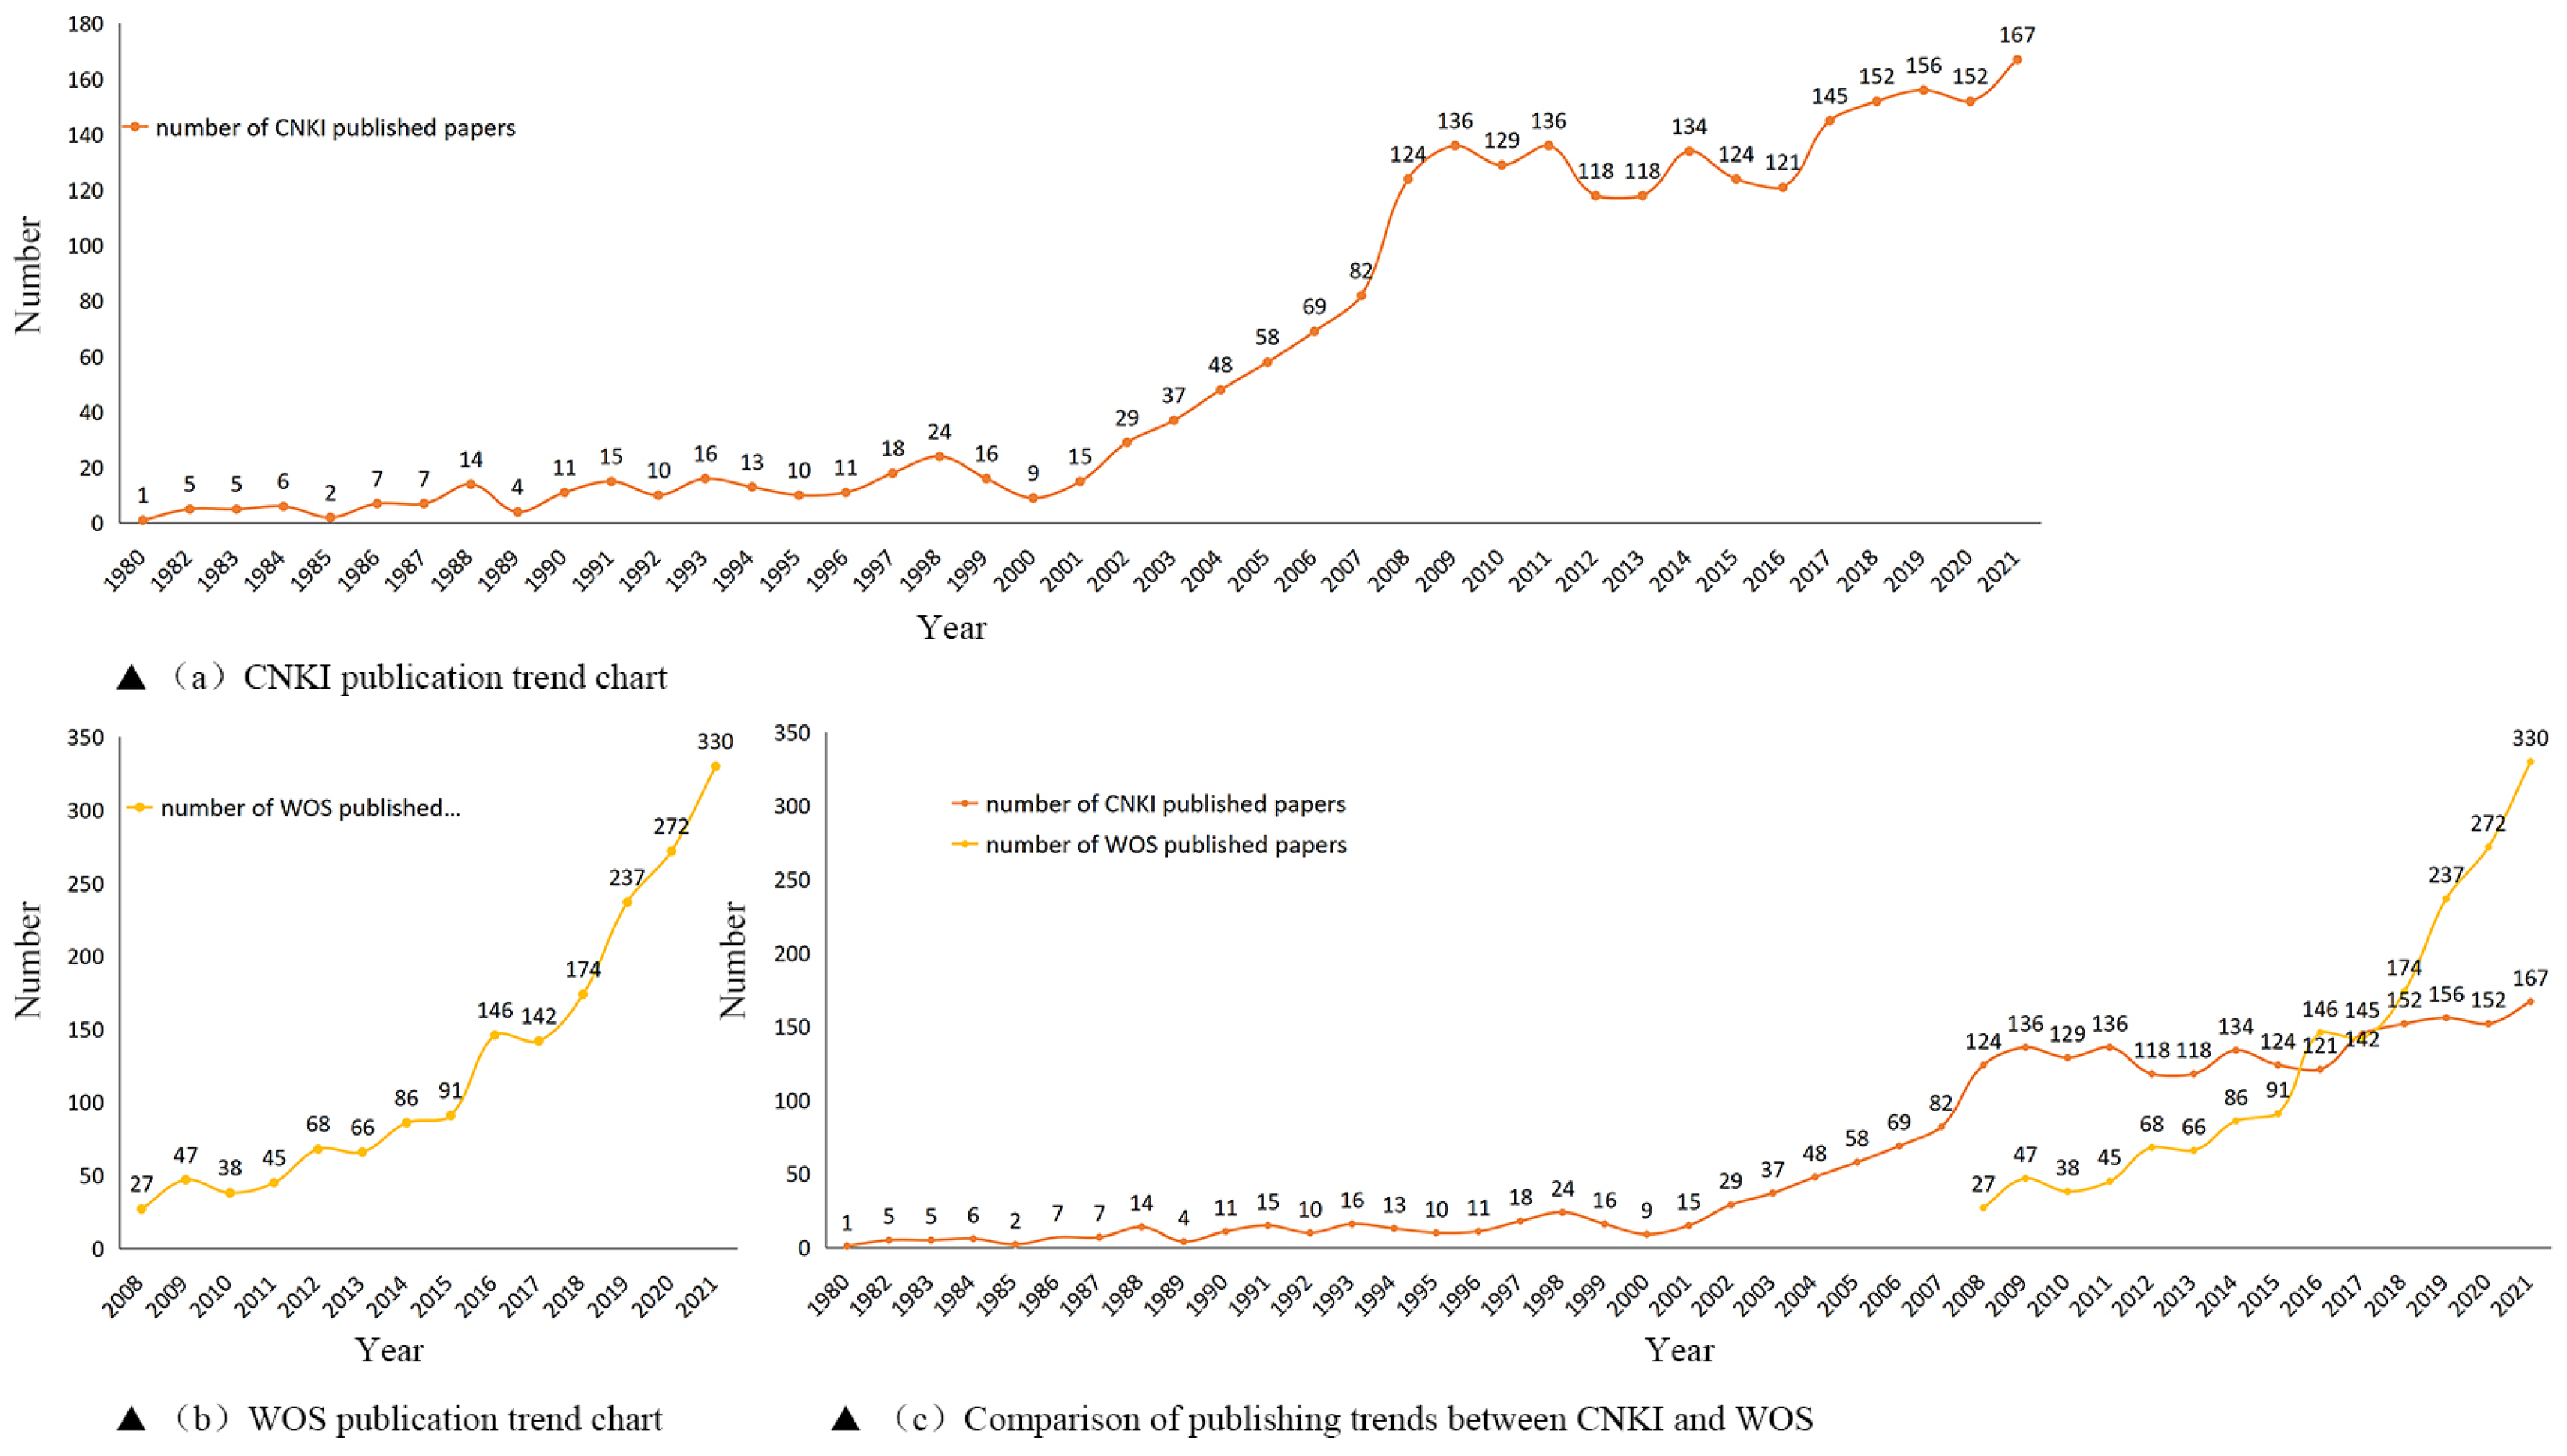
3.1. Annual Distribution

The amount of annual literature in both CNKI and WOS displayed obvious stages (Figure 2). For the literature in CNKI, the relevant research on UHI emerged in the 1980s. The development process can be divided into three stages, namely, (1) the embryonic stage (1980–2001), during which the annual number of publications was less than 25; (2) the rapid growth stage (2001–2008), during which the number of annual publications increased year by year at the maximum growth rate; and (3) the fluctuating growth stage (2008–2021), during which the annual number of publications fluctuated between 115 and 170—however, the growth rate decreased overall in this stage (Figure 2a). Previous studies reported that the literature on UHI published in WOS emerged in 1990, and the research process experienced two stages of preliminary development, with fewer publications from 1990 to 2008 and rapid development from 2008 to 2021 [25]. In this study, we analyzed the annual publications in WOS between 2008 and 2021. This indicated that the annual number of publications increased continuously during 2008–2021 in WOS, and the publication trend in this period could be subdivided into two stages, namely, a slight growth phase from 2008 to 2016 and a faster growth phase from 2016 to 2021 (Figure 2b). On the whole, the annual number of publications both in CNKI and WOS from 2008 to 2021 increased obviously; however, the quantity of annual research published in WOS was greater than that in CNKI beginning in 2016 (Figure 2c).

3.2. Journal Distribution and Subject Categories

There were 20 journals which primarily published the literature on UHI in CNKI. Among them were Acta Ecologica Sinica, with the largest number of publications (56 articles), followed by Ecology and Environmental Sciences (47 article) and Remote Sensing Technology and Application (33 articles) (Table 1). However, the 1769 articles in WOS were distributed across 283 journals. Sustainable Cities and Society was the journal with the largest number of published documents (129 articles), followed by Remote Sensing (103 articles) and Urban Climate (96 articles). The number of articles published in these three journals accounted for 18.5% of the total articles in WOS. However, the average annual number of papers cited in WOS was greater in Sustainable Cities and Society (349.29), Science of the Total Environment (310.71), Building and Environment (251), and Energy and Buildings (219.79) than in other journals, which indicated that the relevant research in these four journals received greater attention in the field of UHI (Table 2).
The subjects of the publications displayed an obvious discipline aggregation. The relevant research in CNKI was mainly focused on the fields of meteorology, environmental science and resource utilization, and building science and engineering. However, although the academic categories of the studies on UHI in WOS numbered more than 1000, the environmental sciences, meteorology atmospheric sciences, and remote sensing were the three dominant disciplines with the most extensive coverage and distribution.

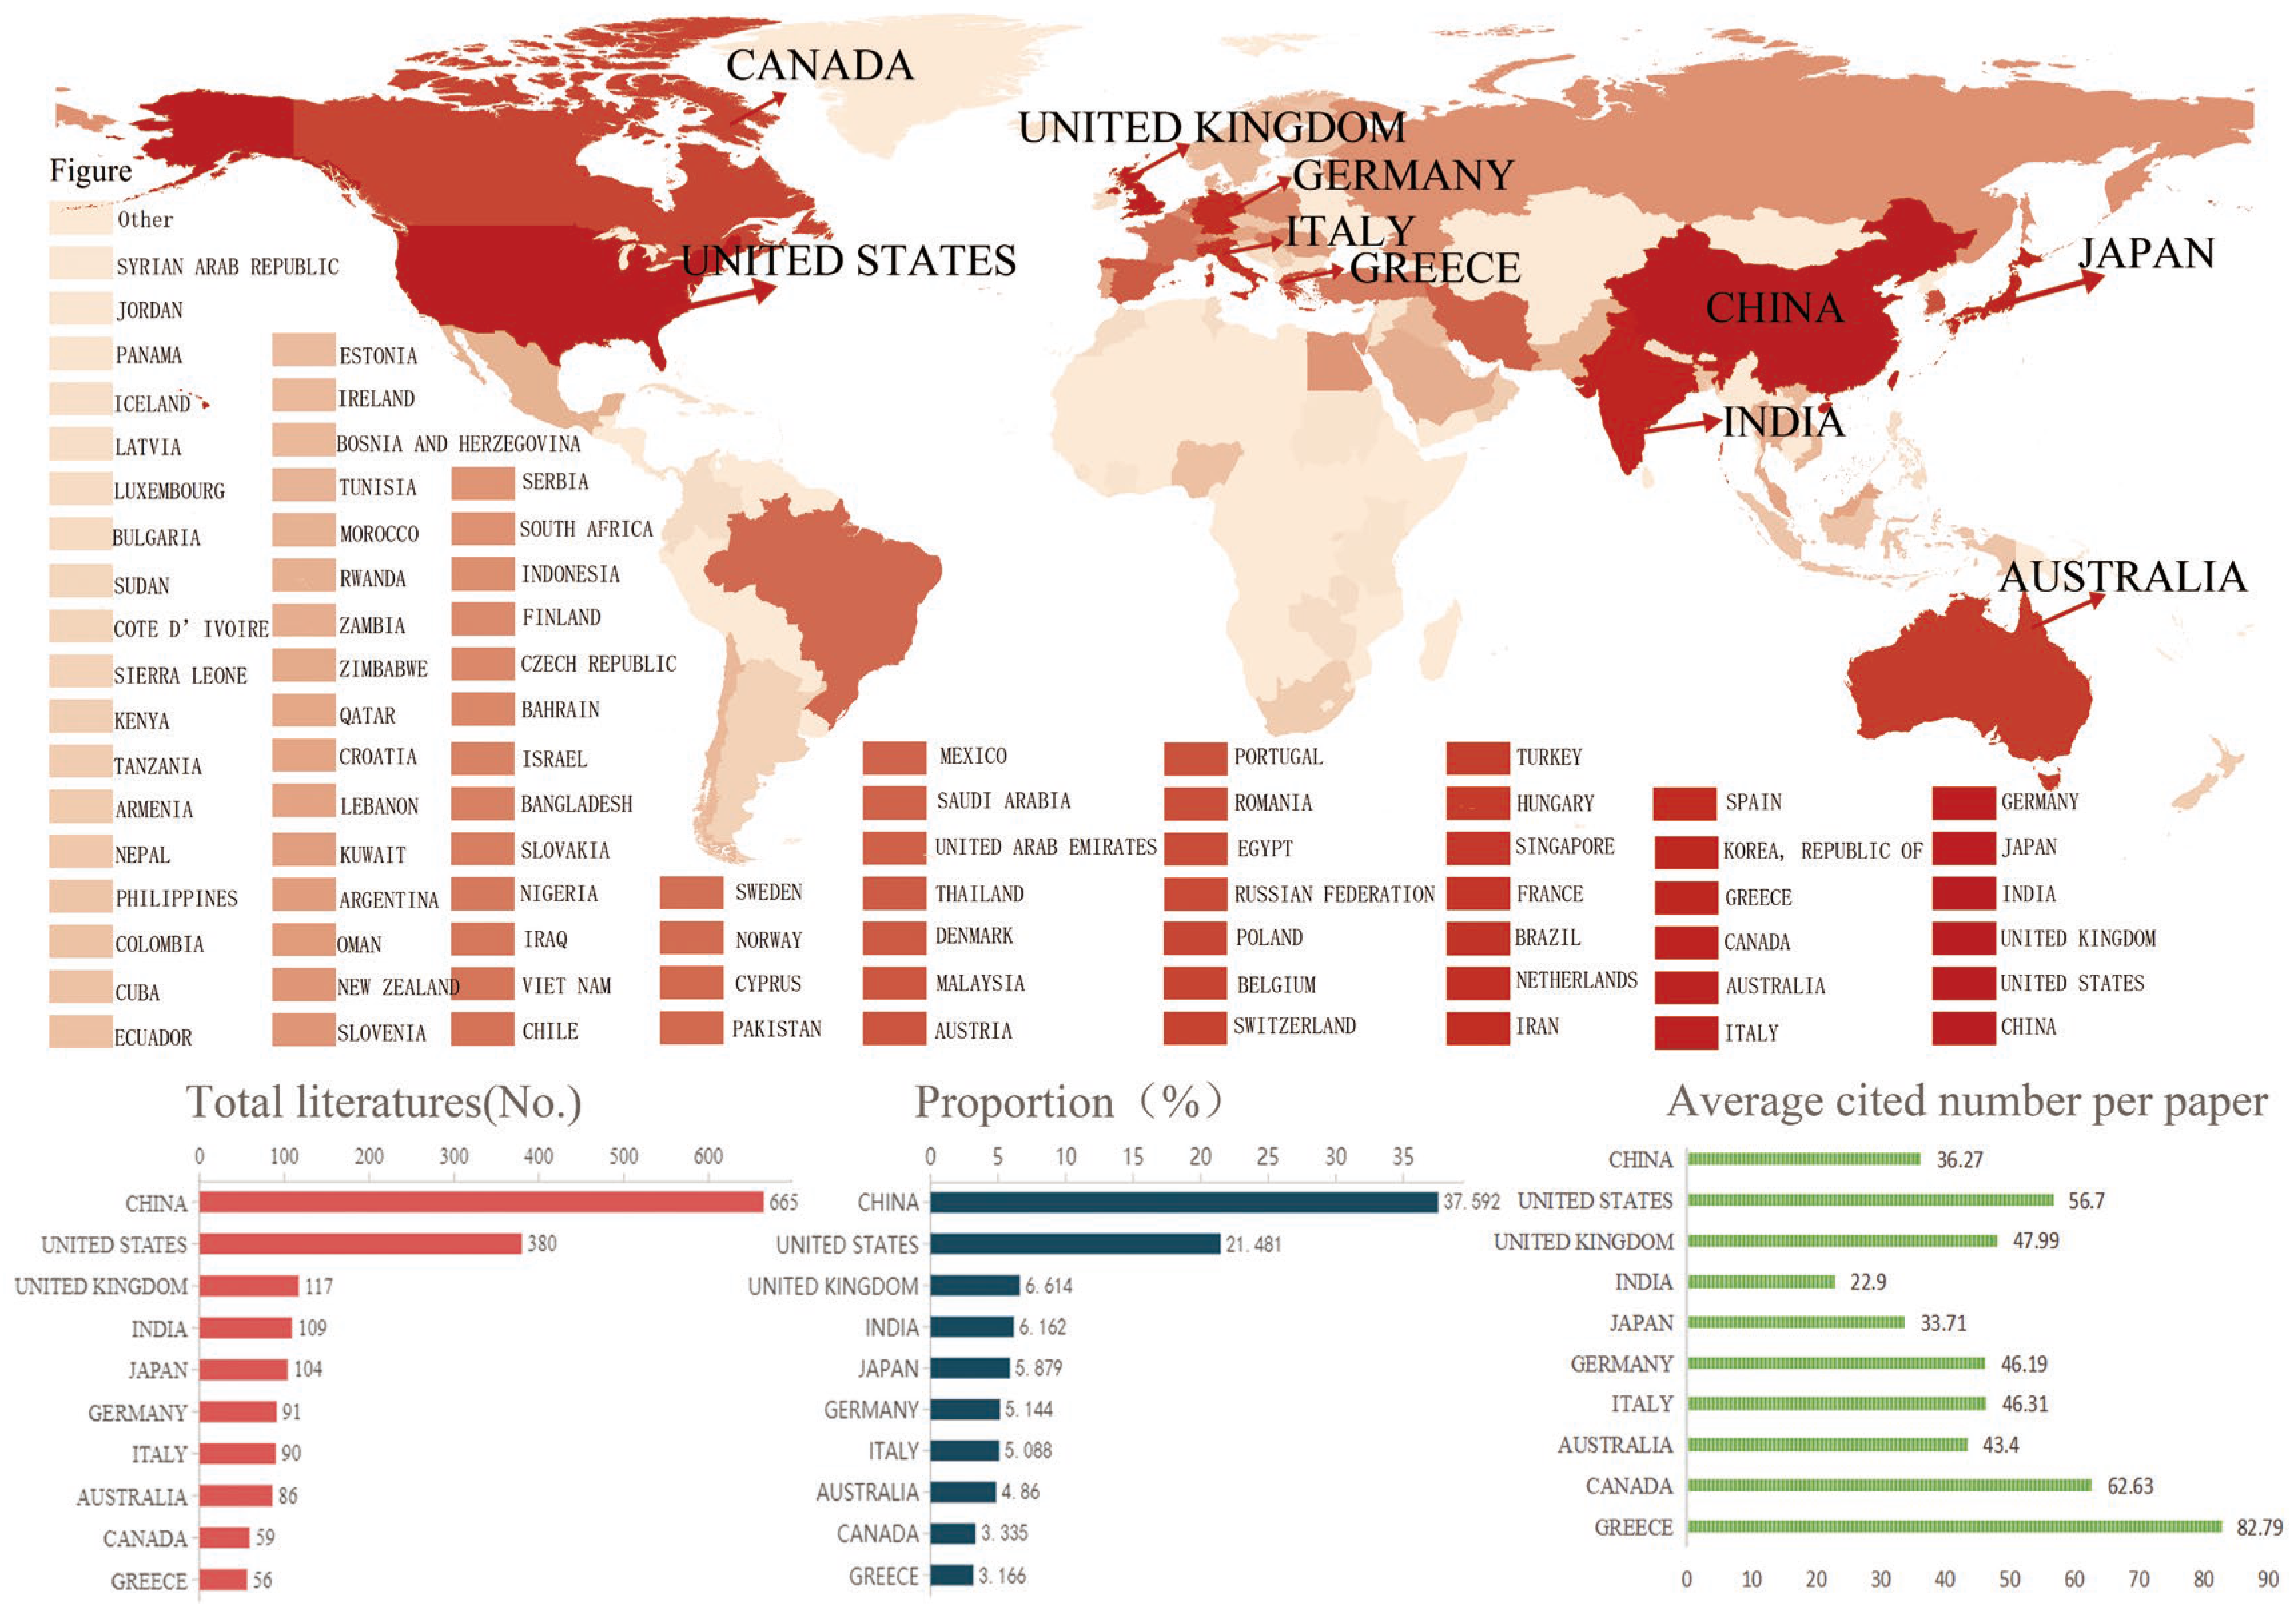
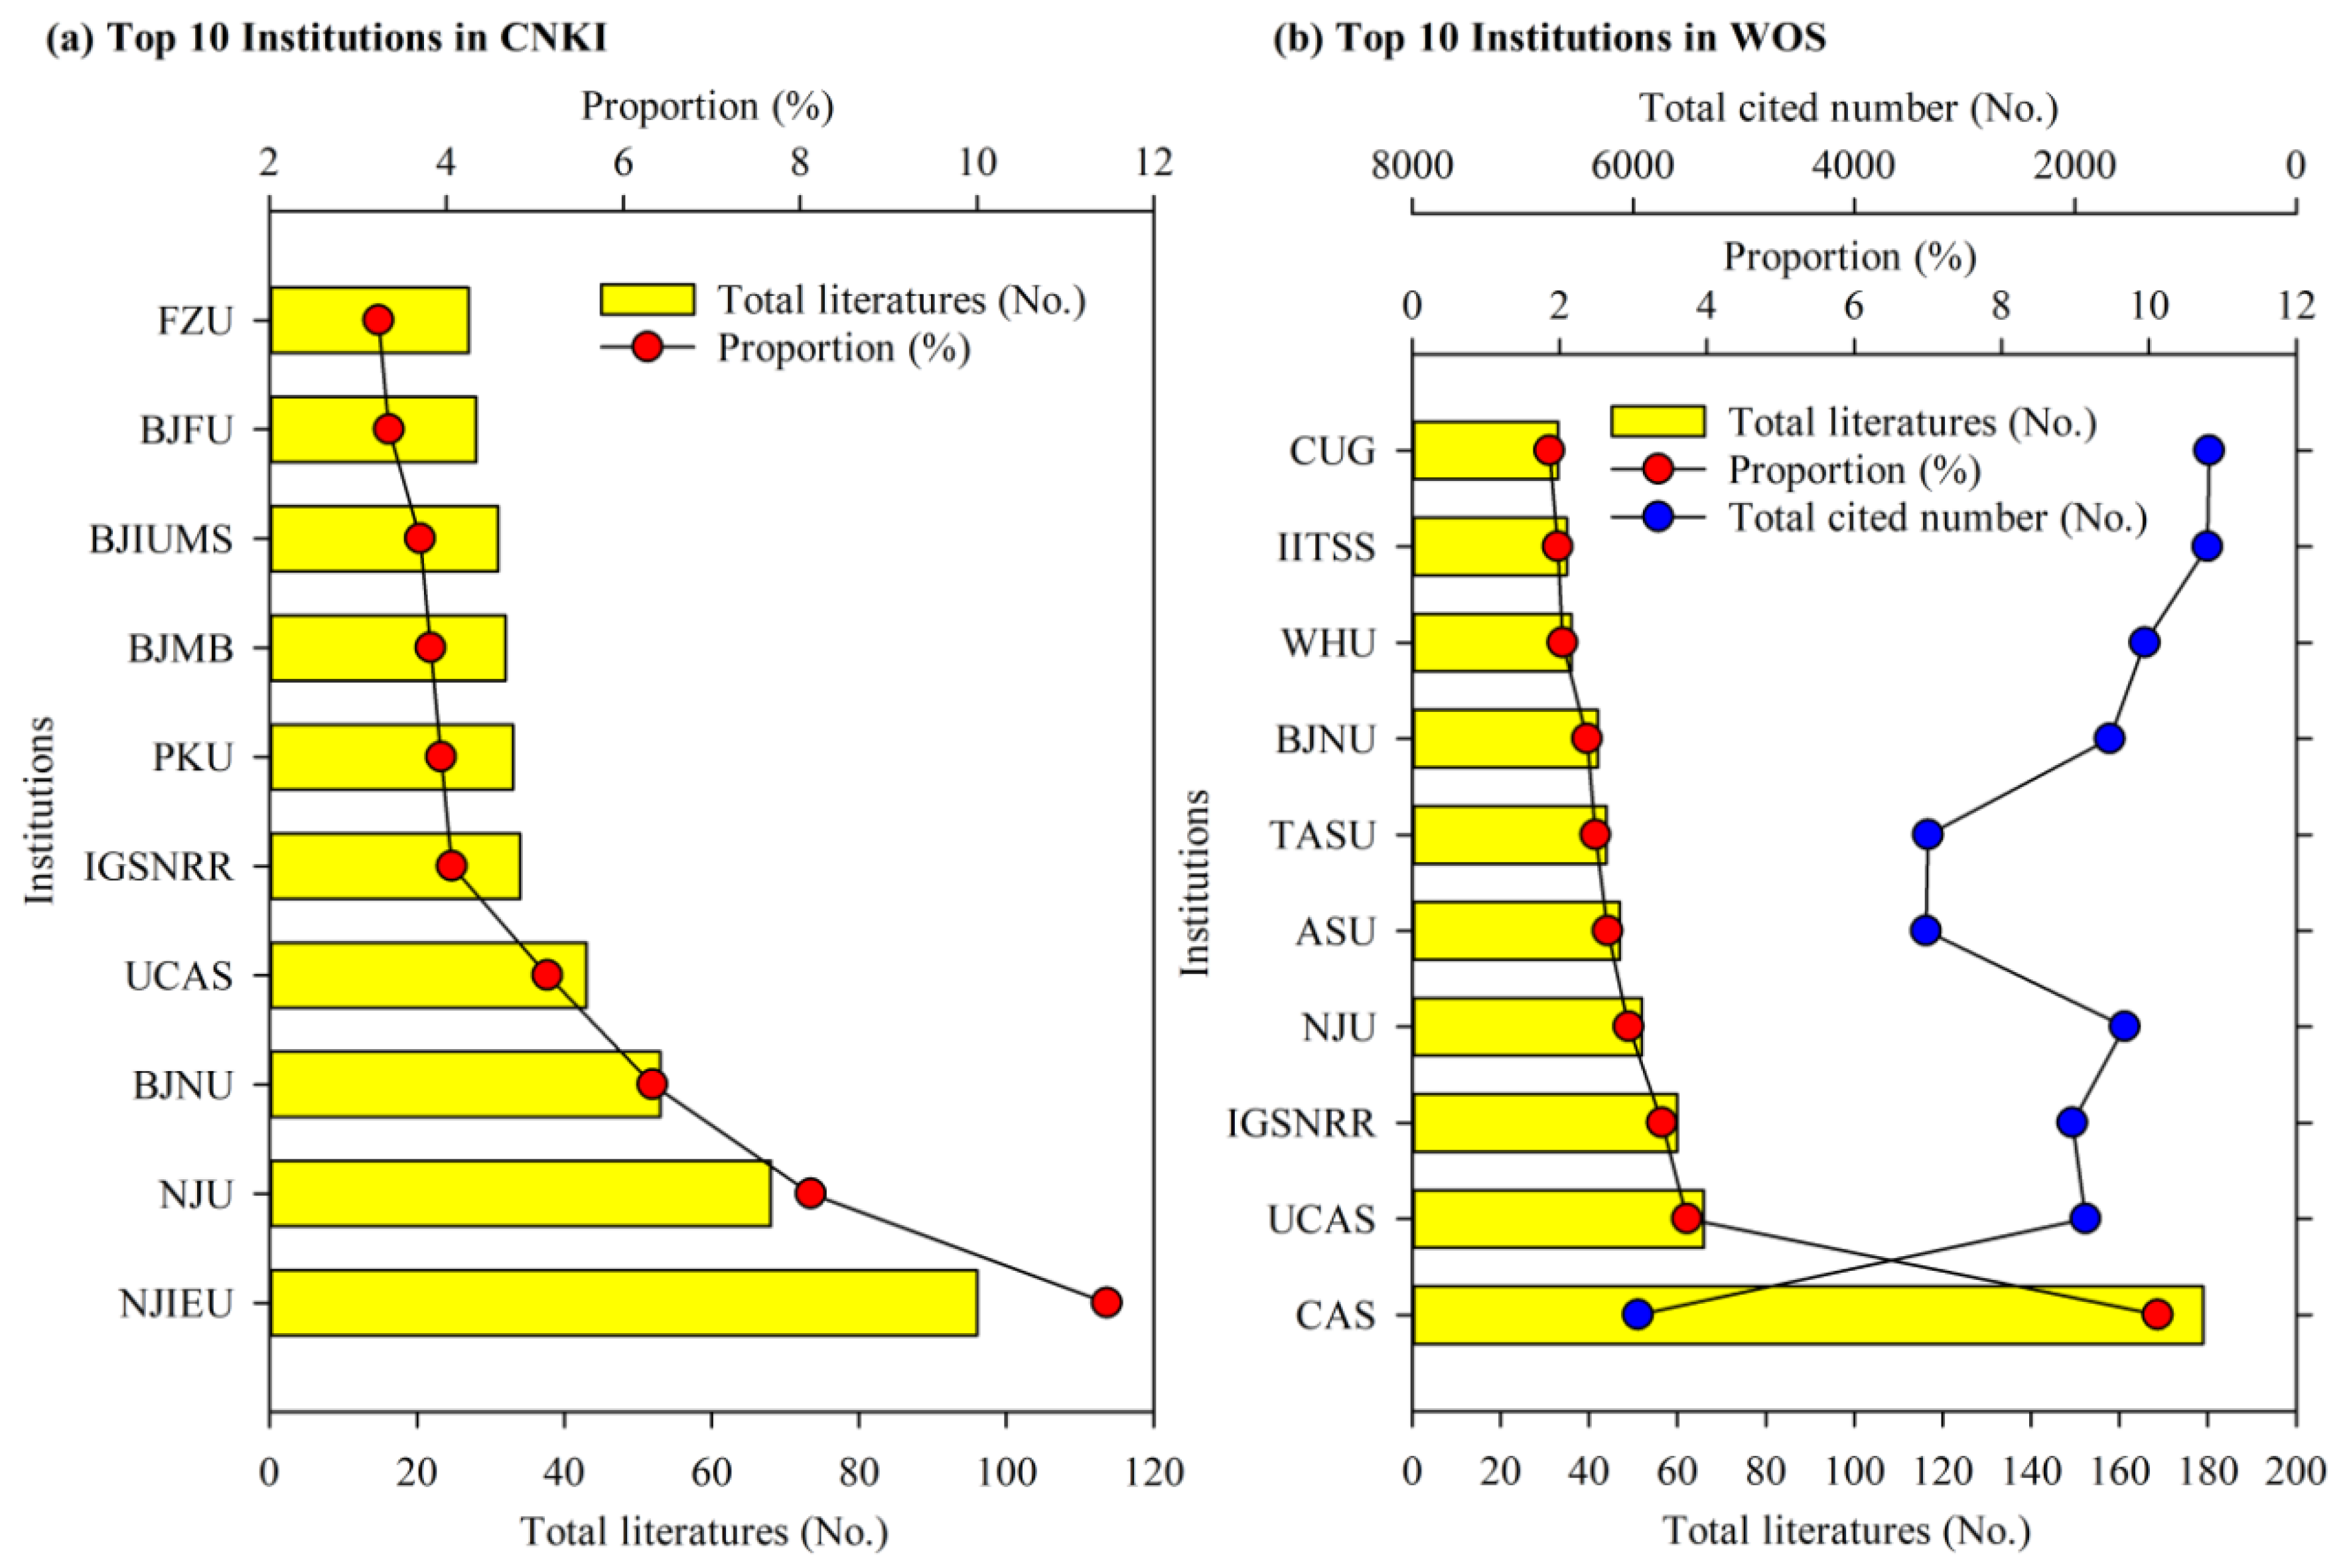
3.3. Cooperation Networks

The network of cooperation of countries and institutions based on the nationality of authors displayed the key countries and institutions that have a strong influence in the field of UHI. A total of 85 countries have participated in studies on UHI, among which 10 countries have produced the majority of the literature, accounting for 99.32% of the total literature in WOS. China (665 articles) and the United States (380 articles) were the dominant countries, which reflected the significant research volume and output of scholars in these 2 countries in the field of UHI. They were followed by the United Kingdom (117 articles), India (109 articles), Japan (104 articles), Germany (91 articles), Italy (90 articles), Australia (86 articles), Canada (59 articles), and Greece (56 articles). Although Greece was ranked tenth of the publications in these 10 countries, its average number of citations per paper was the highest, with a value of 82.79, followed by Canada (62.63), the United States (56.7), and the United Kingdom (47.99), indicating that the scientific research results produced by these countries has greater influence and higher citation value (Figure 3).
In line with the countries with higher quantities of published literature, the institutions with larger numbers of publications were mainly distributed in China and the United States (Figure 3). In CNKI database, the Nanjing University of Information Science & Technology contributed the most publications, with the total number of publications, 96, accounting for 11.47% of the articles in CNKI, followed by Nanjing University (68 publications) and Beijing Normal University (53 publications). Professor Xu Hanqiu from Fuzhou University is author with the most publications in the CNKI database, with 21 publications. In contrast, the top 10 institutions with the most publications in WOS database were distributed within China (7), the United States (2), and India (1), among which 4 institutions (i.e., Chinese Academy of Sciences, University of Chinese Academy of Sciences, the Institute of Geographic Sciences and Natural Resources Research of Chinese Academy of Sciences, Nanjing University) were the largest contributors to the field of UHI in the world, accounting for one-fifth (20.18%) of the total publications in WOS. In addition, the total publications of the Arizona State University (47 publications) and Arizona State University Tempe (44 publications) in the United States were relatively fewer than those of the above 4 institutions in China; however, the average numbers of citations per paper of these 2 institutions (71.26% and 75.68%, respectively) were obviously greater than those of other institutions (Figure 4).

3.4. Frequently Cited Literature

The articles with the top 10 highest citation frequencies in CNKI and WOS between 2008 and 2021 were sorted. We found that half of these articles in CNKI were published in Acta Ecologica Sinica. A review article published in Acta Ecologica Sinica by Chen et al. [26] had the highest citation frequency in CNKI (with 414 citations). This study comprehensively explored the impact of urbanization landscape pattern evolution on the UHI effect, and reviewed the research progress of the design of an urban ecological land and ecological security pattern. In addition, the remote sensing urban ecological index (RSEI) for assessing urban ecological effects, developed by Xu [27], and the relationship of the urban impervious surface with LST, conducted by Xu [28], had high citation frequencies, with 371 and 241 citations, respectively. Moreover, the frequently cited literature published in the CNKI database was focused on the impact factors (e.g., urban impervious surface, vegetation, water body, topography, land use structures, etc.) of the UHI effect [27,28,29,30], the spatial distribution of LST [31], and the theoretics of numerical simulation [32,33] (Table 3). As for the WOS database, 5 of the top 10 most often citated articles were contributed by Chinese scholars. In addition, the research issues were mainly concentrated on the mitigation measures and influence factors of UHI effects. For example, Imhoff et al. [34], in a research paper published in Remote Sensing of Environment, assessed the UHI skin temperature amplitude and its relationship to the development intensity, scale, and ecological environment setting for 38 cities in the United States (with 777 citations). Li et al. [35] revealed the influence of landscape composition and form on the heat island effect in the Shanghai metropolitan area. A research paper published by Zhao et al. [36] explored a possible method for the mitigation of UHI based on the temperature differences between urban and rural areas by using a climate model. A review article published by Santamouris et al. [37] in Solar Energy, the most frequently cited journal, with 858 citations in the WOS database from 2008–2021, systematically compared two measures (i.e., improving urban albedo and using vegetation on an urban scale to establish green roofs) to mitigate UHI (Table 4).

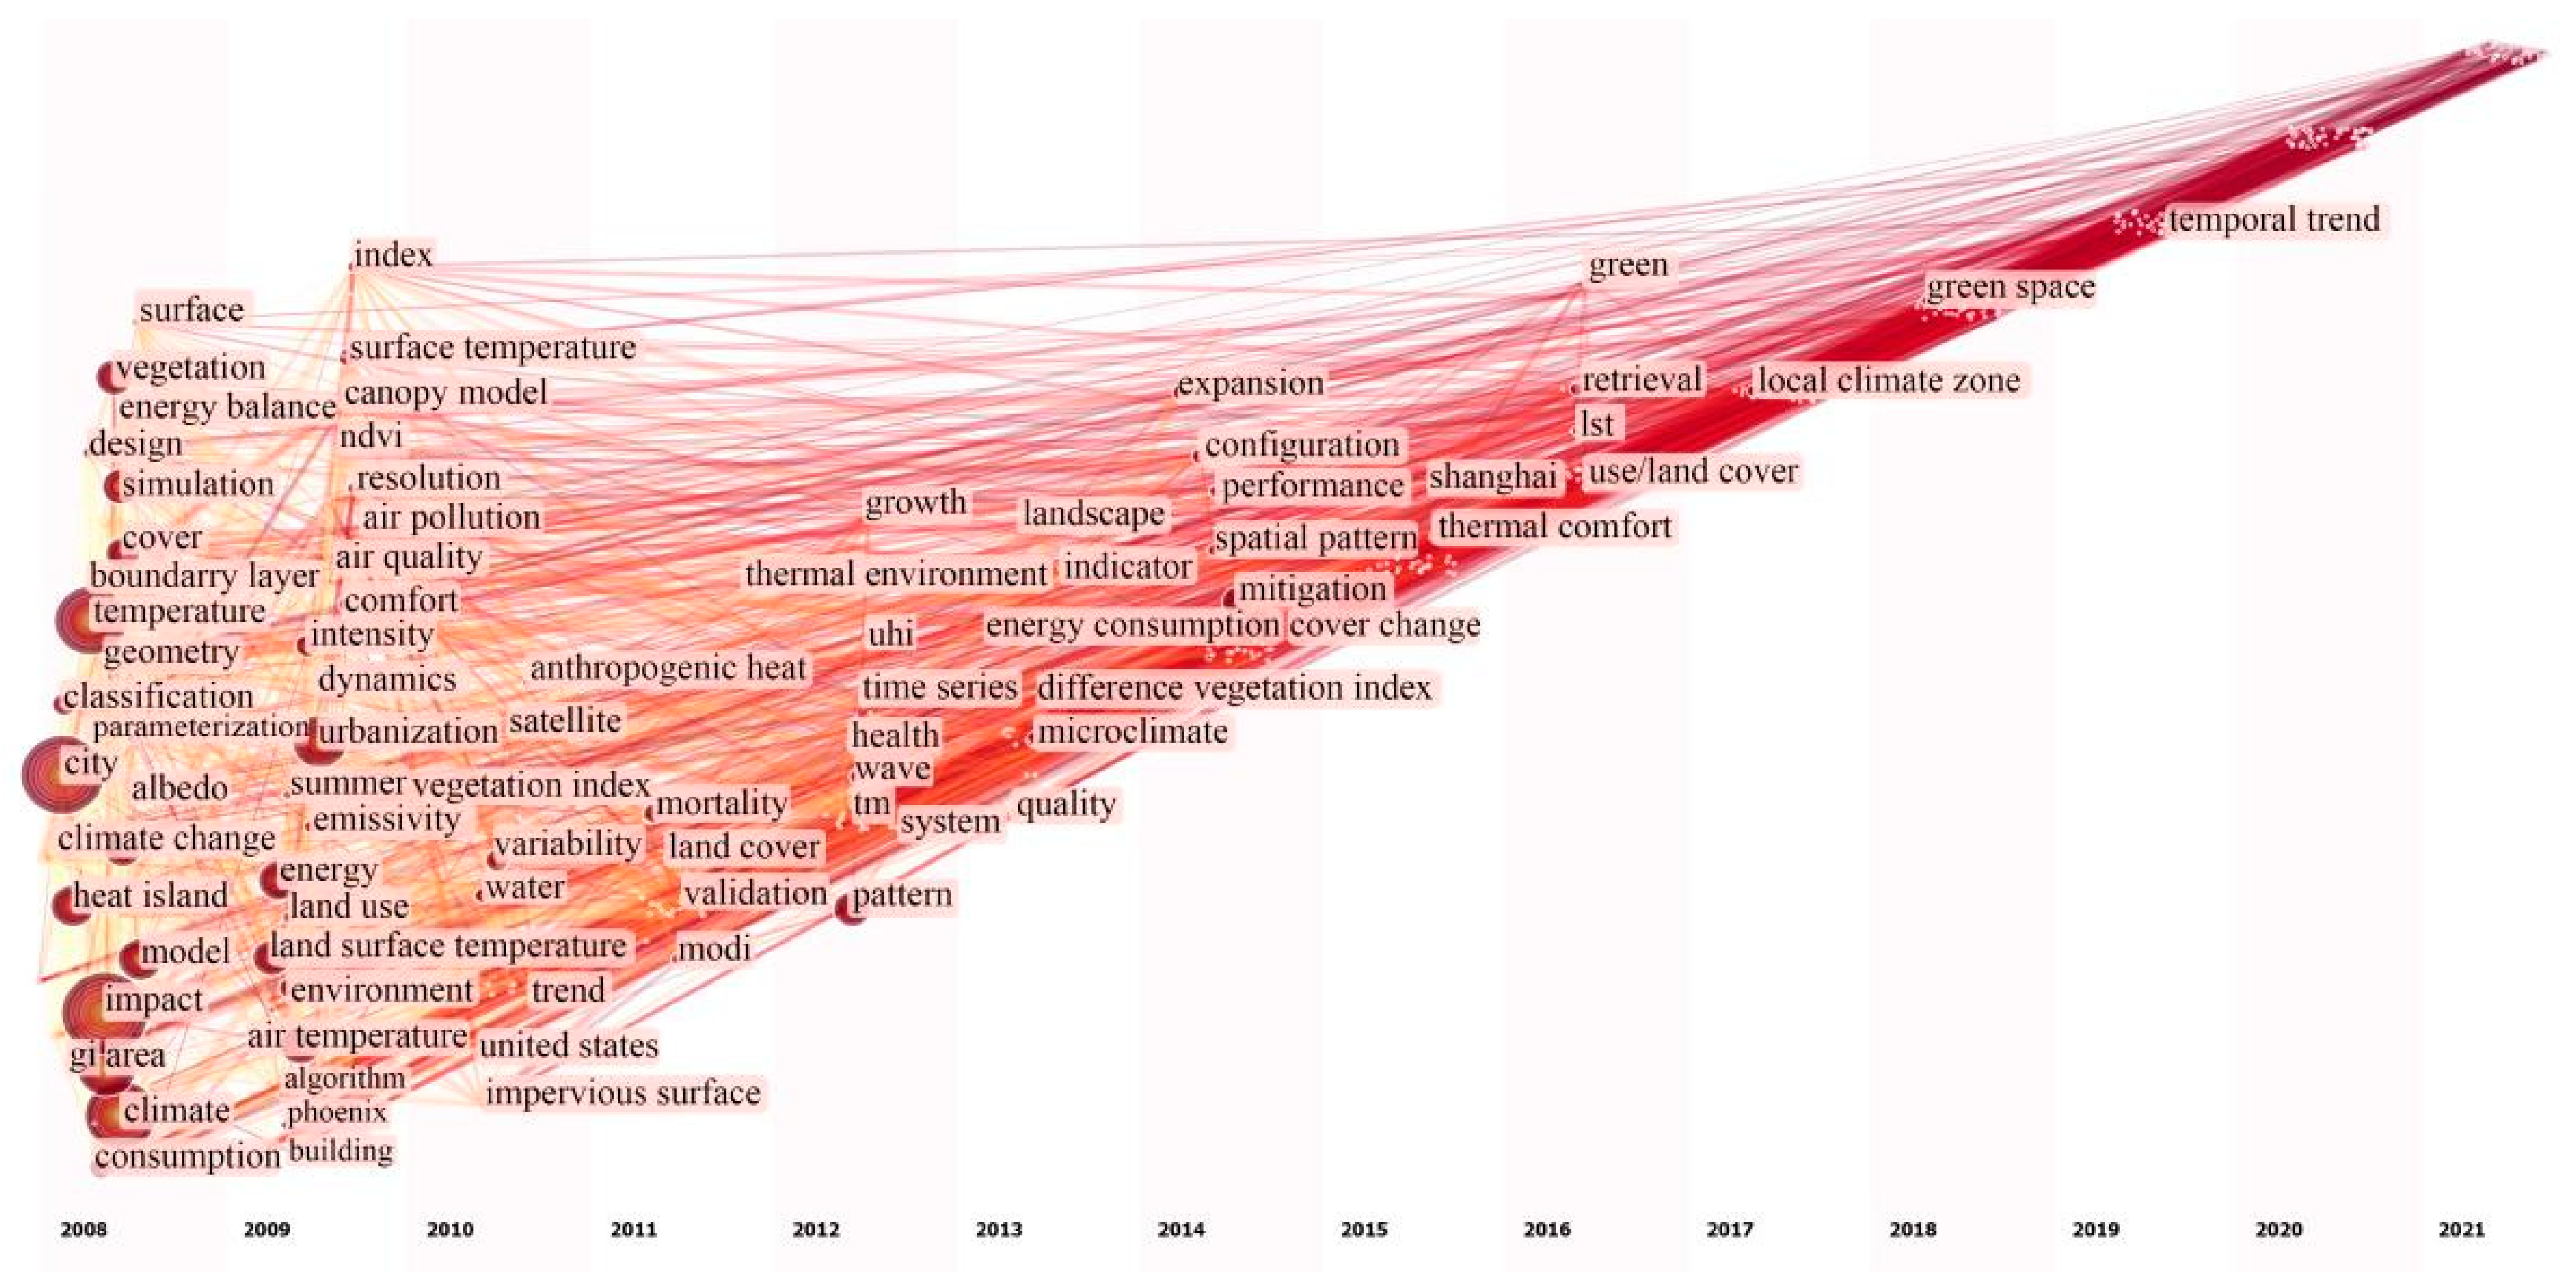
3.5. Time Zone Distribution of Keywords

The keywords (hot topics) during different stages of the research on UHI in CNKI and WOS were varied. In CNKI, early studies were mainly focused on the urban heat island effect and numerical simulation, temporal and spatial characteristics, heat island intensity, thermal environment, remote sensing, and surface temperature. After 2008, other new research hotspots, e.g., “urban landscape pattern”, “urban expansion”, “urban parks”, “spatio-temporal evolution”, “roof greening”, “cooling effect”, “sponge city”, “urban form”, and “spatio-temporal pattern”, emerged. Furthermore, the mitigation measures and influencing factors of the UHI effect were always hot topics in the CNKI database (Figure 5).
In contrast, the relevant research in the WOS database at the early stages was mainly concentrated on the influencing factors of the UHI effect and numerical simulation. However, the interaction between UHI and the surrounding environment has become a hot topic tendency since 2008. Meanwhile, “urbanization”, “mitigation measures” and “the impact of UHI effect” were paid more attention in the field of UHI research, and have been continuously studied until now (Figure 6).

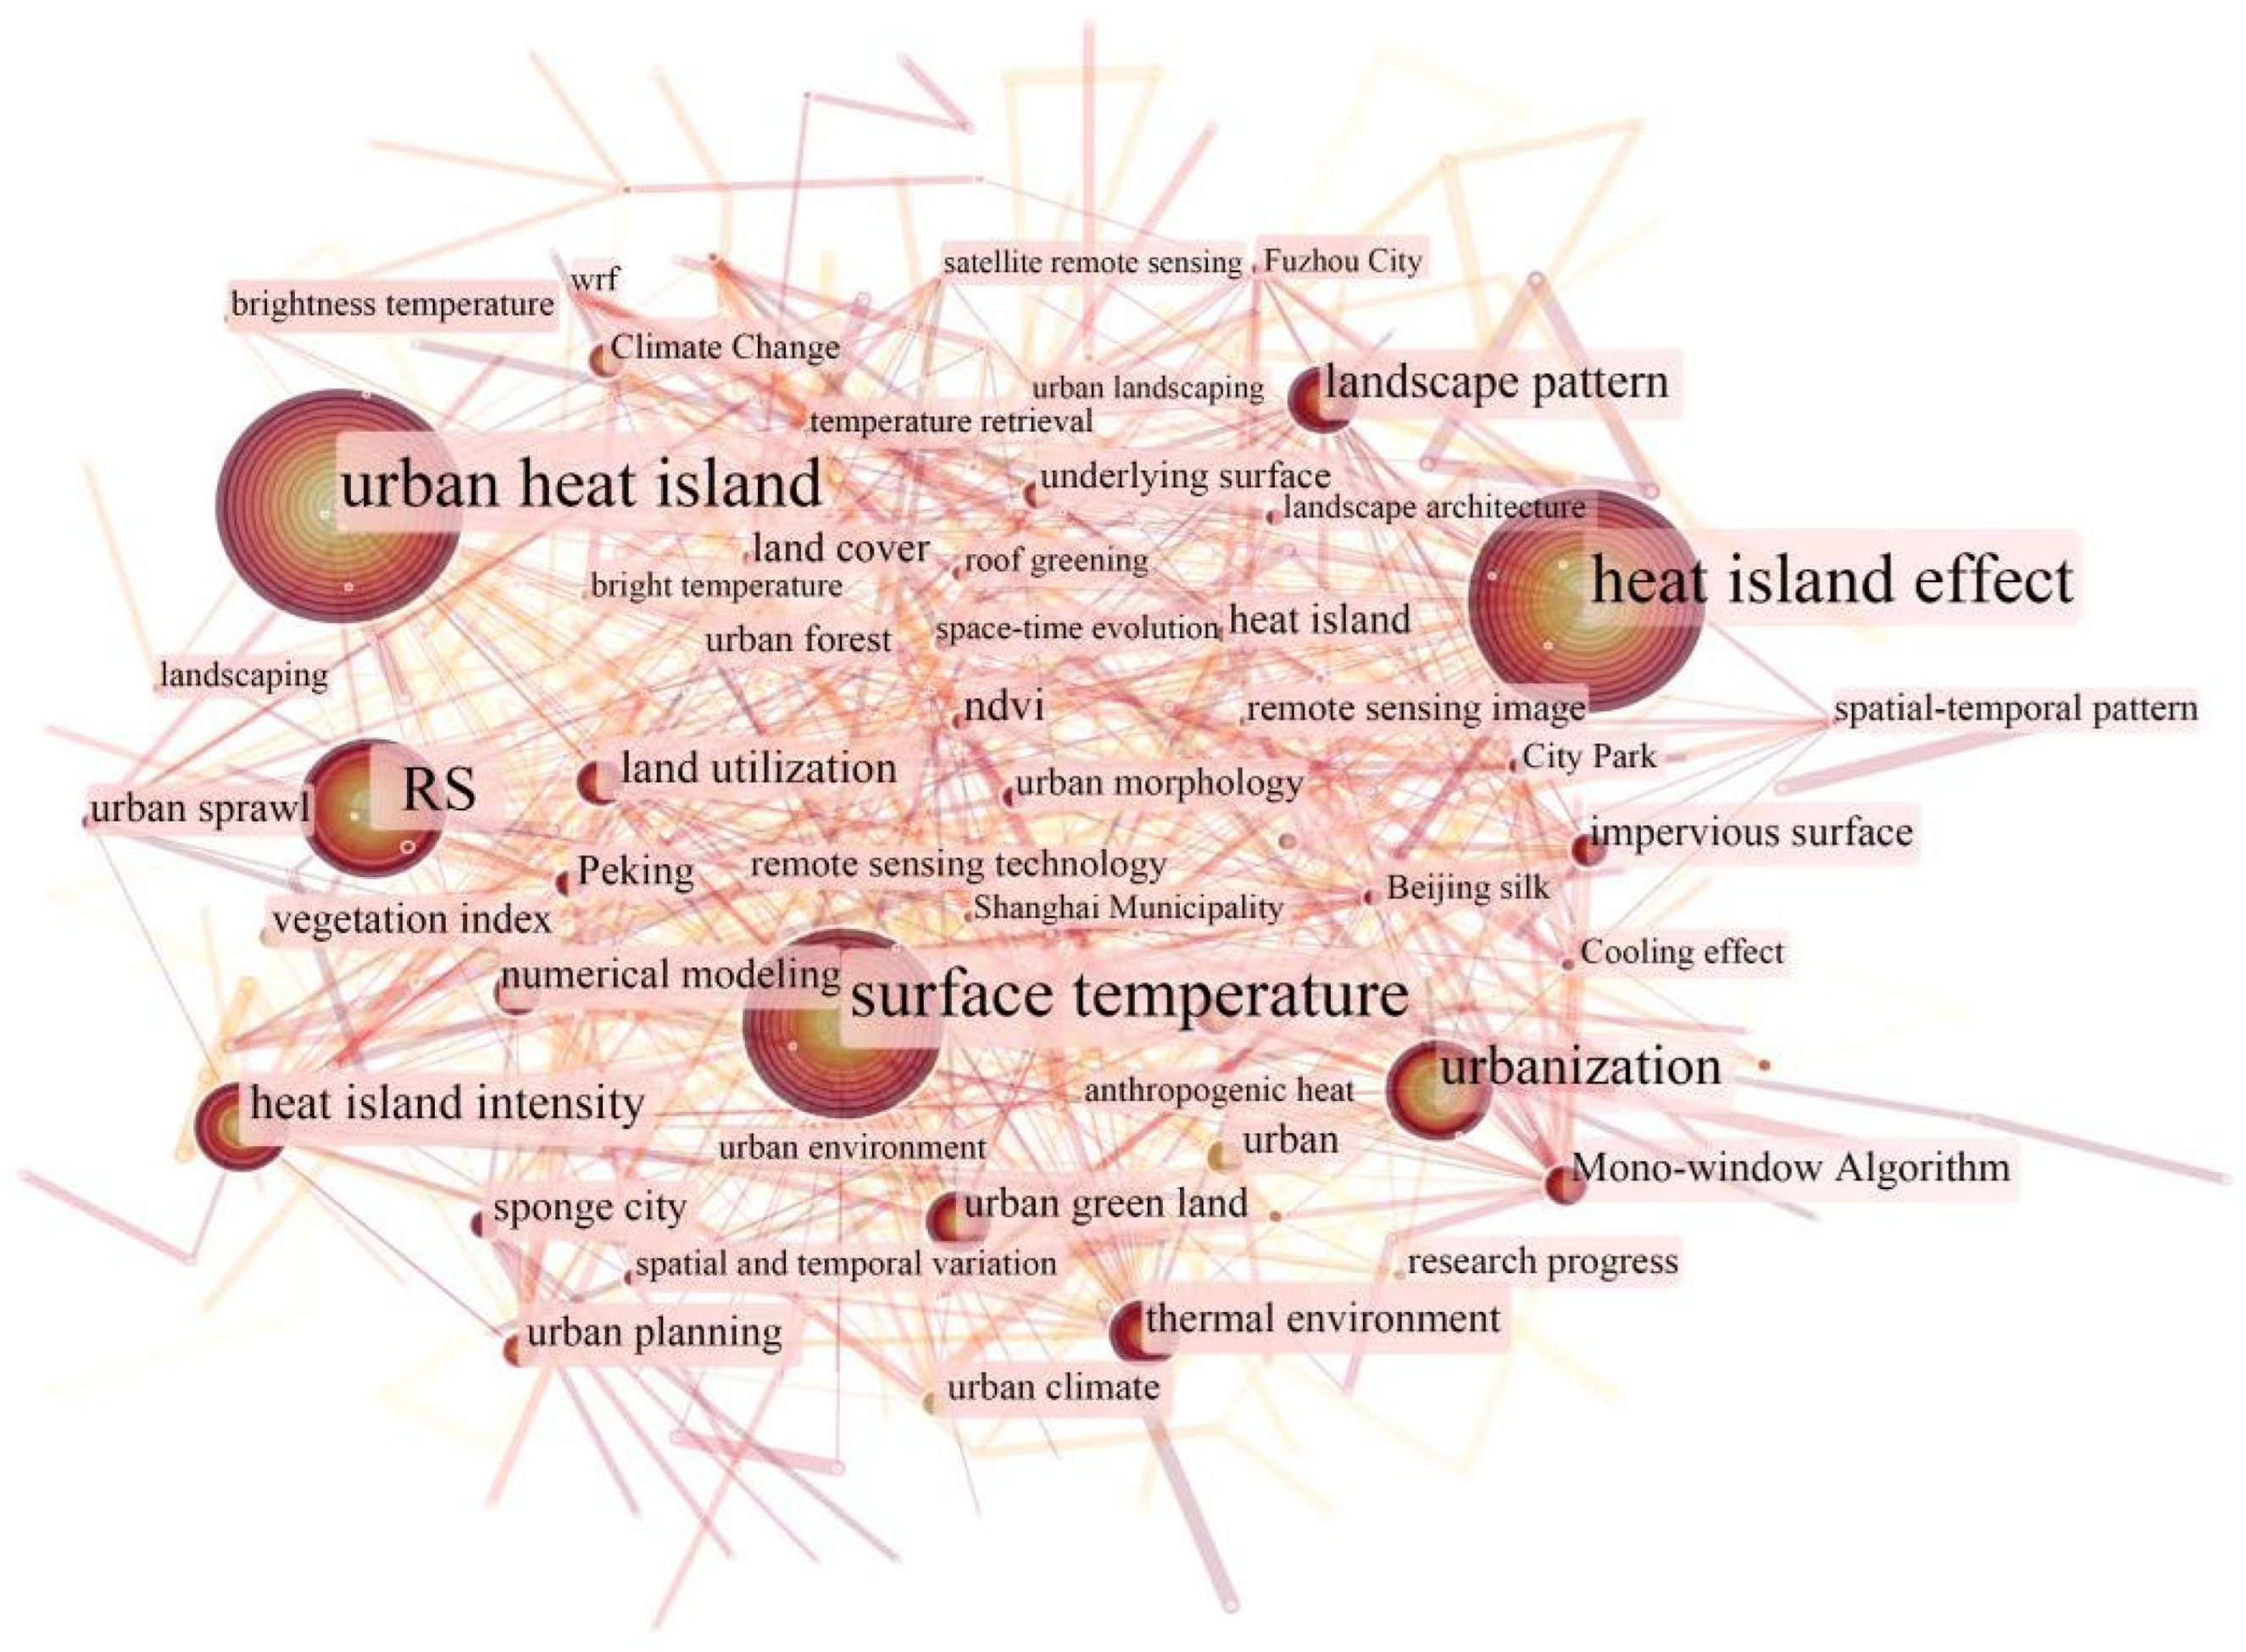
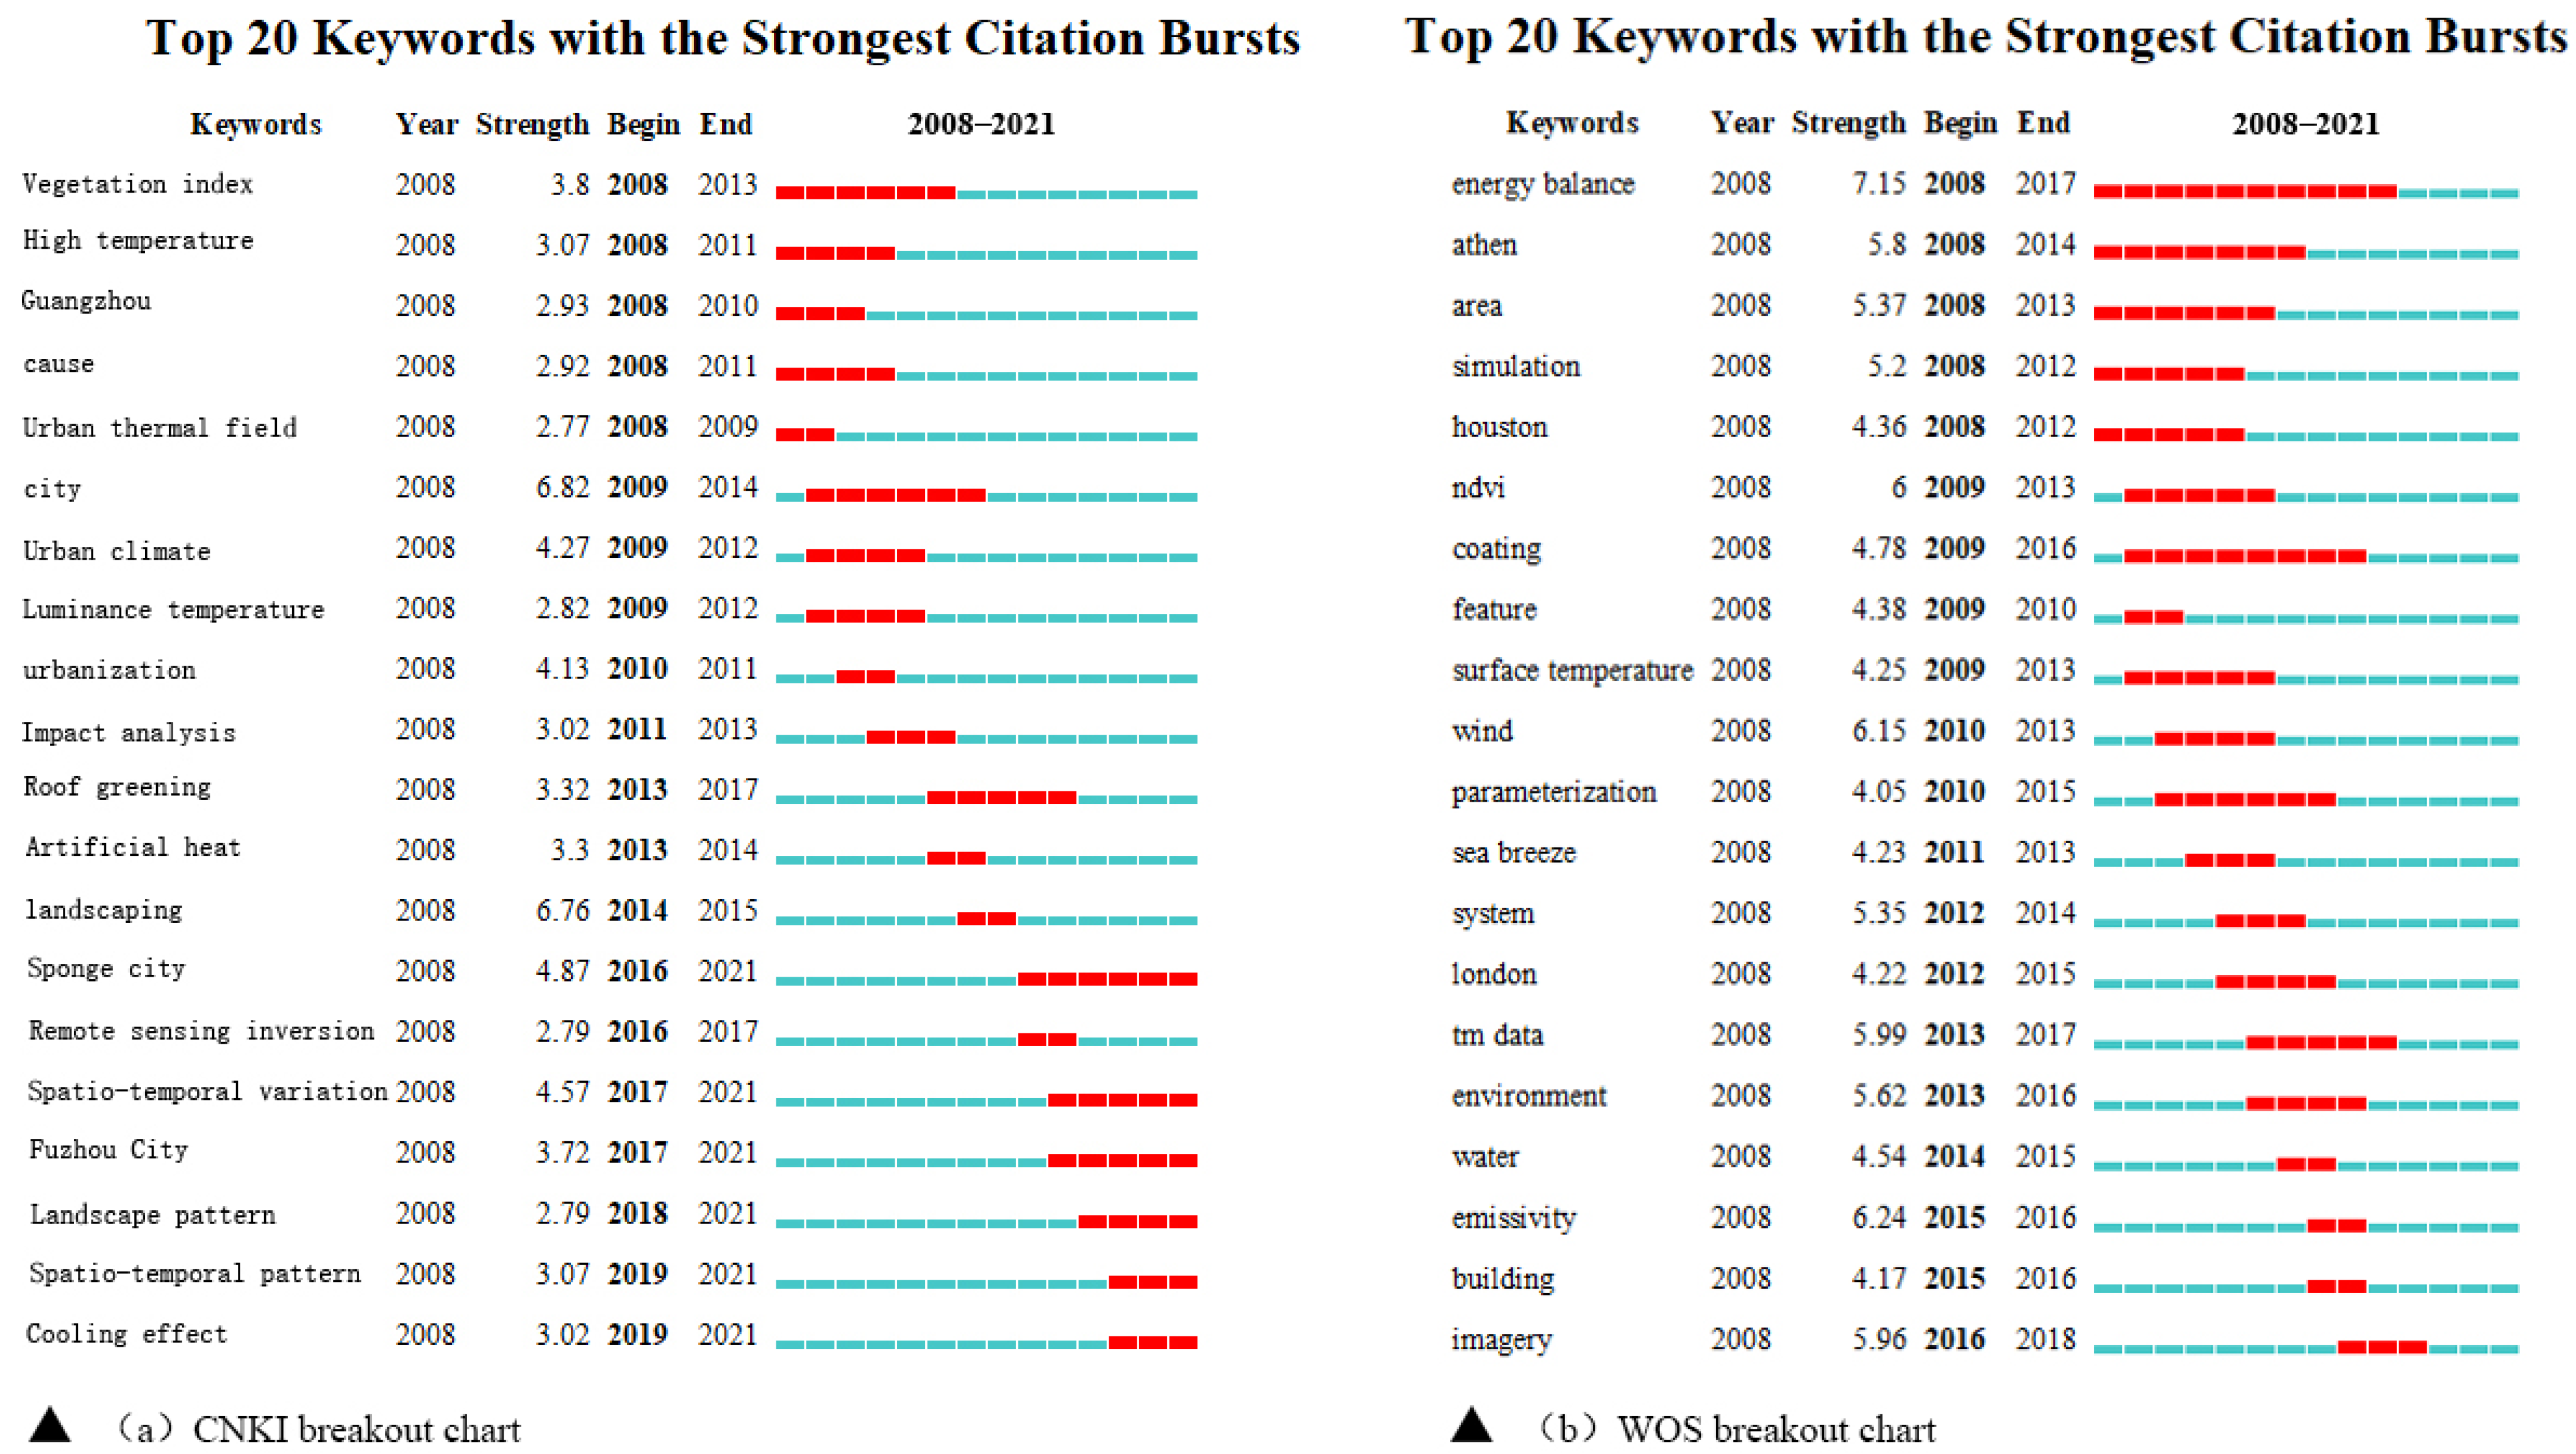
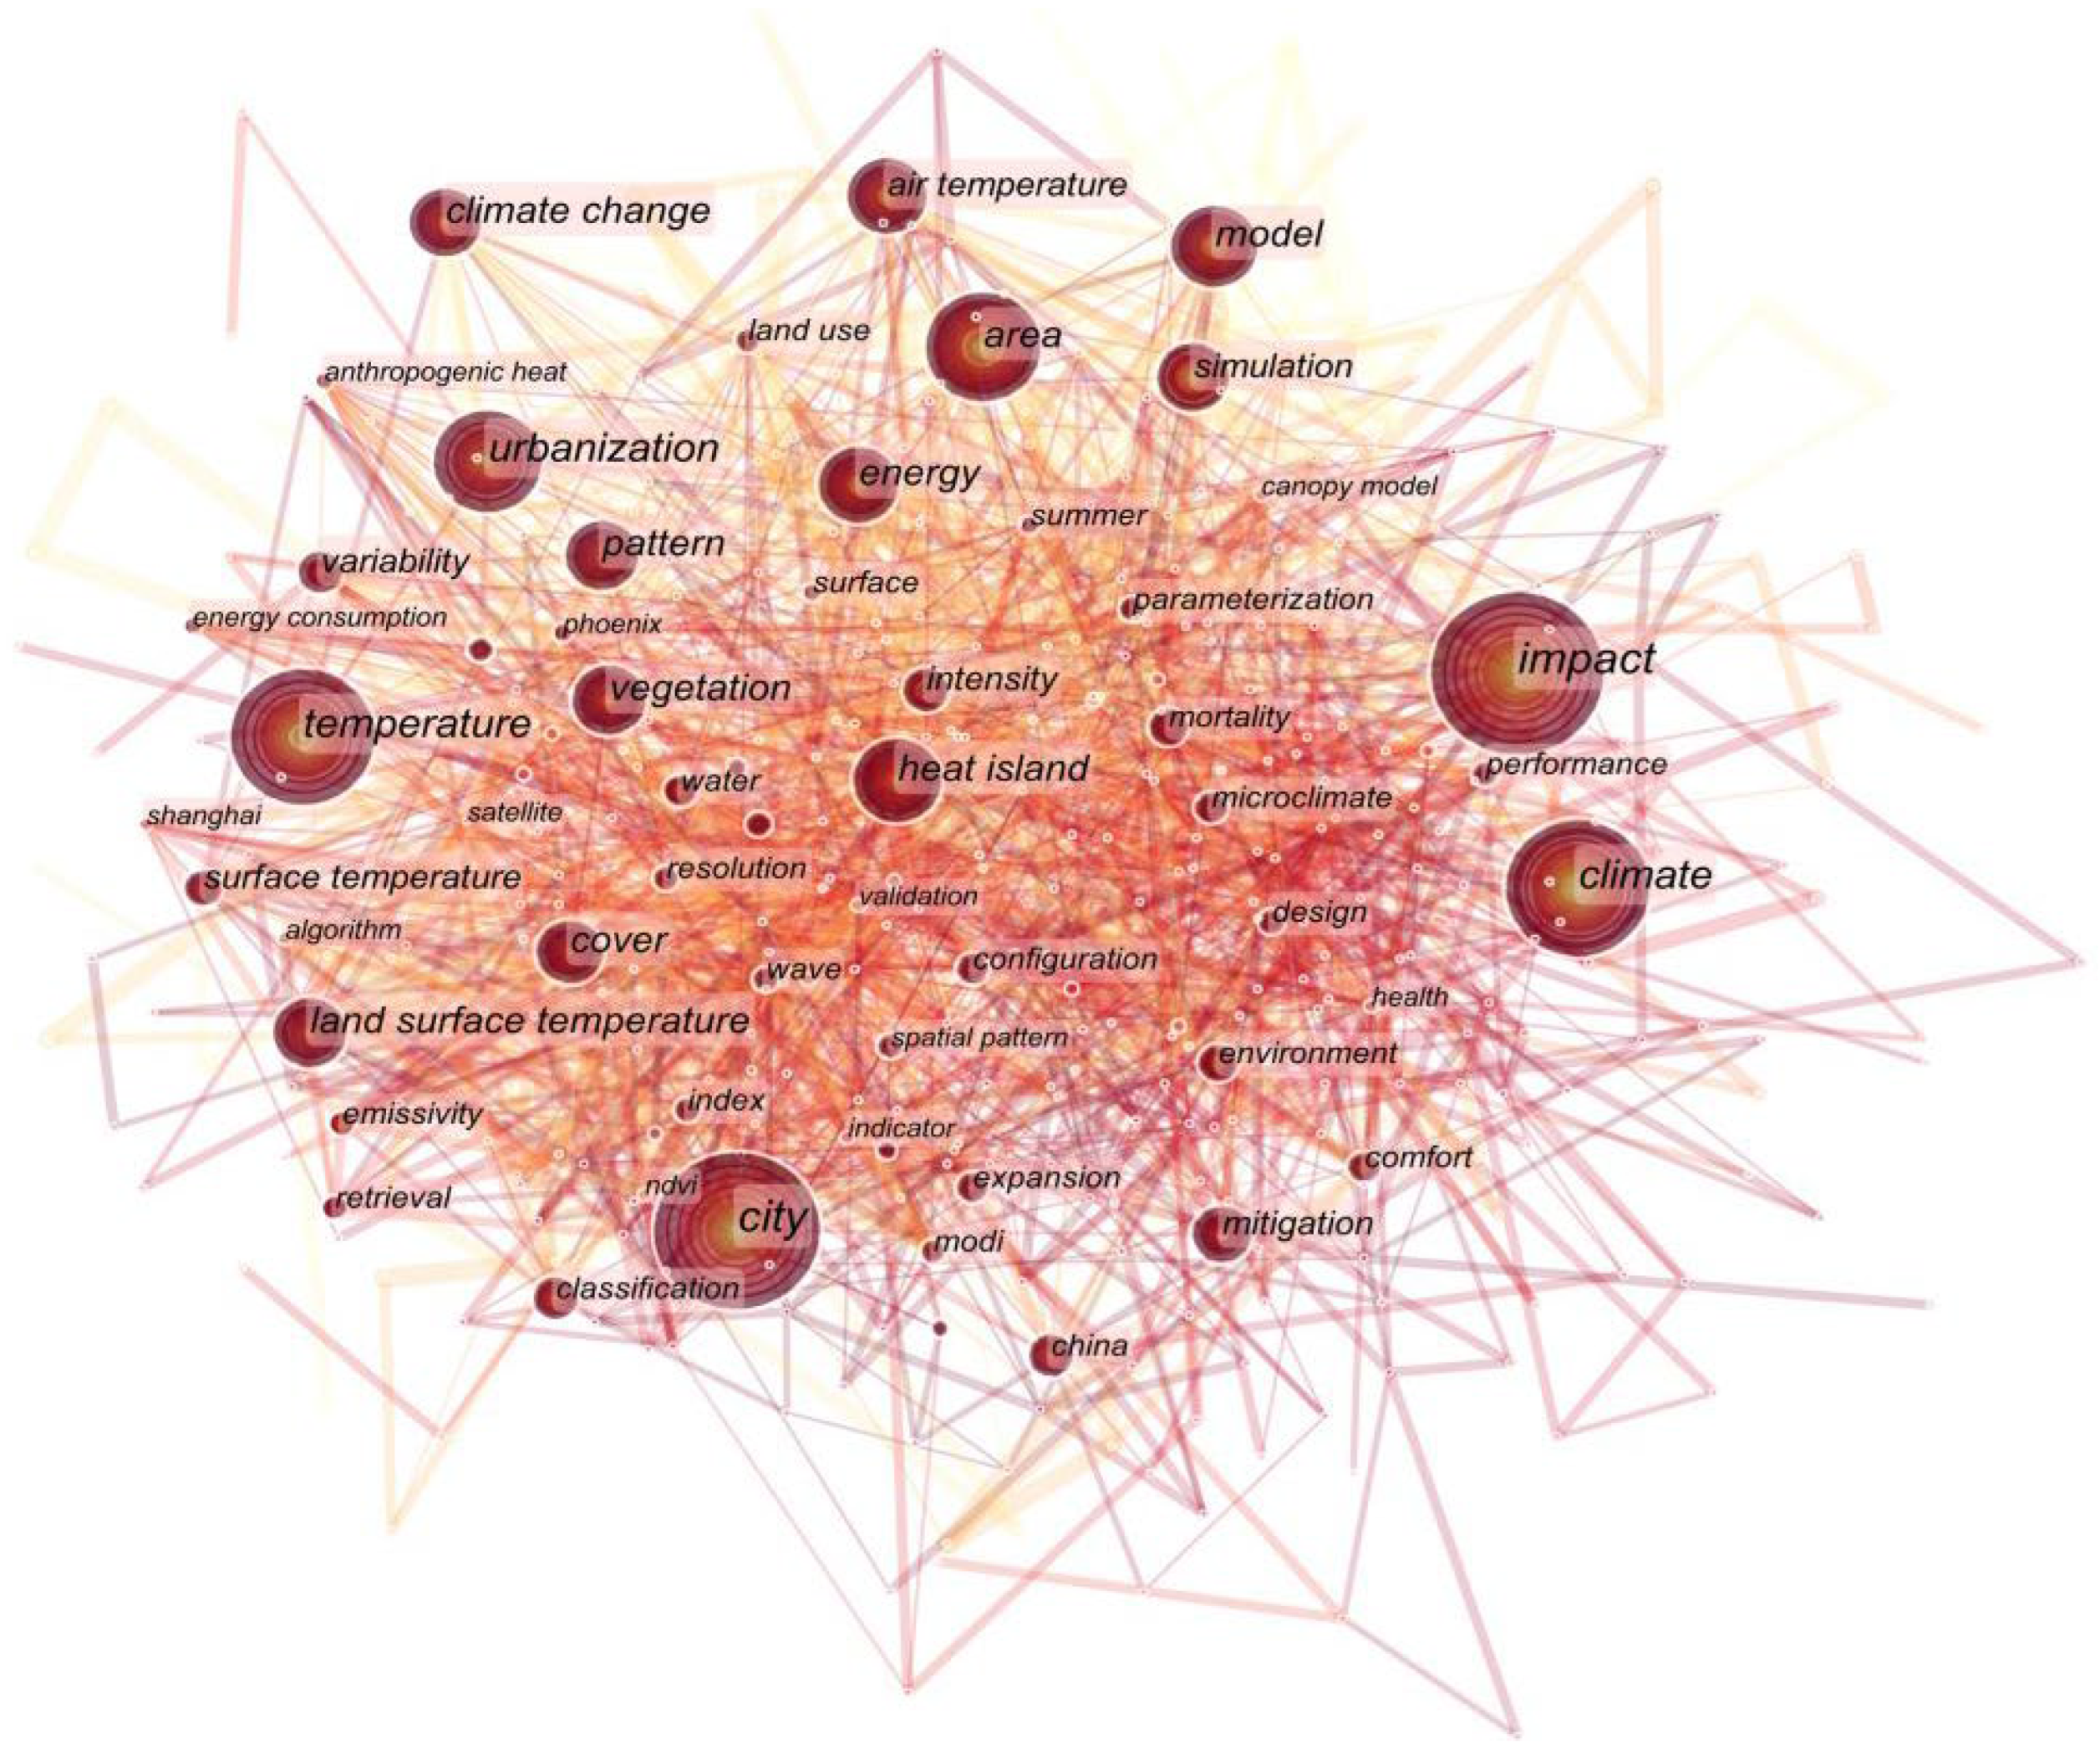
3.6. Keyword Co-Occurrence and Emergent Analysis

Keywords condensed the main research content of this paper, and a keyword co-occurrence atlas reflected the research hotspots in the field of UHI [20]. The high-frequency keywords for UHI in the CNKI and WOS databases had certain similarities, but also varied across different periods. For the CNKI database, the keywords “urban heat island”, “heat island effect”, and “surface temperature” appeared most frequently, with 468, 395, and 339 instances of co-occurrence, respectively. In addition, the keywords with higher frequencies of co-occurrence, i.e., more than 25, included “landscape pattern”, “remote sensing”, “heat island intensity”, “urban green space”, “numerical simulation”, “land use”, “impervious water surface”, “urban planning”, “NDVI”, “sponge city”, “single window algorithm”, etc., and these keywords were closely connected with each other (Figure 7). Furthermore, several keywords (i.e., “vegetation index”, “city”, “roof greening”, and “brightness temperature”) experienced a long duration (3–5 years), and “sponge city”, “spatio-temporal change”, “landscape pattern”, “spatio-temporal pattern”, and “cooling effect” were continuous research hotspots in the field of UHI in recent years (Figure 8a). In contrast, “impact”, “city”, and “temperature” were the most frequently used keywords in the WOS database, with 637, 513, and 360, respectively. “Urbanization”, “heat island”, “model”, “vegetation”, “land surface temperature”, “climate change”, “pattern”, “cover”, “simulation”, “intensity”, and “mitigation” were the higher-frequency keywords with more than 100 instances of co-occurrence, and “energy balance” appeared in UHI research for the longest period of time (9 years) (Figure 9). Moreover, the change rate of emergent keywords in WOS was fast; the impact of the urban heat island effect and urban climate change were the research hotspots around 2008, while urban heat island mitigation measures were the continuous research hotspot from 2010 on (Figure 8b).

3.7. Research Frontier of Key Issues

Based on the keyword co-occurrence and time zone distributions of the UHI studies in the WOS and CNKI databases, combined with the frequently cited literature analysis, the hot topics in UHI research between 2008 and 2021 were mainly focused on three key issues, i.e., influencing factors of urban heat islands, urban heat island mitigation measures, and urban heat island research methods.

3.7.1. Influencing Factors of Urban Heat Islands

UHIs are affected by various complex natural and human factors. Numerous studies have been conducted to reveal the influencing factors of UHI in different regions through various perspectives, and have noted that the impact factors included the urban underlying surface [46], man-made thermal emissions [47], urban green space scale [48], remote sensing spectral index [49], land use [50,51,52], urban form [53,54], etc. However, the UHI effect might be influenced not only by these conventional factors, but also by more complex factors. For example, Chen et al. [55] found that the night LSTs were closely related to socio-economic and topographic factors. Xiong and Zhang [56] pointed out that landscape pattern, urban construction intensity, and topography were the dominate factors affecting the spatial pattern of the urban thermal environment and identified that human factors have a greater role in promoting the UHI effect than natural factors do. Xiong et al. [57] found that the relationship between the soil brightness index (NDSI), normalized built-up index (NDBI), night illumination (NL), and the relative effect strength of UHI was significantly non-stationary in space. Gao et al. [58] confirmed that the impervious surface ratio (ISR) and building density (BD) rank of the urban form characterizes an enhanced UHI effect, while the green land rate (GR) was the key factor in the formation of cold islands in dense urban areas. Until now, the vast majority of studies on the influencing factors of UHI have mainly been focused on a single factor, especially for the impact of urban green space on the UHI effect. Meanwhile, in the current research on the influencing factors of the urban heat island effect, more attention is paid to factors related to the city itself, while the influences of some external factors are ignored, such as changes in policies, the influence of the surrounding environment, etc. [59].

3.7.2. Urban Heat Island Mitigation Measures

The UHI effect has a significant negative influence on the urban environment and its residents. In the context of unstoppable urbanization, mitigating the UHI effect has a vitally important role in sustainable urban development [60]. With the deterioration of the urban thermal environment, it is urgent to explore more effective UHI mitigation measures to alleviate its impact on the environment and city residents [61]. Several studies have explored mitigation strategies for UHI, such as reducing man-made heat emissions [62,63,64], increasing urban green space and green infrastructure [65], increasing the water area [66], improving underlying surface materials [67,68], building high-albedo roofs and roads [69,70], urban planning [71], building green ecological roofs [72,73], etc. For example, Bustami et al. [74] found that the continuous density and spread degree of urban development spaces were both key factors affecting the UHI effect, and maintained that urban continuity and more incongruous urban forms should be considered when designing mitigation strategies. Wu et al. [75] identified that urban blue infrastructure (UBI) could alleviate the UHI effect, and that the cooling effect of UBI is affected by its size and shape. Nuruzzaman [76] confirmed that green vegetation is the most effective measure. However, other studies have found that the number of green spaces was not the only standard to evaluate the temperature mitigation [77]; the spatial configuration of vegetation patches was also important for alleviating the UHI effect. For example, Kowe et al. [78] revealed that the cooling degree of clustered vegetation was more effective than that of scattered and broken vegetation patterns, and the variance in the complexity of the vegetation patch density, shape, and size led to different cooling effects. In general, the research on the mitigation measures for UHI was mainly focused on land use, water, green infrastructure, buildings, and energy [79]. However, although a large number of mitigation measures were developed to mitigate the UHI effect in various regions and on various scales, not every mitigation measure was universally applied to all scenarios. For example, improving the advantages of the cooling effects of urban landscapes (e.g., green spaces and water bodies) to mitigate UHI for some special regions might be a more suitable strategy than others, except for minimizing anthropogenic heat emissions [80]. In addition, the regulating effect of green spaces and water bodies on air temperature has a threshold, which means that the areas of green space and water bodies cannot be increased limitlessly. Only the landscape within the threshold range would exert the maximum regulating function for air temperature [81]. Therefore, there is a tendency for pay more attention to exploring the impact of the urban landscape pattern and vegetation patch spatial pattern on mitigating the UHI effect in future studies.

3.7.3. Urban Heat Island Research Methods

The traditional observation method, remote sensing monitoring, and boundary layer numerical model simulation were the three major methods for monitoring the UHI. Depending on different monitor conditions, the traditional observation method could be subdivided into three methods, i.e., the meteorological station method, the fixed point observation method, and the flow observation method [82]. In the early stage, the traditional meteorological station observation method, based on the distribution observation and the flow observation meteorological data of meteorological station data in urban and rural areas, was used to study the UHI effect through comparing the urban and rural air temperatures and surface temperatures [30]. Although this method is convenient to obtain data and can be used by meteorological stations or fixed stations over a long period of time, it was unable to reveal spatial distribution information on UHI or to deeply analyze the characteristics of UHI’s layout and internal structure. This was due to either the limited locations and number of meteorological stations, or the restrictions on obtaining information from individual points [83]. Subsequently, with the development of computer technology, the boundary layer numerical model simulation method gradually matured. This method was able to obtain higher space resolution results to explore the spatial–temporal changes and the physical formation process involved in UHI, as well as to offset the inadequacy of traditional observation research at spatial locations [59,83,84]. To date, the most widely used boundary layer numerical models include MM5, WRF, and RAMS [85]. Several studies were conducted to simulate the UHI effect by adopting these models. For example, Diaz et al. [86] used the WRF model to explore its potential to provide a high-resolution vertical profile for thermal infrared remote sensing inversion of LST; Ilhamsyah [87] simulated the urban heat island effect in Jakarta, Indonesia, using the MM5 model; and Cantelli et al. [88] coupled a subgrid town energy budget (STEB) with the RAMS model to simulate the urban heat island over Rome, Italy.
Furthermore, due to the advantages of temperature field monitoring in a large area, including the wide coverage, low acquisition cost, and short time to acquire remote sensing technology [30], the remote sensing monitoring method has played an vital role in UHI research and has become a fundamental method for obtaining and analyzing UHI information [89]. Numerous scholars have adopted the remote sensing method and its data to assess the UHI effects around the world. For example, Ezimand et al. [90] analyzed the influence of two-dimensional and three-dimensional urban structures on LST changes in the Tatu region of Estonia by using remote sensing data. Moazzam et al. [91] used remote sensing data to explore the impact of urbanization on the land surface temperature and surface urban heat island in Jeju Island, Republic of Korea. Xue et al. [92] quantitatively studied the spatial patterns of urban heat islands and the associated cooling effect of blue-green landscapes with multi-source remote sensing data. In addition, according to different monitoring technologies, the remote sensing monitoring method could be subdivided into three heat island monitoring methods based on temperature, vegetation index, and thermal landscape, respectively. Among these, the temperature-based heat island monitoring method is the most intuitive [93]. In this context, several scholars have developed a variety of LST inversion algorithms based on satellite data, such as the atmospheric correction method, single-channel algorithm, split-window algorithm, and mono-window algorithm [7,94]. Wang et al. [95] used the atmospheric correction method to invert LST and identified the quantitative influence of configuration and morphological characteristics on the cooling effect of different urban park scales in Shanghai. Adeniran et al. [96] adopted the mono-window algorithm and split-window algorithm to conduct a comparative study of different LST images of different satellites in Hong Kong, China. Guha and Govil [97] applied the mono-window algorithm to invert the LST of Raipur City, India, and studied the relationship between LST and six remote sensing indices (i.e., MNDWI, NDBaI, NDBI, NDVI, NDWI, and NMDI). Although scholars have proposed many temperature inversion algorithms according to the characteristics of various thermal infrared remote sensing data, different inversion methods are suitable for different remote sensing data [98]. Some studies have shown that the surface radiation transfer model is suitable for surface temperature inversion of various thermal infrared remote sensing data, but its application is limited due to the large number of surface parameters required, and it is believed that the more universal inversion algorithms include the universal mono-window algorithm, split-window algorithm, multi-band regression method, etc. [99,100]. Although the aforementioned commonly used algorithms have been widely used both on land and at sea in different regions, and have become the basics of land surface temperature research, in general, the academic circle generally believes that the current land surface temperature inversion algorithm is more mature, and that the best applicability and inversion accuracy belong to the split-window algorithm [101]. For example, Yao et al. [101] compared the advantages and disadvantages of the different remote sensing inversion algorithms and pointed out that the split-window algorithm was a relatively mature algorithm for LST inversion due to its better applicability and inversion accuracy.
Some studies have indicated that the satellite remote sensing data commonly used in UHI research mainly include AVHRR, MODIS, TM/ETM+, ASTER, etc. [98]. AVHRR and TM/ETM+ were commonly used types of remote sensing data for UHI research before 2000. After 2000, with the launch of the TERRA/AQUA satellite, ASTER and MODIS data were increasingly used for their high spatial resolution, while TM/ETM+ data were still widely used for due to their free access and high resolution [100]. For example, Chen et al. [102] studied the differences in the UHIs and their driving factors between downtown and new urban areas of Wuhan from 2001 to 2018 based on MODIS data. Gu et al. [103] studied the temporal and spatial distribution characteristics of UHI in Nantong City based on TM/ETM + remote sensing images in 2001 and 2005. Wen et al. [104] studied the UHI problem of the Guangzhou metropolis in Guangdong Province of China based on ETM+/TM images. Yao et al. [105] studied the relationships among impervious water surface (ISA) dynamics; forest cover increases; and LST and SUHII changes in the Beijing plain area during 2009–2018 based on 8 scenes of Landsat 5 TM/7ETM/8OLI images, 920 scenes of EOS-Aqua-MODIS LST images, and other data/information collected by different approaches.

4. Discussion

The research on the UHI effect has always been a hot topic for urban ecological and environmental issues. With the increasing impact of population growth, rapid urbanization, and global climate change on the urban ecological environment, more and more scholars and policy makers have begun to pay attention to the issues related to UHI. At present, remarkable achievements have been made in the development of UHI research in terms of theory, method, content, and case studies. Based on our analysis, we propose the following directions for future research:
The defects of the existing traditional monitoring methods for quantitative inversion of LST include, e.g., the insufficient number of site observations, small application scope of fixed-point observation, inability of mobile observation to carry out temperature monitoring at the same time, low temporal resolution of remote sensing monitoring, and weather influence. More suitable and accurate monitoring methods should be developed to ensure objective and comprehensive analysis of the LST inversion results, and to reduce the mistakes and deficiency in the monitoring process based on different scales and purposes.
With the development of global urbanization, the UHI effect is no longer limited to influencing a single city; the interaction between cities has led UHI issues to become a common problem faced by all cities [106]. Some studies have been carried out regarding UHIs’ effects on urban agglomeration, e.g., 218 cities in China [107], Fujian Triangle urban agglomeration [108], and Guangdong–Hong Kong–Macao Greater Bay Area [109]. Most of studies on UHI are still conducted on the small scale of a single city, or the local scale. Therefore, it is necessary to conduct and strengthen the comprehensive research on the UHI effect at a larger spatial scale (i.e., urban agglomeration scale) in the future.
The intensification of rapid urbanization has not only led to the continuous expansion of the urban form in the horizontal direction, but has also caused dramatical changes in the vertical direction. The architectural landscape could greatly affect the UHI in three-dimensional space by changing the energy flow between the surface, the building surface, and the lower atmosphere [110]. Research on UHI in the three-dimensional space has attracted widespread attention in recent years. However, the quantitative description of three-dimensional urban space and its relationship with UHI effect lacks systematic and in-depth exploration at present. Therefore, question of how to quantify three-dimensional urban spatial morphology and structure and its impact on the UHI effect might be a major research hotspot in future studies. Furthermore, apart from for the architectural landscape, the vegetation landscape has been confirmed to be an effective measure to mitigate the UHI effect. Its proper landscape composition, spatial configuration, and materials have a great impact on UHI at the local scale [111]. Therefore, more attention should be paid to the study of the mitigative effect of the vegetation landscape on UHI, especially regarding the vegetation landscape’s structure and configuration pattern.
The UHI effect is a complex and severe urban ecological environment problem which involves many disciplines, such as meteorology, architecture, ecology, urban and rural planning, landscape architecture, environmental science, resource utilization, etc. Benefitted by the rapid development of research on the UHI effect in recent decades, such research has become a multidisciplinary comprehensive field. However, with the increasing attention being paid to human health and the urgent need for urban sustainable development and ecological civilization construction, the research on the UHI effect should pay more attention to the cross-research with other disciplines. This would strengthen the integration of theories and technologies inter-disciplinarily, especially in medicine, geography, and other disciplines, and would introduce the theories or methods of other disciplines (e.g., ant colony algorithm, recurrent neural network model, etc.) to promote in-depth development of the research on the UHI effect.

5. Conclusions

In this study, we analyzed a large number of publications in the field of UHI research from 1980 to 2021. We emphatically reviewed the academic achievements and progress in this field during the rapid development period (2008–2021) using Cite Space software, based on the WOS and CNKI databases. Through a comprehensive analysis of the literature to explore the current state of UHI research, and of the literature citations, cooperation networks, and hot topics, we identified that the research on UHI has existed in a flourishing period since 2008 with the rapidly rising number of publications. Relevant institutions and scholars from 85 countries have carried out UHI research, among which Chinese scholars and institutions are the major contributors in this field. Research has formed a tendency of interdisciplinary integration, involving environmental sciences, meteorology atmospheric sciences, remote sensing, resource utilization, building science and engineering, etc. The research mainly focused on the influencing factors, mitigation measures, and quantitative inversion of UHI. The present study represents a more comprehensive analysis of the development process of UHI research and reviews this hot topic’s evolution and main progress, providing support for more scientific studies on the UHI effect and the research foundation in the field of UHI for scholars.

Author Contributions

Y.L.: conceptualization, data curation, formal analysis, methodology, software, visualization, writing—original draft. Z.W.: conceptualization, methodology, visualization, writing—original draft. All authors have read and agreed to the published version of the manuscript.

Funding

This work was supported by the National Nature Science Foundation of China (NSFC) project (grant number [42061039]); the Cultivation Project of Guizhou University (grant number [(2020)46]); and the Construction Program of Biology First-class Discipline in Guizhou (grant number [GNYL (2017)009]).

Data Availability Statement

Not applicable.

Conflicts of Interest

The authors state that there is no known competing financial interest or personal relationship in this article that might influence the work reported here.

References

  1. Chen, L.; Jing, Y.; Sun, R. Urban eco-security pattern construction:targets, principles and basic framework. Acta Ecol. Sin. 2018, 38, 4101–4108. [Google Scholar] [CrossRef]
  2. Wu, Y.; Shan, Y.; Lai, Y.; Zhou, S. Method of calculating land surface temperatures based on the low-altitude UAV thermal infrared remote sensing data and the near-ground meteorological data. Sustain. Cities Soc. 2022, 78, 103615. [Google Scholar] [CrossRef]
  3. Xin, J.; Yang, J.; Wang, L.-E.; Jin, C.; Xiao, X.; Xia, J. Seasonal differences in the dominant factors of surface urban heat islands along the urban-rural gradient. Front. Environ. Sci. 2022, 10, 1681. [Google Scholar] [CrossRef]
  4. Howard, L. Climate of London Deduced from Metrological Observations, 3rd ed.; Harvey and Darton Press: London, UK, 1833; Volume 1. [Google Scholar]
  5. Yuan, R.; Huang, F.; Tang, S. Review of urban heat island effect. Territ. Nat. Resour. Study 2019, 1, 11–12. [Google Scholar] [CrossRef]
  6. Pan, Y.; Cui, L.-l.; Liu, C.; Chen, L.; Zhang, L. Spatiotemporal distribution of urban heat island effect based on MODIS data in Chongqing, China. Chin. J. Ecol. 2018, 37, 3736–3745. [Google Scholar] [CrossRef]
  7. Wan, J.; Zhu, M.; Ding, W. Accuracy Evaluation and Parameter Analysis of Land Surface Temperature Inversion Algorithm for Landsat-8 Data. Adv. Meteorol. 2021, 2021, 9917145. [Google Scholar] [CrossRef]
  8. Kumari, B.; Tayyab, M.; Ahmed, I.A.; Baig, M.R.I.; Khan, M.F.; Rahman, A. Longitudinal study of land surface temperature (LST) using mono- and split-window algorithms and its relationship with NDVI and NDBI over selected metro cities of India. Arab. J. Geosci. 2020, 13, 1040. [Google Scholar] [CrossRef]
  9. Mustafa, E.K.; Co, Y.; Liu, G.; Kaloop, M.R.; Beshr, A.A.; Zarzoura, F.; Sadek, M. Study for predicting land surface temperature (lst) using landsat data: A comparison of four algorithms. Adv. Civ. Eng. 2020, 2020, 7363546. [Google Scholar] [CrossRef]
  10. Yan, Y.; Sun, Y.; Tian, P.; Li, J. Spatio-temporal variation of economic drivers of urban heat island effect in yangtze river delta. Front. Mar. Sci. 2022, 9, 475. [Google Scholar] [CrossRef]
  11. Suomi, J.; Meretoja, M. Trends and irregular variation of spatial temperature differences in the high-latitude coastal city of Turku, Finland. Clim. Res. 2021, 84, 41–57. [Google Scholar] [CrossRef]
  12. Wang, Y.; Berardi, U.; Akbari, H. Comparing the effects of urban heat island mitigation strategies for Toronto, Canada. Energy Build. 2016, 114, 2–19. [Google Scholar] [CrossRef]
  13. Zhou, B.; Rybski, D.; Kropp, J.P. The role of city size and urban form in the surface urban heat island. Sci. Rep. 2017, 7, 4791. [Google Scholar] [CrossRef] [PubMed]
  14. Huang, X.; Wang, Y. Investigating the effects of 3D urban morphology on the surface urban heat island effect in urban functional zones by using high-resolution remote sensing data: A case study of Wuhan, Central China. ISPRS J. Photogramm. Remote. Sens. 2019, 152, 119–131. [Google Scholar] [CrossRef]
  15. Li, J.; Mao, Y.; Ouyang, J.; Zheng, S. A Review of Urban Microclimate Research Based on CiteSpace and VOSviewer Analysis. Int. J. Environ. Res. Public Health 2022, 19, 4741. [Google Scholar] [CrossRef]
  16. Zhou, Y.; An, N.; Yao, J. Characteristics, Progress and Trends of Urban Microclimate Research: A Systematic Literature Review and Bibliometric Analysis. Buildings 2022, 12, 877. [Google Scholar] [CrossRef]
  17. Xu, H.; Lin, X.; Shi, K.; Lin, S.; Zheng, G.; Wang, Q.; Dong, J.; Wang, M. Research Progress and Hotspot Evolution Analysis of Landscape Microclimate: Visual Analysis Based on CNKI and WOS. Int. J. Environ. Res. Public Health 2022, 19, 15118. [Google Scholar] [CrossRef]
  18. Guindon, S.-M.; Nirupama, N. Reducting risk from urban heat island effects in cities. Nat. Hazards 2015, 77, 823–831. [Google Scholar] [CrossRef]
  19. Lee, I.; Voogt, J.A.; Gillespie, T.J. Analysis and comparison of shading strategies to increase human thermal comfort in urban areas. Atmosphere 2018, 9, 91. [Google Scholar] [CrossRef]
  20. Mohajerani, A.; Bakaric, J.; Jeffrey-Bailey, T. The urban heat island effect, its causes, and mitigation, with reference to the thermal properties of asphalt concrete. J. Environ. Manag. 2017, 197, 522–538. [Google Scholar] [CrossRef]
  21. Shao, H.; Kim, G. A Comprehensive Review of Different Types of Green Infrastructure to Mitigate Urban Heat Islands: Progress, Functions, and Benefits. Land 2022, 11, 1792. [Google Scholar] [CrossRef]
  22. Chen, C. Searching for intellectual turning points: Progressive knowledge domain visualization. Proc. Natl. Acad. Sci. USA 2004, 101 (Suppl. S1), 5303–5310. [Google Scholar] [CrossRef]
  23. Chen, C. CiteSpace II: Detecting and visualizing emerging trends and transient patterns in scientific literature. J. Am. Soc. Inf. Sci. Technol. 2006, 57, 359–377. [Google Scholar] [CrossRef]
  24. Hu, Z.; Sun, J.; Wu, Y. Knowledge Map analysis of Heat wave Research based on CiteSpace. Libr. Inf. Serv. 2013, 57, 131–137, 184. [Google Scholar] [CrossRef]
  25. Lian, X.; Liu, X. Progress in urban heat island research and hotspot analysis based on CiteSpace analysis. Sichuan Archit. 2021, 41, 20–23. [Google Scholar]
  26. Chen, L.; Sun, R.; Liu, H. Eco-environmental effects of urban landscape pattern changes: Progresses, problems, and perspectives. Acta Ecol. Sin. 2013, 33, 1042–1050. [Google Scholar] [CrossRef]
  27. Xu, H. A remote sensing urban ecological index and its application. Acta Ecol. Sin. 2013, 33, 7853–7862. [Google Scholar]
  28. Xu, H. Quantitative analysis on the relationship of urban impervious surface with other components of the urban ecosystem. Acta Ecol. Sin. 2009, 29, 2456–2462. [Google Scholar]
  29. Xu, H. Analysis on urban heat island effect based on the dynamics of urban surface biophysical descriptors. Acta Ecol. Sin. 2011, 31, 3890–3901. [Google Scholar]
  30. Peng, B.; Shi, Y.; Wang, H.; Wang, Y. The impacting mechanism and laws of function of urban heat islands effect: A case study of Shanghai. Acta Geogr. Sin. 2013, 68, 1461–1471. [Google Scholar] [CrossRef]
  31. Su, Y.; Huang, G.; Chen, X.; Chen, S. The cooling effect of Guangzhou City parks to surrounding environments. Acta Ecol. Sin. 2010, 30, 4905–4918. [Google Scholar]
  32. Sun, J.; Yang, B. Meso-β Scale Torrential Rain Affected by Topography and the Urban Circulation. Chin. J. Atmos. Sci. 2008, 6, 1352–1364. [Google Scholar]
  33. Chen, S.; Wang, T. Comparison Analyses of Equal Interval Method and Mean-standard Deviation Method Used to Delimitate Urban Heat Island. Geo-Inf. Sci. 2009, 11, 145–150. [Google Scholar] [CrossRef]
  34. Imhoff, M.L.; Zhang, P.; Wolfe, R.E.; Bounoua, L. Remote sensing of the urban heat island effect across biomes in the continental USA. Remote Sens. Environ. 2010, 114, 504–513. [Google Scholar] [CrossRef]
  35. Li, J.; Song, C.; Cao, L.; Zhu, F.; Meng, X.; Wu, J. Impacts of landscape structure on surface urban heat islands: A case study of Shanghai, China. Remote Sens. Environ. 2011, 115, 3249–3263. [Google Scholar] [CrossRef]
  36. Zhao, L.; Lee, X.; Smith, R.B.; Oleson, K. Strong contributions of local background climate to urban heat islands. Nature 2014, 511, 216–219. [Google Scholar] [CrossRef] [PubMed]
  37. Santamouris, M. Cooling the cities—A review of reflective and green roof mitigation technologies to fight heat island and improve comfort in urban environments. Sol. Energy 2014, 103, 682–703. [Google Scholar] [CrossRef]
  38. Shou, Y.; Zhang, D. Recent advances in understanding urban heat island effects with some future prospects. Acta Meteorol. Sin. 2012, 70, 338–353. [Google Scholar]
  39. Bai, Y.; Wang, X.-Y.; Jiang, H.; Liu, S. Progress of urban heat island effect. J. Meteorol. Environ. 2013, 29, 101–106. [Google Scholar] [CrossRef]
  40. Peng, S.; Piao, S.; Ciais, P.; Friedlingstein, P.; Ottle, C.; Bréon, F.-M.; Nan, H.; Zhou, L.; Myneni, R.B. Surface Urban Heat Island Across 419 Global Big Cities. Environ. Sci. Technol. 2011, 46, 696–703. [Google Scholar] [CrossRef]
  41. Tan, J.; Zheng, Y.; Tang, X.; Guo, C.; Li, L.; Song, G.; Zhen, X.; Yuan, D.; Kalkstein, A.J.; Li, F.; et al. The urban heat island and its impact on heat waves and human health in Shanghai. Int. J. Biometeorol. 2010, 54, 75–84. [Google Scholar] [CrossRef]
  42. Santamouris, M.; Synnefa, A.; Karlessi, T. Using advanced cool materials in the urban built environment to mitigate heat islands and improve thermal comfort conditions. Sol. Energy 2011, 85, 3085–3102. [Google Scholar] [CrossRef]
  43. Zhou, W.; Huang, G.; Cadenasso, M.L. Does spatial configuration matter? Understanding the effects of land cover pattern on land surface temperature in urban landscapes. Landsc. Urban Plan. 2011, 102, 54–63. [Google Scholar] [CrossRef]
  44. Buyantuyev, A.; Wu, J. Urban heat islands and landscape heterogeneity: Linking spatiotemporal variations in surface temperatures to land-cover and socioeconomic patterns. Landsc. Ecol. 2009, 25, 17–33. [Google Scholar] [CrossRef]
  45. Estoque, R.C.; Murayama, Y.; Myint, S.W. Effects of landscape composition and pattern on land surface temperature: An urban heat island study in the megacities of Southeast Asia. Sci. Total. Environ. 2017, 577, 349–359. [Google Scholar] [CrossRef] [PubMed]
  46. Wang, Y.; Yuan, L. The Variation Law of Different Underlying Surface Temperature and Urban Temperature. In Journal of Physics: Conference Series; IOP Publishing: Bristol, UK, 2019; Volume 1302, p. 042026. [Google Scholar] [CrossRef]
  47. Xu, D.; Zhou, D.; Wang, Y.; Meng, X.; Gu, Z.; Yang, Y. Temporal and spatial heterogeneity research of urban anthropogenic heat emissions based on multi-source spatial big data fusion for Xi’an, China. Energy Build. 2021, 240, 110884. [Google Scholar] [CrossRef]
  48. Jing, C.; Li, S.; Cao, S.; Ma, X. Study on influencing factors and influencing strength of urban green space relieving heat island effect—Taking Beijing as an example. In IOP Conference Series: Earth and Environmental Science; IOP Publishing: Bristol, UK, 2020; Volume 601, p. 012033. [Google Scholar] [CrossRef]
  49. Kumar, D. Remote sensing based vegetation indices analysis to improve water resources management in urban environment. Aquat. Procedia 2015, 4, 1374–1380. [Google Scholar] [CrossRef]
  50. Stabler, L.B.; Martin, C.A.; Brazel, A.J. Microclimates in a desert city were related to land use and vegetation index. Urban For. Urban Green. 2005, 3, 137–147. [Google Scholar] [CrossRef]
  51. Hu, Y.; Jia, G. Influence of land use change on urban heat island derived from multi-sensor data. Int. J. Clim. 2009, 30, 1382–1395. [Google Scholar] [CrossRef]
  52. Ma, X.; Peng, S. Research on the spatiotemporal coupling relationships between land use/land cover compositions or patterns and the surface urban heat island effect. Environ. Sci. Pollut. Res. 2022, 29, 39723–39742. [Google Scholar] [CrossRef]
  53. Liao, W.; Hong, T.; Heo, Y. The effect of spatial heterogeneity in urban morphology on surface urban heat islands. Energy Build. 2021, 244, 111027. [Google Scholar] [CrossRef]
  54. Liang, Z.; Wang, Y.; Huang, J.; Wei, F.; Wu, S.; Shen, J.; Sun, F.; Li, S. Seasonal and Diurnal Variations in the Relationships between Urban Form and the Urban Heat Island Effect. Energies 2020, 13, 5909. [Google Scholar] [CrossRef]
  55. Chen, Z.; Gong, C.; Wu, J.; Yu, S. The influence of socioeconomic and topographic factors on nocturnal urban heat islands: A case study in Shenzhen, China. Int. J. Remote Sens. 2011, 33, 3834–3849. [Google Scholar] [CrossRef]
  56. Xiong, Y.; Zhang, F. Effect of human settlements on urban thermal environment and factor analysis based on multi-source data: A case study of Changsha city. J. Geogr. Sci. 2021, 31, 819–838. [Google Scholar] [CrossRef]
  57. Xiong, Q.; Chen, W.; He, L.; Luo, S.; Li, H. Study on the influencing factors and the spatiotemporal heterogeneity of Urban Heat Island effect in Nanchang City of China. J. Asian Arch. Build. Eng. 2022, 22, 1444–1457. [Google Scholar] [CrossRef]
  58. Gao, Y.; Zhao, J.; Han, L. Exploring the spatial heterogeneity of urban heat island effect and its relationship to block morphology with the geographically weighted regression model. Sustain. Cities Soc. 2021, 76, 103431. [Google Scholar] [CrossRef]
  59. Xu, R.; Dong, J.; Wang, F. Review on the influencing factors, methods and countermeasures ofurban heat island effect. J. Zhongkai Univ. Agric. Eng. 2020, 33, 65–70. [Google Scholar] [CrossRef]
  60. Zhang, L.; Yang, X.; Fan, Y.; Zhang, J. Utilizing the theory of planned behavior to predict willingness to pay for urban heat island effect mitigation. Build. Environ. 2021, 204, 108136. [Google Scholar] [CrossRef]
  61. Deng, Q.; Zhou, Z.; Li, C.; Yang, G. Influence of a railway station and the Yangtze River on the local urban thermal environment of a subtropical city. J. Asian Arch. Build. Eng. 2020, 21, 588–603. [Google Scholar] [CrossRef]
  62. Yang, B.; Yang, X.; Leung, L.R.; Zhong, S.; Qian, Y.; Zhao, C.; Chen, F.; Zhang, Y.; Qi, J. Modeling the Impacts of Urbanization on Summer Thermal Comfort: The Role of Urban Land Use and Anthropogenic Heat. J. Geophys. Res. Atmos. 2019, 124, 6681–6697. [Google Scholar] [CrossRef]
  63. Chen, Y.; Wang, Y.; Zhou, D.; Gu, Z.; Meng, X. Summer urban heat island mitigation strategy development for high-anthropogenic-heat-emission blocks. Sustain. Cities Soc. 2022, 87, 104197. [Google Scholar] [CrossRef]
  64. Wang, Z.; Xie, Y.; Mu, M.; Feng, L.; Xie, N.; Cui, N. Materials to Mitigate the Urban Heat Island Effect for Cool Pavement: A Brief Review. Buildings 2022, 12, 1221. [Google Scholar] [CrossRef]
  65. Arellano, B.; Roca, J. Effects of Urban Greenery on Health: A Study from Remote Sensing. Int. Arch. Photogramm. Remote Sens. Spat. Inf. Sci. 2022, XLIII-B3-2022, 17–24. [Google Scholar] [CrossRef]
  66. Fei, F.; Wang, Y.; Jia, X. Assessment of the Mechanisms of Summer Thermal Environment of Waterfront Space in China’s Cold Regions. Sustainability 2022, 14, 2512. [Google Scholar] [CrossRef]
  67. Vásquez-Álvarez, P.E.; Flores-Vázquez, C.; Cobos-Torres, J.-C.; Cobos-Mora, S.L. Urban Heat Island Mitigation through Planned Simulation. Sustainability 2022, 14, 8612. [Google Scholar] [CrossRef]
  68. Mun-Soo, N.; Woo-Bin, B.; Hee-Man, K.; Yong-Gil, K.; Sang-Rae, K. Quantitative evaluation of the mitigation effect of low-impact development pavement materials on urban heat island and tropical night phenomena. Water Sci. Technol. 2021, 83, 2452–2462. [Google Scholar] [CrossRef]
  69. Kalkstein, L.S.; Eisenman, D.P.; de Guzman, E.B.; Sailor, D.J. Increasing trees and high-albedo surfaces decreases heat impacts and mortality in Los Angeles, CA. Int. J. Biometeorol. 2022, 66, 911–925. [Google Scholar] [CrossRef] [PubMed]
  70. Gaffin, S.R.; Imhoff, M.; Rosenzweig, C.; Khanbilvardi, R.; Pasqualini, A.; Kong, A.; Grillo, D.; Freed, A.; Hillel, D.; Hartung, E. Bright is the new black—Multi-year performance of high-albedo roofs in an urban climate. Environ. Res. Lett. 2012, 7, 014029. [Google Scholar] [CrossRef]
  71. Kang, S.; Lee, D.; Park, J.; Jung, J. Exploring Urban Forms Vulnerable to Urban Heat Islands: A Multiscale Analysis. Sustainability 2022, 14, 3603. [Google Scholar] [CrossRef]
  72. Dwivedi, A.; Mohan, B.K. Impact of green roof on micro climate to reduce Urban Heat Island. Remote Sens. Appl. Soc. Environ. 2018, 10, 56–69. [Google Scholar] [CrossRef]
  73. Mushore, T.; Odindi, J.; Mutanga, O. “Cool” Roofs as a Heat-Mitigation Measure in Urban Heat Islands: A Comparative Analysis Using Sentinel 2 and Landsat Data. Remote Sens. 2022, 14, 4247. [Google Scholar] [CrossRef]
  74. Bustami, R.A.; Brien, C.; Ward, J.; Beecham, S.; Rawlings, R. A statistically rigorous approach to experimental design of vertical living walls for green buildings. Urban Sci. 2019, 3, 71. [Google Scholar] [CrossRef]
  75. Wu, C.; Li, J.; Wang, C.; Song, C.; Chen, Y.; Finka, M.; La Rosa, D. Understanding the relationship between urban blue infrastructure and land surface temperature. Sci. Total Environ. 2019, 694, 133742. [Google Scholar] [CrossRef]
  76. Nuruzzaman, M. Urban Heat Island: Causes, effects and mitigation measures—A review. Int. J. Environ. Monit. Anal. 2015, 3, 67–73. [Google Scholar] [CrossRef]
  77. Sun, R.; Chen, L. Effects of green space dynamics on urban heat islands: Mitigation and diversification. Ecosyst. Serv. 2017, 23, 38–46. [Google Scholar] [CrossRef]
  78. Kowe, P.; Mutanga, O.; Odindi, J.; Dube, T. Effect of landscape pattern and spatial configuration of vegetation patches on urban warming and cooling in Harare metropolitan city, Zimbabwe. GIScience Remote Sens. 2021, 58, 261–280. [Google Scholar] [CrossRef]
  79. Sharifi, A. Trade-offs and conflicts between urban climate change mitigation and adaptation measures: A literature review. J. Clean. Prod. 2020, 276, 122813. [Google Scholar] [CrossRef]
  80. Liang, B.; Ma, Y.; Hui, L. Research on Cooling Effect of the Landscape Green Space and Urban Water in Guilin City. Ecol. Environ. Sci. 2015, 24, 278–285. [Google Scholar] [CrossRef]
  81. Chen, L.; Li, X.; Fu, B.; Xiao, D.; Zhao, W. Development history and future research priorities of landscape ecology in China. Acta Ecol. Sin. 2014, 34, 3129–3141. [Google Scholar] [CrossRef]
  82. Xiao, R.; Ouyang, Z.; Zhang, Z.; Wang, X.; Li, W.; Zheng, H. Advances in Methodology of Urban Heat Island. Meteorol. Mon. 2005, 11, 4–7. [Google Scholar]
  83. Gong, A.-D.; Xu, J.; Zhao, J.; Li, J. A survey of study method for urban heat island. J. Nat. Disasters 2008, 17, 96–99. [Google Scholar] [CrossRef]
  84. Jiang, J.; Hu, F.; Liu, X.; Zhao, G. Numerical Simulation of Atmospheric Boundary Layer Structure over a Water-Land Heterogeneous Surface. Trans. Atmos. Sci. 2007, 2, 162–169. [Google Scholar] [CrossRef]
  85. Huang, J.; Zhang, Q. Mesoscale Atmospheric Numerical Simulation and Its Progress. Arid Zone Res. 2012, 29, 273–283. [Google Scholar] [CrossRef]
  86. Diaz, L.R.; Santos, D.C.; Käfer, P.S.; da Rocha, N.S.; da Costa, S.T.L.; Kaiser, E.A.; Rolim, S.B.A. Land Surface Temperature Retrieval Using High-Resolution Vertical Profiles Simulated by WRF Model. Atmosphere 2021, 12, 1436. [Google Scholar] [CrossRef]
  87. Ilhamsyah, Y. A Mesoscale Meteorological Model of Modified Land Cover to the Effect of Urban Heat Island in Jakarta, Indonesia. Aceh Int. J. Sci. Technol. 2012, 1, 60–66. [Google Scholar]
  88. Cantelli, A.; Monti, P.; Leuzzi, G. Development and integration of a subgrid urban surface scheme in a limited area model. Int. J. Environ. Pollut. 2014, 55, 230. [Google Scholar] [CrossRef]
  89. Yang, Y.; Li, H.; Lei, Y.; Yu, Y.; Yang, L. Revision method of tmy under urban heat island and its influence on building energy consumption-taking Xi’an as an Example. Acta Energ. Sol. Sin. 2021, 42, 1–7. [Google Scholar] [CrossRef]
  90. Ezimand, K.; Azadbakht, M.; Aghighi, H. Analyzing the effects of 2D and 3D urban structures on LST changes using remotely sensed data. Sustain. Cities Soc. 2021, 74, 103216. [Google Scholar] [CrossRef]
  91. Moazzam, M.F.U.; Doh, Y.H.; Lee, B.G. Impact of urbanization on land surface temperature and surface urban heat Island using optical remote sensing data: A case study of Jeju Island, Republic of Korea. Build. Environ. 2022, 222, 109368. [Google Scholar] [CrossRef]
  92. Xue, X.; He, T.; Xu, L.; Tong, C.; Ye, Y.; Liu, H.; Xu, D.; Zheng, X. Quantifying the spatial pattern of urban heat islands and the associated cooling effect of blue–green landscapes using multisource remote sensing data. Sci. Total Environ. 2022, 843, 156829. [Google Scholar] [CrossRef]
  93. Hu, H.; Chen, Y.; Gong, A. Advances in the application of remotely sensed data to the study of urban heat island. Remote Sens. Nat. Resour. 2005, 3, 5–9, 13. [Google Scholar] [CrossRef]
  94. Jiang, Y.; Lin, W. A Comparative Analysis of Retrieval Algorithms of Land Surface Temperature from Landsat-8 Data: A Case Study of Shanghai, China. Int. J. Environ. Res. Public Health 2021, 18, 5659. [Google Scholar] [CrossRef]
  95. Wang, T.; Tu, H.; Min, B.; Li, Z.; Li, X.; You, Q. The Mitigation Effect of Park Landscape on Thermal Environment in Shanghai City Based on Remote Sensing Retrieval Method. Int. J. Environ. Res. Public Health 2022, 19, 2949. [Google Scholar] [CrossRef] [PubMed]
  96. Adeniran, I.A.; Zhu, R.; Yang, J.; Zhu, X.; Wong, M.S. Cross-Comparison between Sun-Synchronized and Geostationary Satellite-Derived Land Surface Temperature: A Case Study in Hong Kong. Remote Sens. 2022, 14, 4444. [Google Scholar] [CrossRef]
  97. Guha, S.; Govil, H. Annual assessment on the relationship between land surface temperature and six remote sensing indices using landsat data from 1988 to 2019. Geocarto Int. 2021, 37, 4292–4311. [Google Scholar] [CrossRef]
  98. Wang, L.; Zhu, Y.; Wei, B. Research Progress on Correlation between Urban Heat lsland Effect and Landscape Pattern. Environ. Sci. Manag. 2017, 42, 156–160. [Google Scholar]
  99. Huang, H.; Yan, S. Visual Analysis of Hot Spots and Frontiers of Research on Urban Heat lsland Effect: Based on CiteSpace Cluster Analysis. J. Nanjing Tech Univ. (Soc. Sci. Ed.) 2021, 20, 94–110, 112. [Google Scholar]
  100. Chen, A.; Sun, R.; Chen, L. Studies on urban heat island from a landscape pattern yiew: A review. Acta Ecol. Sin. 2012, 32, 4553–4565. [Google Scholar] [CrossRef]
  101. Yao, Y.; Chen, X.; Qian, J. Research progress on the thermal environment of the urban surfaces. Acta Ecol. Sin. 2018, 38, 1134–1147. [Google Scholar] [CrossRef]
  102. Chen, X.; Zhang, S.; Tian, Z.; Luo, Y.; Deng, J.; Fan, J. Differences in urban heat island and its driving factors between central and new urban areas of Wuhan, China. Environ. Sci. Pollut. Res. 2023, 30, 58362–58377. [Google Scholar] [CrossRef]
  103. Gu, F.Y.; Dong, X.F.; Xie, H.Q. Spatio-Temporal Analysis of Urban Heat Island of Nantong City Based on TM/ETM+ Images. Adv. Mater. Res. 2012, 610–613, 3720–3723. [Google Scholar]
  104. Wen, X.P.; Yang, X.F. Urban Heat Island Monitoring and Analysis Using Landsat ETM+/TM Imageries. Key Eng. Mater. 2011, 467–469, 3–6. [Google Scholar]
  105. Yao, N.; Huang, C.; Yang, J.; Bosch, C.C.K.v.D.; Ma, L.; Jia, Z. Combined Effects of Impervious Surface Change and Large-Scale Afforestation on the Surface Urban Heat Island Intensity of Beijing, China Based on Remote Sensing Analysis. Remote Sens. 2020, 12, 3906. [Google Scholar] [CrossRef]
  106. Liu, W.; You, H.; Sun, D. Multi-Time Scale Analysis of Megacities Heat lsland Effect in Beijing-Tianjin-Hebei Region from 1971 to 2010. Meteorol. Mon. 2016, 42, 598–606. [Google Scholar] [CrossRef]
  107. Niu, L.; Zhang, Z.; Peng, Z.; Liang, Y.; Liu, M.; Jiang, Y.; Wei, J.; Tang, R. Identifying Surface Urban Heat Island Drivers and Their Spatial Heterogeneity in China’s 281 Cities: An Empirical Study Based on Multiscale Geographically Weighted Regression. Remote Sens. 2021, 13, 4428. [Google Scholar] [CrossRef]
  108. Shen, Z.-J.; Zhang, B.-H.; Xin, R.-H.; Liu, J.-Y. Examining supply and demand of cooling effect of blue and green spaces in mitigating urban heat island effects: A case study of the Fujian Delta urban agglomeration (FDUA), China. Ecol. Indic. 2022, 142, 109187. [Google Scholar] [CrossRef]
  109. Feng, R.; Wang, F.; Wang, K.; Wang, H.; Li, L. Urban ecological land and natural-anthropogenic environment interactively drive surface urban heat island: An urban agglomeration-level study in China. Environ. Int. 2021, 157, 106857. [Google Scholar] [CrossRef] [PubMed]
  110. Yu, X.; Liu, Y.; Zhang, Z.; Xiao, R. Influences of buildings on urban heat island based on 3D landscape metrics: An investigation of China’s 30 megacities at micro grid-cell scale and macro city scale. Landsc. Ecol. 2021, 36, 2743–2762. [Google Scholar] [CrossRef]
  111. Ren, P.; Zhang, X.; Liang, H.; Meng, Q. Assessing the impact of land cover changes on surface urban heat islands with high-spatial-resolution imagery on a local scale: Workflow and case study. Sustainability 2019, 11, 5188. [Google Scholar] [CrossRef]
Figure 1. Technological roadmap. The implementation process of the research method is demonstrated.
Land 12 01154 g001
Figure 2. Changes in the number of urban heat island publications in the WOS and CNKI databases from 1980 to 2021. The WOS database included articles published from 2008 to 2021. Data from the CNKI database included articles published from 1980 to 2021.
Land 12 01154 g002
Figure 3. Distribution of high-publication-yield countries regarding UHI from 2008 to 2021. The chart highlights the top ten countries with the greatest number of published articles in the field of urban heat island research.
Land 12 01154 g003
Figure 4. Analysis of the cooperation network of issuing urban heat island institutions. The ten institutions with the most publications in the two databases, WOS and CNKI, are summarized. Notes: FZU: “Fuzhou University ”; BJFU: “Beijing Forestry University”; BJIUMS: “Beijing Institute of Urban Meteorological Science”; BJMB: “Beijing Meteorological Bureau”; PKU: “Peking University”; IGSNRR: “Institute of Geographic Sciences and Natural Resources Research, CAS”; UCAS: “University of Chinese Academy of Sciences”; BJNU: “Beijing Normal University”; NJU: “Nanjing university”; NJIEU: “Nanjing information engineering university”; CUG: “China University of Geosciences”; IITSS: “Indian Institute of Technology System”; WHU: “Wuhan University”; TASU: “Arizona State University at Tempe”; ASU: “Arizona State University”; IGSNRR: “Institute of Natural Resources, Chinese Academy of Sciences”; CAS: “Chinese Academy of Sciences”.
Land 12 01154 g004
Figure 5. The evolution of urban heat island research objects (in CNKI). The trend began in 2008, and its evolution is shown through 2021, from left to right.
Land 12 01154 g005
Figure 6. The evolution of urban heat island research objects (in WOS). The trend began in 2008, and its evolution is shown through 2021, from left to right.
Land 12 01154 g006
Figure 7. Co-occurrence network map of keywords in the CNKI urban heat island research literature.
Land 12 01154 g007
Figure 8. Emergence of keywords in WOS and CNKI urban heat island research literature. Note: red in the figure indicates the starting time and duration of hot keywords.
Land 12 01154 g008
Figure 9. Co-occurrence network map of key words in the WOS urban heat island research literature.
Land 12 01154 g009
Table 1. Distribution of top 10 journals on UHI in the CNKI database from 2008 to 2021.
No.JournalTotal ArticlesProportion (%)Journal TypeCompound Influence FactorComprehensive Impact Factor
1Acta Ecologica Sinica5611.27CSSCI4.7333.444
2Ecology and Environmental Sciences479.46CSSCI2.6672.002
3Remote Sensing Technology and Application336.64CSSCI2.1051.535
4Chinese Journal of Ecology275.43CSSCI2.9972.182
5Journal of Geo-information Science275.43CSSCI3.4552.428
6Journal of Anhui Agricultural Sciences275.43CA\JST0.7160.494
7Geomatics & Spatial Information Technology244.83JST0.810.576
8Resources and Environment in the Yangtze Basin234.63CSSCI4.1453.009
9Scientia Geographica Sinica214.23CSSCI5.9874.293
10Chinese Journal of Applied Ecology214.23CSSCI3.8932.851
Table 2. Distribution of major journals on UHI in WOS database from 2008 to 2021.
NumberJournalTotal ArticlesProportion (%)Journal Impact FactorAverage Number of Citations of Journal Papers per Year
1Sustainable Cities and Society1297.29210.696349.29
2Remote Sensing1035.82213.85196.93
3Urban Climate965.4276.663122.79
4Sustainability814.5793.88991.07
5Building and environment734.1277.093251.00
6Science of the total Environment714.01410.753310.71
7Theoretical and applied climatology583.2793.409133.5
8Energy and buildings452.5447.201219.79
9Journal of Applied Meteorology and Climatology432.4313.557161.71
10International journal of Remote Sensing311.7523.53167.93
Table 3. Distribution of the most frequently cited CNKI articles on UHI from 2008 to 2021.
No.AuthorYearTitleJournalTotal Citation Frequency
1Chen Liding [26]2013Eco-environmental effects of urban landscape pattern changes: progresses, problems, and perspectivesActa Ecologica Sinica414
2Xu Hanqiu [27]2013A remote sensing urban ecological index and its applicationActa Ecologica Sinica371
3Shou Yixuan [38]2012Recent advances in understanding urban heat island effects with some future prospectsJournal of Meteorology261
4Xu Hanqiu [28]2009Quantitative analysis on the relationship of urban impervious surface with other components of the urban ecosystemActa Ecologica Sinica241
5Bai Yang [39]2013Progress of urban heat island effectJournal of Meteorology and Environment240
6Peng Baofa [30]2013The impacting mechanism and laws of function of urban heat islands’ effect: A case study of ShanghaiActa Geographica Sinica230
7Chen Songlin [33]2009Comparison Analyses of Equal Interval Method and Mean-standard Deviation Method Used to Delimitate Urban Heat IslandsJournal of Geoinformation Science206
8Xu Hanqiu [29]2011Analysis on urban heat island effects based on the dynamics of urban surface biophysical descriptorsActa Ecologica Sinica182
9Su Yongxian [31]2010The cooling effect of Guangzhou City parks to surrounding environmentsActa Ecologica Sinica173
10Sun Jisong [32]2008Meso-β Scale Torrential Rain Affected by Topography and the Urban CirculationAtmospheric sciences155
Table 4. Distribution of the most frequently cited WOS articles on UHI from 2008 to 2021.
No.AuthorYearTitleJournalTotal Citation Frequency
1Santamouris, M [37]2014Cooling the cities–A review of reflective and green roof mitigation technologies to fight heat islands and improve comfort in urban environmentsSolar Energy858
2Imhoff, ML [34]2010Remote sensing of the urban heat island effect across biomes in the continental USARemote Sensing of Environment777
3Li, JX [35]2011Impacts of landscape structure on surface urban heat islands: A case study of Shanghai, ChinaRemote Sensing of Environment600
4Peng, SS [40]2012Surface Urban Heat Island Across 419 Global Big CitiesEnvironmental Science & Technology590
5Zhao, L [36]2014Strong contributions of local background climate to urban heat islandsNature574
6Tan, JG [41]2010The urban heat island and its impact on heat waves and human health in ShanghaiInternational Journal of Biometeorology558
7Santamouris, M [42]2011Using advanced cool materials in the urban built environment to mitigate heat islands and improve thermal comfort conditionsSolar Energy536
8Zhou, WQ [43]2011Does spatial configuration matter? Understanding the effects of land cover pattern on land surface temperature in urban landscapesLandscape and Urban Planning510
9Buyantuyev, A [44]2010Urban heat islands and landscape heterogeneity: linking spatiotemporal variations in surface temperatures to land-cover and socioeconomic patternsLandscape Ecology456
10Estoque, RC [45]2017Effects of landscape composition and pattern on land surface temperature: An urban heat island study in the megacities of Southeast AsiaScience of the total Environment436
Disclaimer/Publisher’s Note: The statements, opinions and data contained in all publications are solely those of the individual author(s) and contributor(s) and not of MDPI and/or the editor(s). MDPI and/or the editor(s) disclaim responsibility for any injury to people or property resulting from any ideas, methods, instructions or products referred to in the content.

