Abstract
Landslides along the main roads in the mountains cause fatalities, ecosystem damage, and land degradation. This study mapped the susceptibility to landslides along the Saqqez-Marivan main road located in Kurdistan province, Iran, comparing an ensemble fuzzy logic with analytic network process (fuzzy logic-ANP; FLANP) and TOPSIS (fuzzy logic-TOPSIS; FLTOPSIS) in terms of their prediction capacity. First, 100 landslides identified through field surveys were randomly allocated to a 70% dataset and a 30% dataset, respectively, for training and validating the methods. Eleven landslide conditioning factors, including slope, aspect, elevation, lithology, land use, distance to fault, distance to a river, distance to road, soil type, curvature, and precipitation were considered. The performance of the methods was evaluated by inspecting the areas under the receiver operating curve (AUCROC). The prediction accuracies were 0.983 and 0.938, respectively, for the FLTOPSIS and FLANP methods. Our findings demonstrate that although both models are known to be promising, the FLTOPSIS method had a better capacity for predicting the susceptibility of landslides in the study area. Therefore, the susceptibility map developed through the FLTOPSIS method is suitable to inform management and planning of areas prone to landslides for land allocation and development purposes, especially in mountainous areas.
1. Introduction
Road networks give access to nearly every area of the country; consequently, there is a greater requirement for an established and durable road network infrastructure. Roads are critical infrastructure components that are frequently exposed to natural and man-made hazards [1], especially in emerging nations if road expansion was rapid and poorly planned [2]. Furthermore, natural calamities brought on by climate change, such as landslides and earthquakes, can make roads unstable [3]. Regional roads are a vital component of the infrastructure, and any disruptions caused by landslides can be disastrous for communities dependent on them [4]. Predicting risk from landslides to roadways through landslide susceptibility mapping (LSM) is crucial to better understand potential slope collapse at different spatio-temporal scales to protect people’s lives and property, and to prevent ecosystem damage and a waste of capital and resources [5,6,7].
To prevent a catastrophic landslide, policymakers, scientists, engineers, and the general public can access landslide susceptibility maps (LSM), for example for land use planning purposes, which shows landslide-prone locations [8]. Studies on LSM along road networks adopt two different methodologies: The first line of research focuses on assessing the immediate or indirect socio-economic effects of disruptions and makes fewer attempts to assess their likelihood [9]. The second line of research integrates GIS and geological modeling with a greater focus on landslide severity assessments without quantifying the impacts of network interruptions. In a susceptibility analysis, it is essential to simultaneously consider the probability of landslide occurrences and the consequences of network disruptions in order to provide useful guidance on how to prepare for and respond to landslide disasters. The joint effect is widely used to characterize the impact of landslides on roads, and it is the primary focus of current studies of landslide risk to roads, which also consider the likelihood of landslides and their impacts on roadways [10]. Pantelidis [11] offers a comprehensive analysis of landslide susceptibility assessment systems for highways, discussing both quantitative and qualitative approaches. The Federal Highway Administration (FHWA) of the United States suggested [12] a form of landslide susceptibility evaluation that was later adapted by Budetta [13] to measure the risk of landslides along highways. The purely quantitative risk assessment (QRA) assesses the hazard in terms of the likelihood of failure or occurrence of an event of a certain scale multiplied by its effects [14], which semi-quantitative methods do not address. While landslide susceptibility and hazard have been studied widely over the last two decades, using heuristic, statistical-probabilistic, or deterministic strategies (e.g., Pregnolato et al. [15] and Chamorro et al. [16]), there has been little effort expended on evaluating the utility of risk indicators and on spatially assessing landslide vulnerability [17]. Optical images were used in several landslide susceptibility mapping studies to establish landslide inventories, vegetation indices, and land use/land cover knowledge [18,19]. To compare and rank multiple options before choosing the best-fit option for landslide susceptibility modelling, several techniques are used in multiple-criteria decision modelling (MCDM), including: max-min, min-max, PROMETHEE, ELECTRE, analytic hierarchy process (AHP), TOPSIS, fuzzy TOPSIS, compromise programming, fuzzy AHP, and data envelopment analysis. Fuzzy decision-making strategies have elicited increasing interest in better understanding location problems that involve ambiguous or partial datasets, or those that have linguistic factors [20].
A merged MCDM combines the widely applied TOPSIS method [21], which has been extensively utilized in the literature [22,23,24,25]. Similarly, the analytic network process (ANP) to predict landslides [26], floods [27], forest fires [28], land subsidence [29], and earthquakes [30]. Risk assessment and mapping studies have been undertaken in many different ways using both qualitative and quantitative methods. ANP and assessments of landslide susceptibility factors are among the most popular and effective qualitative methods and tools [31,32]. Quantitative multivariate and bivariate analyses are also used [33].
Rock type, structural discontinuities, slope gradient, relative relief, aspect, soil depth, soil characteristics, land use and land cover, groundwater, and hydrologic conditions are the geoenvironmental factors that significantly increase the likelihood of landslides [34,35]. Construction operations, particularly for roads, are substantial contributors to the occurrence of landslides in addition to considerations such as distance to rivers, faults, and lineaments [36,37]. Numerous researchers have proposed different strategies for landslide susceptibility mapping (LSM) by considering landslide triggering and precipitating factors. According to He et al. [38], geometric factors such as elevation, aspect, and slope are among the most significant factors. In addition, hydrological factors need to be considered, such as the topographic wetness index (TWI), the sediment transport index (STI), and the distance from rivers as they exacerbate and trigger landslides. Geological and environmental factors (such as lithology and land use) and soil textures [39] also contribute to landslides and are therefore useful for their early detection.
The causes of landslides have been determined through a number of studies. Saleem et al. [40] investigated how DEM derivatives affect risk assessment and mapping of landslide susceptibility. In order to estimate landslide areas, Zhang et al. [41] used 12 conditioning factors and ensemble learning approaches to determine landslide susceptibility. The heterogeneity of the Earth’s surface makes it difficult to adopt a universal strategy to identify the causes responsible for landslides. Some scientific organizations and institutes have established recommendations for LSM suggesting the use of a common nomenclature and guide for analysts [42]. However, the applied approaches differ from area to area and even within the same area [43].
Since many landslides occur annually along the road that we studied, and this road constitutes one of the primary intercity roads, many travelers are exposed to the risk of landslides. No study has been conducted on landslides for this road, identifying highly susceptible areas is of great urgency. According to our literature review, although TOPSIS and ANP have been broadly developed for and adopted in a wide range of real-world problems, few studies exist for the LSM. In this study, we combined TOPSIS and ANP with the fuzzy logic approach to obtain more accurate maps for predicting landslides in the study area. ANP integrates the multiple benefits of AHP, including simplicity, adaptability, and the chance to review verdicts, replacing hierarchical structures with networks by estimating the independence between complicated decision-making aspects [44].
Furthermore, it is a straightforward tool to use that aids in understanding the interrelationships between variables, and assists planners, decision-makers, and developers in making a common decision [44]. TOPSIS is an MCDM method that can quickly determine the best alternative with minimal input from planners, decision-makers, and developers. Consequently, the primary goals of this study are to: (1) identify the most important factors affecting landslides in the study area; (2) develop fuzzy ANP and fuzzy TOPSIS methods to model landslide susceptibility; and (3) prepare a landslide susceptibility map with high prediction accuracy for the Saqqez-Marivan road in Kurdistan province, Iran.
2. Data Acquisition and Preparation
Study Area
The case study area forms part of the communication route from Saqqez to Marivan and is located in Kurdistan province. It covers approximately 1100 km2 and lies between the 46°10′34″ to 46°29′33″, east longitude and 35°29′7″ to 36°15′36″ north latitude (Figure 1). The Saqqez-Marivan road is a strategic and important road that connects western Iran and Iraq and facilitates trade relations with the Kurdistan region. This route is 126 km long, which includes winding and steep passages that are prone to landslides and avalanches due to heavy snow and rainfall. Figure 2 shows different types of landslides which have occurred in the study area.
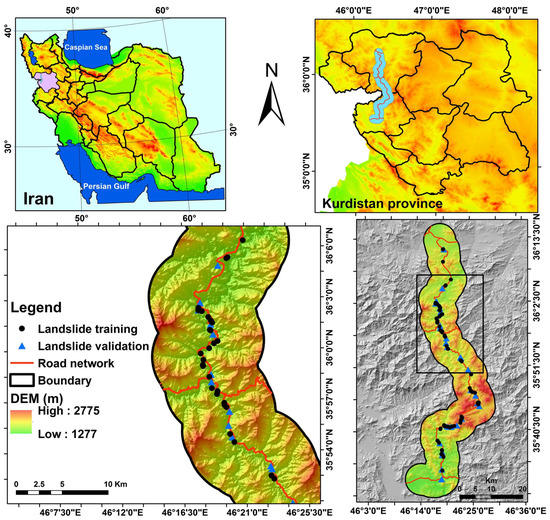
Figure 1.
Location of landslides in the study area: the Saqqez-Marivan road in the Kurdistan Province of Iran.
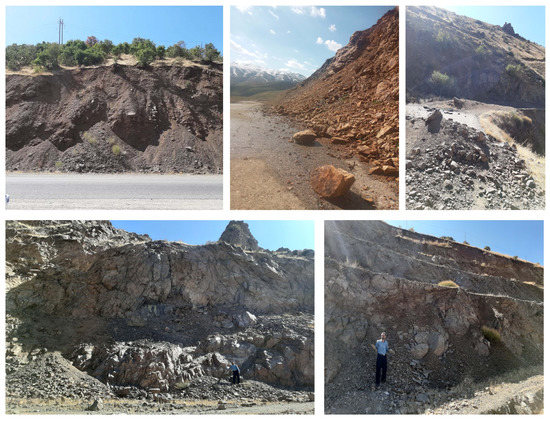
Figure 2.
Different types of landslides observed along the Saqqez-Marivan road in the Kurdistan Province of Iran.
3. Materials and Methods
3.1. Landslide Conditioning Factors (LCFs)
Knowledge of the primary causes of landslides is necessary in order to identify and map a sufficient collection of conditioning factors linked to landslide occurrences [45]. In general, the number of landslide conditioning factors considered for modelling varies from several to dozens [46]. Here, eleven landslide conditioning factors were chosen under five categories, taking into account previous studies and the features relevant for landslide occurrence in the study area: slope, aspect, elevation, lithology, land use, distance to river, distance to road, soil type, curvature, and rainfall. It is important to note that the classification of the layers was based on regional characteristics and expert opinions. Landslide conditioning factors are reported for each factor class in the study area. First, a digital elevation model (DEM) with a resolution of 12.5 m × 12.5 m was prepared from the ALOS PALSAR satellite and the site (https://vertex.daac.asf.alaska.edu, accessed on 15 December 2022).
In the following, a slope map was prepared using a DEM in ArcGIS 10.7 which was then categorized into 6 classes (Figure 3a). The aspect layer was extracted from a DEM in ArcGIS 10.7 and categorized into 9 classes (Figure 3b). The elevation of the sea level map was obtained from a DEM in ArcGIS 10.7 in 7 classes (Figure 3c). The lithology map was then retrieved from the geological map with a scale of 1:100,000 and then categorized into 14 classes (Figure 3d). A land use/cover map was prepared by interpreting Landsat 7 ETM+ satellite images obtained in 2017 in 12 classes (Figure 3e). A distance-to-the-fault map divided into 5 classes was made using a fault map of the research area that was created from a geological map at a scale of 1:100,000 (Figure 3f). Using the kriging method, the rainfall was mapped and then divided into five classes using 20 years of data (from 1996 to 2016) from the rain gauge stations both inside and outside of the study area (Figure 3g). The curvature is frequently employed as one of the most significant conditioning factors in landslide modelling [46]. The curvature map was produced using a DEM of 12.5 m, and it was then divided into three classes: concave, convex, and flat (no curvature) (Figure 3h). The soil layer of the region categorized into two classes was referenced from a map of Kurdistan Province showing land resources and capabilities with a scale of 1:250,000 (Figure 3i). River networks were extracted from the DEM of 12.5 m to create a distance-to-the-river map divided into five classes (Figure 3j). The excavation of roads in hilly areas causes slope instability and landslides [47]. Thu, the road network had to be obtained from the 1:50,000 scale topographic map. A distance-to-the-road map was created, divided into five classes (Figure 3k).
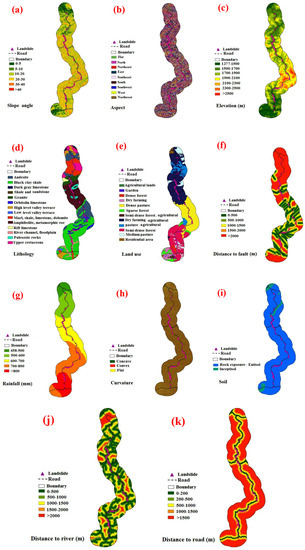
Figure 3.
The thematic map of landslide conditioning factors: (a) slope degree, (b) aspect, (c) elevation, (d) lithology, (e) land use, (f) distance to fault, (g) rainfall, (h) curvature, (i) soil, (j) distance to river, (k) distance to the Saqqez-Marivan road in the Kurdistan Province of Iran.
3.2. Landslide Inventory Map (LIM)
A landslide susceptibility map essentially needs two datasets; namely, a dataset to create a landslide inventory and another dataset of factors that affect landslide occurrence. Landslide inventories are required for model training and validation in landslide susceptibility assessments. Inventories of landslides can be established from field survey data, news and government report detailing previous landslide events, and remote sensing data analysis [48]. Kavzoglu et al. [49], Kilicoglu, [50], and Akinci et al. [51] identified the locations of prior landslides using GNSS-based field surveys, high-resolution satellite imagery, Google Earth imagery, previous projects and reports, atlases, and other sources. Consequently, the evidence gathered from prior landslides is referred to as an inventory map and consists mainly of the locations of existing landslides. In our case, a landslide inventory containing 100 landslide locations was created using Google Earth images and field surveys, among other sources. These landslides are classified into training (70%) and validation (30%) datasets for model building and validation purposes, respectively. It is worth mentioning that there is no guideline or standard for classifying the number of landslides into the training and validation datasets. We collated some references from the literature for different combinations of percentages in Table 1.

Table 1.
Different combinations of percentage allocations of data into the of training and validation datasets for landslide susceptibility assessments.
3.3. Multi-Criteria Decision-Making Methods in LSM
3.3.1. Fuzzy TOPSIS Algorithm
The concept of “relative closeness to an ideal solution” serves as the foundation for the MCDM technique known as TOPSIS, which was developed by Hwang and Yoon [65,66]. The fundamental objective is to choose an ideal solution from a set of alternatives that should be as far away from the negative ideal solution (NIS) and as close to the positive ideal solution (PIS) [66,67,68,69]. This approach computes the weights for each preset criterion, normalizes the scores, and then calculates the geometric distance between each alternative and the PIS and NIS [70,71].
The TOPSIS technique procedure typically involves the following steps:
In the fuzzy TOPSIS method, weights and decision matrices are defined as fuzzy numbers. The ranking occurs similarly as when using the classic TOPSIS method, namely according to the distance between the positive and negative values, using Equation (1).
When using triangular fuzzy numbers, , the function of the option (i = 1, 2, …, m) relates to the criterion (j = 1, 2, …, n).
Using triangular fuzzy numbers, each component Wj (standard weight) is represented by Equation (2).
If the fuzzy numbers are triangular, these equations are applied to calculate the scales of the unmeasured decision matrix for the positive and negative criteria:
which is shown in these relations () and ().
This leads to the following derivation of the scale-less fuzzy decision matrix (R):
where m is the number of alternatives and n is the number of criteria Equations (6) and (7) outline the conditions for the positive and negative features if the fuzzy numbers are triangular:
Equation (8) calculates the positive ideal solution matrix, while Equation (9) determines the negative ideal solution matrix.
where constitutes the best value of criterion I and constitutes the worst value of criterion I considering all the options.
The selections in A+ and A− represent options that are vastly superior and inferior, respectively [72].
The separation between each choice and the ideal positive and negative solutions can be calculated using the following equations.
To find the distance from each option to the neutral and positive solutions that are optimal, Equation (10) can be used to express the distance between alternatives i and A with a positive ideal solution:
The distance between alternatives i and A and the negative ideal solution can be formulated with Equation (11):
If (a1, b1, c1) and (a2, b2, c2) are two triangular fuzzy numbers, then the distance between them is given by Equation (12):
It should be noted that and are definite numbers.
The preference value for each alternative (i, V) employs the following Equation to calculate (13):
The alternatives are ranked to the in decreasing order [73].
3.3.2. Fuzzy Analytical Network Process Model (Fuzzy ANP)
The analytic hierarchy process (AHP) is often considered to be less comprehensive and precise than ANP [74]. However, there may be dependencies among the criteria which are not taken into account in the AHP. According to the AHP, each criterion in a one-way hierarchy is autonomous and there is no direct connection between them [75]. The ANP arranges decision criteria into a network of clusters and nodes to overcome these AHP limitations [76,77]. The ANP is a relatively straightforward method for estimating individual decision-making model criteria. In this study, ANP was used to calculate the final weights by following the steps below [78]:
- Step A: Building ANP Models and Structuring Problems
The problem needs to be precisely specified and arranged into logical systems before an ANP model can be developed. Using the proper processes, a framework that accurately represents the network can then be created based on the decision-maker’s judgment.
- Step B: Pairwise comparisons
The ANP approach structures the problem into clusters, with decision components occurring at various levels of abstraction. The first cluster represents the overall goal, followed by criteria in the second cluster (e.g., topography, geology, climate, and biology), and indicators in the third cluster (e.g., selected indicators). Pairwise comparisons are then made using a control criterion to determine the importance of each component within each cluster and to examine the interdependencies between cluster indicators. As suggested by Feizizadeh et al. [79], on a scale of 1 to 9, the relative significance is evaluated, with the lower bound signifying equal relevance and the upper bound signifying excessive significance. The eigenvector can be used to describe the measure of an element’s influence on other elements. This evaluation is based on the relative weights of two indicators—a matrix row component and a matrix column component [30]. For reverse comparison, a mutual value was established to highlight the importance of the element as it relates to the (jth) element. The pairwise comparison values provided by the comparison matrix are similar to those of the AHP, and the local priority vector is obtained from the eigenvector using the following formula:
Pairwise comparison matrix Matrix A has the biggest eigenvalue W, which stands for the eigenvector. The eigenvector X of a consistency matrix A can be computed using
An important ANP verification criterion is the value. By calculating the consistency ration (CR), this measure serves as a reference index for analyzing the estimated vector.
The consistency index (CI) is used to evaluate the pair-wise matrix’s consistency. It is required that the approved consistency value (CR) be less than 0.1.
RI indicates the average consistency index for reciprocal matrices of a similar order containing any random entries. The estimated value is considered acceptable if ; otherwise, a new comparison matrix is continuously sought until this measure’s acceptable range is not achieved.
- Step C: Calculating the Super Matrix
A pair-wise comparison helps the super matrix’s calculation, which is broken down into clusters and those elements’ individual components. The following describes the N-cluster supermatrix:

Each kth cluster has mk elements, where CK stands for the kth cluster and [30].
- Step D: Selection
The objective of this step is to analyze each signal and select the best one for the final judgment based on the alternative weights obtained from the constructed supermatrix. The final weight calculation method for the ANP model mapping of landslide susceptibility assessment involves three steps:
Step 1: Objective (LSM): This step involves creating the subject model and structure using 11 factors, including slope, aspect, elevation, lithology, land use, distance to fault, distance to a river, distance to road, curvature, and rainfall. These factors are classified into four clusters: topography (elevation, slope, curvature, and aspect), geology (soil type, distance to fault and lithology), anthropogenic (land use and distance to road), and climate (rainfall, distance to river).
Step 2: Make priority vectors and binary comparison matrices: The control criterion and experts assess the importance or priority of criteria or sub-criteria in this step, assigning a number between 1 and 9 to each. The final weights of the factors (clusters) are determined by multiplying the relative weights of the factors in the matrix from stage two. This matrix is made up of pairwise comparisons of the 11 research criteria using even comparisons and fuzzy numbers, once looking at the relationships and again at the lack of communication.
Step 3: Determining the criterion and sub-criterion’s ultimate weight. The final weight of each criterion is calculated in this stage by multiplying the matrices produced in the previous step. The model was run in ArcGIS after the weights of the classes of each criterion were calculated using the ANP approach and fuzzy membership functions. The weighting of criteria and sub-criteria was achieved by using the Super Decision software.
3.4. Validation of the Methods
In landslide susceptibility and hazard mapping research, the precision and dependability of landslide susceptibility maps are essential [80]. The model’s performance should be assessed following a standard investigation of the receiver operating characteristics (ROC) curve [19,81]. The ROC curve represents the true positive rate (AUCROC) and false negative rate based on sensitivity and specificity, respectively [82]. AUCROC ranges from 0 to 1, with 0.5 being the threshold. The higher the AUCROC value, the better the performance and prediction accuracy of the methods, both for the training dataset and the validation dataset [83].
4. Results and Analysis
4.1. Model Building and Comparison
In this study, fuzzy TOPSIS and fuzzy ANP were used to derive the sub-criteria weights. In fuzzy ANP, the network and pairwise comparisons of internal and external factors and dependencies were constructed, and the Super Decision software generated three large matrices. By combining target comparison matrices, criteria, and sub-criteria, a large weightless matrix was formed. Finally, to transform the weightless matrix into a weighted matrix, it was multiplied by a clustered matrix.
Table 2 presents the final weight of each criterion in the fuzzy ANP method. It is clear that the factors of distance from road, soil, and rainfall have the best predictive power for the landslide model, but lithology, curvature, and land use have the least impact on the occurrence of landslides in the research area. Additionally, the results of the fuzzy TOPSIS model indicate that the most significant factors in landslide modeling are the distance to the road, rainfall, and distance to the fault, in that order. However, lithology and land use hold the lowest importance on landslide occurrences. Table 2 shows the final weights obtained from the two methods (fuzzy ANP and fuzzy TOPSIS).
Table 2.
The performance of the methods based on fuzzy ANP and fuzzy TOPSIS.
4.2. Developing Landslide Susceptibility Mapping
We utilized the weights obtained from the two methods (fuzzy ANP and fuzzy TOPSIS) to produce and map landslide susceptibility in ArcGIS 10.7. The landslide susceptibility maps that resulted from weighing the sub-criteria and criterion were divided into five levels: very low, low, moderate, high, and very high (refer to Figure 4). Since the distance to roads was found to be the most important factor in landslide occurrences, the distribution of various susceptibility levels around roads appears to be fairly consistent. Inferences can also be drawn that roads in the northern section of the region are more vulnerable to landslides than those in the southern parts of the region (refer to Figure 4).
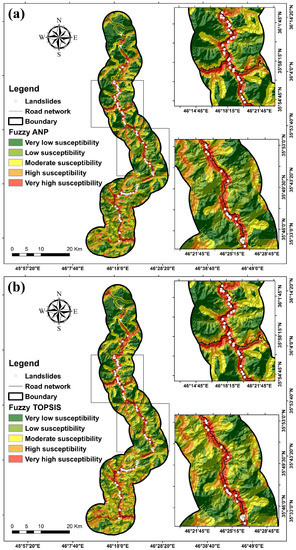
Figure 4.
Landslide susceptibility maps of the models (a) fuzzy ANP (b) fuzzy TOPSIS.
Table 3 displays the percentages of each class’s area and the percentage of landsides in each class for both methods based on the validation dataset. According to the results from the fuzzy ANP method, the very low susceptibility class covers the largest area (30.65%), followed by the low susceptibility class (24.70%), the moderate susceptibility class (21.39%), and the high susceptibility (14.74%) and very high susceptibility classes (8.52%). Moreover, the table reveals that the percentage of landslides has decreased from very low (0 %) to very high (86.67%). In the fuzzy TOPSIS method, the percentages for the moderate, very low, low, high and very high susceptibility classes are 26.37%, 24.75%, 23.98%, 15.53%, and 9.37%, respectively. However, the percentage of landslides is 0% for the very low and low susceptibility classes, followed by high susceptibility (6.67%), moderate susceptibility (10%), and very high susceptibility (83.33%).
Table 3.
Proportional distribution of landslides in five different landslide classes, based on fuzzy ANP and fuzzy TOPSIS.
The area under the ROC curve (AUCROC) was examined based on the validation dataset to verify the created landslide susceptibility map. It was determined to be 0.983 for the fuzzy TOPSIS approach and 0.938 for the fuzzy ANP. The findings show that for mapping the landslide susceptibility in the research area, the fuzzy TOPSIS method is more accurate than the fuzzy ANP method. Table 4 and Figure 5 present these results.
Table 4.
AUCROC values of the models using the validation dataset.
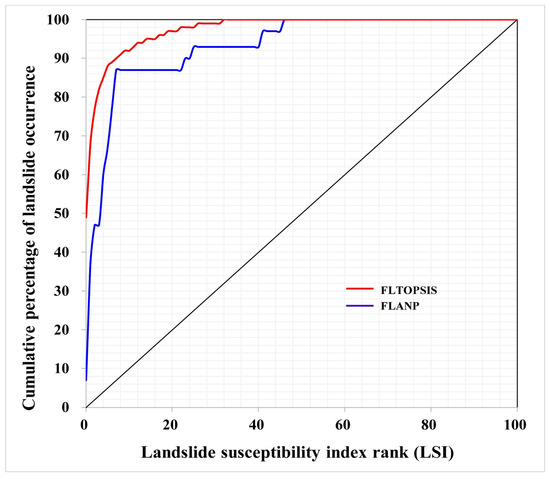
Figure 5.
ROC curve of the two methods performed on the validation dataset.
5. Discussion
Although landslides vary in their magnitude and severity, they typically cause significant financial and human loss. Predicting landslide events generates important data for policymakers, and multiple stakeholders, for land allocation projects before, during, and after such events [84]. Government agencies, for instance, employ the straightforward process of “landslide susceptibility mapping” (LSM) to develop landslide control policies [85]. The LSM can reduce loss and injury by identifying and classifying locations that are prone to landslides and adjusting land planning decisions accordingly [86]. Landslide studies have greatly benefited from the use of geographic information systems (GIS) and remote sensing techniques (RS) because they enable the extraction of landslide conditioning factors (LCFs) such as slope and distance to a road to identify areas prone to landslides [87].
The Saqqez-Marivan main road in the Kurdistan province of Iran, extending over the course of 126 km, is one of the busiest roads in the area due to its geographical location. It holds great importance for transportation and trade between multiple countries. Every year, numerous large-scale rock movements and landslides threaten this road. In this study, we considered the influence of slope, aspect, elevation, lithology, land use, distance to the fault, distance to a river, distance to the road, soil type, curvature, and rainfall as predictors for landslide occurrence. According to our fuzzy ANP model, classes 1700–1900 m had the lowest impact on landslide incidence while 2100–2300 m had the largest impact. The fuzzy TOPSIS model predicted that the class of 1500–1700 m had the highest impact while the class of 2100–2300 m had the lowest impact. Furthermore, in accordance with both models, the medium slopes of 30–40 degrees were associated with a greater likelihood of landslides while the slopes of less than five degrees were least likely to be associated with landslides.
This issue indicates that the intermediate elevations are more sensitive to the occurrence of landslides in the study area. Conversely, the lower elevations do not have the potential for landslides as the slope is not severe enough, while the areas with higher elevations have mainly slopes above 45 degrees. These are mostly rocky with shallow soils, which is not conducive for the formation of landslides. In addition, human activity is limited in these higher areas. Human activity that may trigger landslides mainly occurs in the middle elevations. These elevations are coupled with slopes and depths of soil conducive to landslides, and exacerbated by human activity such as cutting the slope for the construction of roads and transmission lines.
That median slopes are more prone to landslides is consistent with Huang et al. [88]. In addition, one of the key factors affecting slope stability is the distance to rivers. This is so because water flow’s shear stress is substantially greater than the shear strength of soil banks and beds. Less than 100 m from rivers revealed the highest frequency of landslides in the studied area, while areas furthest away from rivers (>2000 m) were least likely to incur landslides. These findings concur with Pourghasemi et al. [89].
Another important factor is curvature, which is the rate of change of slope angle or aspect in a specific direction (i.e., topographic convergence or divergence). Based on both models, landslides were most likely to occur on concave slopes and least likely to occur on flat slopes which aligns with Asmare [90]. The evaluation of the distance to the fault demonstrated that landslides were most likely to occur in the distance class of 1500–2000 m to a fault and least likely in a distance of 3000 m or more, also consistent with Pourghasemi et al. [89].
Both models predicted that the highest frequency of landslides was found on Entisols and the lowest frequencies on Inceptisols. Entisols are young soils with mainly weak or incipient development [91]. They are highly susceptible to landslides in the study area as they are young and immature, and improper construction of roads on this type of soil causes serious issues.
Landslides occurred most likely on pastures (fuzzy ANP model) or semi-dense forests (fuzzy TOPSIS model). In contrast, farming land and agricultural land classes were less likely to be exposed to landslides. Higher rainfalls were associated with landslides, especially the 700–800 mm class versus the 485–500 mm class. With increasing rainfall, the probability of landslides’ occurrence increased. In other words, rainfall weakens the bond between the soil mass and the rock by eroding and washing away the topsoil on the slope’s surface. Landslides are more likely to occur as the shear strength of the rock and soil mass decreases [88].
One of the most important causes of landslides is the underlying geology. Landslides were most likely to occur on dark gray shales (fuzzy ANP model) or low-level valley terraces (fuzzy TOPSIS model). Conversely, the occurrence was low on Orbit Olin limestone formations (fuzzy ANP model) and Upper Cretaceous formations (fuzzy TOPSIS model). Rosly et al. [92] concluded that areas covered by shale interbedded with sandstone are more prone to landslides occurrence. In fact, shale contains a high amount of clay and is classified as a highly plastic soil characterized by pore water pressure that increases with rainfall. The amount of infiltration and consequently matric suction are decreased, and, finally, the shear strength of the soil is diminished, all of which make landslides likely [92].
We discussed the FLTOPSIS method and showed that it outperformed the FLANP methods in assessing landslide susceptibility. As TOPSIS is an easily understandable and programmable calculation technique, it is more popular and has therefore been widely used by researchers in some fields of study. In fact, it can account simultaneously for various criteria with different units of measurement [93], and therefore overcome the weak points of fuzzy logic including normalization and compatibility between the weights [94]. Additionally, TOPSIS has attempted to combine MCDMs with other methods such as fuzzy theory to solve uncertainty and ambiguity relating to expert judgement [95].
The ANP method is simple, realistic, flexible, and cost-effective to use, and it can create transparency in the decision-making process [96]. Balogun et al. [97] claimed that ANP cannot model comparison judgments well because of the uncertainty entailed in a model based on human preference. Moreover, its applicability has been reported by Alilou et al. [98] when evaluating watershed health by combining it with fuzzy logic FLANN.
As for study limitations, it needs to be noted that the FLTOPSIS method is not applicable to solving hierarchical issues because a hierarchical system is not considered in this method. Another limitation concerning the ANP method is the fact that questionnaires need to be completed and the reliability of the estimated weights depends on the evaluation by experts.
6. Conclusions
We applied a combination of fuzzy logic with MCDM approaches, including TOPSIS, FLTOPSIS, ANP, and FLANP, to map landslide susceptibility for the Saqqez-Marivan mountain road of Kurdistan Province, Iran. We constructed a database consisting of eleven conditioning factors and a landslide inventory map, using 70% of the 100 observed landslides to generate susceptibility maps and 30% for validation of the methods. In summary, the key achievements and findings of this research are as follows:
- The three most significant factors influencing landslide occurrence were distance to the road, rainfall, and soil type.
- Our methodology concluded that the FLTOPSIS method (AUC = 0.983) outperformed the FLANP (AUC = 0.938) for predicting landslides in the study area. We conclude that FLTOPSIS is better at solving uncertainty and ambiguity in judgement operations than FLANP.
- FLTOPSIS, thus far an infrequently used method in landslide susceptibility assessment, constitutes a promising and innovative technique for creating susceptibility maps in other landslide-prone areas, although further testing is warranted.
- Local government agencies can implement the findings of this research to manage and plan land development in susceptible landslide areas strategically.
- In the future, we recommend combining fuzzy logic with other MCDM methods, such as ELECTRE, VI-KORE, and ELECTRE III, and comparing the results to determine which combination achieves the most reliable landslide susceptibility map.
Author Contributions
R.T., H.S., M.A., S.M.B., M.H., A.S., E.H.A., I.D.W. and S.S.C. contributed equally to the work; R.T., H.S., M.A., M.H., A.S. and I.D.W. collected field data and conducted the landslide susceptibility analysis; S.M.B., E.H.A. and S.S.C. provided critical comments in planning this paper and edited the manuscript. All the authors discussed the results and edited the manuscript. All authors have read and agreed to the published version of the manuscript.
Funding
This research was funded by the University of Kurdistan, Iran, based on three grants number 01-9-19724 4469, 01-9-22595, and 00-9-27618.
Institutional Review Board Statement
Not applicable.
Informed Consent Statement
Not applicable.
Acknowledgments
The authors thank the University of Kurdistan, Iran, and Universiti Teknologi Malaysia (UTM) for preparing this international collaboration for the scientific sharing experience.
Conflicts of Interest
The authors declare no conflict of interest.
References
- Mukherjee, M.; Abhinay, K.; Rahman, M.M.; Yangdhen, S.; Sen, S.; Adhikari, B.R.; Nianthi, R.; Sachdev, S.; Shaw, R. Extent and evaluation of critical infrastructure, the status of resilience and its future dimensions in South Asia. Prog. Disaster Sci. 2023, 17, 100275. [Google Scholar] [CrossRef]
- Hungr, O.; Leroueil, S.; Picarelli, L. The Varnes classification of landslide types, an update. Landslides 2014, 11, 167–194. [Google Scholar] [CrossRef]
- Alamgir, M.; Campbell, M.J.; Sloan, S.; Goosem, M.; Clements, G.R.; Mahmoud, M.I.; Laurance, W.F. Economic, socio-political and environmental risks of road development in the tropics. Curr. Biol. 2017, 27, R1130–R1140. [Google Scholar] [CrossRef] [PubMed]
- Kanwar, N.; Kuniyal, J.C. Vulnerability assessment of forest ecosystems focusing on climate change, hazards and anthropogenic pressures in the cold desert of Kinnaur district, northwestern Indian Himalaya. J. Earth Syst. Sci. 2022, 131, 51. [Google Scholar] [CrossRef]
- Gecchele, G.; Ceccato, R.; Gastaldi, M. Road network vulnerability analysis: Case study considering travel demand and accessibility changes. J. Transp. Eng. Part A Syst. 2019, 145, 05019004. [Google Scholar] [CrossRef]
- Lacroix, P.; Handwerger, A.L.; Bièvre, G. Life and death of slow-moving landslides. Nat. Rev. Earth Environ. 2020, 1, 404–419. [Google Scholar] [CrossRef]
- Fang, K.; Tang, H.; Li, C.; Su, X.; An, P.; Sun, S. Centrifuge modelling of landslides and landslide hazard mitigation: A review. Geosci. Front. 2022, 14, 101493. [Google Scholar] [CrossRef]
- Ado, M.; Amitab, K.; Maji, A.K.; Jasińska, E.; Gono, R.; Leonowicz, Z.; Jasiński, M. Landslide susceptibility mapping using machine learning: A literature survey. Remote Sens. 2022, 14, 3029. [Google Scholar] [CrossRef]
- Xu, Y.; George, D.L.; Kim, J.; Lu, Z.; Riley, M.; Griffin, T.; de la Fuente, J. Landslide monitoring and runout hazard assessment by integrating multi-source remote sensing and numerical models: An application to the Gold Basin landslide complex, northern Washington. Landslides 2021, 18, 1131–1141. [Google Scholar] [CrossRef]
- Liu, Q.; Tang, A.; Huang, D.; Huang, Z.; Zhang, B.; Xu, X. Total probabilistic measure for the potential risk of regional roads exposed to landslides. Reliab. Eng. Syst. Saf. 2022, 228, 108822. [Google Scholar] [CrossRef]
- Pantelidis, L. A critical review of highway slope instability risk assessment systems. Bull. Eng. Geol. Environ. 2011, 70, 395–400. [Google Scholar] [CrossRef]
- Pierson, L.A.; Van Vickle, R. Rockfall Hazard Rating System: Participant’s Manual; Federal Highway Administration: Washington, DC, USA, 1993. [Google Scholar]
- Budetta, P. Assessment of rockfall risk along roads. Nat. Hazards Earth Syst. Sci. 2004, 4, 71–81. [Google Scholar] [CrossRef]
- Mavrouli, O.; Corominas, J.; Ibarbia, I.; Alonso, N.; Jugo, I.; Ruiz, J.; Luzuriaga, S.; Navarro, J.A. Integrated risk assessment due to slope instabilities in the roadway network of Gipuzkoa, Basque Country. Nat. Hazards Earth Syst. Sci. 2019, 19, 399–419. [Google Scholar] [CrossRef]
- Pregnolato, M.; Ford, A.; Wilkinson, S.M.; Dawson, R.J. The impact of flooding on road transport: A depth-disruption function. Transp. Res. Part D Transp. Environ. 2017, 55, 67–81. [Google Scholar] [CrossRef]
- Chamorro, A.; Echaveguren, T.; Allen, E.; Contreras, M.; Cartes, P.; Contreras, M.; Jimenez, G.; Pattillo, C.; De Solminihac, H.; Vargas, J. Risk Management System for Road Networks Exposed to Natural Hazards. In Lifelines 2022; ASCE American Society of Civil Engineers: Reston, VA, USA, 2022; pp. 166–177. [Google Scholar]
- Mattsson, L.-G.; Jenelius, E. Vulnerability and resilience of transport systems–A discussion of recent research. Transp. Res. Part A Policy Pract. 2015, 81, 16–34. [Google Scholar] [CrossRef]
- Ghorbanzadeh, O.; Gholamnia, K.; Ghamisi, P. The application of ResU-net and OBIA for landslide detection from multi-temporal sentinel-2 images. Big Earth Data 2022. [CrossRef]
- Shahabi, H.; Hashim, M. Landslide susceptibility mapping using GIS-based statistical models and Remote sensing data in tropical environment. Sci. Rep. 2015, 5, 9899. [Google Scholar] [CrossRef]
- Park, C.-J.; Kim, S.-Y.; Nguyen, M.V. Fuzzy TOPSIS application to rank determinants of employee retention in construction companies: South Korean case. Sustainability 2021, 13, 5787. [Google Scholar] [CrossRef]
- Wang, Y.-M.; Elhag, T.M. Fuzzy TOPSIS method based on alpha level sets with an application to bridge risk assessment. Expert Syst. Appl. 2006, 31, 309–319. [Google Scholar] [CrossRef]
- Olson, D.L. Comparison of weights in TOPSIS models. Math. Comput. Model. 2004, 40, 721–727. [Google Scholar] [CrossRef]
- Abo-Sinna, M.A.; Amer, A.H. Extensions of TOPSIS for multi-objective large-scale nonlinear programming problems. Appl. Math. Comput. 2005, 162, 243–256. [Google Scholar] [CrossRef]
- Cheng, S.; Chan, C.W.; Huang, G.H. An integrated multi-criteria decision analysis and inexact mixed integer linear programming approach for solid waste management. Eng. Appl. Artif. Intell. 2003, 16, 543–554. [Google Scholar] [CrossRef]
- Opricovic, S.; Tzeng, G.-H. Compromise solution by MCDM methods: A comparative analysis of VIKOR and TOPSIS. Eur. J. Oper. Res. 2004, 156, 445–455. [Google Scholar] [CrossRef]
- Pham, Q.B.; Achour, Y.; Ali, S.A.; Parvin, F.; Vojtek, M.; Vojteková, J.; Al-Ansari, N.; Achu, A.; Costache, R.; Khedher, K.M. A comparison among fuzzy multi-criteria decision making, bivariate, multivariate and machine learning models in landslide susceptibility mapping. Geomat. Nat. Hazards Risk 2021, 12, 1741–1777. [Google Scholar] [CrossRef]
- Dano, U.L.; Balogun, A.-L.; Matori, A.-N.; Wan Yusouf, K.; Abubakar, I.R.; Said Mohamed, M.A.; Aina, Y.A.; Pradhan, B. Flood susceptibility mapping using GIS-based analytic network process: A case study of Perlis, Malaysia. Water 2019, 11, 615. [Google Scholar] [CrossRef]
- Abedi Gheshlaghi, H.; Feizizadeh, B.; Blaschke, T. GIS-based forest fire risk mapping using the analytical network process and fuzzy logic. J. Environ. Plan. Manag. 2020, 63, 481–499. [Google Scholar] [CrossRef]
- Zeraatkar, Z.; Siuki, A.K.; Shahidi, A. Delineation of the Areas with Potential Land Subsidence Using the Analytic Network Process (Case Study: Birjand Aquifer, Iran). Geogr. Nat. Resour. 2021, 42, 290–295. [Google Scholar] [CrossRef]
- Alizadeh, M.; Ngah, I.; Hashim, M.; Pradhan, B.; Pour, A.B. A hybrid analytic network process and artificial neural network (ANP-ANN) model for urban earthquake vulnerability assessment. Remote Sens. 2018, 10, 975. [Google Scholar] [CrossRef]
- Swetha, T.; Gopinath, G. Landslides susceptibility assessment by analytical network process: A case study for Kuttiyadi river basin (Western Ghats, Southern India). SN Appl. Sci. 2020, 2, 1776. [Google Scholar] [CrossRef]
- Neaupane, K.M.; Piantanakulchai, M. Analytic network process model for landslide hazard zonation. Eng. Geol. 2006, 85, 281–294. [Google Scholar] [CrossRef]
- Kavzoglu, T.; Kutlug Sahin, E.; Colkesen, I. An assessment of multivariate and bivariate approaches in landslide susceptibility mapping: A case study of Duzkoy district. Nat. Hazards 2015, 76, 471–496. [Google Scholar] [CrossRef]
- El-Rashidy, R.A.; Grant-Muller, S.M. An assessment method for highway network vulnerability. J. Transp. Geogr. 2014, 34, 34–43. [Google Scholar] [CrossRef]
- Shano, L.; Raghuvanshi, T.K.; Meten, M. Landslide susceptibility evaluation and hazard zonation techniques—A review. Geoenvironmental Disasters 2020, 7, 18. [Google Scholar] [CrossRef]
- Bui, D.T.; Pradhan, B.; Lofman, O.; Revhaug, I.; Dick, O.B. Spatial prediction of landslide hazards in Hoa Binh province (Vietnam): A comparative assessment of the efficacy of evidential belief functions and fuzzy logic models. CATENA 2012, 96, 28–40. [Google Scholar]
- Pradhan, B.; Mansor, S.; Pirasteh, S.; Buchroithner, M.F. Landslide hazard and risk analyses at a landslide prone catchment area using statistical based geospatial model. Int. J. Remote Sens. 2011, 32, 4075–4087. [Google Scholar] [CrossRef]
- He, Q.; Shahabi, H.; Shirzadi, A.; Li, S.; Chen, W.; Wang, N.; Chai, H.; Bian, H.; Ma, J.; Chen, Y. Landslide spatial modelling using novel bivariate statistical based Naïve Bayes, RBF Classifier, and RBF Network machine learning algorithms. Sci. Total Environ. 2019, 663, 1–15. [Google Scholar] [CrossRef]
- Sameen, M.I.; Pradhan, B.; Lee, S. Application of convolutional neural networks featuring Bayesian optimization for landslide susceptibility assessment. CATENA 2020, 186, 104249. [Google Scholar] [CrossRef]
- Saleem, N.; Huq, M.E.; Twumasi, N.Y.D.; Javed, A.; Sajjad, A. Parameters derived from and/or used with digital elevation models (DEMs) for landslide susceptibility mapping and landslide risk assessment: A review. ISPRS Int. J. Geo Inf. 2019, 8, 545. [Google Scholar] [CrossRef]
- Zhang, W.; Li, H.; Han, L.; Chen, L.; Wang, L. Slope stability prediction using ensemble learning techniques: A case study in Yunyang County, Chongqing, China. J. Rock Mech. Geotech. Eng. 2022, 14, 1089–1099. [Google Scholar] [CrossRef]
- Cordeira, J.M.; Stock, J.; Dettinger, M.D.; Young, A.M.; Kalansky, J.F.; Ralph, F.M. A 142-year climatology of northern California landslides and atmospheric rivers. Bull. Am. Meteorol. Soc. 2019, 100, 1499–1509. [Google Scholar] [CrossRef]
- Mavrouli, O.; Corominas, J. Vulnerability of simple reinforced concrete buildings to damage by rockfalls. Landslides 2010, 7, 169–180. [Google Scholar] [CrossRef]
- Antwi-Agyakwa, K.T.; Afenyo, M.K.; Angnuureng, D.B. Know to Predict, Forecast to Warn: A Review of Flood Risk Prediction Tools. Water 2023, 15, 427. [Google Scholar] [CrossRef]
- Guzzetti, F.; Carrara, A.; Cardinali, M.; Reichenbach, P. Landslide hazard evaluation: A review of current techniques and their application in a multi-scale study, Central Italy. Geomorphology 1999, 31, 181–216. [Google Scholar] [CrossRef]
- Devara, M.; Tiwari, A.; Dwivedi, R. Landslide susceptibility mapping using MT-InSAR and AHP enabled GIS-based multi-criteria decision analysis. Geomat. Nat. Hazards Risk 2021, 12, 675–693. [Google Scholar] [CrossRef]
- Asadi, M.; Goli Mokhtari, L.; Shirzadi, A.; Shahabi, H.; Bahrami, S. A comparison study on the quantitative statistical methods for spatial prediction of shallow landslides (case study: Yozidar-Degaga Route in Kurdistan Province, Iran). Environ. Earth Sci. 2022, 81, 51. [Google Scholar] [CrossRef]
- Shen, H.; Huang, F.; Fan, X.; Shahabi, H.; Shirzadi, A.; Wang, D.; Peng, C.; Zhao, X.; Chen, W. Improving the performance of artificial intelligence models using the rotation forest technique for landslide susceptibility mapping. Int. J. Environ. Sci. Technol. 2022, 1–16. [Google Scholar] [CrossRef]
- Kavzoglu, T.; Sahin, E.K.; Colkesen, I. Landslide susceptibility mapping using GIS-based multi-criteria decision analysis, support vector machines, and logistic regression. Landslides 2014, 11, 425–439. [Google Scholar] [CrossRef]
- Kilicoglu, C. Investigation of the effects of approaches used in the production of training and validation data sets on the accuracy of landslide susceptibility mapping models: Samsun (Turkey) example. Arab. J. Geosci. 2021, 14, 2106. [Google Scholar] [CrossRef]
- Akinci, H.; Kilicoglu, C.; Dogan, S. Random forest-based landslide susceptibility mapping in coastal regions of Artvin, Turkey. ISPRS Int. J. Geo Inf. 2020, 9, 553. [Google Scholar] [CrossRef]
- Pham, B.T.; Tien Bui, D.; Dholakia, M.; Prakash, I.; Pham, H.V. A comparative study of least square support vector machines and multiclass alternating decision trees for spatial prediction of rainfall-induced landslides in a tropical cyclones area. Geotech. Geol. Eng. 2016, 34, 1807–1824. [Google Scholar] [CrossRef]
- Razavizadeh, S.; Solaimani, K.; Massironi, M.; Kavian, A. Mapping landslide susceptibility with frequency ratio, statistical index, and weights of evidence models: A case study in northern Iran. Environ. Earth Sci. 2017, 76, 499. [Google Scholar] [CrossRef]
- Saha, S.; Roy, J.; Pradhan, B.; Hembram, T.K. Hybrid ensemble machine learning approaches for landslide susceptibility mapping using different sampling ratios at East Sikkim Himalayan, India. Adv. Space Res. 2021, 68, 2819–2840. [Google Scholar] [CrossRef]
- Shirzadi, A.; Solaimani, K.; Roshan, M.H.; Kavian, A.; Chapi, K.; Shahabi, H.; Keesstra, S.; Ahmad, B.B.; Bui, D.T. Uncertainties of prediction accuracy in shallow landslide modeling: Sample size and raster resolution. CATENA 2019, 178, 172–188. [Google Scholar] [CrossRef]
- Kornejady, A.; Ownegh, M.; Rahmati, O.; Bahremand, A. Landslide susceptibility assessment using three bivariate models considering the new topo-hydrological factor: HAND. Geocarto Int. 2018, 33, 1155–1185. [Google Scholar] [CrossRef]
- Pourghasemi, H.R.; Pradhan, B.; Gokceoglu, C. Application of fuzzy logic and analytical hierarchy process (AHP) to landslide susceptibility mapping at Haraz watershed, Iran. Nat. Hazards 2012, 63, 965–996. [Google Scholar] [CrossRef]
- Gautam, P.; Kubota, T.; Sapkota, L.M.; Shinohara, Y. Landslide susceptibility mapping with GIS in high mountain area of Nepal: A comparison of four methods. Environ. Earth Sci. 2021, 80, 359. [Google Scholar] [CrossRef]
- Pradhan, B.; Lee, S. Landslide susceptibility assessment and factor effect analysis: Backpropagation artificial neural networks and their comparison with frequency ratio and bivariate logistic regression modelling. Environ. Model. Softw. 2010, 25, 747–759. [Google Scholar] [CrossRef]
- Su, Q.; Zhang, J.; Zhao, S.; Wang, L.; Liu, J.; Guo, J. Comparative assessment of three nonlinear approaches for landslide susceptibility mapping in a coal mine area. ISPRS Int. J. Geo Inf. 2017, 6, 228. [Google Scholar] [CrossRef]
- Moosavi, V.; Niazi, Y. Development of hybrid wavelet packet-statistical models (WP-SM) for landslide susceptibility mapping. Landslides 2016, 13, 97–114. [Google Scholar] [CrossRef]
- Jiao, Y.; Zhao, D.; Ding, Y.; Liu, Y.; Xu, Q.; Qiu, Y.; Liu, C.; Liu, Z.; Zha, Z.; Li, R. Performance evaluation for four GIS-based models purposed to predict and map landslide susceptibility: A case study at a World Heritage site in Southwest China. CATENA 2019, 183, 104221. [Google Scholar] [CrossRef]
- Kim, J.-C.; Lee, S.; Jung, H.-S.; Lee, S. Landslide susceptibility mapping using random forest and boosted tree models in Pyeong-Chang, Korea. Geocarto Int. 2018, 33, 1000–1015. [Google Scholar] [CrossRef]
- Park, I.; Lee, S. Spatial prediction of landslide susceptibility using a decision tree approach: A case study of the Pyeongchang area, Korea. Int. J. Remote Sens. 2014, 35, 6089–6112. [Google Scholar] [CrossRef]
- Hwang, C.-L.; Yoon, K.; Hwang, C.-L.; Yoon, K. Methods for multiple attribute decision making. In Multiple Attribute Decision Making: Methods and Applications A State-of-The-Art Survey; Springer: Berlin/Heidelberg, Germany, 1981; pp. 58–191. [Google Scholar]
- Gupta, S.; Soni, U.; Kumar, G. Green supplier selection using multi-criterion decision making under fuzzy environment: A case study in automotive industry. Comput. Ind. Eng. 2019, 136, 663–680. [Google Scholar] [CrossRef]
- Taherdoost, H.; Brard, A. Analyzing the process of supplier selection criteria and methods. Procedia Manuf. 2019, 32, 1024–1034. [Google Scholar] [CrossRef]
- Yu, C.; Shao, Y.; Wang, K.; Zhang, L. A group decision making sustainable supplier selection approach using extended TOPSIS under interval-valued Pythagorean fuzzy environment. Expert Syst. Appl. 2019, 121, 1–17. [Google Scholar] [CrossRef]
- Zulqarnain, R.M.; Xin, X.L.; Siddique, I.; Asghar Khan, W.; Yousif, M.A. TOPSIS method based on correlation coefficient under pythagorean fuzzy soft environment and its application towards green supply chain management. Sustainability 2021, 13, 1642. [Google Scholar] [CrossRef]
- Sahin, B.; Yip, T.L.; Tseng, P.-H.; Kabak, M.; Soylu, A. An application of a fuzzy TOPSIS multi-criteria decision analysis algorithm for dry bulk carrier selection. Information 2020, 11, 251. [Google Scholar] [CrossRef]
- Haddad, A.N.; da Costa, B.B.; de Andrade, L.S.; Hammad, A.; Soares, C.A. Application of fuzzy-TOPSIS method in supporting supplier selection with focus on HSE criteria: A case study in the oil and gas industry. Infrastructures 2021, 6, 105. [Google Scholar] [CrossRef]
- Chen, C.-T. Extensions of the TOPSIS for group decision-making under fuzzy environment. Fuzzy Sets Syst. 2000, 114, 1–9. [Google Scholar] [CrossRef]
- Wei, G.-W. GRA method for multiple attribute decision making with incomplete weight information in intuitionistic fuzzy setting. Knowl. Based Syst. 2010, 23, 243–247. [Google Scholar] [CrossRef]
- Saaty, T.L. Decisions with the analytic network process (ANP). In Proceedings of the ISAHP 1996, Vancouver, BC, Canada, 12–15 July 1996; Volume 96. [Google Scholar]
- Leung, L.C.; Lam, K.C.; Cao, D. Implementing the balanced scorecard using the analytic hierarchy process & the analytic network process. J. Oper. Res. Soc. 2006, 57, 682–691. [Google Scholar]
- Yalcin, A.; Reis, S.; Aydinoglu, A.; Yomralioglu, T. A GIS-based comparative study of frequency ratio, analytical hierarchy process, bivariate statistics and logistics regression methods for landslide susceptibility mapping in Trabzon, NE Turkey. CATENA 2011, 85, 274–287. [Google Scholar] [CrossRef]
- Youssef, A.M.; Pradhan, B.; Sefry, S.A. Flash flood susceptibility assessment in Jeddah city (Kingdom of Saudi Arabia) using bivariate and multivariate statistical models. Environ. Earth Sci. 2016, 75, 12. [Google Scholar] [CrossRef]
- Cheng, E.W.; Li, H. Application of ANP in process models: An example of strategic partnering. Build. Environ. 2007, 42, 278–287. [Google Scholar] [CrossRef]
- Feizizadeh, B.; Jankowski, P.; Blaschke, T. A GIS based spatially-explicit sensitivity and uncertainty analysis approach for multi-criteria decision analysis. Comput. Geosci. 2014, 64, 81–95. [Google Scholar] [CrossRef] [PubMed]
- Soeters, R.; Van Westen, C. Slope instability recognition, analysis and zonation. Landslides Investig. Mitig. 1996, 247, 129–177. [Google Scholar]
- Lucchese, L.V.; de Oliveira, G.G.; Pedrollo, O.C. Mamdani fuzzy inference systems and artificial neural networks for landslide susceptibility mapping. Nat. Hazards 2021, 106, 2381–2405. [Google Scholar] [CrossRef]
- Goetz, J.; Brenning, A.; Petschko, H.; Leopold, P. Evaluating machine learning and statistical prediction techniques for landslide susceptibility modeling. Comput. Geosci. 2015, 81, 1–11. [Google Scholar] [CrossRef]
- Chen, W.; Zhang, S.; Li, R.; Shahabi, H. Performance evaluation of the GIS-based data mining techniques of best-first decision tree, random forest, and naïve Bayes tree for landslide susceptibility modeling. Sci. Total Environ. 2018, 644, 1006–1018. [Google Scholar] [CrossRef]
- Tsakiris, G. Practical application of risk and hazard concepts in proactive planning. Eur. Water 2007, 19, 47–56. [Google Scholar]
- Cao, Y.; Yin, K.; Alexander, D.E.; Zhou, C. Using an extreme learning machine to predict the displacement of step-like landslides in relation to controlling factors. Landslides 2016, 13, 725–736. [Google Scholar] [CrossRef]
- Ahmed, B. Landslide susceptibility mapping using multi-criteria evaluation techniques in Chittagong Metropolitan Area, Bangladesh. Landslides 2015, 12, 1077–1095. [Google Scholar] [CrossRef]
- Chowdhuri, I.; Pal, S.C.; Saha, A.; Chakrabortty, R.; Roy, P. Mapping of earthquake hotspot and coldspot zones for identifying potential landslide hotspot areas in the Himalayan region. Bull. Eng. Geol. Environ. 2022, 81, 257. [Google Scholar] [CrossRef]
- Huang, W.; Ding, M.; Li, Z.; Yu, J.; Ge, D.; Liu, Q.; Yang, J. Landslide susceptibility mapping and dynamic response along the Sichuan-Tibet transportation corridor using deep learning algorithms. CATENA 2023, 222, 106866. [Google Scholar] [CrossRef]
- Pourghasemi, H.R.; Jirandeh, A.G.; Pradhan, B.; Xu, C.; Gokceoglu, C. Landslide susceptibility mapping using support vector machine and GIS at the Golestan Province, Iran. J. Earth Syst. Sci. 2013, 122, 349–369. [Google Scholar] [CrossRef]
- Asmare, D. Application and validation of AHP and FR methods for landslide susceptibility mapping around choke mountain, northwestern ethiopia. Sci. Afr. 2023, 19, e01470. [Google Scholar] [CrossRef]
- Vittori Antisari, L.; Trenti, W.; Buscaroli, A.; Falsone, G.; Vianello, G.; De Feudis, M. Pedodiversity and Organic Matter Stock of Soils Developed on Sandstone Formations in the Northern Apennines (Italy). Land 2023, 12, 79. [Google Scholar] [CrossRef]
- Rosly, M.H.; Mohamad, H.M.; Bolong, N.; Harith, N.S.H. An Overview: Relationship of Geological Condition and Rainfall with Landslide Events at East Malaysia. Trends Sci. 2022, 19, 3464. [Google Scholar] [CrossRef]
- Ekmekçioğlu, M.; Kaya, T.; Kahraman, C. Fuzzy multicriteria disposal method and site selection for municipal solid waste. Waste Manag. 2010, 30, 1729–1736. [Google Scholar] [CrossRef] [PubMed]
- Chu, T.-C. Selecting plant location via a fuzzy TOPSIS approach. Int. J. Adv. Manuf. Technol. 2002, 20, 859–864. [Google Scholar] [CrossRef]
- Salih, M.M.; Zaidan, B.; Zaidan, A.; Ahmed, M.A. Survey on fuzzy TOPSIS state-of-the-art between 2007 and 2017. Comput. Oper. Res. 2019, 104, 207–227. [Google Scholar] [CrossRef]
- Kaur, P.; Mahanti, N. A fuzzy ANP-based approach for selecting ERP vendors. Int. J. Soft Comput. 2008, 3, 24–32. [Google Scholar]
- Balogun, A.-L.; Sheng, T.Y.; Sallehuddin, M.H.; Aina, Y.A.; Dano, U.L.; Pradhan, B.; Yekeen, S.; Tella, A. Assessment of data mining, multi-criteria decision making and fuzzy-computing techniques for spatial flood susceptibility mapping: A comparative study. Geocarto Int. 2022, 37, 12989–13015. [Google Scholar] [CrossRef]
- Alilou, H.; Rahmati, O.; Singh, V.P.; Choubin, B.; Pradhan, B.; Keesstra, S.; Ghiasi, S.S.; Sadeghi, S.H. Evaluation of watershed health using Fuzzy-ANP approach considering geo-environmental and topo-hydrological criteria. J. Environ. Manag. 2019, 232, 22–36. [Google Scholar] [CrossRef]


Disclaimer/Publisher’s Note: The statements, opinions and data contained in all publications are solely those of the individual author(s) and contributor(s) and not of MDPI and/or the editor(s). MDPI and/or the editor(s) disclaim responsibility for any injury to people or property resulting from any ideas, methods, instructions or products referred to in the content. |
© 2023 by the authors. Licensee MDPI, Basel, Switzerland. This article is an open access article distributed under the terms and conditions of the Creative Commons Attribution (CC BY) license (https://creativecommons.org/licenses/by/4.0/).