Article

LULC Change Effects on Environmental Quality and Ecosystem Services Using EO Data in Two Rural River Basins in Thrace, Greece

1
School of Rural and Surveying Engineering, Aristotle University of Thessaloniki, 54124 Thessaloniki, Greece
2
Civil Engineering Department, Democritus University of Thrace, 69100 Komotini, Greece
*
Authors to whom correspondence should be addressed.
Land 2023, 12(6), 1140; https://doi.org/10.3390/land12061140
Submission received: 28 April 2023 / Revised: 21 May 2023 / Accepted: 24 May 2023 / Published: 28 May 2023

Abstract

:
Rural abandonment and associated rapid urbanization, agricultural intensification, and climate change have been key factors transforming terrestrial landscapes, with significant impacts on the environmental quality and the ecosystem services (ES) provided to human welfare. In this study, two understudied rural river basins located in Thrace, North Greece, were selected to assess changes in landscape pattern, composition, and eco-environmental quality and ecosystem services values (ESV). Cloud-based remote sensing (RS) analyses of multitemporal Landsat imagery in the Google Earth Engine (GEE) platform were applied for multitemporal land use/land cover changes (LULCC) quantification between 1984–2021, along with landscape pattern, eco-environmental quality, and ES assessment. Although ecosystem changes observed were not extensive over this period, eco-environmental quality appeared to be affected due to fragmentation. Preserving the ecosystem’s naturalness can enhance cultural ES to avoid further values loss originating from provisioning ES exploitation. This study highlights the strong connection between landscape configuration and eco-environmental quality, emphasizing the strong impact that anthropogenic activities have on the environment. The monitoring of the effects of LULCC on ecosystem health and the economic value of ES is crucial for the introduction of spatial planning and restoration policies.

1. Introduction

Humans are an integral part of nature whose activities are interwoven with environmental alteration (usually decay) [1,2]. Over time, human progress has had a significant environmental impact, resulting in the overestimation of Earth’s assimilation capacity and the underestimation of humanity’s environmental responsibility towards nature. Population growth and urban sprawl have accelerated the conversion of large areas of natural wealth into arable lands and urban fabric [3,4]. During the last couple of decades, much research has been devoted to ecosystem integrity (i.e., search for reference conditions), fragmentation, and environmental condition assessment [5,6,7,8,9,10,11]. It is widely accepted that land-use change due to intense human activities has provoked noteworthy effects both on the environment and human well-being [6]. Thus, assessment of land use/land cover changes (LULCC) through time can potentially reveal threats to ecosystem health [7] and alteration of ecosystem services (ES) [4]. Mapping of ES is highly relevant as they can be assessed and visualized [10,12] while historical research on LULCC, on a given spatial resolution, provides a framework for ES spatiotemporal analyses and reveals the reasons for environmental naturalness loss.
Remote sensing (RS) can offer complete, wide-coverage information at various scales, so it can be used for ES spatiotemporal analysis as well as for landscape and ecological environmental quality assessment [13]. As such, monitoring LULCC through RS can yield valuable insights into changes in ES values over time in response to landscape transformations. These analyses are now facilitated by advancements in both software and hardware for processing remote sensing data, which provide synoptic and consistent data on landscape composition and structure across space and time.
For example, Google Earth Engine (GEE), a planetary-scale database and data processing platform powered by Google Cloud Computing, contains petabyte-scale remote sensing images and geoscientific datasets while also offering processing capabilities for data fusion and feature extraction processes. Additionally, GEE offers a means for collaborative work on preprocessed datasets, allowing various users to reuse or authenticate the concepts [14]. Furthermore, GEE gives users the opportunity to generate models and apply them in different study areas, through different time periods, using multi-source datasets.
Apart from providing critical information for monitoring LULCC and associated ES changes, RS is an exceptional tool that can be used for ecological environmental quality assessment [13]. RS-based ecological environmental quality indicators and metrics can be used to assess the ecological quality or state of ecosystems. According to EU legislation, the protection of the environment relies on the improvement of ecosystem status, presuming a linkage between ecosystem state and the services they deliver [7]. There are comprehensive methods taking into consideration a multitude of parameters used as indicators to determine the ecological status of an ecosystem. A healthy ecosystem is characterized by sustainable structure, function, and regulation [2]. Implementing a well-established typology using these methods can provide information about these characteristics and help to investigate regional ecosystem quality for the two ecosystem-basins, providing to policy-makers and stakeholders a knowledge base supporting ecological environmental quality and sustainability [15].
However, mapping, assessment and valuing of ES, and monitoring the associated changes across time is not yet a trivial task, partially due to the lack of standardized frameworks adopted by the research community. Costanza et al. [8], 25 years ago, in a first attempt to emphasize the contribution and importance of natural ecosystems to society, came up with an accounting method coupling ecotypes with ES, estimating the values of land cover types and introducing a new perspective in ecosystem assessment by converting their value into comparable units [16]. This old but innovative approach has converted ecosystems and their services into units of the global economy [8], established a common unit system [9], and provided a useful tool for the economy, policy, and decision-making on land use and ecosystem provisioning [6]. Since then, there has been further methodological development so that values of ES could be used as a proxy to economically assess the degradation magnitude in financial loss terms [17]. The European Commission’s working group on Mapping and Assessment of Ecosystems and their Services (MAES), embedded in the European Union’s (EU) Biodiversity Strategy for 2020, delivered a step-by-step handbook guiding scientists and decision-makers to identify, evaluate, and map ecosystems and their services [7,12]. Even though there have been various approaches to ES quantification, the monetary valuation has been considered the most beneficial and promising scope [3,18], bridging the economy with green development [2,19] and sustainable production [20,21]. A set of frameworks, strategies, and policies have been established to assess ecosystems and their services [8,17] while many studies based on this approach have yielded promising results, leading up to the SEEA-EA of JRC [17] setting a new framework for formal ecosystem accounting in a common transnational way. Such a framework can be used to bridge any existing knowledge gap of management authorities and provide valuable information for strategic planning for ES conservation and enhancement.
The aim of this work is to assess the impact of LULCC on ES values in two rural river basins located in northeast Greece, taking advantage of the recent and historical Earth observation (EO) data, using freely available Landsat imagery over the 1984 to 2021 period. Anthropogenic pressures in those two lesser-studied basins are considered intense and prominent in both river basins, making it imperative to study and analyse their impact on regional ecosystem state and quality which can be accomplished through LULC spatiotemporal analysis. The main goal is to bridge the existing knowledge gap and provide managemental valuable information for strategic planning. By implementing a well-established typology, we seek to obtain information about these characteristics and to investigate regional eco-environmental quality. The steps performed were to (1) quantify LULCC based on a cloud-based analysis workflow, (2) assess changes in the eco-environmental quality and landscape pattern, (3) quantify and monitor Ecosystem Services Values (ESV) over time, and (4) provide some hints for land planning and ES conservation in these two basins to maintain the economic and ecological value of the areas.

2. Materials and Methods

To comply with the aim of our study posed above, we followed a series of steps (Figure 1). Initially we generated ecosystem type maps for each time-step, and then we produced maps of the spatial variability of the landscape pattern. Having set the spatial background, two types of analyses took place at the same time; (a) an eco-environmental quality assessment of the study area was conducted and (b) by associating ecosystem types with their respective biomes, we further assessed ESV, functions, and their changes.

2.1. Study Area

The River Basin District of Thrace is located in the north part of the Greek mainland (Figure 2) covering an area of 11.243 km2. The Laspias river basin is a rural peri-urban basin in Xanthi Prefecture (40°59′ N and 24°53′ E) with a surface of 212 km2 and a torrential-like character of the river with intermittent flows. The river springs from the mountain peaks of Rhodope from altitudes ranging to 1300 m, flows through an agricultural plain, and, finally, discharges in the Thracian Sea, a Natura2000 protected site. Geomorphologically, it is a mountainous-agricultural area where 86% of the surface is covered by arable land and nearly 14% of the catchment is mountainous. The river consists of Heavily Modified Water Bodies subject to several pressures such as Landfill, Wastewater Treatment Plant, intense industrial and agricultural activity, and livestock units.
The Lissos river basin, in contrast, is situated in Rhodope Prefecture (41°01′ Nand 25°31′ E) and covers an area of 1486 km2. The river is about 230 km long consisting of both natural and Heavily Modified Water Bodies. It emerges from the mountains of Eastern Rhodope and discharges into the Thracian Sea, while dozens of small rivers and streams enhance the main riverbody. Due to its environmental importance, the main river, from its springs to its estuary, is protected by the Natura2000 Network, and is a National Park hosting a wide variety of habitats. Concerning its geomorphological settings, there are three main terrains in the Lissos catchment, where almost 26% of the total drainage area are mountains, 34% hilly area, and the remaining 40% of the watershed is a lower plain area. Regardless of its natural value, the Lissos river suffers from multiple pressures such as industrial wastes, crop pesticides, and sand extractions, while its riverbed has extensively been settled with embankments.
Comparing both river basins, it is notable that although they are located in the same Basin District and are subject to the same type of pressures and socioeconomic trends, they differ notably in terms of their geomorphological features and land use distribution. While the area of the Laspias river basin is only 212 km2 and mainly consists of agricultural plains and artificial areas, the Lissos river basin is 7 times larger in area and exhibits better distribution and a greater variety of landscape patterns, including mountains, hills, and low plains.

2.2. Earth Observation Data and Preprocessing

The study covered a 37-year period and employed atmospherically corrected Landsat 5 (TM) and Landsat 8 (OLI/TIRS) surface reflectance (SR) products [22] which are available in the GEE platform. These datasets have a 30 m spatial resolution. It should be noted that Landsat 5 and Landsat 8 SR data are generated through algorithms for atmospheric correction and calibration to SR that display minor disparities. To generate SR data from Landsat 8, the Land Surface Reflectance Code (LaSRC) algorithm was employed. This technique involves atmospheric correction using a radiative transfer model, auxiliary atmospheric data sourced from MODIS, and utilizing the coastal aerosol band for aerosol inversion tests [23]. Landsat 5 SRs were obtained via the Landsat Ecosystem Disturbance Adaptive Processing System (LEDAPS) algorithm, which estimates radiative transfer using atmospheric data obtained from MODIS and NCEP [24].
For each time-step of the analysis, three individual median composites were generated over the spring, summer, and autumn months in order to take into account phenological changes within the study area and to identify the optimal season for their identification (Table 1). Clouds and their shadows have been masked from the composite analysis using the quality assessment band of each image. Finally, all seasonal image composites were cropped to the extent of the two river basins, respectively.

2.3. Methodology

2.3.1. Multi-Temporal Ecosystem Types Classification

Ecosystem type maps were developed following an eight class classification scheme for both study areas. The selected classes correspond to the 2nd level of the MAES ecosystem typology, following the “Correspondence between Corine Land Cover classes and ecosystem types” table devised by MAES (2013) [7], taking into account special features of the study area (Table 2).
The ecosystem types classification was performed through an end-to-end processing workflow developed in the GEE platform, using Random Forest (RF), an ensemble machine learning classifier that generates multiple decision trees by selecting a random subset of training samples and variables [25]. Machine learning algorithms have become robust classifiers of EO data over the past decade and have found extensive use for land cover classification due to the high accuracy attained by their use and the minimum requirements related to the statistical nature of the data [26].
In order to develop the RF classifier, samples were generated from visual image interpretation and ancillary geospatial datasets, such as the Copernicus Corine Land Cover 2018 dataset [27]. For each time step, an automated supervised classification model was developed and incorporated in the processing workflow. Spectral information considered included the blue, green, red, Near InfraRed (NIR), ShortWave InfraRed (SWIR) 1, and ShortWave InfraRed 2 bands of the original images. Furthermore, in order to improve the classification performance and highlight any distinct cover within the study area, five spectral indices (NDVI, NDWI, SAVI, NDBI, and GRVI) were calculated (Table 3).
In addition, the Gray Level Co-Occurrence Matrix (GLCM) statistical method was utilized to extract the texture features of the images. This process addresses the problem of “same object with different spectra, different objects with the same spectrum”, improving the classification accuracy of image [32]. In this research, the texture features of contrast were used for enhancing the classification accuracy. Finally, after the automated classification, visual assessment and manual editing followed in order to refine the classification results [33] and improve the reliability of the results.
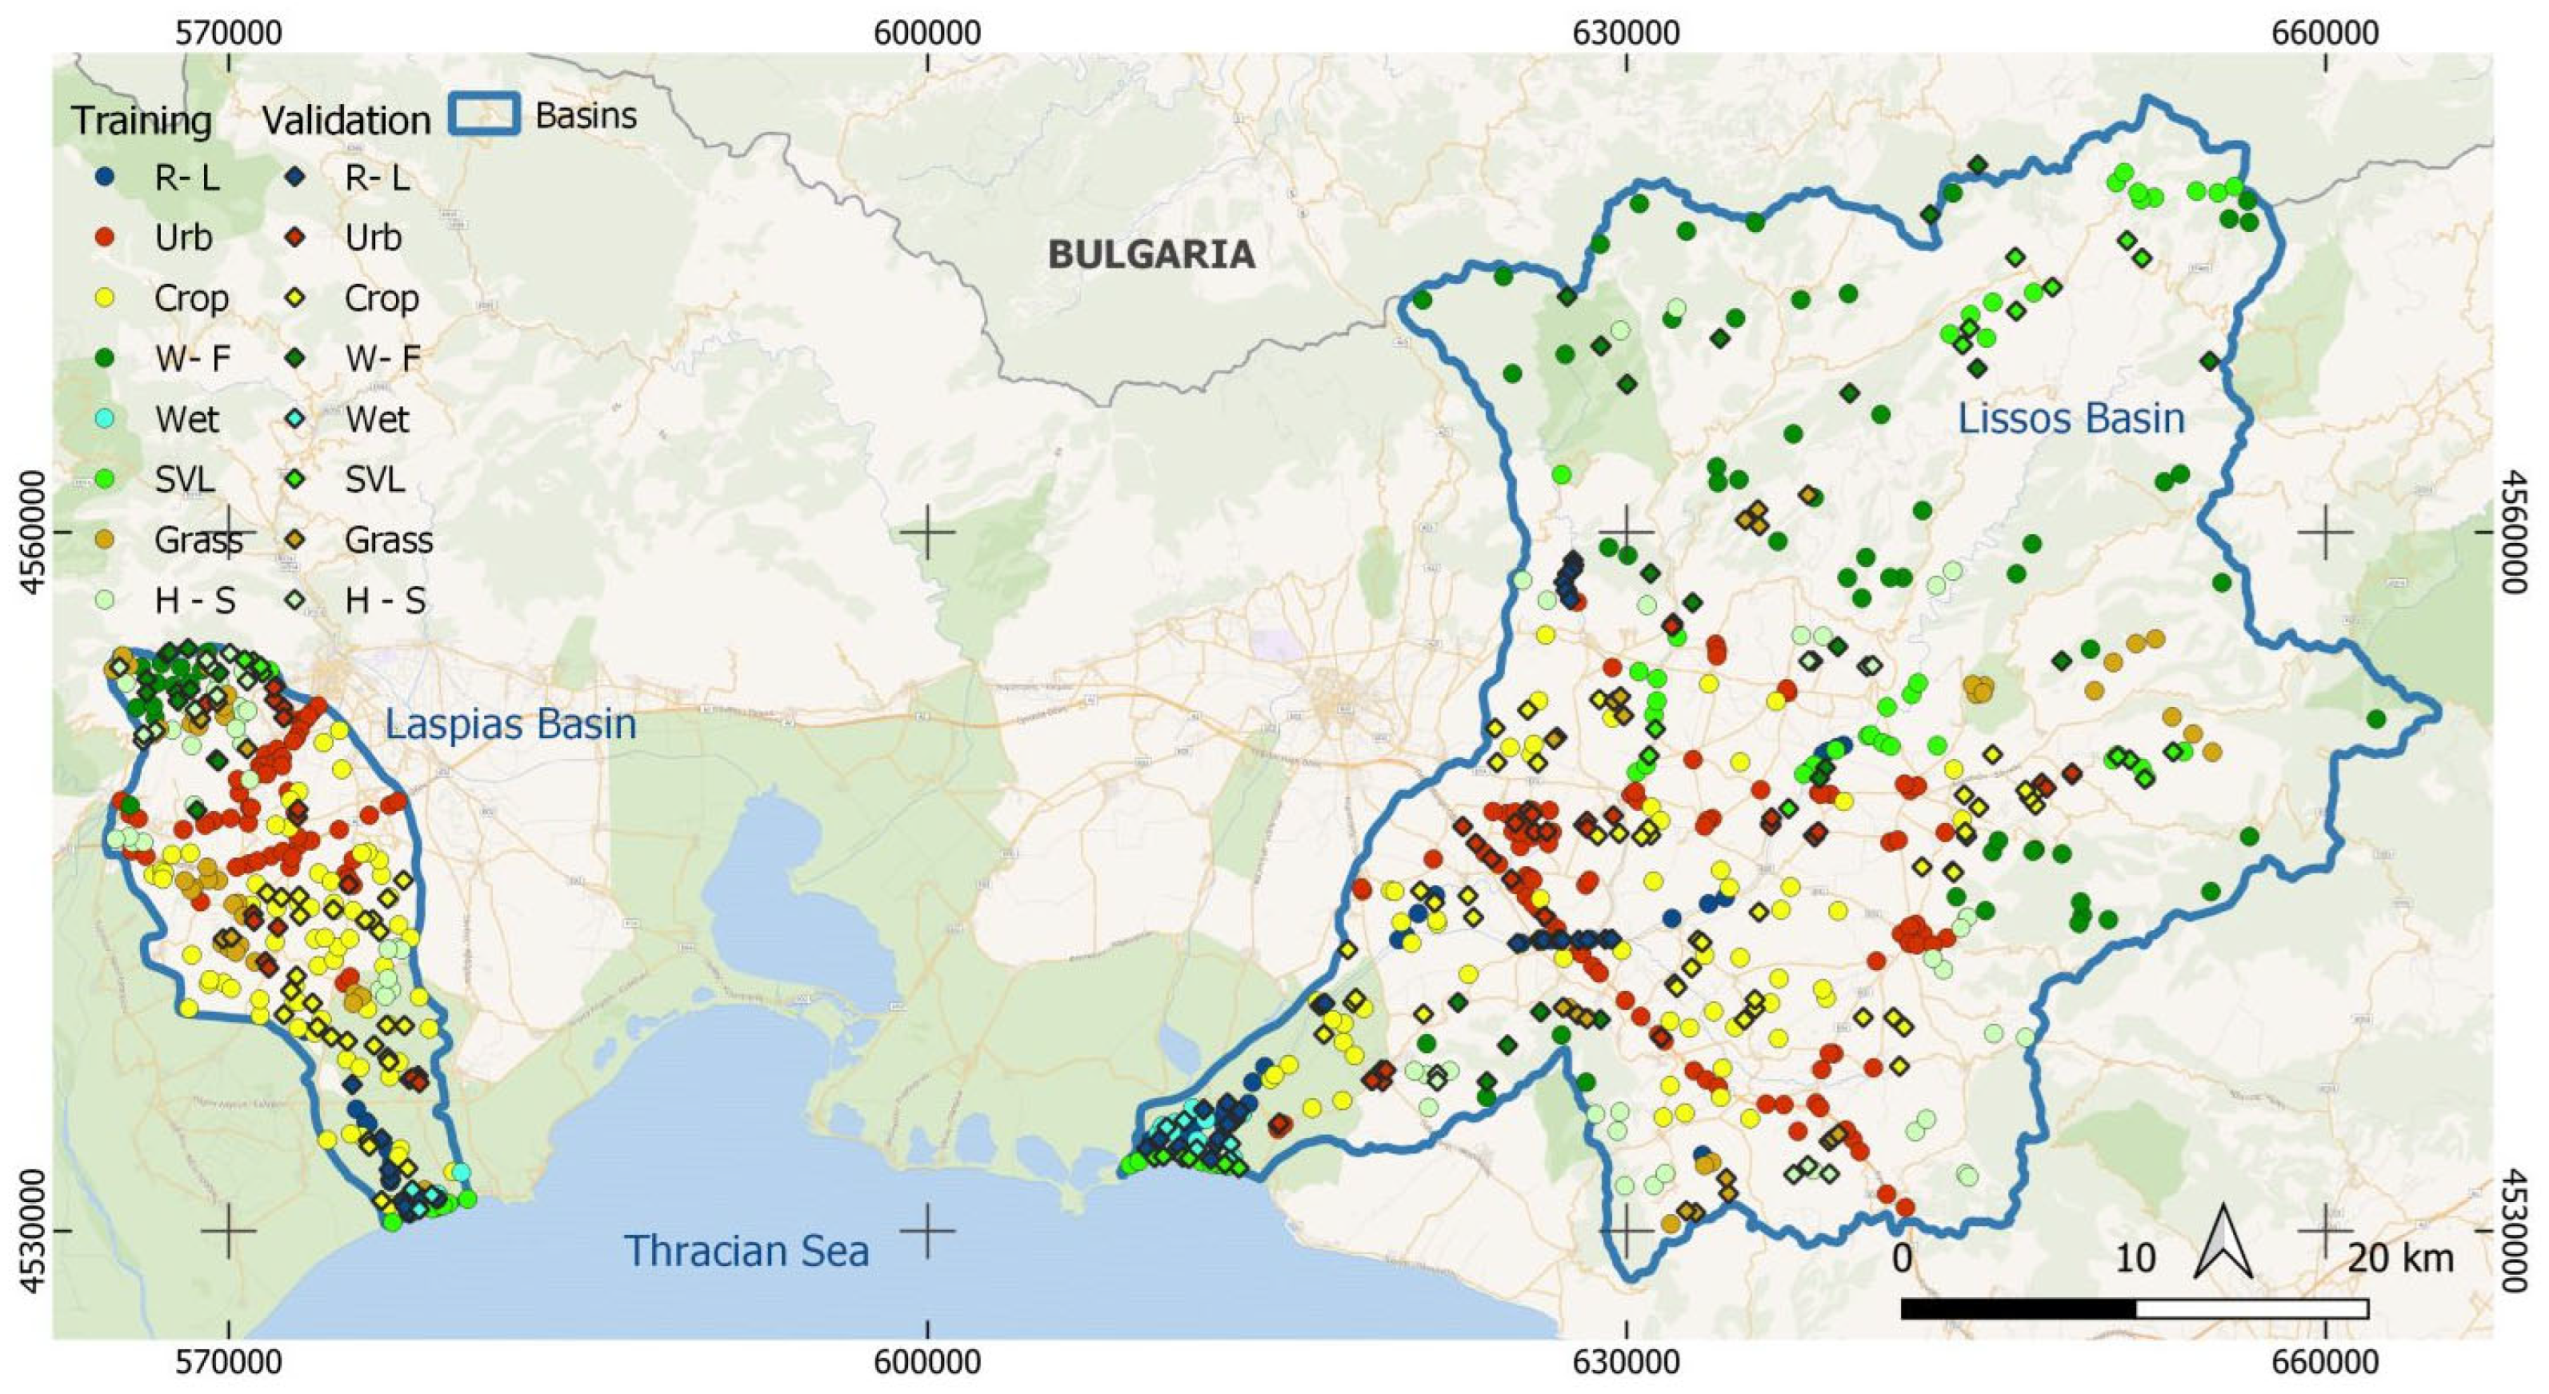
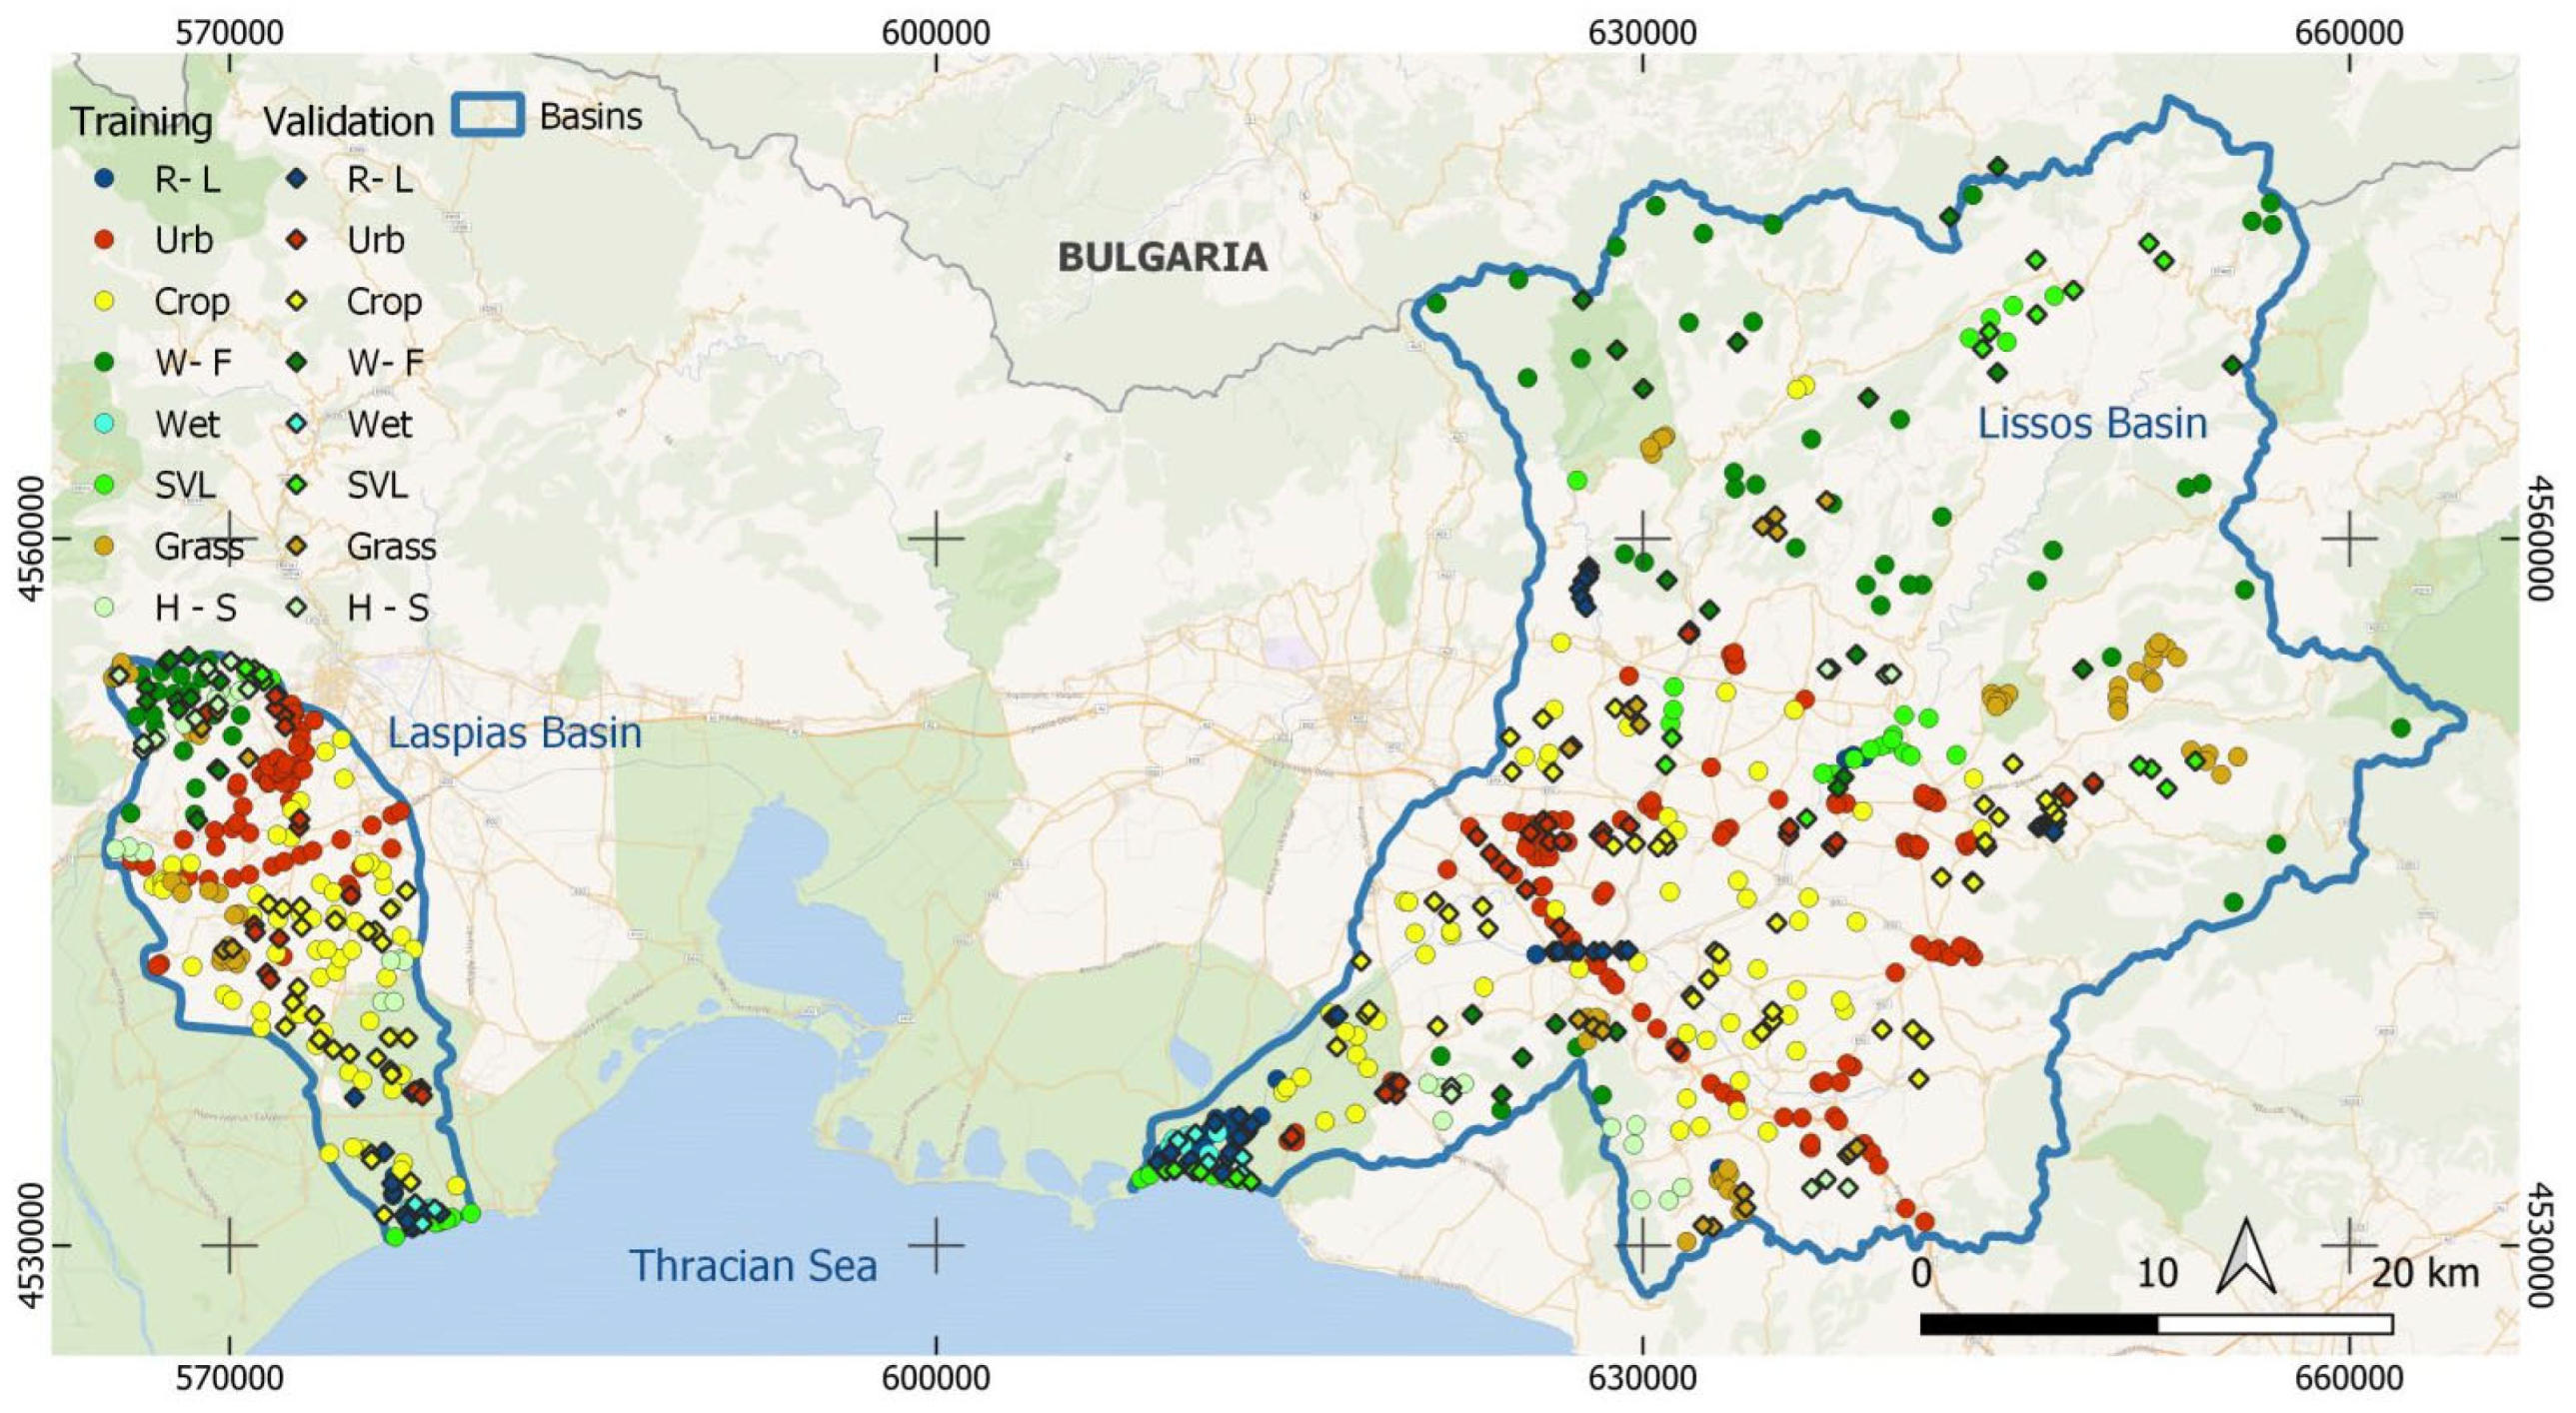
An accuracy assessment was conducted for the 1984, 2004, and 2021 ecosystem type maps, using validation sample points derived from visual interpretation of Google Earth imagery of 2021, ortho and Landsat imagery of 2004, and Landsat imagery of 1984 by an individual expert. A total of 288, 285, and 275 validation points were used for each year to carry out the accuracy assessment (Figure A1, Figure A2 and Figure A3, Appendix B). The error matrix was then implemented in GEE to produce overall accuracy (OA). OA is a simple descriptive statistic that is calculated by dividing the total correct (i.e., the sum of the major diagonal) by the total number of pixels in the error matrix [34].

2.3.2. Landscape Pattern Analysis

Subsequently, based on ecosystem types classification maps, a spatiotemporal analysis of landscape patterns was conducted using the moving window method based on the results of Shannon’s Diversity Index (SHDI) calculation in order to assess the spatial heterogeneity of the two river basins and the overall landscape diversity evolution of the study area. SHDI is a measure of the variability of the composition of an area and is widely used in biodiversity and ecology [13,35]. For the purposes of this study, we used a moving window of 9 × 9 pixels after empirical assessment. The moving window analysis involves cell by cell scanning to determine how the center or focal cell differs from the adjacent cells. The presence of a variety of different surroundings results in a higher value being returned for that region and cell [13]. The moving window’s size is determined after several trials in order to test the impact on the metrics calculation and to enhance the smoothing effect on output maps [36]. The output raster map depicts spatial variability of the landscape pattern. Employing the moving window technique to conduct spatial gradient analysis of landscape patterns can enable the quantification and spatial visualization of the landscape metrics, such as SHDI in a local scale. This, in turn, facilitates the clearer display of the dynamic spatial changes in the landscape pattern and reveals the distinctions in the internal structure of the landscape [32].
SHDI was calculated using the open-source R package “landscape metrics” based on the generated ecosystem type maps from Landsat imagery of 1984, 2004, and 2021 as mentioned in Section 2.3.1. This package employs a structured workflow to compute an elaborated collection of broadly used landscape metrics for categorical landscape patterns, reimplementing the most prevalent metrics from “FRAGSTATS” [13]. For SHDI calculation, the ‘’landscape metrics’’ package uses Equation (1), which takes into account both the number of different land cover classes and their relative abundance within the landscape.
S H D I = i = 1 m P i × ln P i
where m is the number of land cover classes and Pi is the proportion of each land cover class i within the landscape.

2.3.3. Eco-Environmental Quality Assessment

In contrast with single ecological factors, composite indicators are capable of expressing the ecological status of a region in a more comprehensive manner [37]. The remote sensing-based ecological index (RSEI) is constructed by four sub-indicators (Table 4), namely greenness (Normalized Difference Vegetation Index, NDVI), wetness (the third component (wetness) of the tasseled cap transformation, WET), dryness (Normalized Difference Built-Up and Soil Index, NDBSI), and heat (Land Surface Temperature, LST) [15,38].
RSEI = f(Greenness, Wetness, Dryness, Heat)
The traditional methods of constructing RSEI indicators are complex and time-consuming. Thus, calculating RSEI indicators based on the GEE platform can significantly simplify the process.
For this reason, RSEI was calculated using GEE and the summer median composites of Landsat 5 TM and Landsat 8 OLI/TIRS SR datasets for 1984, 2004, and 2021, as shown in Table 4. To couple the four indicators (greenness, wetness, dryness, heat), principal component analysis was utilized. However, due to non-uniform unit and data ranges among the indicators, normalization was required before conducting principal component analysis (Equation (3)) [42,43]. In addition, to enable the spatiotemporal analysis of the eco-environmental quality of the study area, RSEI obtained from the PCA was normalized as well using Equations (4) and (5):
N I i = I i I min I max I min
RSEI 0 = PCA f Greeness ,   Wetness ,   Dryness ,   Heat
RSEI = RSEI 0 RSEI 0 min RSEI 0 max RSEI 0 min
where NIi is the outcome of image normalization; Ii is the numerical pixel value of the image; Imax and Imin are the maximum and minimum values of the image pixel, respectively; PCA is principal component analysis, and ƒ is the set of functions to perform PCA; and RSEI0max and RSEI0min are the maximum and minimum values of RSEI0, respectively [15]. Based on other studies [38], we divided the RSEI into five categories at equal intervals: poor (0–0.2), fair (0.2–0.4), moderate (0.4–0.6), good (0.6–0.8), and excellent (0.8–1).

2.3.4. Ecosystem Services Assessment

The 8 ecosystem types (MAES Level 2) that emerged from the multi-temporal ecosystem types classification were reassigned to 7 (out of a list of 16) equivalent biomes devised by Costanza et al. [44]. This approach, despite being quite old, is very applicable due to its simplicity, so it was used here mostly for correlation purposes and not for the exact services valuation (as an order of magnitude for the changes). The equivalent biomes that were used include Lakes/Rivers, Urban, Cropland, Forest, Wetland, Temperate/Boreal, and Grass/Rangelands. For each ecosystem type, a biome was assigned, except for Grass/Rangelands which corresponded to two different LULC categories (Table 5). The equivalence was not absolute but approximate.

2.3.5. Ecosystem Services Valuation

Although there is a range of applicable approaches for ES valuation, the Basic Transfer Method (BTM), proposed by Costanza et al. [44] as an aggregation method for ecosystem services value, was applied without further adjustments. The method assumes values remain constant over ecosystem types and, compared to similar valuation techniques, is an effortless and straightforward approach for ES evaluation without limitations in data availability [6].
According to the methodology, the ecosystem services values in both study areas were estimated by multiplying the surface area of each ecosystem type (Table 5) with the corresponding value coefficients without parametrization. We preferred to keep the coefficients as expressed in 2007 USD value without further monetary adjustments for two main reasons. Firstly, the methodology has been applied before in Mediterranean environments without modifications especially when used to assess long-term variations and trends [5,45,46], and secondly, the time span of the study is too long to support monetary adjustments. After the 1984 recession, Greece underwent different inflation rates in the Drachmas until it peaked before 2000 when the transition to euros took place (resulting in simultaneous currencies). This was followed by the bank and stock market crash and three memorandums also affecting inflation. Thus, there are so many changes to consider that would make the adjustment complicated.
Ecosystem functions were also estimated by directly adopting the Costanza et al. [8] methodology of average global value of ecosystem services in USD ha−1 yr−1 to depict the temporal variation in ES values. Thus, 14 ecosystem functions were selected based on the characteristics of the current study areas and were classified into three main ecosystem services categories, adopting the Millennium Ecosystem Assessment (MA) classification system [7]. These categories are (a) Provisioning, (b) Regulating and Supporting, and (c) Cultural categories. The de Groot [21] method, which has different pricing systems concerning natural (boosted), semi-natural (decreased), and artificial (zero) biomes, was also calculated for comparison reasons (see Appendix A).

2.3.6. Sensitivity Analysis of Ecosystem Services Values

A Sensitivity Analysis was performed in order to better understand the dynamic relationship between LULC and ESV by investigating how a single change in one LULC type affects the ESV in total. The change corresponds to a ±50% adjustment in the Value Coefficient (VC) of a specific LULC type. This approach was first introduced by Kreuter et al. [47] using a standard economic concept of elasticity [48], described by the following equation:
CS = ( ESV j ESV i ) / ESV i ( VC jk VC ik ) / VC ik
where CS is the coefficient of sensitivity, ESV is the ecosystem services value, and VC is the value coefficient. The “i” and “j” refer to the estimated values before and after the adjustment, respectively, while “k” represents the LULC type. When the equation results in a value greater than unity (CS > 1), then the association of LULC and ESV is considered to be elastic, which means that ESV are sensitive to LULC changes leading to questionable results. Conversely, when the estimated value is lower than unity (CS < 1), the relation of LULC and ESV is inelastic, indicating that LULC changes have a low impact on ESV, leading to more reliable results.
Sensitivity analysis has been applied in numerous scientific researches [49,50,51], while there are studies proposing a simplified or modified version of Equation (5) [52,53,54]. In the framework of this study, the ES valuation was performed using the equivalent biomes assigned to MAES ecosystem types, based on the correspondences indicated in Table 2 and Table 5. Therefore, to avoid any misapprehensions, the sensitivity analysis assessment was also applied, adopting the aforementioned equivalent biomes instead of the LULC types (Tables 11 and 12).

2.3.7. Spatial Distribution of Ecosystem Services Values in Relation to LULC

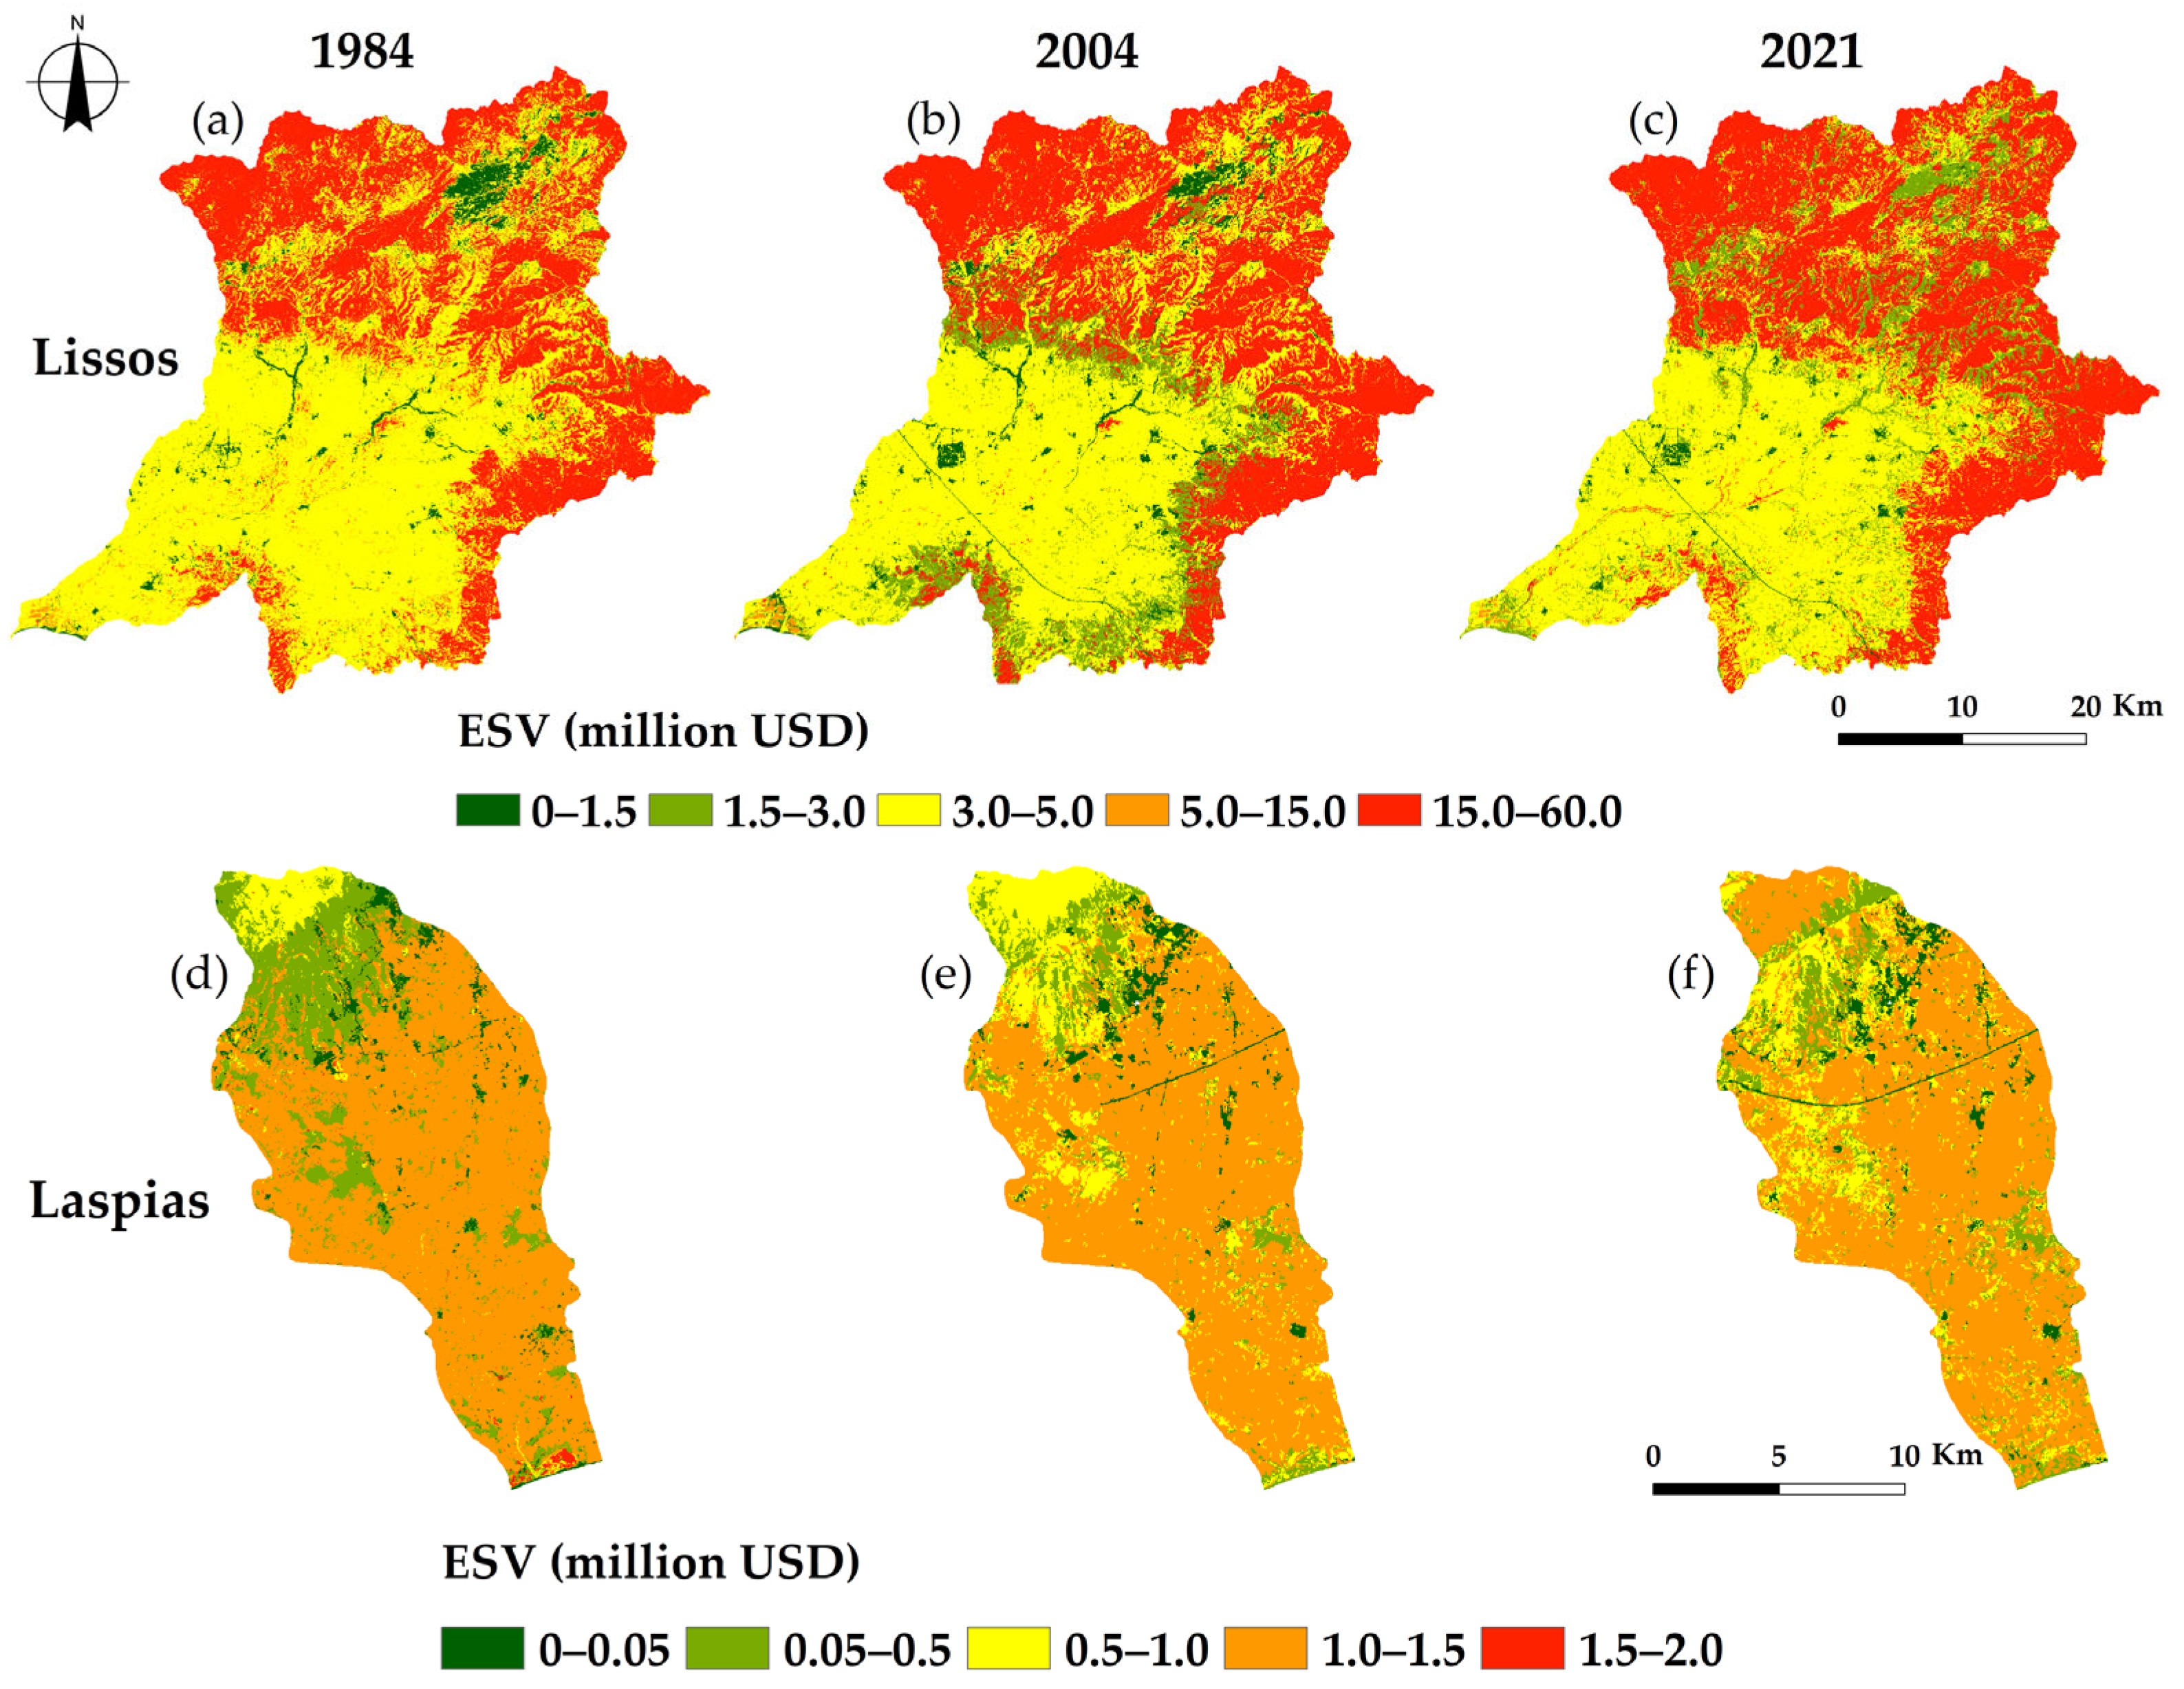
Aiming to spatiotemporally display the changes in ESV relating to LULC patterns, we created 30-m resolution raster maps using the ArcMap 10.8 software. The 30 × 30 resolution cell size was preferred, compared to other cell sizes tested, as it was large enough to distinguishably depict the correlation between ESV and landscape patterns without missing any considerable spatial information. The process was carried out for both river basins and for each time step (1984, 2004, 2021) in order to observe the changes that occurred in the ESV within each river basin, but also to depict the spatial characteristics and differences among the two study areas.
The ESV were divided into five classes: (1) the lower value during the study period (1984–2021) within a river basin, (2–4) intermediate classes with manually distributed intervals that depict the variation in values, and (5) the higher value during the study period within a river basin. Different classification values were assigned to each river basin as they corresponded to different magnitude of ESV.

3. Results

3.1. Landscape Changes

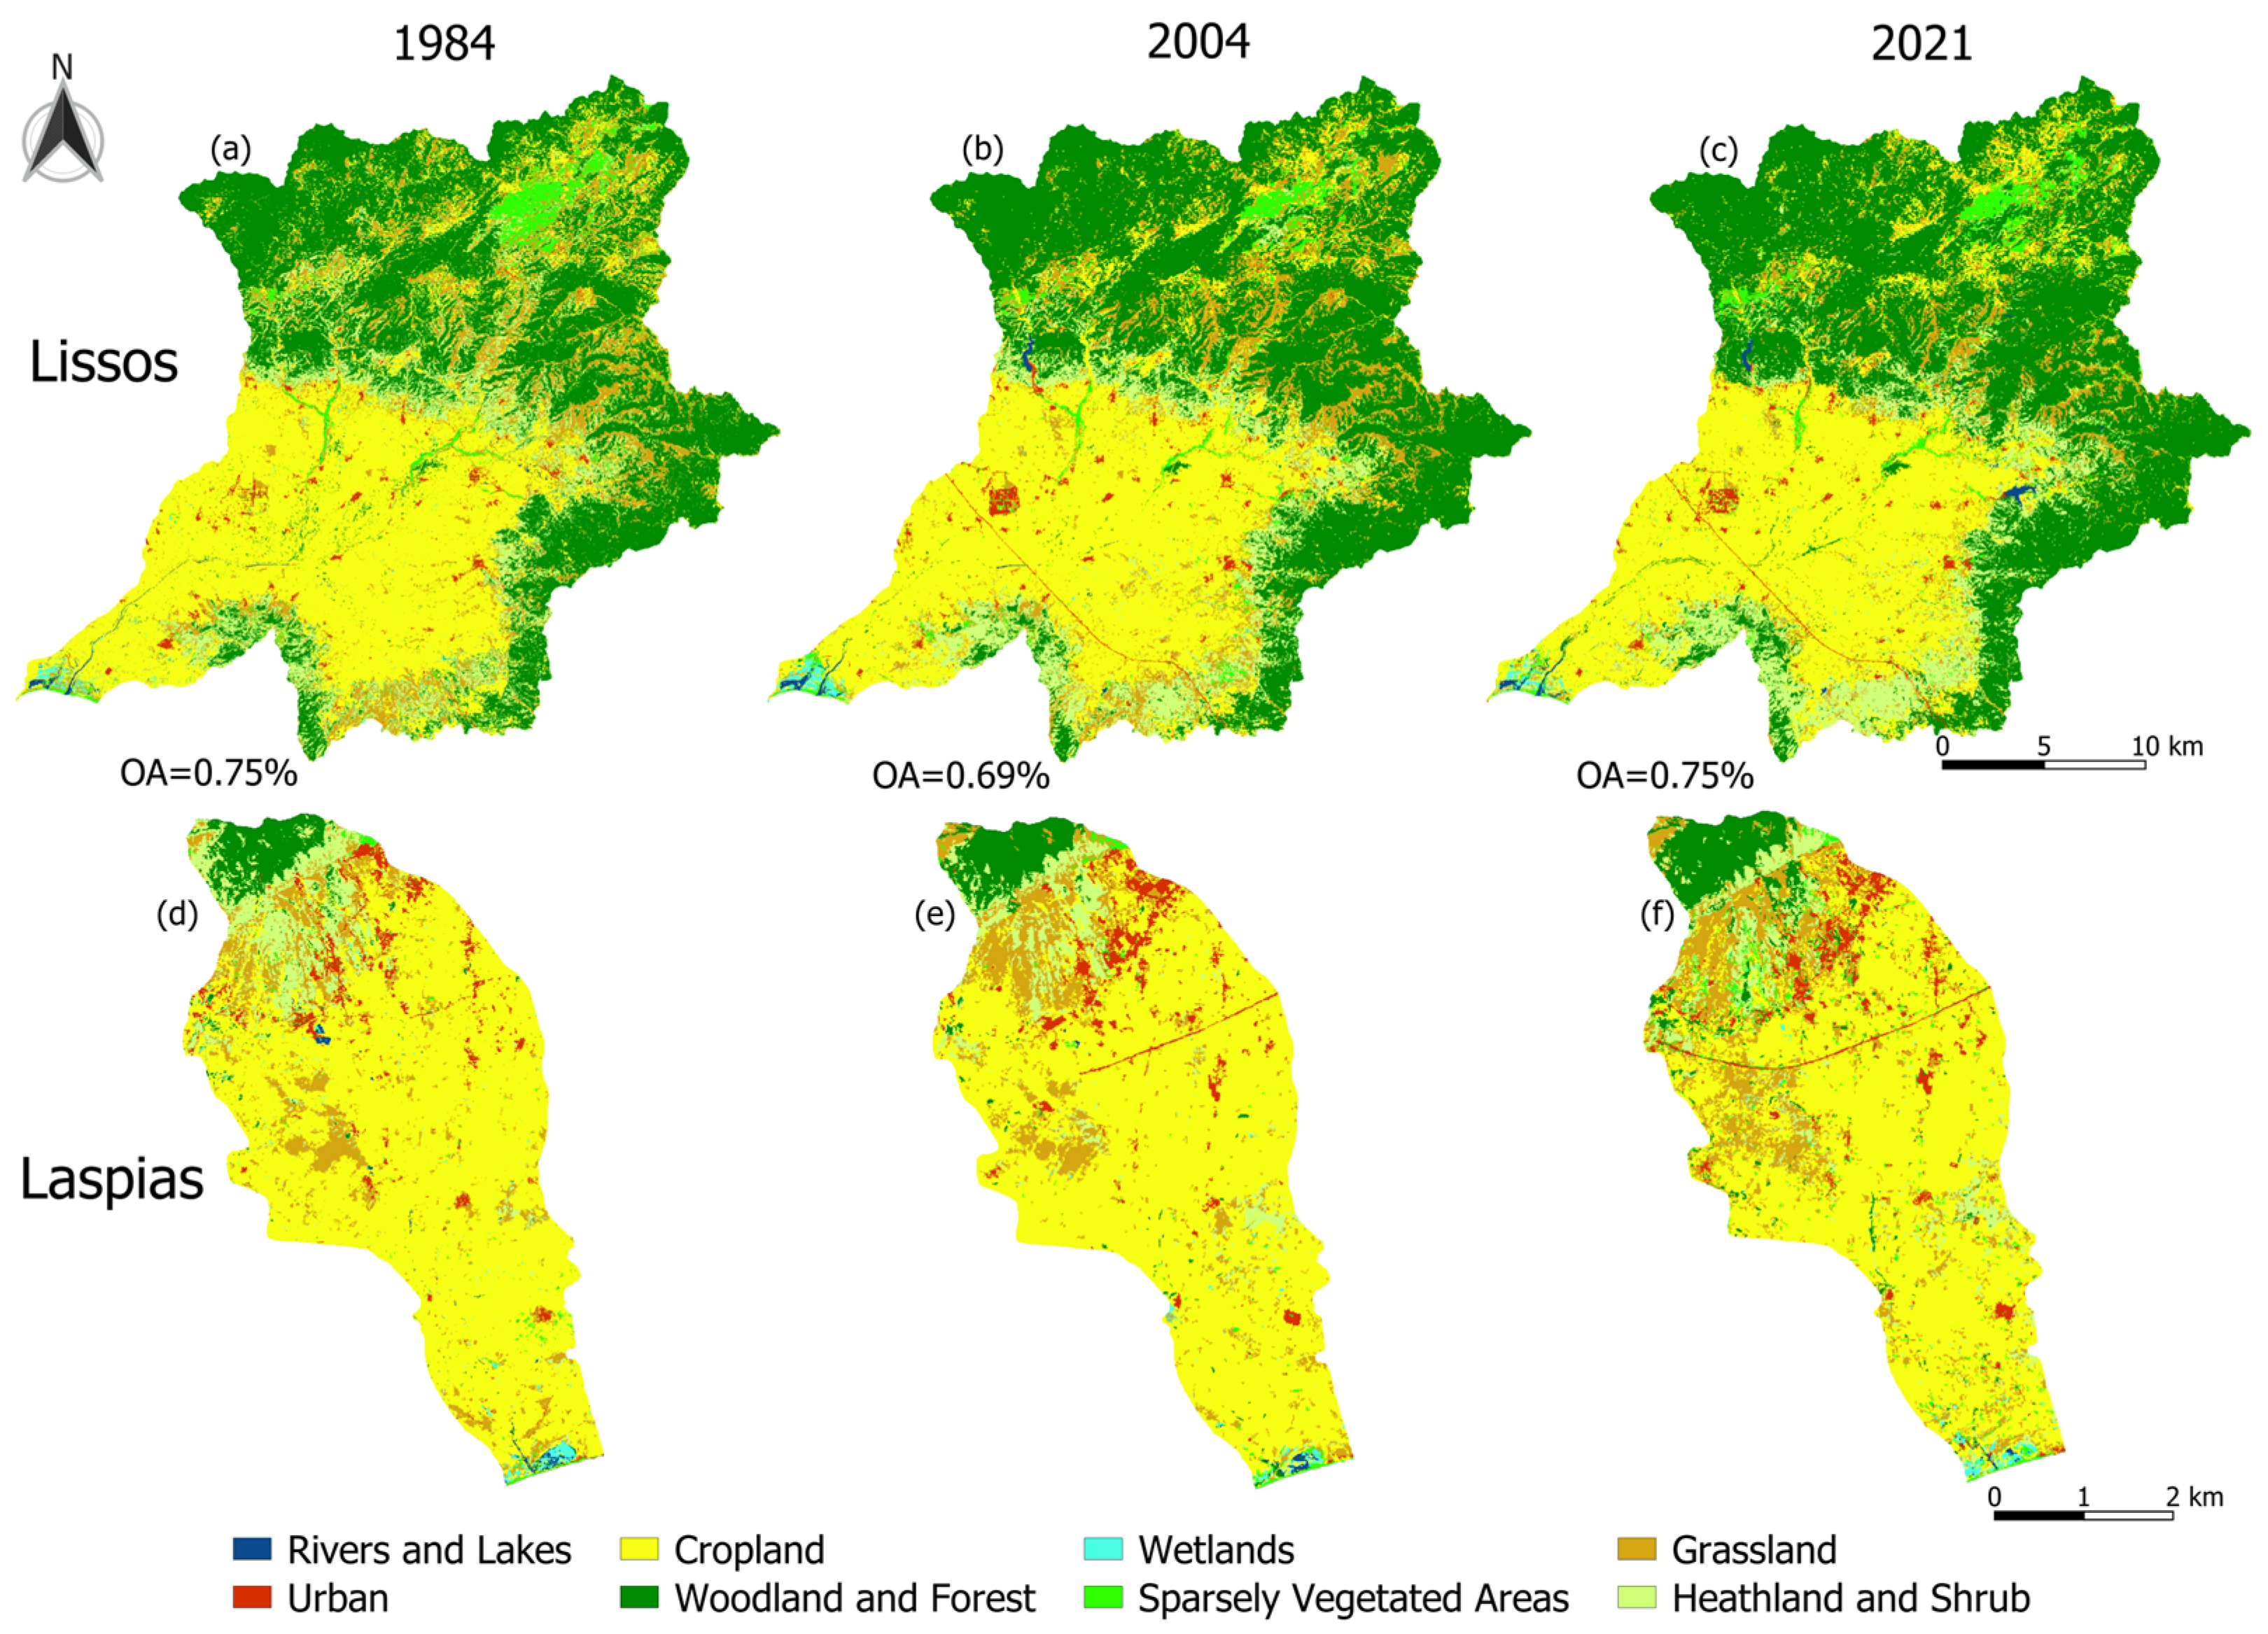
The gradual expansion of the urban fabric along with the preservation of cropland areas and the variation in the grassland cover can be easily seen in Figure 3, which presents the ecosystem type maps generated from the automated supervised classification model.
Figure 4 depicts the LULC change transitions of the Lissos and Laspias basins from 1984 to 2004 and 2004 to 2021. The Lissos basin exhibits a natural and balanced landscape composition. Crop and W–F appear to be the predominant ecosystem types and no major LULC change transitions occur through the study period. However, there is a noticeable reduction in Grass, which has contributed to W–F and H–S increase. In contrast, the Laspias basin is under greater anthropogenic pressures regarding the area extension. Crop and Grass are the predominant ecosystem types present during the study period. Infrastructure construction observed in the northern part of the basin significantly affected landscape composition, leading to landscape fragmentation, Urb and Grass expansion, and a concurrent Crop reduction mainly between 2004 and 2021.
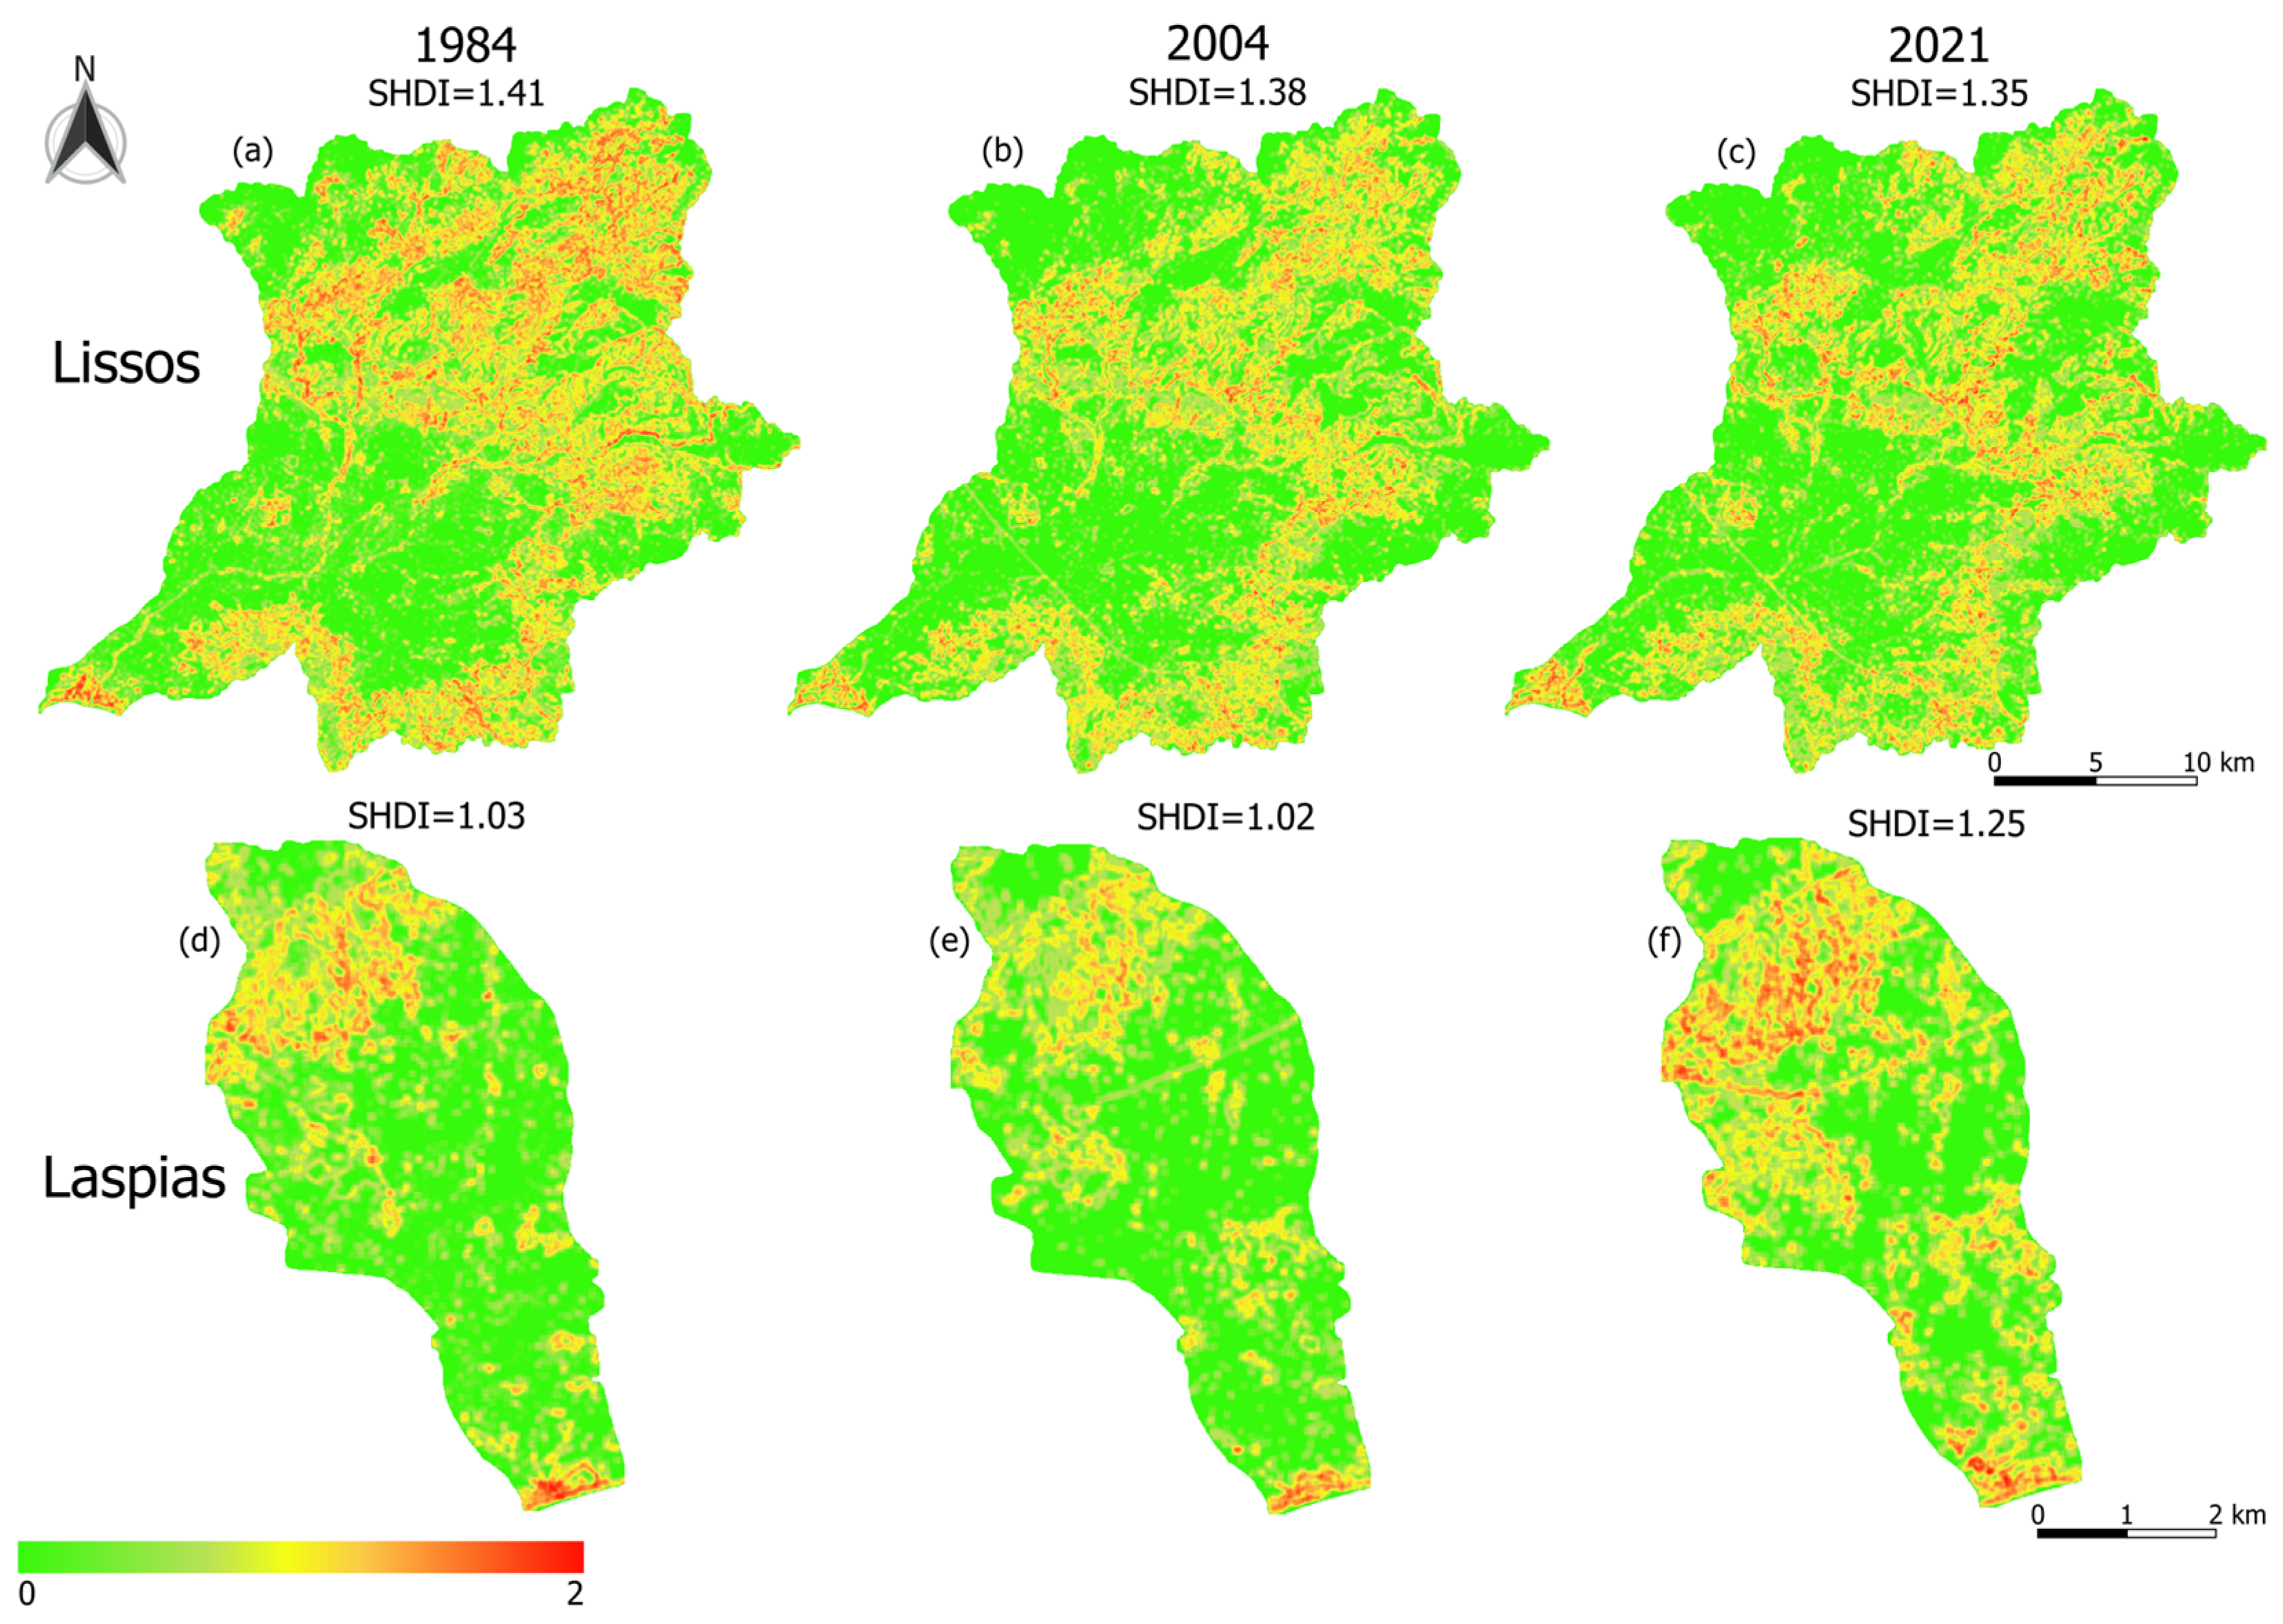
According to the results of the accuracy assessment, the ecosystem type maps classification exhibited an overall accuracy of 0.75% in 1984, 0.69% in 2004, and 0.75% in 2021. Figure 5 depicts the spatial distribution of Shannon’s Diversity Index for the Lissos and Laspias river basins, respectively. The Lissos basin’s landscape heterogeneity appears to be more stable through the study period, showing an overall downward trend with a decrease of 2.8% from 1984 to 2004 and 2.2% from 2004 to 2020, whereas the Laspias basin’s landscape heterogeneity shows an overall upward trend with an increase from 2004 to 2021 of 20.8%.
Based on the findings of eco-environmental quality assessment presented in Table 6, the areas with moderate and good quality increased, whereas the areas with fair quality decreased for both river basins. Poor and excellent quality decreased overall, but there were variations between the time steps, showing an important increase in 2004. Excellent quality in the Laspias basin increased by 4.18%.
As seen in Figure 6, the predominant quality of the Lissos basin is at a “fair” level during the entire study period with no significant variances. The Laspias basin eco-environmental quality shows more variances. In 1984, the eco-environmental quality is at a “fair” level, but in 2021 is at a “moderate” level, indicating an improvement of the eco-environment quality in the area.
Regarding the spatial distribution of RSEI (Figure 6), regions with “excellent” eco-environmental quality are mainly distributed in the north of the two river basins where forest is the main land cover. Regions with “good” eco-environmental quality are mostly forests and shrublands distributed in the north and southeast of the area. “Moderate” and “fair” quality appear in regions where cropland is the predominant land cover at the center of the two river basins. Finally, the “poor” level is seen in the least vegetated areas, such as human infrastructure or sparsely vegetated areas.

3.2. Ecosystem Services Change

The analysis highlighted the ES changes during the time period from 1984 to 2021. Since the research was conducted in two different catchment areas, the results were interpreted separately for each case study.

3.2.1. Lissos River Basin

The analysis of the Lissos river basin revealed an overall decline in ESV of USD −48.57 million (Table 7). The biome that contributed the most to this loss during the first-time step was Wetlands with a rate of −44.3%, while the impact of the Lakes/Rivers (−13.6%), Temperate/Boreal (−5.4%), Grass/Rangelands (−3.9%), and Cropland (−3.7%) categories (Figure 7) was also negative on the overall values alteration. Then, from 2004 to 2021, there was another USD 10.24 million loss (or 1.4%in the sum of ESV), where the main negative contribution was due to the Lakes/Rivers biome by −16.5%, as well as in Grass/Rangelands (−14.2%), Wetlands (−9.3%), and Cropland (−2.0%) biomes. In total, the ecological impacts on the Lissos river basin were, in priority order, due to the decline of the Wetlands biome by −49.5%, followed by Lakes/Rivers (−27.8%), Grass/Rangelands (−17.5%), and finally the Cropland biome (−5.6%).

3.2.2. Laspias River Basin

A decrease in the total ESV over the four decades was also estimated in the Laspias river basin. In particular, the value of ES began at USD 129.3 million in 1984, then dropped (by 8.1%) to USD 118.8 million in 2004 and slightly increased (by 2%) in 2021 to USD 121.2 million. Consequently, the overall change from 1984 to 2021 was negative with a 6.3% decrease, corresponding to a loss of USD 8.14 million (Table 8).
The largest decline over the study period from 1984 to 2004, which contributed almost entirely to the decline in ESV, was presented in Wetlands biome with a percentage change of −58.6%, while equally important was the decline of the Lakes/Rivers category by −50.3% (Figure 8). Following the same trend, in the period from 2004 to 2021, the greatest ESV loss occurred in the Lakes/Rivers biome with a proportion of −57.7%, while the Wetlands category, after its huge decline in previous years, increased significantly by 80.7%. Ultimately, the overall negative change in ESV in the Laspias river basin, from 1984 to 2021, was primarily due to the decline of ESV in Lakes/Rivers, as well as in the Wetlands biome, with a total percentage change of −79% and −25.2%, respectively, with a smaller contribution (−14%) from the Cropland biome.

3.3. Ecosystem Functions Valuation Change

3.3.1. Lissos River Basin

Regarding the ecosystem functions valuation, the applied methodology revealed that from 1984 to 2021 the greatest financial losses occurred in the Regulating and Supporting ES category, which accounted for USD 1.66 million in Disturbance regulation. The greatest ecosystem function loss was observed in Habitat/refugia (−49.5%), which corresponds to the Regulating and supporting category, followed by the Disturbance regulation (−48%), Water supply (−42%) and Cultural (−40%) ecosystem functions. In general, during the study period from 1984 to 2021, the overall change of ecosystem functions showed a drop of USD 1.40 million (−1.9%), while vital ecosystem functions revealed significant loss (Table 9).
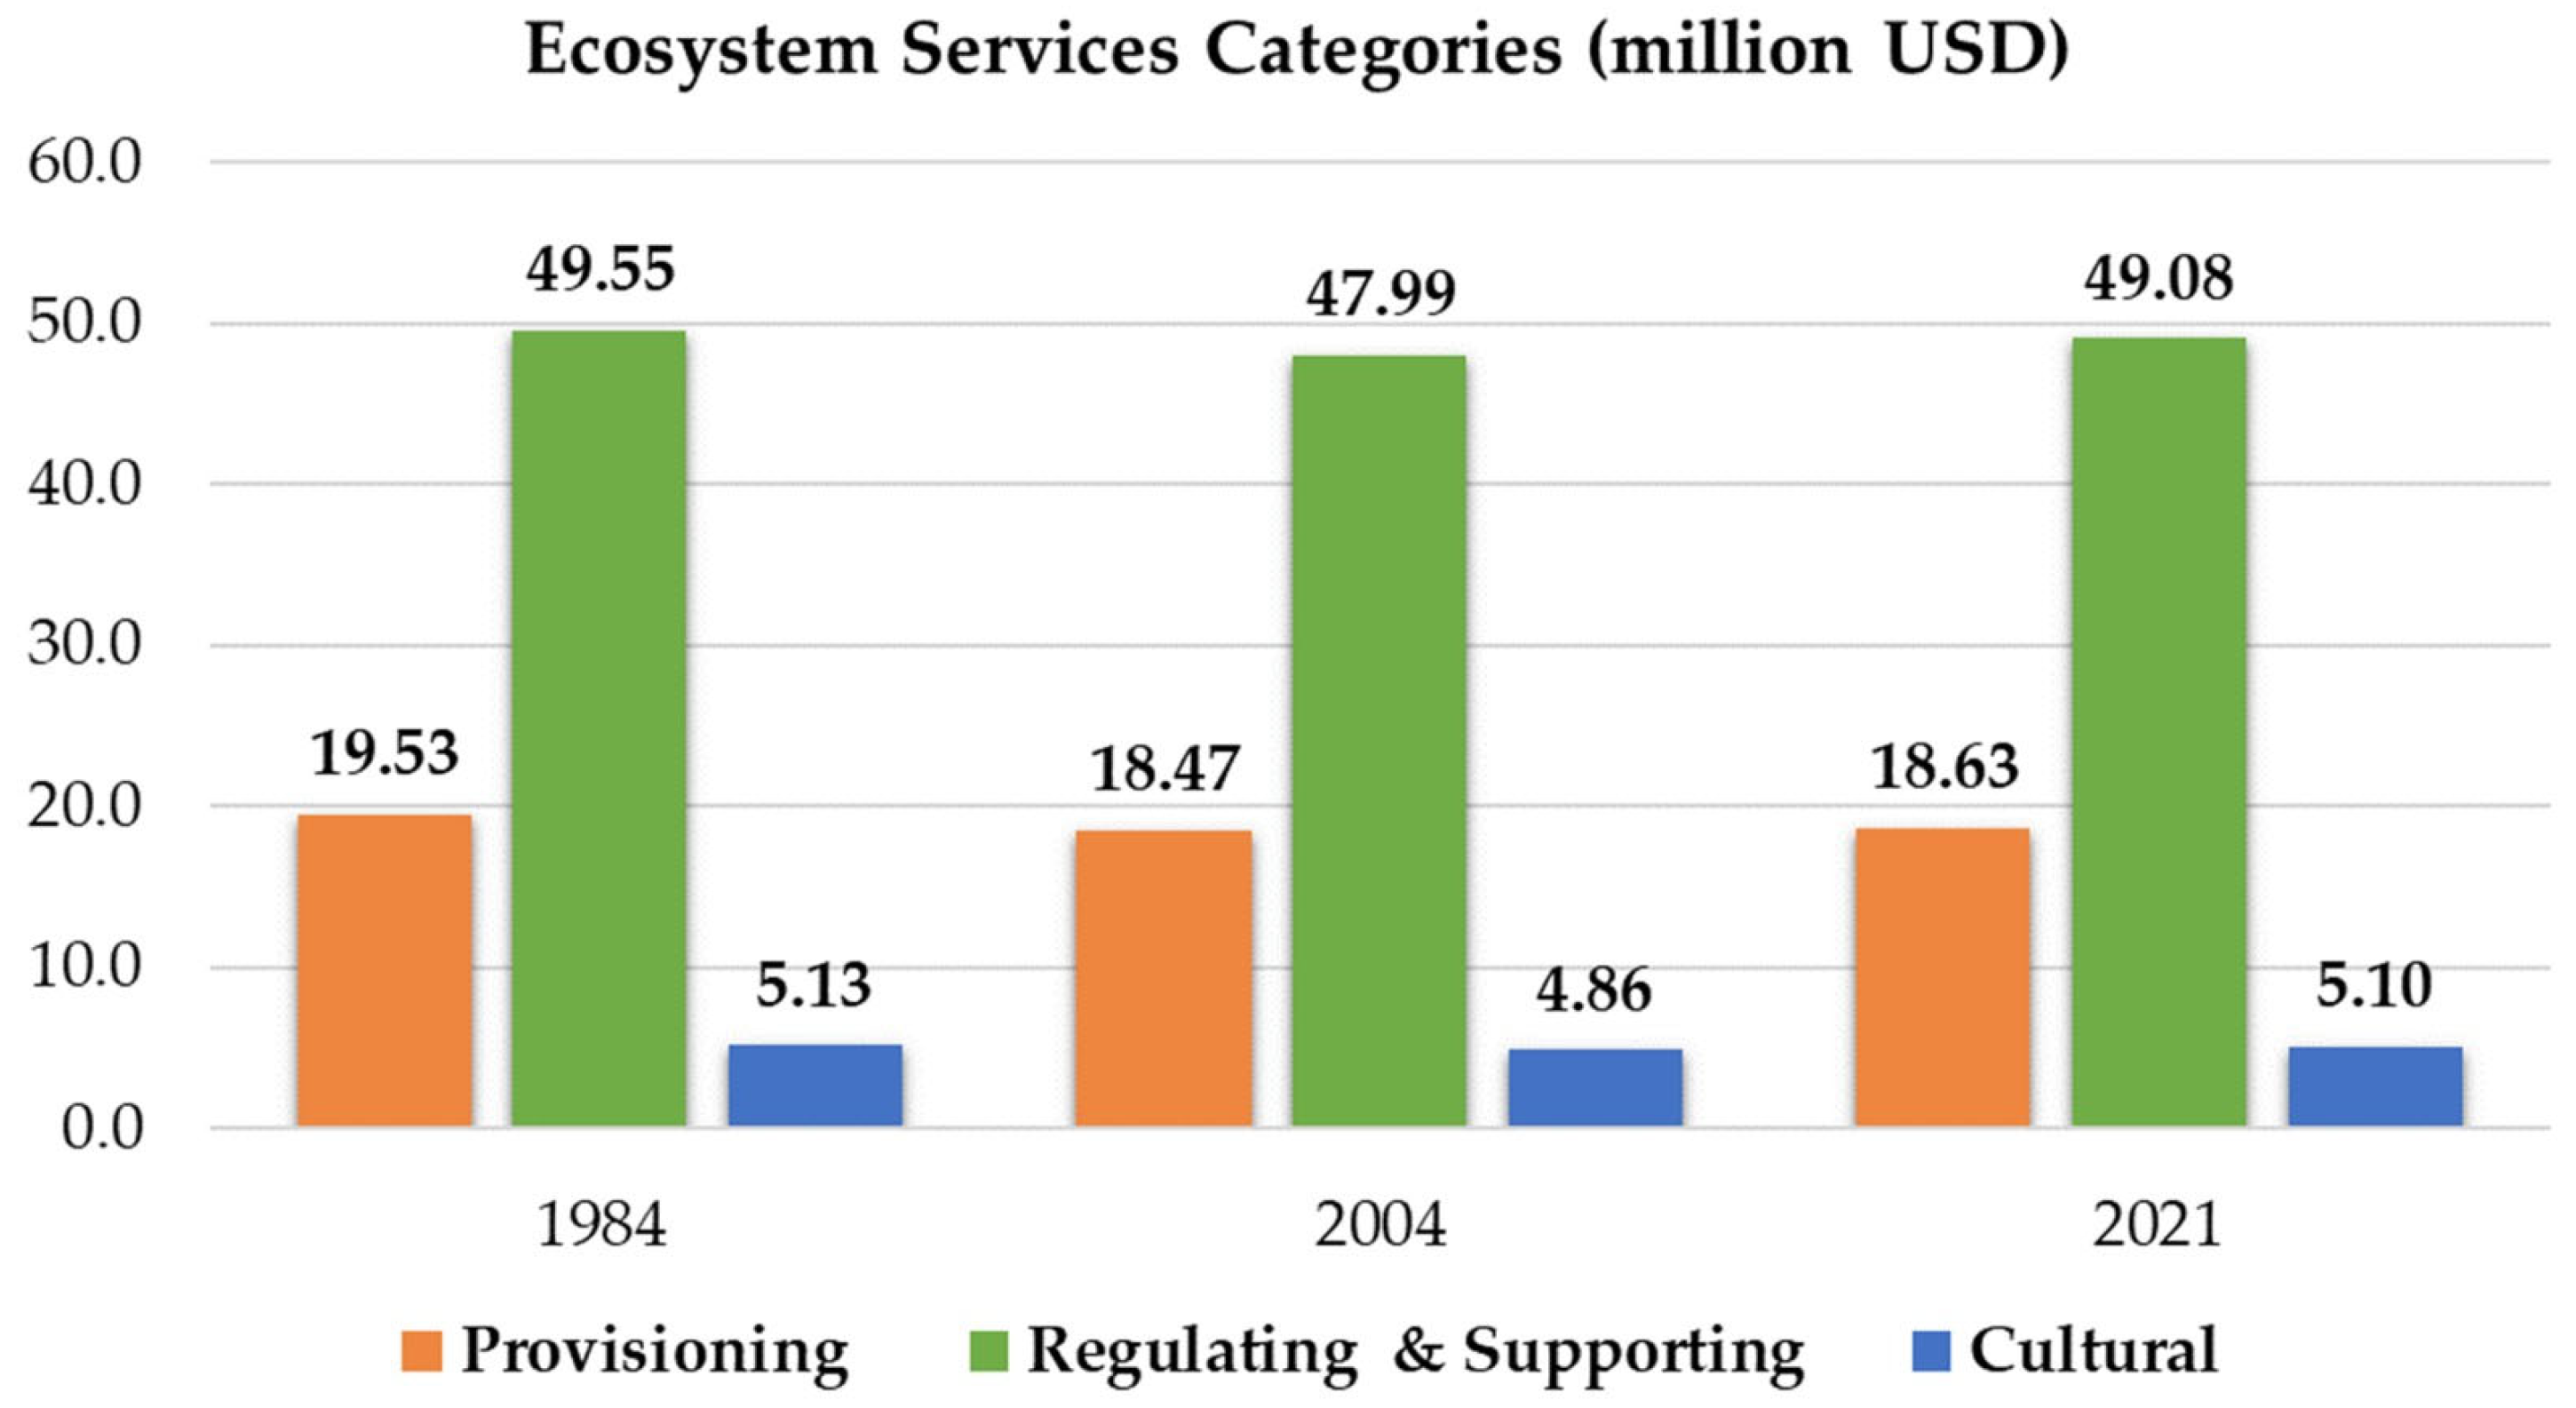
The positive change from 2004 to 2021 emerges from the considerable increase of Climate regulation (7.7%), Raw materials (6.7%), Nutrient cycling (6.51%), and Recreation (5.82%) ecosystem functions. Despite the fact that the declined ecosystem functions correspond to higher rates, their contribution to the final result is almost negligible as their initial value was very low. For example, Habitat/refugia ecosystem function was decreased by −49%, losing half its value, but this change corresponds only to USD 0.11 million. Summarizing the total value change of each ES group, there is an overall decline from 1984 to 2004 but ecosystem functions bounced back by 2021 (Figure 9).
When applying the de Groot methodology [21], ecosystem functions of the provisioning sector (Food production, Raw materials) revealed unquestionably much higher values in relation to those calculated by applying Costanza’s pricing system. A significant increase is also observed in the regulating and supporting category with values almost twice as high as those estimated by Costanza. This is mainly due to the constant contribution of the Habitat/refugia ecosystem function reaching USD 79.56 million in 2021 (Table A1), an outcome in stark contrast with Costanza’s findings.

3.3.2. Laspias River Basin

The ecosystem functions valuation in the Laspias river basin presented a decline from 1984 to 2004 and a recovery in 2021. Nevertheless, there is a negative overall change of −7.2% equal to USD 0.42 million, where the highest pricing drop of USD 0.34 million was revealed in the Water regulation function of Regulating and Supporting ecosystem group (Table 10). Accordingly, the greatest functioning loss from 1984 to 2021 was observed in Water regulation (−75.2%), followed by the Water supply (−38.1%), Habitat/refugia (−25.2%), Disturbance regulation (−25%), and Cultural (−23.1%) ecosystem functions.
On the other hand, an uplifting change over the 40-year period in the improvement of Climate regulation (78%), Nutrient cycling (57%), Raw materials (55%), and Recreation (12%) ecosystem functions contributes to the observed recovery of the main ES categories (Figure 10).
The relation of the aforementioned values with the de Groot methodology [21] gave us an entirely different perspective. This is mostly because this methodology does not attribute any values to artificial or heavily modified landscapes but concentrates on the contribution of natural and semi-natural land types. As a result, the provisioning sector prevailed instead of regulating, particularly Food production with an overall contribution of USD 1.33 million (Table A2).

3.4. Sensitivity Analysis of Ecosystem Services Values

Results from the Sensitivity Analysis assessment revealed a low dependency relationship in general (CS < 1), with the highest ratio occurring in Cropland biome, in both the Laspias (Table 11) and Lissos (Table 12) river basins. This is due to the high proportion of land use corresponding to the Cropland category, leading to a strong dependency relationship with ESV. In particular, up to 60% of the Laspias river basin area accounts for arable land; consequently, even a small increase/decrease in the Cropland category will result in a noticeable change in ESV. Of the same magnitude is the Forest biome in the Lissos river basin, while the Lakes/Rivers biome revealed the lowest effect on ESV in both study areas.

3.5. Spatial Distribution of Ecosystem Services Values in Relation to LULC

Regarding the spatial distribution of ESV along with landscape changes, the approach offered a more comprehensive overview of the impact of LULC changes on ESV by visually indicating the profitable and losing areas across the river basins. In particular, areas that revealed high ESV are highlighted in red and areas corresponding to low ESV are colored in green (Figure 11); the results are in line with the findings that emerged from the ESV assessment.

4. Discussion

ES valuation through spatial explicit information on land use and land cover (LULC), is a very practical and usable approach that can be gradually introduced into land planning and economic reports, provided that a robust analysis framework is introduced [3]. Aiming to understand the effect of LULCC on eco-environmental quality and ESV in two important rural river basins in northeastern Greece, we applied an integrated framework based on a cloud-based geospatial computing platform, freely available EO data, and a scientifically robust MAES-based valuation approach.
For this purpose, we implemented GEE as a robust tool for ecological analyses, which provides access to multi-temporal, medium- to high-resolution EO data, such as Landsat series and a range of algorithms, enabling LULC classification and ecological research at various scales over space and time. Using a cloud-based platform in this study proved to be an efficient solution enabling the processing of large data volumes, identification of cost-effective datasets, and automation of processes for future analyses. In addition, the implementation of GEE has significantly reduced the processing time required, resulting in a more time-efficient and streamlined overall process. The GEE has been successfully employed in similar applications, including LULC classification [55], LULCC detection, time series land cover mapping [56], map trends and evaluating ES [57], and monitoring regional eco-environment quality [58]. In our study, GEE simplified the RSEI calculation, which many scholars have already mentioned is a complicated and time-consuming process through traditional methods [15,59]. Previous studies have verified that RSEI is reliable, credible, and can be visualized, scaled, and compared at different spatiotemporal scales [60,61].
According to our findings, during the first study period (1984–2004), a gradual expansion of the urban areas, including the construction of grey infrastructure such as highways and industrial zones, was observed in both river basins. Other ecosystem types appeared to have inverse variations, such as Crop, W–F, and H–S (see Table 2 and Table 5). For example, arable land in the Laspias basin decreased, whereas Grass equivalently increased. During the second study period (2004–2021), urban fabric continued to sprawl, and arable land was further decreased. These changes can be explained by the policy of that period that affected the subsequent configuration of the area. Particularly, infrastructure construction committed areas of arable land that were later abandoned and transformed into Grass or SLV. Contrarily, such changes may also be attributed to the Common Agricultural Policy (CAP) of 1992, which included measures such as direct income payments, subsidy reduction, promotion of agricultural land set-aside, and increased focus on environmental issues. Other studies [62,63] observed a loss of agricultural areas at an adjacent basin in NE Greece as well. Regarding Lakes/Rivers and Wetland ecosystem types, a severe decrease was recorded for both basins and study periods, signifying the lack of sustainability for these areas. This reduction is mainly due to bad (or without a clear target) management practices, resulting in multiple pressures from various sectors of human activities on Laspias’ waterbodies. However, this explanation is given with precaution since the constriction of the two rivers in the study area in conjunction with the 30-m resolution of Landsat imagery may have presented challenges in accurately assessing any changes in the R–L ecosystem type and may have led to some over/under-estimations.
The aforementioned changes appear to be connected to the landscape pattern analysis of ecosystem types that was conducted. In the Laspias river basin, it was observed that there has been an increase in landscape diversity in 2021, specifically in the northwest region, where significant infrastructure developments have taken place. Likewise, in the Lissos river basin, the spatial distribution of SHDI indicates a similar increase in landscape diversity in the southern region in 2021, which can be attributed to the same reason of infrastructure developments taking place in that area. However, the Lissos ecosystem type diversity displays a slight reduction, meaning that the changes that occurred in the region were smoothened. A plausible reason for this would be that abandoned arable land transformed gradually to other vegetation forms. Lower diversity areas that remained constant during these 37 years were mostly due to their cover with pristine mountainous areas and productive arable plains.
As previously stated, the utilization of 30-m resolution RS data posed certain constraints, notably in terms of over/under-estimations of R–L. Nonetheless, medium-resolution sensors, such as Landsat, are inadequate for obtaining information on narrow rivers and studying their features and patterns that are averaged within a single pixel [64]. Additionally, the characterization of Ubr ecosystem types in rural areas characterized by small and dispersed settlements has proven to be a challenging task. These may impact SHDI calculation as it is based on landcover products, leading to underestimation of spatial heterogeneity.
Considering the linkage between ecosystem quality and the services these can deliver [7,65], we calculated the RSEI, which has been widely used in the environmental quality monitoring of ecosystems as wetlands [58] and basins [60]. Therefore, RSEI was considered suitable for the ecological environmental quality assessment of the study area that could provide further information to our analysis. According to our results, the predominant eco-environmental quality of the Lissos river basin is at a “fair” level during all the study period with no significant variances, whereas the Laspias river basin eco-environment quality shows more variances, presenting an improvement from “fair” to ‘’moderate’’ level during the second study period (2004–2021). The overall trends of the RSEI in both watersheds appear to be relatively stable, following the trends in LULC change in the study area, as noticed by Zhou and Liu [38], conducting a study at a lake basin in China. It was also observed that spatial variation of RSEI has a positive association with ecosystem types of the study area. More specifically, study areas dominated by high vegetation are less prone to human interventions [38] and hence present high eco-environmental quality. In contrast, arable land and urban areas are more susceptible to anthropogenic activities, which negatively impact their eco-environmental quality, resulting in lower quality compared to the aforementioned terrain.
Moving on to the methodology applied for the ES valuation, it is a well-established one, widely used in many case studies, providing acceptable results. Implementing the aforementioned approach, with no further adjustments, eased the production of a comprehensive depiction of ES variation. Furthermore, a more detailed deduction can be obtained based on the estimated flows of ecosystem functions valuation.
The ES assessment and valuation reflected the land cover alteration, revealing a notable decline in Lakes/Rivers, Wetlands, and Grass/Rangelands biomes and an increasing trend in Urban biome, signifying a large loss in monetary terms. Both river basins suffered from water degradation, especially the Laspias river basin with an overall −80% drop in Lakes/Rivers biome, as it is considered to have the largest irrigated agricultural area compared to the Lissos river basin, leading to significant water exploitation. On the other hand, according to studies and relevant research [66,67,68], the Lissos river basin was subject to serious pressures (salinization being one of them) that basically led to the impairment of the inland wetlands, as also revealed by the ES assessment (−49.5% loss in Wetlands values). Finally, it is worth mentioning that even though the case studies refer to remote districts, the increase in the Urban category was an expected outcome following the general socio-economical flows and trends from 1984 to 2021 that prevailed worldwide. Even in Thrace, the primary sector is constantly decreasing and the labor force is spread among the secondary and tertiary sectors.
Comparing both study areas, there is a declining trend from 1984 to 2004 and a value reset in 2021. It is possible that the main reason behind this behavior is the fact that before 2000 ES were not as appreciated as today and there were no regulations and legislations to protect them. Τhe results were also complemented by the ecosystem functions valuation assessment, which demonstrates the individual gains and losses. As expected, the greatest loss in the Laspias river basin was presented in Water regulation function by −75%, and in the Habitat/refugia ecosystem function by −49% in the Lissos river basin. As for the major ES categories, a more stable state is presented in the Lissos river while in the Laspias there is a decrease in provisioning, an intense variation in supporting, and a constantly low value for cultural. The only functions for both basins that seem to be positively affected are Raw materials, Climate regulation, and Nutrient cycling, albeit with different rates.
Even though there is a variety of different approaches proposing alternative valuation methods or pricing systems, there will always be controversy and skepticism about overestimating or underestimating the assigned values. Taking into consideration these concerns, de Groot’s value coefficients were also applied (Table A1 and Table A2), in order to compare our results with a subsequent pricing list. The de Groot method revealed an overestimated perspective providing values twice as high as Costanza, but only for particular biomes. Although the differentiation between the two methods is evident, this approach is accepted as well, while the higher values he proposes are due to the heightened environmental sensitivity he embraces.
Concerning relationships between our derived RS proxies and ESV, previous studies [65,69,70] have demonstrated a strong correlation between them. Foremost, ESV of a region being affected by landcover types and their changes arises from the calculation method employed for ESV. Secondly, while ESV quantifies the value of services provided by an area to humans, landscape pattern metrics evaluate the ecological condition of the same area from a different perspective. Among various landscape metrics, SHDI exhibits a significant association with ESVs [69,70]. Examining the interrelationship between these two aspects is advantageous for comprehending the evolutionary trends of a region’s landscape and offering recommendations to enhance ESV through effective landscape management and planning. Regarding eco-environmental quality, Zhu et al. [65] showed that RSEI exhibited a significant correlation with ES for a hilly watershed in southern China.
According to our analysis, regarding landcover changes and ESV throughout the study period, both basins showed an increase in Forest biome following respective changes in W–F ecosystem type. Associated ecosystem function valuation, such as climate regulation and recreation, increased as well. At the same time, excellent eco-environmental quality was stable for the Lissos basin and increased in the Laspias basin, respectively showing some association between RSEI and ESV regarding W–F ecosystem type. Urb growth (1984–2021) and Grass growth (2004–2021) in the northern part of the Laspias basin and reduction of Crop caused an increase in landscape diversity, resulting in an ESV increase of the respective biomes. Thus, ESV changes seem to be affected by landscape pattern alterations as well, as Zhang T. and Zhang B. [69] stated in their study of a coastal wetland in China.

5. Conclusions

The selected areas under study were two lesser researched river basins suffering from similar pressures, whose effect was expressed through the degradation of ES. The applied methodology is simple but worldwide accepted, coupling a modern and up-to-date platform (GEE) that eased the identification of LULC types with eco-environmental quality assessment and a practical method for ES valuation. Addressing LULCC historically is a key factor in ecosystem services assessment imprinting the loss of ES and ecosystem unsustainable functioning. However, we should notice that the given resolution of the data used in the analysis generated some limitations which may influence some aspects of our analysis. Freely available multi-temporal EO data with medium to high resolution such as the one provided by the Landsat series, along with a variety of powerful classifiers, make GEE a powerful tool that can be used for LULC classification at various scales through space and time. The economic valuation of ES is an important and useful tool for environmental management and policy. Assigning values in monetary units to ES transforms them into something measurable, more easily perceived and manageable, linking economy with its environmental aspect. Thus, assessing ES in a form that can feature its importance and utility for both economy and environment is essential.
This research highlighted the areas and the LULC types that were subject to alterations affecting ES. One of the core aims of the strategic aim (RIS 3) for the EMT region is to pinpoint unique characteristics and competitive assets to upscale services in the value chain. This study, deploying novel technology, identified the location of areas that suffered the most during the last 40 years and set the spatial context to prevent further natural capital loss, upgrade the agri-food sector according to the LULC trends, and evolve cultural and touristic products, preserving the natural capital, especially intact environments and waterbodies (and related biomes).
In the case of the Laspias river basin, the aforementioned methodology revealed serious degradation in the Lakes/Rivers biome due to the significant increase of agricultural activity resulting in excessive use of water and identified the need for sustainable water management. Regarding the Lissos river basin, there was a worth-mentioning decline in Wetlands and Lakes/Rivers biomes, replaced as shown from sparsely vegetated areas revealing the deployment of land use in favor of anthropogenic exploitation. Likewise, the flows of ecosystem functions in both study areas uncovered the impact of human activities mainly on Water regulation in the Laspias river basin and also on Habitat/refugia in the Lissos river basin. Thus, replying to our aim, the analysis carried out in this study can provide valuable information for strategic planning and decision-making related to the management of ES and ecological quality in the studied river basins. By identifying the drivers and patterns of change in ES and quality, decision-makers can better understand the implications of their actions and design more effective policies and measures to promote sustainable development and environmental conservation. The study’s findings can assist the strategic (development) planning for the district in accordance with the RIS and the EU Directives to improve regional ecological environmental quality and sustainability.

Author Contributions

Conceptualization, D.L. and G.M.; methodology, D.L. and G.M.; software, N.I., K.V. and S.S.; validation, N.I, K.V. and A.M.; formal analysis, N.I. and K.V.; resources, G.M.; data curation, N.I, K.V. and A.M.; writing—original draft preparation, N.I., K.V., A.M. and S.S.; writing—review and editing, D.L., I.K. and G.M.; visualization, N.I., K.V. and S.S.; supervision, I.K., D.L. and G.M.; project administration, D.L; funding acquisition, D.L. and I.K. All authors have read and agreed to the published version of the manuscript.

Funding

Produced for Eye4Water project, MIS 5047246, implemented under the action: “Support for Research Infrastructure and Innovation” by the Operational Program “Competitiveness, Entrepreneurship and Innovation”. Co-financed by Greece and the European Union-European Regional Development Fund.

Data Availability Statement

All data are available upon demand.

Acknowledgments

We acknowledge the support of this work by the project Eye4Water (MIS 5047246) implemented under the action: “Support for Research Infrastructure and Innovation”. We also feel grateful to the Regional Forest Directorates of Xanthi, Rodopi and Evros, for providing the local management plans for the forest areas under their competence. The Landsat OLI and Landsat TM data used were available from the US Geological Survey at no cost. We deeply thank Alex Dolianitis for proofreading the manuscript and his valuable linguistic corrections as well as the four anonymous reviewers who contributed to enhancing the quality of this paper.

Conflicts of Interest

The authors declare no conflict of interest.

Appendix A

Table A1. Ecosystem functions valuation and overall change from 1984 to 2021 in the Lissos river basin based on the de Groot methodology [21].
ESVf (Million USD)Overall Change
Ecosystem Services CategoriesEcosystem Functions198420042021Value(%)
ProvisioningFood production43.3241.7237.01−6.32−14.58
Raw materials12.0812.4413.081.008.28
Water supply3.813.453.32−0.49−12.90
Regulating and
Supporting
Gas regulation0.000.000.000.000.00
Climate regulation2.672.442.48−0.18−6.88
Disturbance regulation2.001.121.01−0.99−49.49
Water regulation4.182.332.11−2.07−49.49
Biological control1.661.301.58−0.08−4.92
Waste treatment4.803.693.24−1.56−32.42
Nutrient cycling1.661.071.13−0.53−31.79
Habitat/refugia70.6574.7879.568.9112.61
Pollination1.701.811.930.2313.46
CulturalRecreation7.836.747.78−0.04−0.55
Cultural5.965.514.75−1.21−20.31
Total 162.32158.40158.98
Table A2. Ecosystem functions valuation and overall change from 1984 to 2021 in the Laspias river basin based on the de Groot methodology [21].
ESVf (Million USD)Overall Change
Ecosystem Services CategoriesEcosystem Functions198420042021Value(%)
ProvisioningFood production5.144.916.471.3325.80
Raw materials0.460.430.670.2145.18
Water supply0.470.360.490.023.58
Regulating and
Supporting
Gas regulation0.000.000.000.000.00
Climate regulation0.260.220.350.0935.99
Disturbance regulation0.360.150.27−0.09−25.22
Water regulation0.750.310.56−0.19−25.22
Biological control0.160.090.230.0743.89
Waste treatment0.730.470.69−0.03−4.74
Nutrient cycling0.240.110.22−0.02−7.10
Habitat/refugia1.381.342.030.6547.01
Pollination0.030.030.050.0257.25
CulturalRecreation0.720.470.970.2534.68
Cultural0.790.710.930.1418.33
Total 11.509.6113.94

Appendix B

Figure A1. Training and validation samples distribution within the area of interest for 1984.
Land 12 01140 g0a1
Figure A2. Training and validation samples distribution within the area of interest for 2004.
Land 12 01140 g0a2
Figure A3. Training and validation samples distribution within the area of interest for 2021.
Land 12 01140 g0a3

References

  1. Chen, W.; Chi, G.; Li, J. The Spatial Association of Ecosystem Services with Land Use and Land Cover Change at the County Level in China, 1995–2015. Sci. Total Environ. 2019, 669, 459–470. [Google Scholar] [CrossRef] [PubMed]
  2. Pan, Z.; He, J.; Liu, D.; Wang, J. Predicting the Joint Effects of Future Climate and Land Use Change on Ecosystem Health in the Middle Reaches of the Yangtze River Economic Belt, China. Appl. Geogr. 2020, 124, 102293. [Google Scholar] [CrossRef]
  3. Wang, Y.; Dai, E.; Yin, L.; Ma, L. Land Use/Land Cover Change and the Effects on Ecosystem Services in the Hengduan Mountain Region, China. Ecosyst. Serv. 2018, 34, 55–67. [Google Scholar] [CrossRef]
  4. Sieber, I.M.; Campagne, C.S.; Villien, C.; Burkhard, B. Mapping and Assessing Ecosystems and Their Services: A Comparative Approach to Ecosystem Service Supply in Suriname and French Guiana. Ecosyst. People 2021, 17, 148–164. [Google Scholar] [CrossRef]
  5. Latinopoulos, D.; Koulouri, M.; Kagalou, I. How Historical Land Use/Land Cover Changes Affected Ecosystem Services in Lake Pamvotis, Greece. Hum. Ecol. Risk Assess. Int. J. 2021, 27, 1472–1491. [Google Scholar] [CrossRef]
  6. Arowolo, A.O.; Deng, X.; Olatunji, O.A.; Obayelu, A.E. Assessing Changes in the Value of Ecosystem Services in Response to Land-Use/Land-Cover Dynamics in Nigeria. Sci. Total Environ. 2018, 636, 597–609. [Google Scholar] [CrossRef]
  7. Maes, J.; Teller, A.; Erhard, M.; Condé, S.; Vallecillo, S.; Barredo, J.I.; Paracchini, M.L.; Abdul Malak, D.; Trombetti, M.; Vigiak, O. Mapping and Assessment of Ecosystems and Their Services: An EU Wide Ecosystem Assessment in Support of the EU Biodiversity Strategy; Publications Office of the European Union: Luxembourg, 2020; ISBN 978-92-76-17833-0. [Google Scholar]
  8. Costanza, R.; d’Arge, R.; de Groot, R.; Farber, S.; Grasso, M.; Hannon, B.; Limburg, K.; Naeem, S.; O’Neill, R.V.; Paruelo, J.; et al. The Value of the World’s Ecosystem Services and Natural Capital. Nature 1997, 387, 253–260. [Google Scholar] [CrossRef]
  9. Kubiszewski, I.; Muthee, K.; Rasheed, A.T.; Costanza, R.; Suzuki, M.; Noel, S.; Schauer, M. The Costs of Increasing Precision for Ecosystem Services Valuation Studies. Ecol. Indic. 2022, 135, 108551. [Google Scholar] [CrossRef]
  10. Burkhard, B.; Kroll, F.; Nedkov, S.; Müller, F. Mapping Ecosystem Service Supply, Demand and Budgets. Ecol. Indic. 2012, 21, 17–29. [Google Scholar] [CrossRef]
  11. Burkhard, B.; Maes, J. Mapping Ecosystem Services; Pensoft Publishers: Sofia, Bulgaria, 2017; ISBN 978-954-642-829-5. [Google Scholar]
  12. Burkhard, B.; Santos-Martin, F.; Nedkov, S.; Maes, J. An Operational Framework for Integrated Mapping and Assessment of Ecosystems and Their Services (MAES). One Ecosyst. 2018, 3, e24490. [Google Scholar] [CrossRef]
  13. Hesselbarth, M.H.K.; Sciaini, M.; With, K.A.; Wiegand, K.; Nowosad, J. Landscapemetrics: An Open-Source R Tool to Calculate Landscape Metrics. Ecography 2019, 42, 1648–1657. [Google Scholar] [CrossRef]
  14. Shetty, S. Analysis of Machine Learning Classifiers for LULC Classification on Google Earth Engine. MSc. Thesis, University of Twente, Enschede, The Netherlands, 2019. [Google Scholar]
  15. Yang, X.; Meng, F.; Fu, P.; Zhang, Y.; Liu, Y. Spatiotemporal Change and Driving Factors of the Eco-Environment Quality in the Yangtze River Basin from 2001 to 2019. Ecol. Indic. 2021, 131, 108–214. [Google Scholar] [CrossRef]
  16. Shiliang, S.; Delong, L.; Yi’na, H.; Rui, X.; Zhang, Y. Spatially Non-Stationary Response of Ecosystem Service Value Changes to Urbanization in Shanghai, China. Ecol. Indic. 2014, 45, 332–339. [Google Scholar] [CrossRef]
  17. Hansen, M.H.; Li, H.; Svarverud, R. Ecological Civilization: Interpreting the Chinese Past, Projecting the Global Future. Glob. Environ. Change 2018, 53, 195–203. [Google Scholar] [CrossRef]
  18. Wade, A.J.; Skeffington, R.A.; Couture, R.-M.; Erlandsson Lampa, M.; Groot, S.; Halliday, S.J.; Harezlak, V.; Hejzlar, J.; Jackson-Blake, L.A.; Lepistö, A.; et al. Land Use Change to Reduce Freshwater Nitrogen and Phosphorus Will Be Effective Even with Projected Climate Change. Water 2022, 14, 829. [Google Scholar] [CrossRef]
  19. Costanza, R.; de Groot, R.; Braat, L.; Kubiszewski, I.; Fioramonti, L.; Sutton, P.; Farber, S.; Grasso, M. Twenty Years of Ecosystem Services: How Far Have We Come and How Far Do We Still Need to Go? Ecosyst. Serv. 2017, 28, 1–16. [Google Scholar] [CrossRef]
  20. Edens, B.; Maes, J.; Hein, L.; Obst, C.; Siikamaki, J.; Schenau, S.; Javorsek, M.; Chow, J.; Chan, J.Y.; Steurer, A.; et al. Establishing the SEEA Ecosystem Accounting as a Global Standard. Ecosyst. Serv. 2022, 54, 101413. [Google Scholar] [CrossRef]
  21. de Groot, R.; Brander, L.; van der Ploeg, S.; Costanza, R.; Bernard, F.; Braat, L.; Christie, M.; Crossman, N.; Ghermandi, A.; Hein, L.; et al. Global Estimates of the Value of Ecosystems and Their Services in Monetary Units. Ecosyst. Serv. 2012, 1, 50–61. [Google Scholar] [CrossRef]
  22. Gorelick, N.; Hancher, M.; Dixon, M.; Ilyushchenko, S.; Thau, D.; Moore, R. Google Earth Engine: Planetary-Scale Geospatial Analysis for Everyone. Remote Sens. Environ. 2017, 202, 18–27. [Google Scholar] [CrossRef]
  23. Vermote, E.; Justice, C.; Claverie, M.; Franch, B. Preliminary Analysis of the Performance of the Landsat 8/OLI Land Surface Reflectance Product. Remote Sens. Environ. 2016, 185, 46–56. [Google Scholar] [CrossRef]
  24. Ermida, S.L.; Soares, P.; Mantas, V.; Göttsche, F.M.; Trigo, I.F. Google Earth Engine Open-Source Code for Land Surface Temperature Estimation from the Landsat Series. Remote Sens. 2020, 12, 1471. [Google Scholar] [CrossRef]
  25. Belgiu, M.; Drăguţ, L. Random Forest in Remote Sensing: A Review of Applications and Future Directions. ISPRS J. Photogramm. Remote Sens. 2016, 114, 24–31. [Google Scholar] [CrossRef]
  26. Ghimire, B.; Rogan, J.; Galiano, V.R.; Panday, P.; Neeti, N. An Evaluation of Bagging, Boosting, and Random Forests for Land-Cover Classification in Cape Cod, Massachusetts, USA. GI Sci. Remote Sens. 2012, 49, 623–643. [Google Scholar] [CrossRef]
  27. European Environment Agency. Corine Land Cover (CLC) 2018 Version 2020; European Environment Agency: Copenhagen, Denmark, 2018. [Google Scholar]
  28. Tucker, C.J. Red and Photographic Infrared Linear Combinations for Monitoring Vegetation. Remote Sens. Environ. 1979, 8, 127–150. [Google Scholar] [CrossRef]
  29. Gao, B. NDWI—A Normalized Difference Water Index for Remote Sensing of Vegetation Liquid Water from Space. Remote Sens. Environ. 1996, 58, 257–266. [Google Scholar] [CrossRef]
  30. Huete, A.R. A Soil-Adjusted Vegetation Index (SAVI). Remote Sens. Environ. 1988, 25, 295–309. [Google Scholar] [CrossRef]
  31. Zha, Y.; Gao, J.; Ni, S. Use of Normalized Difference Built-up Index in Automatically Mapping Urban Areas from TM Imagery. Int. J. Remote Sens. 2003, 24, 583–594. [Google Scholar] [CrossRef]
  32. Lv, J.; Ma, T.; Dong, Z.; Yao, Y.; Yuan, Z. Temporal and Spatial Analyses of the Landscape Pattern of Wuhan City Based on Remote Sensing Images. ISPRS Int. J. Geo-Inf. 2018, 7, 340. [Google Scholar] [CrossRef]
  33. Qian, Y.; Zhou, W.; Yu, W.; Han, L.; Li, W.; Zhao, W. Integrating Backdating and Transfer Learning in an Object-Based Framework for High Resolution Image Classification and Change Analysis. Remote Sens. 2020, 12, 4094. [Google Scholar] [CrossRef]
  34. Congalton, R.G. A Review of Assessing the Accuracy of Classifications of Remotely Sensed Data. Remote Sens. Environ. 1991, 37, 35–46. [Google Scholar] [CrossRef]
  35. Hagen-Zanker, A. A Computational Framework for Generalized Moving Windows and Its Application to Landscape Pattern Analysis. Int. J. Appl. Earth Obs. Geoinf. 2016, 44, 205–216. [Google Scholar] [CrossRef]
  36. Modica, G.; Vizzari, M.; Pollino, M.; Fichera, C.R.; Zoccali, P.; Di Fazio, S. Spatio-Temporal Analysis of the Urban–Rural Gradient Structure: An Application in a Mediterranean Mountainous Landscape (Serra San Bruno, Italy). Earth Syst. Dynam. 2012, 3, 263–279. [Google Scholar] [CrossRef]
  37. Pariha, H.L.L.; Zan, M.; Alimjan, K. Remote Sensing Evaluation of Ecological Environment in Urumqi City and Analysis of Driving Factors. Arid Zone Res. 2021, 38, 1484–1496. [Google Scholar]
  38. Zhou, J.; Liu, W. Monitoring and Evaluation of Eco-Environment Quality Based on Remote Sensing-Based Ecological Index (RSEI) in Taihu Lake Basin, China. Sustainability 2022, 14, 642. [Google Scholar] [CrossRef]
  39. Baig, M.H.A.; Zhang, L.; Shuai, T.; Tong, Q. Derivation of a Tasselled Cap Transformation Based on Landsat 8 At-Satellite Reflectance. Remote Sens. Lett. 2014, 5, 423–431. [Google Scholar] [CrossRef]
  40. Crist, E.P. A TM Tasseled Cap Equivalent Transformation for Reflectance Factor Data. Remote Sens. Environ. 1985, 17, 301–306. [Google Scholar] [CrossRef]
  41. Hu, X.; Xu, H. A New Remote Sensing Index for Assessing the Spatial Heterogeneity in Urban Ecological Quality: A Case from Fuzhou City, China. Ecol. Indic. 2018, 89, 11–21. [Google Scholar] [CrossRef]
  42. Xu, H. A Study on Information Extraction of Water Body with the Modified Normalized Difference Water Index (MNDWI). J. Remote Sens. 2005, 9, 589–595. [Google Scholar]
  43. Wen, X.; Ming, Y.; Gao, Y.; Hu, X. Dynamic Monitoring and Analysis of Ecological Quality of Pingtan Comprehensive Experimental Zone, a New Type of Sea Island City, Based on RSEI. Sustainability 2020, 12, 21. [Google Scholar] [CrossRef]
  44. Costanza, R.; de Groot, R.; Sutton, P.; van der Ploeg, S.; Anderson, S.J.; Kubiszewski, I.; Farber, S.; Turner, R.K. Changes in the Global Value of Ecosystem Services. Glob. Environ. Change 2014, 26, 152–158. [Google Scholar] [CrossRef]
  45. Fastelli, P.; Marcelli, M.; Guerranti, C.; Renzi, M. Recent Changes of Ecosystem Surfaces and Their Services Value in a Mediterranean Costal Protected Area: The Role of Wetlands. Thalassas 2018, 34, 233–245. [Google Scholar] [CrossRef]
  46. Aretano, R.; Petrosillo, I.; Zaccarelli, N.; Semeraro, T.; Zurlini, G. People Perception of Landscape Change Effects on Ecosystem Services in Small Mediterranean Islands: A Combination of Subjective and Objective Assessments. Landsc. Urban Plan. 2013, 112, 63–73. [Google Scholar] [CrossRef]
  47. Kreuter, U.P.; Harris, H.G.; Matlock, M.D.; Lacey, R.E. Change in Ecosystem Service Values in the San Antonio Area, Texas. Ecol. Econ. 2001, 39, 333–346. [Google Scholar] [CrossRef]
  48. Mansfield, E.; Yohe, G.W. Microeconomics: Theory/Applications, 11th ed.; Norton: New York, NY, USA, 2004; ISBN 978-0-393-97918-3. [Google Scholar]
  49. Hu, Z.; Yang, X.; Yang, J.; Yuan, J.; Zhang, Z. Linking Landscape Pattern, Ecosystem Service Value, and Human Well-Being in Xishuangbanna, Southwest China: Insights from a Coupling Coordination Model. Glob. Ecol. Conserv. 2021, 27, e01583. [Google Scholar] [CrossRef]
  50. Guo, P.; Zhang, F.; Wang, H. The Response of Ecosystem Service Value to Land Use Change in the Middle and Lower Yellow River: A Case Study of the Henan Section. Ecol. Indic. 2022, 140, 109019. [Google Scholar] [CrossRef]
  51. Gaglio, M.; Aschonitis, V.G.; Gissi, E.; Castaldelli, G.; Fano, E.A. Land Use Change Effects on Ecosystem Services of River Deltas and Coastal Wetlands: Case Study in Volano–Mesola–Goro in Po River Delta (Italy). Wetlands Ecol Manag. 2017, 25, 67–86. [Google Scholar] [CrossRef]
  52. Song, W.; Deng, X. Land-Use/Land-Cover Change and Ecosystem Service Provision in China. Sci. Total Environ. 2017, 576, 705–719. [Google Scholar] [CrossRef]
  53. Qiu, H.; Hu, B.; Zhang, Z. Impacts of Land Use Change on Ecosystem Service Value Based on SDGs Report—Taking Guangxi as an Example. Ecol. Indic. 2021, 133, 108366. [Google Scholar] [CrossRef]
  54. Aschonitis, V.G.; Gaglio, M.; Castaldelli, G.; Fano, E.A. Criticism on Elasticity-Sensitivity Coefficient for Assessing the Robustness and Sensitivity of Ecosystem Services Values. Ecosyst. Serv. 2016, 20, 66–68. [Google Scholar] [CrossRef]
  55. Svoboda, J.; Štych, P.; Laštovička, J.; Paluba, D.; Kobliuk, N. Random Forest Classification of Land Use, Land-Use Change and Forestry (LULUCF) Using Sentinel-2 Data—A Case Study of Czechia. Remote Sens. 2022, 14, 189. [Google Scholar] [CrossRef]
  56. Zhong, B.; Yang, A.; Jue, K.; Wu, J. Long Time Series High-Quality and High-Consistency Land Cover Mapping Based on Machine Learning Method at Heihe River Basin. Remote Sens. 2021, 13, 596. [Google Scholar] [CrossRef]
  57. Liu, T.; Li, Z.; Yu, L.; Chen, X.; Cao, B.; Li, X.; Du, Z.; Peng, D.; Hou, L. Global Relative Ecosystem Service Budget Mapping Using the Google Earth Engine and Land Cover Datasets. Environ. Res. Commun. 2022, 4, 065002. [Google Scholar] [CrossRef]
  58. Qureshi, S.; Alavipanah, S.K.; Konyushkova, M.; Mijani, N.; Fathololomi, S.; Firozjaei, M.K.; Homaee, M.; Hamzeh, S.; Kakroodi, A.A. A Remotely Sensed Assessment of Surface Ecological Change over the Gomishan Wetland, Iran. Remote Sens. 2020, 12, 2989. [Google Scholar] [CrossRef]
  59. Xiong, Y.; Xu, W.; Lu, N.; Huang, S.; Wu, C.; Wang, L.; Dai, F.; Kou, W. Assessment of Spatial–Temporal Changes of Ecological Environment Quality Based on RSEI and GEE: A Case Study in Erhai Lake Basin, Yunnan Province, China. Ecol. Indic. 2021, 125, 518. [Google Scholar] [CrossRef]
  60. Jing, Y.; Zhang, F.; He, Y.; Kung, H.; Johnson, V.C.; Arikena, M. Assessment of Spatial and Temporal Variation of Ecological Environment Quality in Ebinur Lake Wetland National Nature Reserve, Xinjiang, China. Ecol. Indic. 2020, 110, 105874. [Google Scholar] [CrossRef]
  61. Zhu, D.; Chen, T.; Zhen, N.; Niu, R. Monitoring the Effects of Open-Pit Mining on the Eco-Environment Using a Moving Window-Based Remote Sensing Ecological Index. Environ. Sci. Pollut. Res. 2020, 27, 15716–15728. [Google Scholar] [CrossRef] [PubMed]
  62. Mallinis, G.; Emmanoloudis, D.; Giannakopoulos, V.; Maris, F.; Koutsias, N. Mapping and Interpreting Historical Land Cover/Land Use Changes in a Natura 2000 Site Using Earth Observational Data: The Case of Nestos Delta, Greece. Appl. Geogr. 2011, 31, 312–320. [Google Scholar] [CrossRef]
  63. Xeidakis, G.S.; Delimani, P. Coastal erosion problems in Northern Aegean coastline, Greece. The case of the Rhodope Prefecture coasts. Environ. Stud. 2002, 8, 151–158. [Google Scholar]
  64. Filippucci, P.; Brocca, L.; Bonafoni, S.; Saltalippi, C.; Wagner, W.; Tarpanelli, A. Sentinel-2 High-Resolution Data for River Discharge Monitoring. Remote Sens. Environ. 2022, 281, 113255. [Google Scholar] [CrossRef]
  65. Zhu, Q.; Guo, J.; Guo, X.; Chen, L.; Han, Y.; Liu, S. Relationship between Ecological Quality and Ecosystem Services in a Red Soil Hilly Watershed in Southern China. Ecol. Indic. 2021, 121, 107119. [Google Scholar] [CrossRef]
  66. Lambrakis, N.; Stournaras, G.; Katsanou, K. (Eds.) Advances in the Research of Aquatic Environment; Springer: Berlin/Heidelberg, Germany, 2011; Volume 2. [Google Scholar] [CrossRef]
  67. Karasani, M.; Latinopoulos, D.; Ioannidou, N.; Spiliotis, M.; Kagalou, I. Bridging the Gap between Science and Policy: A Prerequisite for Effective Water Governance. Environ. Sci. Proc. 2023, 25, 12. [Google Scholar]
  68. Latinopoulos, D.; Bakas, T.; Kagalou, I.; Spiliotis, M. Threat Prioritization and Causality Relations for Sustainable Water Management under the Circular Economy Principles: Case Study in Laspias River, Greece Using EDPSIR and DEMATEL. Environ. Sci. Proc. 2022, 21, 59. [Google Scholar]
  69. Zhang, T.; Zhang, B. Spatiotemporal Characteristics of Ecosystem Service Value and Its Correlation with Landscape Patterns: A Case of Bohai Coastal Wetland in Shandong Province. In Proceedings of the 2022 29th International Conference on Geoinformatics, IEEE, Beijing, China, 15 August 2022; pp. 1–6. [Google Scholar]
  70. Xie, L.; Wang, H.; Liu, S. The Ecosystem Service Values Simulation and Driving Force Analysis Based on Land Use/Land Cover: A Case Study in Inland Rivers in Arid Areas of the Aksu River Basin, China. Ecol. Indic. 2022, 138, 108828. [Google Scholar] [CrossRef]
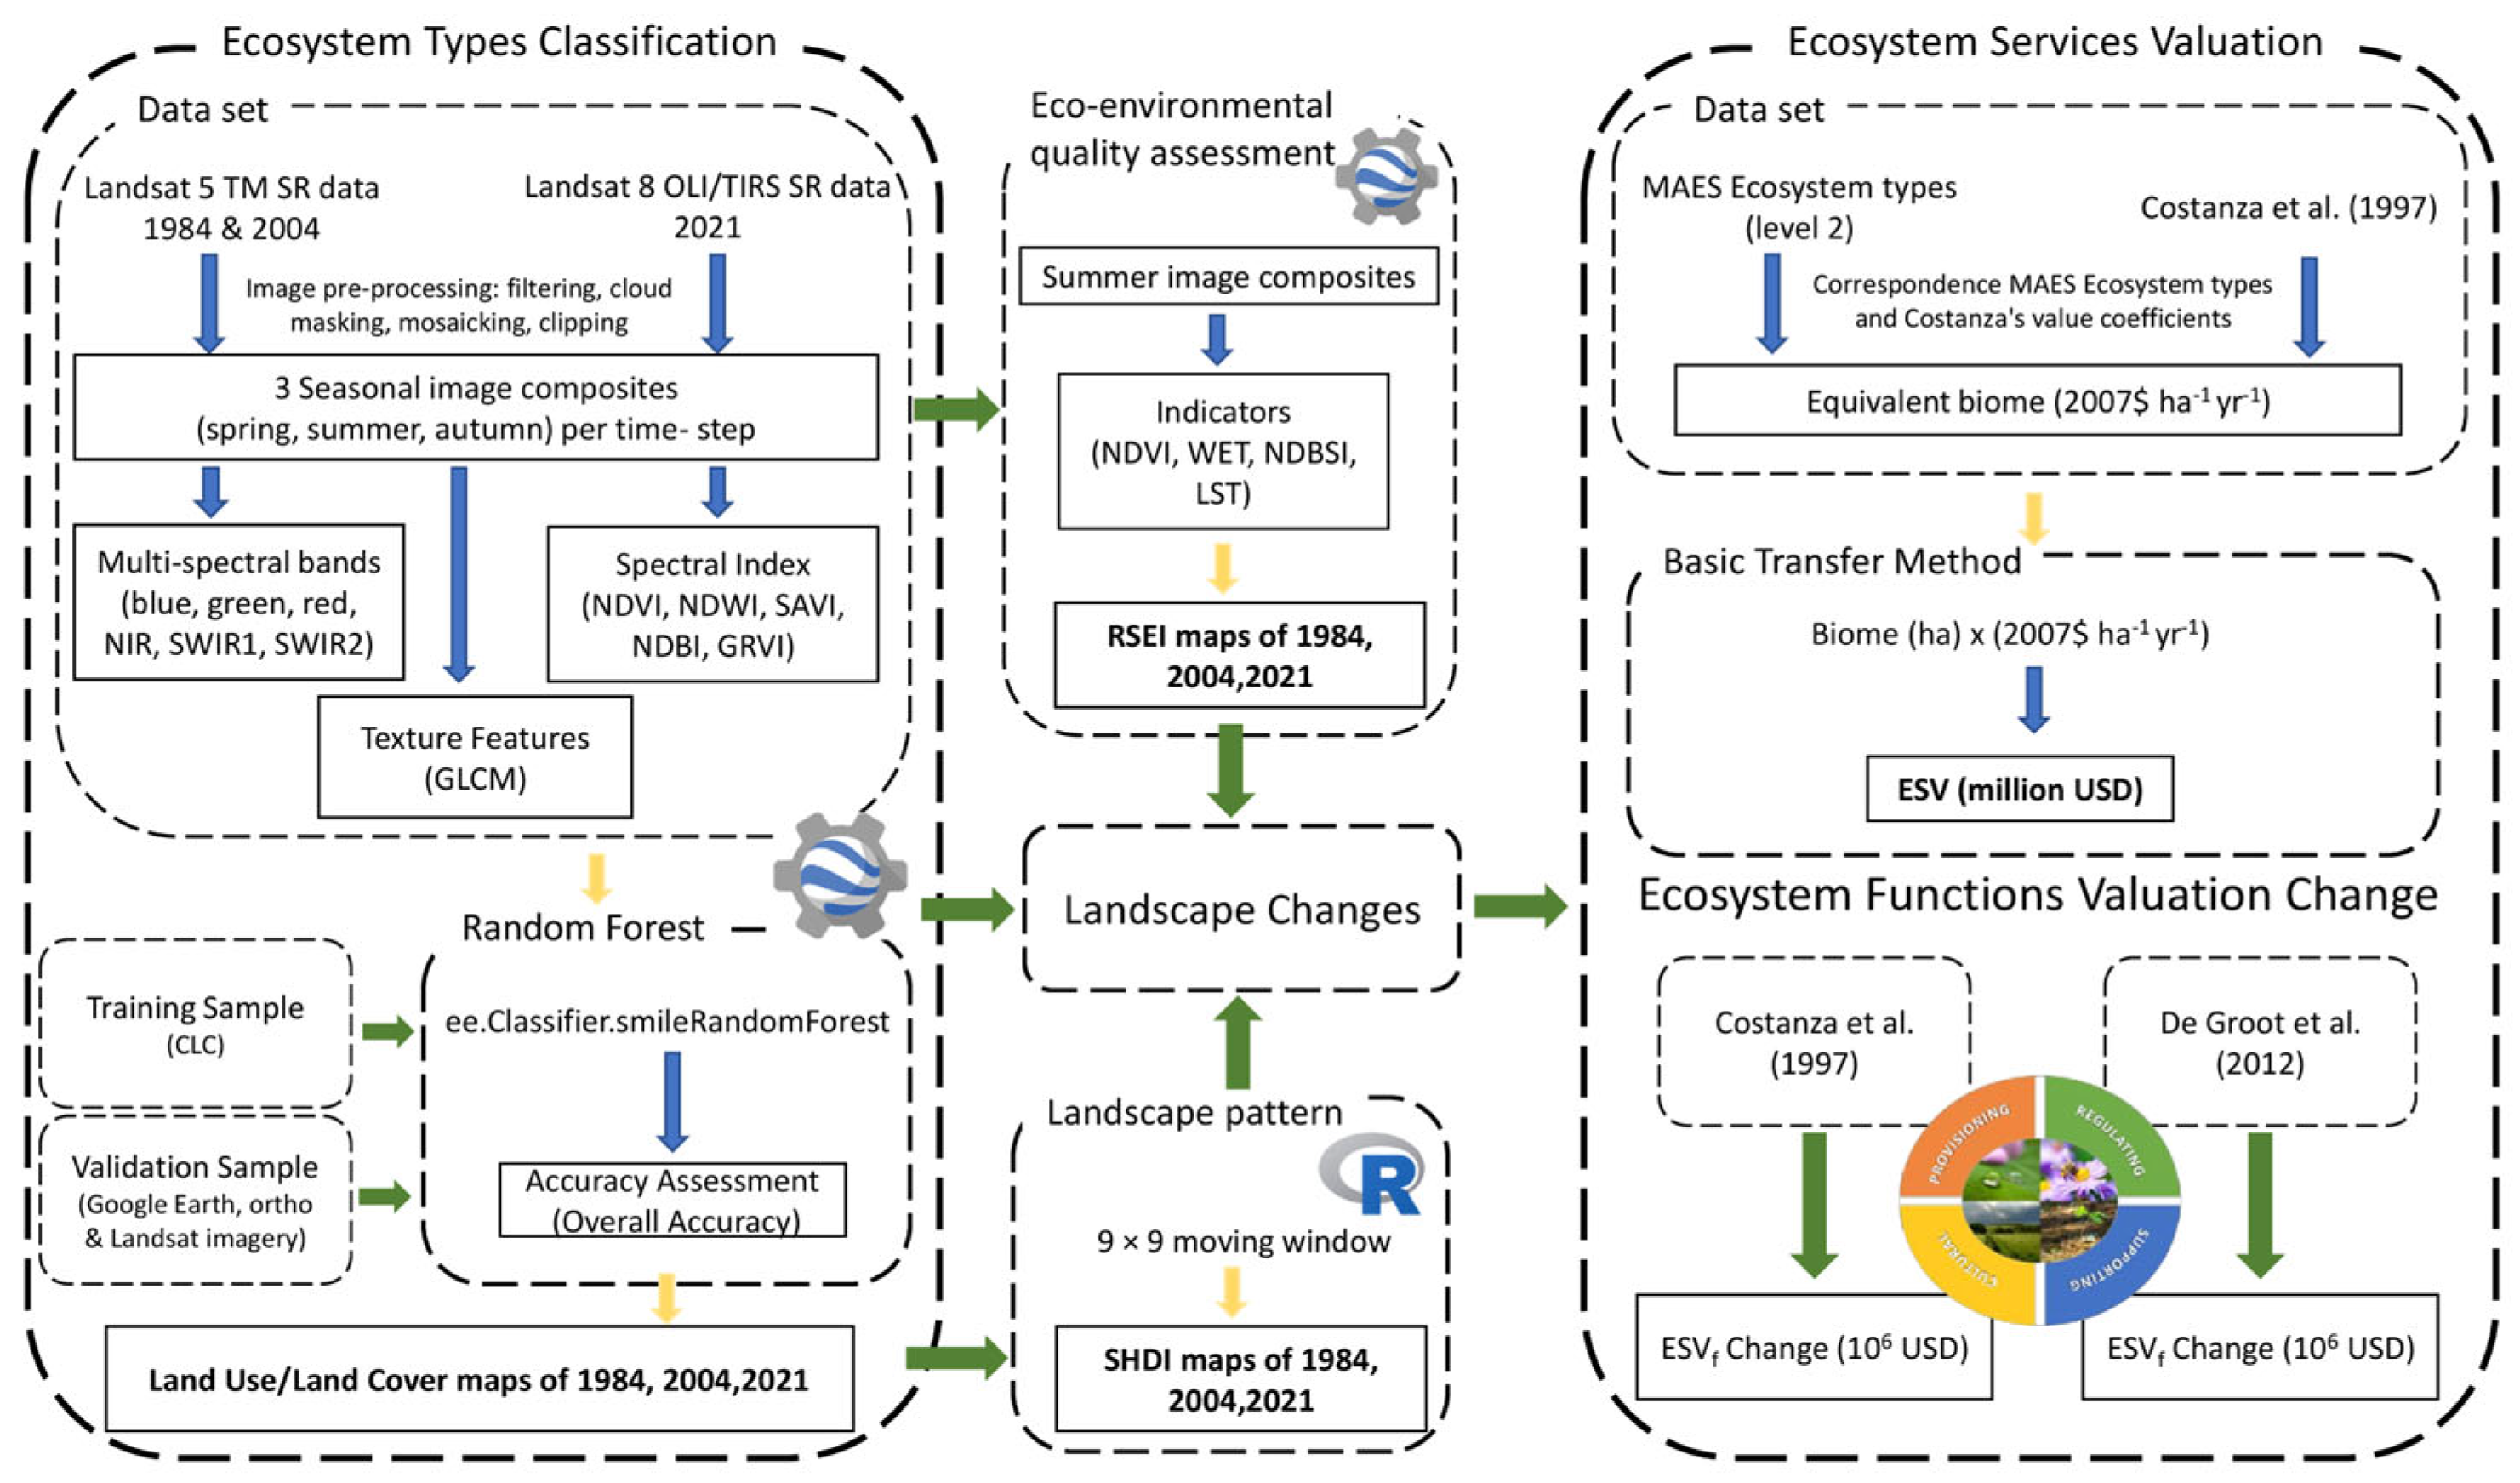
Figure 1. Study Workflow.
Land 12 01140 g001
Figure 2. The case studies of the Laspias and Lissos river basins.
Land 12 01140 g002
Figure 3. Land Use/Land Cover maps of the Lissos (ac) and Laspias (df) river basins in 1984, 2004, and 2021, respectively.
Land 12 01140 g003
Figure 4. Sankey diagram of the LULC changes from 1984 to 2004 and 2021 for the Lissos (a) and Laspias (b) river basins.
Land 12 01140 g004
Figure 5. Spatiotemporal distribution of the Shannon diversity index (SHDI), using a moving window of 9 × 9 pixels, of the Lissos (ac) and Laspias (df) river basins in 1984, 2004, and 2021, respectively.
Land 12 01140 g005
Figure 6. Spatial distribution of RSEI of the Lissos (ac) and Laspias (df) basins in 1984, 2004, and 2021 respectively.
Land 12 01140 g006
Figure 7. ESV change rate (%) for each timestep in Lissos river basin.
Land 12 01140 g007
Figure 8. ESV change rate (%) for each timestep in Laspias river basin.
Land 12 01140 g008
Figure 9. ES groups values from 1984 to 2021 in the Lissos river basin.
Land 12 01140 g009
Figure 10. ES groups values from 1984 to 2021 in the Laspias river basin.
Land 12 01140 g010
Figure 11. Spatial distribution of ESV in relation to LULC changes from 1984 to 2021 in the Lissos (ac) and Laspias (df) river basins.
Land 12 01140 g011
Table 1. Landsat composites for 1984, 2004, and 2021 during spring, summer, and autumn months.
YearSeasonLandsat 5 (TM)Landsat 8 (OLI/TIRS)Dataset
1984Spring1986/03/01–1986/05/31-LT05/C02/T1_L2
Summer1984/06/01–1984/08/31-
Autumn1984/09/01–1984/11/30-
2004Spring2005/01/01–2005/05/31 LT05/C02/T1_L2
Summer2004/06/01–2004/08/31-
Autumn2004/09/01–2004/10/31-
2021Spring-2021/03/01–2021/05/31LT08/C02/T1_L2
Summer-2021/06/01–2021/08/31
Autumn-2021/09/01–2021/10/31
Table 2. LULC classes used in this study, following the “Correspondence between Corine Land Cover classes and Ecosystem types” table formed according to MAES (2013).
Ecosystem Types Level 2CLC Level 2CLC Level 3
Urban (Urb)1.1. Urban fabric
1.2. Industrial, commercial, and transport units
1.3. Mine, dump, and construction sites
1.4. Artificial non-agricultural vegetated areas
Cropland (Crop)2.1. Arable land
2.2. Permanent crops
2.4. Heterogeneous agricultural areas
Grassland (Grass)2.3. Pastures3.2.1. Natural grassland
Woodland and Forest
(W–F)
3.1. Forests3.2.4. Transitional woodland and shrub
Heathland and Shrub
(H–S)
3.2. Shrub and/or herbaceous vegetation association3.2.2. Moors and heathland
3.2.3. Sclerophyllous vegetation
Sparsely Vegetated Land
(SVL)
3.3. Open spaces with little or no vegetation
Wetlands (Wet)4.1. Inland wetlands
Rivers and Lakes (R–L)5.1. Inland waters
Table 3. Spectral indices and formulas used in the classification model.
Spectral IndexIndex FormulaReference
Normalized Difference
Vegetation Index (NDVI)
NDVI = NIR RED NIR + RED [28]
Normalized Difference Water
Index (NDWI)
NDWI = NIR SWIR NIR + SWIR [29]
Soil-Adjusted Vegetation
Index (SAVI)
SAVI = NIR RED NIR + RED + 0.5 × ( 1.0 + 0.5 ) [30]
Normalized Difference
Built-up Index (NDBI)
NDBI = SWIR NIR SWIR + NIR [31]
Green–Red Vegetation
Index (GRVI)
GRVI = NIR GREEN [28]
Table 4. NDVI, WET, NDSI, calculation formula, and explanation.
IndicatorsIndex FormulaExplanationReference
Normalized Difference
Vegetation Index (NDVI)
NDVI = NIR RED NIR + RED NIR and RED represent Landsat 5 TM and Landsat 8 OLI/TIRS bands, respectively.[28]
Wetness (WET) WET = β 1 BLUE + β 12 GREEN +
β 3 RED + β 4 NIR + β 5 SWIR 1 + β 6 SWIR 2
βi are parameters and BLUE, GREEN, RED, NIR, SWIR1, SWIR2 bands of Landsat 5 TM and Landsat 8 OLI/TIRS, respectively.[39,40]
Normalized Difference Built-Upand Soil Index (NDBSI) NDBSI =   SI + IBI 2 SI and IBI represent Soil Index and Building Index, respectively.[41]
Land Surface Temperature (LST) LST = T 1 + λ Τ ρ ln ε λ is the central wave length of the thermal band of Landsat 5 TM and Landsat 8 OLI/TIRS, ρ = 1.438 × 10⁻² mK, ε is the land surface.[38]
Table 5. Correspondence between MAES ecosystem types, equivalent biomes, and value coefficients, according to Costanza’s methodology.
MAES Ecosystem Types
(Level 2)
Equivalent BiomeValue Coefficient
(2007 $ ha−1 yr−1)
Urban (Urb)Urban6661
Cropland (Crop)Cropland5567
Grassland (Grass)Grass/Rangelands4166
Woodland and forest (W–F)Forest3800
Heathland and shrub (H–S)Grass/Rangelands4166
Sparsely vegetated land (SVL)Temperate/Boreal3137
Wetlands (Wet)Wetland140,174
Rivers and lakes (R–L)Lakes/rivers12,512
Table 6. Percentage of eco-environment quality levels in the Lissos and Laspias river basins in 1984, 2004, and 2021.
LissosLaspias
RSEI Level198420042021198420042021
Poor (0–0.2)4.556.151.912.929.270.21
Fair (0.2–0.4)37.5333.2633.1557.3341.6928.36
Moderate (0.4–0.6)30.0830.6731.6027.0533.9151.63
Good (0.6–0.8)21.2323.2726.8611.3513.5816.48
Excellent (0.8–1)6.626.666.491.341.553.31
Table 7. ESV and changes for each equivalent biome in Lissos river basin from 1984 to 2021.
ESV (Million USD)
1984–20042004–20211984–20211984–2021
BiomesArea (ha)ValueArea (ha)ValueArea (ha)Value(%)
Urban304.472.03248.041.65552.513.6832.7
Cropland−1998.54−11.13−1066.86−5.94−3065.40−17.07−5.6
Grass/Rangelands−1271.1−5.30−4433.94−18.47−5705.01−23.77−17.5
Forest3574.3513.583795.1214.427369.4728.0013.5
Temperate/Boreal−220.86−0.691362.244.271141.383.5828.1
Wetlands−330.57−46.34−38.61−5.41−369.18−51.75−49.5
Lakes/Rivers−58.32−0.73−61.34−0.77−119.66−1.50
Total −48.57 −10.24 −58.81
Table 8. ESV and changes for each equivalent biome in Laspias river basin from 1984 to 2021.
ESV (Million USD)
1984–20042004–20211984–20211984–2021
BiomesArea (ha)ValueArea (ha)ValueArea (ha)Value(%)
Urban198.271.3223.310.16221.581.4833.5
Cropland10.620.06−2119.32−11.80−2108.70−11.74−14.0
Grass/Rangelands−156.33−0.651159.924.831003.594.1824.1
Forest47.430.18496.351.89543.782.0757.2
Temperate/Boreal14.850.05419.131.31433.981.36302.9
Wetlands−78.03−10.9444.466.23−33.57−4.71−25.2
Lakes/Rivers−39.60−0.50−22.59−0.28−62.19−0.78−79.0
Total −10.48 2.34 −8.14
Table 9. Ecosystem functions valuation and overall change from 1984 to 2021 in the Lissos river basin based on Costanza’s pricing system [8].
ESVf (Million USD)Overall Change
Ecosystem Services CategoriesEcosystem Functions198420042021Value(%)
ProvisioningFood production7.887.747.61−0.27−3.47
Raw materials7.748.198.741.0113.01
Water supply3.912.542.28−1.63−41.80
Regulating and
Supporting
Gas regulation0.330.270.24−0.09−27.24
Climate regulation8.088.569.221.1414.11
Disturbance regulation3.502.001.83−1.66−47.52
Water regulation2.562.241.90−0.66−25.76
Biological control2.182.111.99−0.19−8.51
Waste treatment11.3510.119.97−1.38−12.14
Nutrient cycling19.7621.0522.422.6613.46
Habitat/refugia0.230.130.11−0.11−49.49
Pollination1.571.511.39−0.19−11.78
CulturalRecreation4.354.374.630.286.36
Cultural0.770.490.47−0.31−39.78
Total 74.2171.3372.80
Table 10. Ecosystem functions valuation and overall change from 1984 to 2021 in the Laspias river basin based on Costanza’s pricing system [8].
ESVf (Million USD)Overall Change
Ecosystem Services CategoriesEcosystem
Functions
198420042021Value(%)
ProvisioningFood production1.181.151.17−0.01−1.08
Raw materials0.150.150.230.0855.34
Water supply0.680.300.42−0.26−38.14
Regulating and
Supporting
Gas regulation0.050.040.050.005.47
Climate regulation0.150.150.260.1178.38
Disturbance regulation0.610.250.45−0.15−24.96
Water regulation0.450.230.11−0.34−75.26
Biological control0.460.460.44−0.02−5.37
Waste treatment1.070.711.06−0.01−0.86
Nutrient cycling0.340.360.540.2057.25
Habitat/refugia0.040.020.03−0.01−25.22
Pollination0.310.310.310.00−1.41
CulturalRecreation0.170.120.190.0211.69
Cultural0.120.050.09−0.03−23.12
Total 5.764.285.34
Table 11. Coefficient of Sensitivity (CS) from 1984 to 2021 in the Laspias river basin.
ESV (Million USD)Coefficient of Sensitivity
Equivalent BiomeAdjustment198420042021198420042021
UrbanVC + 50%6.618.598.830.0340.0480.049
VC − 50%2.202.862.94
CroplandVC + 50%125.81125.90108.200.6490.7060.595
VC − 50%41.9441.9736.07
Grass/RangelandsVC + 50%26.0125.0432.280.1380.1450.193
VC − 50%8.678.3510.76
ForestVC + 50%5.415.688.510.0280.0320.047
VC − 50%1.801.892.84
Temperate/BorealVC + 50%0.670.742.720.0030.0040.015
VC − 50%0.220.250.91
WetlandsVC + 50%27.9911.5820.930.1440.0650.115
VC − 50%9.333.866.98
Lakes/RiversVC + 50%1.480.730.310.0080.0040.002
VC − 50%0.490.240.10
Table 12. Coefficient of Sensitivity (CS) from 1984 to 2021 in the Lissos river basin.
ESV (Million USD)Coefficient of Sensitivity
Equivalent BiomeAdjustment198420042021198420042021
UrbanVC + 50%16.8919.9422.410.0140.0180.021
VC − 50%5.636.657.47
CroplandVC + 50%454.32437.63428.720.3880.3990.396
VC − 50%151.44145.88142.91
Grass/RangelandsVC + 50%203.20195.25167.540.1740.1780.155
VC − 50%67.7365.0855.85
ForestVC + 50%312.07332.44354.070.2670.3030.327
VC − 50%104.02110.81118.02
Temperate/BorealVC + 50%19.1118.0724.480.0160.0160.023
VC − 50%6.376.028.16
WetlandsVC + 50%156.8687.3579.230.1340.0800.073
VC − 50%52.2929.1226.41
Lakes/RiversVC + 50%8.076.985.820.0070.0060.005
VC − 50%2.692.331.94
Disclaimer/Publisher’s Note: The statements, opinions and data contained in all publications are solely those of the individual author(s) and contributor(s) and not of MDPI and/or the editor(s). MDPI and/or the editor(s) disclaim responsibility for any injury to people or property resulting from any ideas, methods, instructions or products referred to in the content.