Abstract
Chemometric analysis is often used as an effective indicator of the supply capacity of nutrients in soil–plant systems and their biogeochemical cycles. Understanding ecological stoichiometric characteristics of C, N and P in soils under various land uses is crucial to guide ecological restoration and agricultural cultivation in karst rocky desertification region. However, data on ecological stoichiometry at different land uses in karst areas is limited. This study aimed to evaluate the effects of different land uses on soil ecological stoichiometric ratios and further identify the factors that influence soil ecological stoichiometric ratios. The topsoil from forest, shrub and cultivated land (paddy field and dry land) both in a karst area and non-karst area (as a reference) of Mashan County was sampled to investigate the spatial variance of the ecological stoichiometric characteristics of C, N and P under different land uses. The results show that: (1) Land-use types significantly determined the spatial heterogeneity of soil ecological stoichiometry in karst areas. (2) Soil organic carbon (SOC) was not significantly different between shrubs in the karst area and forests in the non-karst area (p = 0.595), but there were virtual differences in total nitrogen (TN), total phosphorus (TP), C:N, C:P and N:P between shrubs in the karst area and forests in the non-karst area (p < 0.01). (3) The contents of SOC, TN, and C:P, N:P in the study area were all generally higher in forests than those in cultivated land, and the content of TP was lower in forests than cultivated land, while C:N in cultivated land was higher than in shrubs in karst areas, and C:N was higher in forests than in cultivated land in non-karst areas. (4) Available nitrogen (AvN) was the main factor influencing stoichiometry in shrubs in karst areas, while pH, AvN, available phosphorus and elevation were the main factors in forests in non-karst areas, indicating that these factors significantly affect the soil ecological stoichiometric ratio during land-use changes. This study helps to understand the variations in soil ecological stoichiometric ratios under land-use changes. It provides guidance for the sustainable management of revegetation in karst regions in southwest China.
1. Introduction
Ecological stoichiometry is a cross-cutting science that focuses on the relative elemental (mainly organic carbon (C), nitrogen (N) and phosphorus (P)) composition and dynamic balance of ecologically interacting participants in an ecosystem [1,2]. As an important site for plant growth and development, soil not only provides the most basic elements (C, N, P) for plant growth [3,4], but its stoichiometric ratio is also an important indicator for evaluating soil nutrients and soil quality [5]. Among various elements, soil C, N and P are considered the most important components, because the soil C:N:P stoichiometric ratio can reflect and measure the supply of soil nutrients. Additionally, C:N:P stoichiometry is frequently employed as a potent indication of ecosystem trophic status and biogeochemical cycling [5,6]. Karst rocky desertification in the southwest of China accounts for more than 40% of the total area [7], and is characterized by a thin soil layer, slow soil formation, high risk of soil erosion and an extremely fragile ecosystem [8]. The karst area, along with loess, desert and cold desert, is listed as one of four environmentally fragile areas in China. Therefore, it is important to investigate the soil C, N and P and their stoichiometric characteristics, as well as the influencing factors for the sustainable development of agriculture in the karst areas of southwest China.
Soil quality in the karst regions of southwest China is influenced by various factors, such as parent material, topography, vegetation type, and human activities [9,10]. Numerous studies have shown that parent material and land-use type are important factors influencing the content and distribution of nutrients and soil physicochemical properties in karst areas [11,12]. The natural geography, vegetation cover, land-use and soil erosion in karst areas have changed the physicochemical properties and microbial characteristics of soils in karst areas, which makes the soils in karst areas show more spatial heterogeneity than in non-karst areas [5,7]. They significantly change the soil C, N and P contents, stoichiometric characteristics, and their spatial distribution [13,14,15]. Ecological stoichiometry of plants and soil can reflect the variations of nutrients in karst ecosystems. Plants obtain nutrients directly from the soil, while the withered plant material of plants is decomposed by microorganisms and dipped into the soil, and thus C, N and P within the ecosystem are interconverted between plants, microbes and soil [1,16]. High pH and high abundances of Mg and Ca are characteristics of the soil physicochemical features of the karst zone [3]. Microbial abundance and diversity not only decrease with pH [17], but also with soil depth and the type of land-use [18]. For example, the pH and Ca content of limestone are significantly higher than those of clastic rocks, which results in Ca combining with the unstable C in the soil to form stable C in the soil that is not easily decomposed by mineralization [11,19]. Additionally, differing vegetation covers or planting ages result in varying effects of land-use types on soil nutrients [20]. It has been found that forest areas in karst regions had high soil C, N and P stoichiometry values, whereas drylands had low values, depending on the type of land-use [21]. In karst regions of southwest China, Song et al. [5] and Lu et al. [22] studied the impacts of soil and microbial ecological stoichiometry on plant succession, and both studies demonstrated an increase in soil organic carbon, total nitrogen, C:P and N:P with vegetation succession. In his study of the SOC and TN contents of soils in natural succession, Contreras-Cisneros [23] discovered a declining tendency in soil SOC content with longer following periods. However, Abdallah [24,25] discovered no appreciable differences in SOC and TN in soils in Oregon, the USA, 13 years after Juniperus occidentalis trees were chopped as compared to uncut soils.
Various data analysis techniques have been used to study the factors affecting soil C, N, P and its stoichiometry. One-way analysis of variance (ANOVA) and least significant difference were used to investigate the effects of slope orientation, land-use type, and soil depth on soil organic carbon (SOC), total nitrogen (TN), total phosphorus (TP) and their stoichiometry in karst areas, leading to findings that there were no significant differences between land-use type and soil depth in SOC, TN, TP and their stoichiometry, which were mainly influenced by slope orientation [26]. Similarly, Yang [3] found that soil C:N, C:P and N:P were significantly higher in sloping soils than in basins in the southwest karst region by using ANOVA. By contrast, Zhang [27] and Gu [28] found that SOC, TN, TP and their stoichiometry were influenced by the soil-forming parent material, soil type, and land uses via ANOVA and kriging interpolation analysis. Other researchers have examined soil and microbial ecological stoichiometry in the karst region of southwest China at various stages of vegetation succession using one- and two-way ANOVA and Pearson correlation, as well as non-parametric tests. Their results show that SOC, TN, C:P and N:P increase with vegetation succession [5,22].
Furthermore, various methods were developed to evaluate the spatial patterns of nutrients and soil ecological stoichiometry. Due to the complexity and heterogeneity of soil systems, it is difficult to develop a general model or approach for analyzing soil ecological stoichiometry, such as Pearson correlation or linear connections [3,29,30]. However, the linear correlation between qualitative factors such as land-use type, soil type and soil stoichiometry does not explain the contribution of factor interactions to deriving the spatial variability of soil elements and their stoichiometry in the whole study area. Therefore, a method is needed that can objectively explain the connection of the dependent variables (e.g., SOC, TN, TP and their stoichiometry) from independent variables (e.g., land-use type, soil type, elevation and available phosphorus (AvP)). A geographical detector is a statistical method for detecting spatial variability and revealing factors affecting the dependent variables. The advantage of such methods is that they can detect both numerical and qualitative data; moreover, they can detect the interaction between two factors and their effect on the dependent variables (note: the interaction between two factors can be a multiplicative relationship, a superposition relationship, etc.) [31].
The mountain peak valley in Mashan County is a typical representative of karst landforms in the subtropical region of China, and there is a variety land-use types, which may affect the spatial distribution of soil ecological stoichiometry. Therefore, this study used factor detection and interaction detection in the geographical detector, as well as redundancy analysis, to spatially analyze the soil C, N and P stoichiometry in the karst area of Mashan County, Guangxi. It explored the response of soil C, N, P and their ecological stoichiometric characteristics to land-use using the geographical detector. The results of this study may provide a practical and theoretical basis for soil nutrient cycling and land management in fragile karst areas.
2. Materials and Methods
2.1. Study Area
The study area is located in the northern part of Mashan County, Nanning City, Guangxi Zhuang Autonomous Region (Figure 1), with the geographical coordinates of 23.73°~23.85° N, 108.09°~108.20° E. It has an area of 64 km2 and is characterized by a southern subtropical monsoon climate, with four distinct climatic seasons and an annual average temperature of 21.3 °C. The rainfall is unevenly distributed across all seasons, with hot and humid summers and dry spells in spring and autumn. This is a typical karst area with alternating soils in karst and non-karst areas. The stratigraphy and lithology in the karst area mainly comprise the Carboniferous Ma’ping formation (C2mp), which is dominated by chert and siliceous rocks. By contrast, the non-karst areas are dominated by sand shale, Quaternary laterite matrix, and alluvium. Its main land-use types are paddy field, dry land, shrubs, and forests; the soil type corresponding to paddy field is hydragric anthrosols, the soil types corresponding to dry land are ferralsols and leptosols, and the soil types corresponding to shrubs and forests are ferralsols and leptosols, respectively [32].
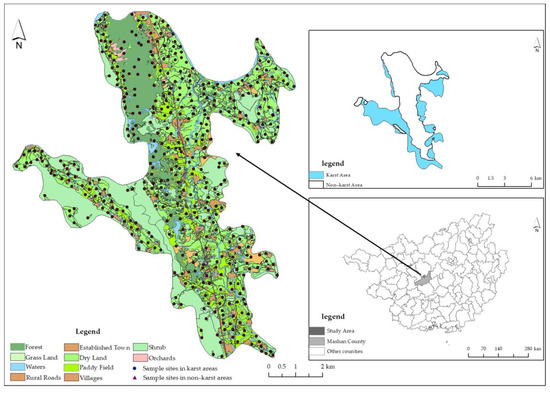
Figure 1.
Study area.
2.2. Sampling
According to the land-use map and geological background of the study area, four different land-use types of surface soil samples were sampled in this study, strictly in accordance with the relevant requirements of the Technical Specification for Soil Environment Monitoring (HJ/T166-2004) and associated technical requirements. Three to five subsamples were sampled at a radius of 20~50 m in checkerboard, “S” and “X” shapes to form an analyzing sample, resulting in 427 soil samples. The samples were laid out in representative sites, namely gentle slopes, flat dams between mountains, low-lying positions, etc. [33]. Debris, roots and other impurities were removed from the soil samples. Soil samples were dried under shade and then ground and passed through a 2 mm sieve for the determination of the soil’s physical and chemical properties (e.g., soil pH). Then, the samples were ground and passed through a 0.15 mm sieve for the determination of C, N, P and other elements.
2.3. Laboratory Analysis
The pH of the soil was determined by a DMP-2 mV/pH meter (QuarkLtd., Nanjing, China) and a water-to-soil ratio of 2.5:1. The content of SOC was determined using the K2Cr2O7-H2SO4 oxidation method; TN was determined using the semi-micro Kjeldahl method; TP was determined using the HClO4–H2SO4 digestion method followed by an Mo–Sb colorimetric assay [34,35]. Available nitrogen (AvN) was determined by a ferrous sulfate–zinc powder reduction and the alkaline solution–diffusion method. AvP was extracted using a hydrochloric acid-sulfuric acid-leaching agent or a sodium bicarbonate leaching agent [34]. Total potassium (TK) was determined using a NaOH melting method after dissolution using flame photometry [36]. Available potassium (AvK) was determined by ICP-AES with ammonium acetate leaching [36].
2.4. Data Analysis
This study used Excel 2016 for basic data processing. The data were processed for factor detection and cross-detection (geographical detector) analysis using the “GD” and “geodetector” packages in R. In both factor detection and cross-detection analysis, 10 factors (land-use type, soil type, parent material, AvN, AvK, AvP, TK, elevation, slope, pH) of SOC, TN, TP, C:N, C:P and N:P were selected, while 10 factors of SOC, TN, TP, C:N, C:P and N:P were selected to interpret and identify the relationship between the above 10 factors. An explanatory power of the independent variable X on attribute Y is represented by the q value (qv) [31]. A larger qv indicates a stronger explanatory power. The software of ArcGIS 10.1 was used for the kriging interpolation of soil C, N and P stoichiometry in the study area. Analysis of redundancy in four land-use types was carried out using Canoco5, and the redundancy factors were mainly AvN, AvP, AvK, TK, pH, elevation, slope and soil type, while parent material factors were used to explain the soil C, N, P and their stoichiometry. To examine the variations in soil C, N and P and their chemometric characteristics under different land-use types, the data were checked to see if they adhered to a normal distribution before performing one-way ANOVA in the SPSS software.
3. Results
3.1. Statistical Characteristics of Soil C, N and P Contents and Their Stoichiometry in the Study Area
Descriptive statistical analysis was performed on 427 soil samples, and the results are shown in Figure 2. The mean contents of SOC, TN and TP in the soil were 13.69, 1.50 and 0.80 g/kg, respectively, while the mean values of C:N, C:P and N:P were 10.57, 54.16 and 4.96, respectively. The coefficient of variation allows for the comparison of the degree of dispersion of data from different groups, which is important for measuring the degree of disparity in the data and the trend of change. The degree of variability in soil properties, according to the coefficient of variation, is divided into three categories in soil science: 0–15% for weak variability, 16–35% for moderate variability and greater than 36% for strong variability [37]. The variation coefficients for SOC, TN and TP in the study area were 37.09%, 30.17% and 43.17%, respectively. It can be seen that there is a moderate change in TN and a strong change in SOC and TP, with variation coefficients of 18.78%, 60.46% and 50.23% for C:N, C:P and N:P, respectively. Among the six coefficients of variation, it can be seen that C:P had the largest coefficient of variation, whereas C:N had the smallest coefficient of variation, indicating weak variation. From Figure 2 it can be seen that the mean contents of SOC, TN and TP were lower in non-karst areas than that in karst areas, while the mean values of C:N, C:P and N:P were higher than those in karst areas.
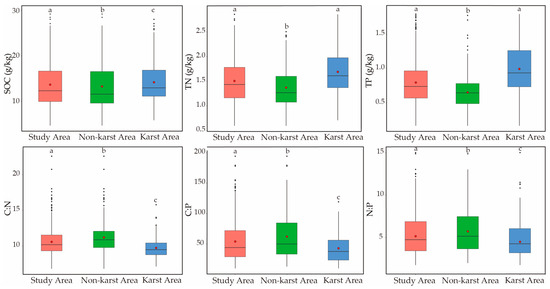
Figure 2.
Statistical characteristics of soil C, N and P contents and their stoichiometry. The letters a, b, and c indicating a significant difference at the p < 0.05 level.
One-way ANOVA was conducted to investigate the responses of C, N and P contents and ecological stoichiometry to different land-use types (Table 1). SOC and TN in both non-karst and karst areas differed significantly not only between cultivated lands but also between cultivated land and forests. TP did differ significantly between cultivated land and forests in non-karst areas, while it differed in all three land-use types in karst areas.

Table 1.
Soil C, N and P and their ecological stoichiometry characteristics (X ± SD) for the four land uses in the study area.
The SOC contents did not differ significantly between shrubs in karst areas and forests in non-karst areas. Soil TN and TP contents were significantly different between shrubs in karst areas and forests in non-karst areas. There was a significant difference in C:N, C:P and N:P between shrubs in karst areas and forests in non-karst areas.
3.2. Spatial Distribution Characteristics of Soil C, N and P Stoichiometry in the Study Area
Kriging interpolation results of C, N, P, C:N, C:P and C:P in soils in the study area are shown in Figure 3. Based on the interpolation of soil C, N, P stoichiometric data, it can be seen that the spatial distributions of SOC and TN have approximately the same trend, and the areas with SOC and TN contents greater than 14.49 and 1.59 g/kg, respectively, show strips as well as some blocks along the forests; the main land-use types were forests, paddy field and shrubs areas. TP content greater than 1.01 g/kg was mainly distributed in dry land surrounded by shrubs and paddy field. The spatial distribution trends of C:N, C:P and N:P in soils were consistent, and the land-use types were forests and paddy field.
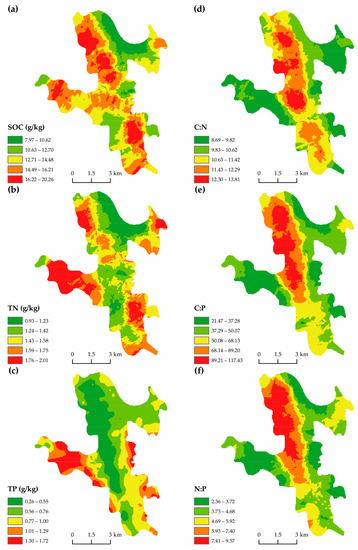
Figure 3.
Spatial distribution of soil C, N and P contents and their stoichiometry. (a–f) indicate the distribution of SOC, TN, TP content and C:N, C:P, N:P ratio, respectively.
3.3. Factors Influencing Spatial Variation in Soil C, N and P Stoichiometry
3.3.1. Factor Detection Results of the Spatial Differentiation of Soil C, N and P and Their Stoichiometry
The different influencing factors and interactions among them on the spatial variation of soil C, N and P, and their stoichiometry in the study area were quantitatively analyzed using factor detection. Ten factors, including land-use types, soil type, AvN, AvP, AvK, pH, parent material, elevation, slope and TK, were selected using the geodetector method. The results of the geodetector factor detection of soil C, N and P and their stoichiometry in the non-karst and karst areas are shown in Figure 4, where all listed factors fit the significance test (p < 0.05). The results show that there were eight factors could explain SOC in non-karst areas; the top three main factors are land-use type, AvN, and soil type, indicating that land-use type, AvN and soil type are the main factors affecting SOC in non-karst areas. In the soil TN in non-karst areas, AvN, land-use type and soil type accounted for a relatively large qv. Similarly, there were eight main factors influencing soil TP, with the first three main factors being AvP, land-use type and pH, and soil type having the least qv. In karst areas, soil SOC had six explanatory factors, of which the first three main factors were AvN, land-use type and soil type, and the least explanatory power was that of AvK. In karst soils, both TN and TP had four explanatory factors, of which the main influencing factors in TN were AvN, land-use type and pH, and the main factors in TP were AvP, AvK and land-use type. The results show that influencing factors in non-karst areas were different from those in karst areas, but the main factors affecting the distribution of C, N and P in non-karst and karst soils were basically the same.
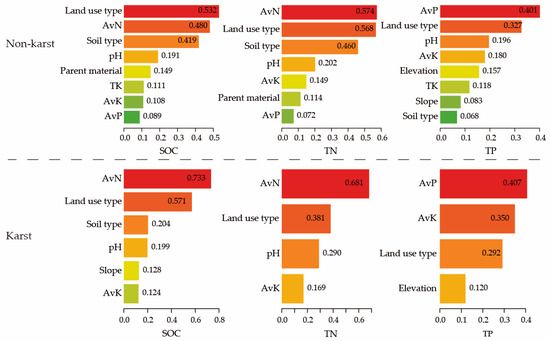
Figure 4.
Analysis results of soil C, N and P influencing factors in non-karst and karst areas.
The results of soil C, N and P and their stoichiometry in the non-karst and karst areas according to geodetector factors are shown in Figure 5. The results show that there were four factors affecting soil C:N in non-karst areas, with the largest qv being soil type and the smallest being pH. There were nine factors affecting soil C:P, with the first three main factors being land-use type, AvP and elevation, and AvN having the smallest amount of explanation. The first three key factors—land-use type, AvP and elevation—were among the eight variables that determine the soil N:P. The factor of land-use type determines soil C:N in the karst areas. The first two main factors affecting soil C:P and N:P in non-karst and karst areas were the same, both being land-use type and AvP, and in soil C:P these two factors had greater qv in non-karst areas than in karst areas.
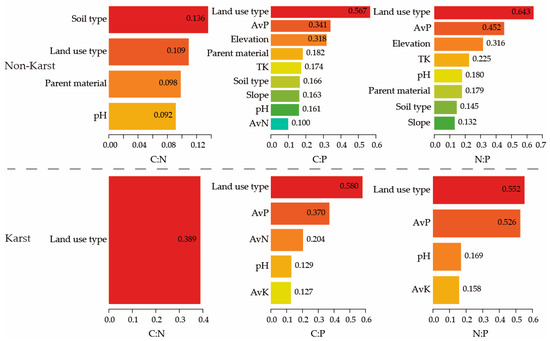
Figure 5.
Results of the analysis of ecological stoichiometric factors of C, N and P in soils from non-karst and karst areas.
In general, the qv of the factors influencing soil C, N and P and their stoichiometry in the karst and non-karst areas were basically the same throughout the study area, with more explanatory factors in the non-karst areas than in the karst areas. The main influencing factors for karst and non-karst areas were land-use type and AvN and soil type, elevation and pH, respectively, indicating that these five factors were the main factors influencing the spatial heterogeneity of soil C, N and P and their stoichiometry in the study area.
3.3.2. Results of Interaction Detection of Spatial Variation in Soil C, N and P and Their Stoichiometry
The results of the interaction detection analysis in non-karst and karst areas are shown in Figure 6, which shows that mainly nonlinear enhancement and two-factor enhancement between the influencing factors in the non-karst areas suggest that the qv of factor interactions for SOC, TN and TP is greater than that of single factors. In both non-karst and karst soil SOC, the factor pairs interacting with land-use type and AvN were greater than 0.562, and were mainly bi-factorially enhanced and non-linearly enhanced. In non-karst areas, SOC was influenced by factor pairs of soil types in addition to factor pairs of land-use types and AvN. Additionally, AvN and pH factor pairs in karst areas had the largest qv. Soil TN in non-karst and karst areas was also influenced by land-use type factor pairs and AvN factor pairs, and soil TN in non-karst areas was also influenced by soil type factor pairs. Soil TN in non-karst and karst areas was also influenced by land-use type factor pairs and AvN factor pairs; similarly, soil TN in non-karst areas was also influenced by soil type factor pairs. The qv for pH factor pairs in soil TN in karst areas were higher than in non-karst areas. Soil TP in non-karst and karst areas was influenced by both land-use type factor pairs and AvP factor pairs.
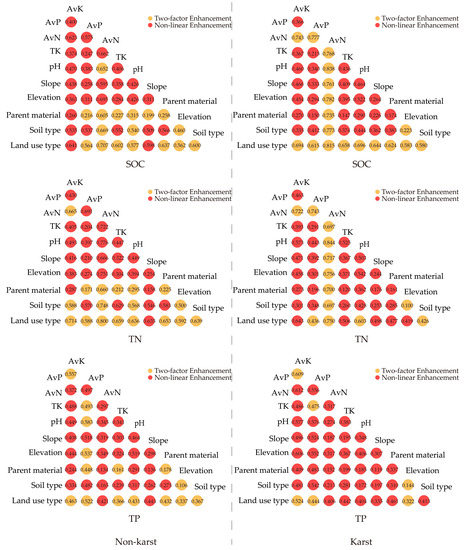
Figure 6.
Interaction detection results of soil C, N and P factors in non-karst and karst areas.
Land-use type, soil type, AvN, AvP and pH dominated the interaction tests for soil C, N and P in non-karst and karst areas, while the qv of most soil type interaction factor pairs for SOC and TN were bigger in non-karst areas than those in karst areas, indicating that non-karst areas are much more likely influenced by soil type than karst areas. Land-use type had a greater impact on SOC in karst areas than in non-karst soils, while the opposite was true in soil TN.
The interaction detection of 10 factors affecting soil C, N and P and stoichiometry in non-karst areas using a geographical detector (Figure 7) revealed that in the non-karst zone soil, C:N did not have large qv although each interaction factor pair was mainly bi-factor and non-linearly enhanced. However, the qv of both the land-use type factor pair and the soil type factor pair were higher in the karst area soil C:N than in the non-karst area. Compared to soil C:P and N:P in karst areas, C:P and N:P in non-karst areas were more influenced by slope factor pairs, elevation factor pairs and parent material factor pairs. Soil C:P was more influenced by land-use type in karst areas than in non-karst areas, and the opposite was true in karst soil N:P and non-karst soil N:P.
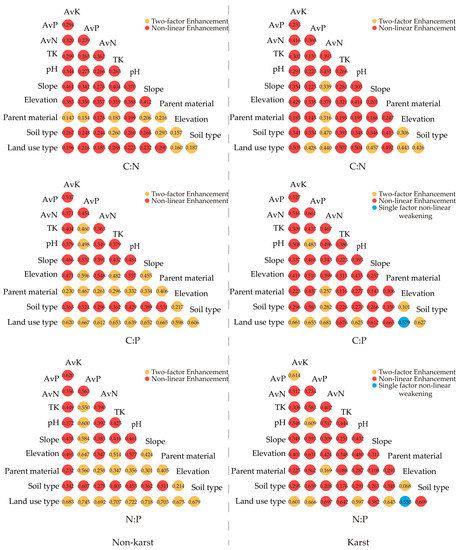
Figure 7.
Results of the interaction of C, N and P ecological stoichiometry factors in soils from non-karst and karst areas.
The interaction of factors between karstic and non-karstic soils shows that land-use type, soil type, pH, elevation, AvN, etc. have an important influence on soil C, N and P and their ecological stoichiometry.
3.3.3. Influence of Soil Physicochemical Properties and the Soil Environment on the Spatial Partitioning of C, N and P Stoichiometry under Different Land-Use Practices
A redundant analysis of soil physicochemical properties, soil environment and soil stoichiometric ratios under different land-use practices was performed using Canoco5 software to better elaborate on and analyze the factors affecting soil C, N and P and soil stoichiometric ratios. Soil C, N, P, C:N, C:P and N:P were used as species factors, while parent materials, soil type, pH, elevation, slope, TK, AvP, AvP and AvN were used as environmental factors for the redundancy analysis.
Gauch [38] stated that if the cumulative explanation of environment–species relationships in the first three ranking axes is greater than 40%, the ranking results are valid. In this study, the minimum cumulative explanation of soil stoichiometric characteristics and environmental factors in the first two axes was 89.45%, indicating a good ranking. The first two axes can better explain the relationship between environmental factors and soil C, N and P and stoichiometry.
Soil C, N and P and their stoichiometric characteristics shown in Figure 8 in the dry land, paddy field and forests land within the non-karst area were explained by 37.07%, 47.14% and 47.18% in the Axis-1, respectively. The qv of the factors in descending order (p < 0.05) is as follows: AvP > elevation > parent material > soil type > AvN > AvK in dry land, AvP > AvN > TK > pH > AvK in paddy field, and pH > AvN > TK > elevation > parent material > AvK> AvP > in forests.
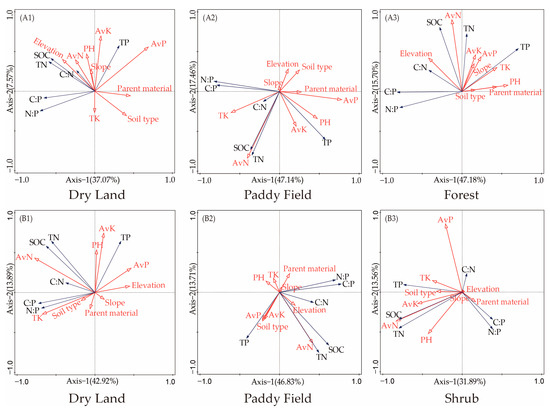
Figure 8.
Dichotomous ranking of the redundancy analysis of soil C, N and P stoichiometric characteristics in relation to physicochemical/environmental factors in non-karst and karst areas. A1, A2, A3 are non-karst land-use types; B1, B2, B3 are karst land-use types.
Soil C, N and P and their stoichiometric characteristics (shown in Figure 8) of dry land, paddy field and shrubs in the karst area had 42.92%, 46.83% and 31.89% explanation in the Axis-1, respectively. It can be seen that soil chemical properties and environmental factors had different magnitudes of influence on soil C, N and P and their stoichiometric characteristics: AvN > TK > AvP > elevation > AvK > pH in dry land, AvN was the only significant explanation for the percentage in paddy field, and AvN > AvP > AvK > pH in shrubs. In dry land, paddy fields and shrubs, AvN was highly significantly and positively correlated with SOC and TN. This was mainly related to the presence of 90% of the TN in soil organic matter, and TP showed a highly significant negative correlation with soil C:P and N:P.
AvN was significantly and positively correlated with SOC and TN in both karst and non-karst areas. In non-karst areas, cultivated soil C, N and P and their stoichiometry were negatively correlated with soil type, and forest soil type was negatively correlated with TP. In karstic drylands and scrub, pH was negatively correlated with soil C, N and P. Forests are more susceptible to pH and parent material, etc., than shrubs.
4. Discussion
4.1. Characteristics of Soil C, N and P Contents and Their Spatial Distribution under Different Land-Use Patterns
The contents of SOC, TN and TP and their stoichiometry all showed strong spatial heterogeneity in this study. SOC TN and TP were closely related to the type of land use. This is mainly due to the higher amount of litter returned to the forests soils, the strong root secretions, and the richness of microbial residues contained in them [39,40]. In addition, cultivated land reduces the input of organic matter into the ground and the regular tillage of cultivated land makes the soil more aerated and accelerates the decomposition of organic carbon by microorganisms [28,40]. It was proposed that soil TP decreases with the increased in soil development time [41]. The soil TP is gradually depleted during the continuous maturation of the cultivated land, while the continuous phosphorus producing weathering of rocks in the study area, as well as artificial fertilization and other measures, have resulted in the TP content in the cultivated land being no lower than the national average level. Previous research has shown that land-use can directly influence the spatial distribution of elements in soils, and the relative availability of C, N and P in soils changed as a result of excessive human intervention in soil [42].
Geographical detectors were an effective tool to assess the relationships between geographic phenomena and drivers [43] and are widely used in ecology, physical geography, and environmental science [44]. When geographical detectors analyze multiple influencing factors, the relative importance of each driver to the degree of influence of the dependent variable can be well-quantified. For example, Liu [45] found that the land-use type and soil type were determinants of SOC content and spatial differentiation based on a geodetector study. Du [46] used a geographical detector to quantify natural factors and human activity in the soil organic matter of blackland in Northeast China, and found that soil organic matter decreased with increasing temperature, population, soil erosion, elevation and topographic relief. In this study, the factor detector and interaction detector of the geodetector were selected to analyze the influencing factors and the interaction between the influencing factors that affect soil C, N and P and their stoichiometry. In general, soil C, N and P and their stoichiometry are mainly influenced by land-use type, AvN, soil type, AvP, parent materials and pH. The strong explanatory power of land-use type and AvN on SOC and TN indicates that land-use type, AvN, SOC, C:P and N:P content accumulation have a strong correlation, which is mainly because different land-use types produce changes in the physical and chemical properties of soil, surface vegetation, etc., which in turn affect soil C, N and P and stoichiometry [47]. Additionally, parent materials have a larger qv because the content of P and AvP in the soil depends on the type of parent materials [6], and enrichment of P in soil is due to inactivity of P in intense rock weathering [2]. Different soil types have different physicochemical properties (Supplementary Figure S1). For instance, Cao’s [48] research of leptosols in the karst region of Guizhou Province and ferralsols at the same latitude found that high SOC maintains the water and fertility retention capacity of leptosols. Numerous studies have found a significant relationship between the soil physicochemical properties (such as pH, cation exchange capacity (CEC), bulk density and sand content) and soil nutrients such as SOC, TN and TP. For instance, Li [49] and Luo [50] found a significant positive correlation between CEC and SOC, TN, AvN and AvP, which also has an important influence on soil C, N and P [11].
The average content of SOC in both dry land and paddy field in the karst area is slightly higher than the average contents of 11.3 ± 8.5 and 16.7 ± 7.5 g/kg in dry land and paddy field, respectively, in the second nationwide soil census [51]. This is mainly due to the higher content of calcium in the soil of karst areas, which makes the SOC more stable [3,48]. The average content of TN in dry land and paddy field in karst and non-karst areas was slightly higher than the national average contents of 1.1 ± 0.69 and 1.6 ± 0.62 g/kg in dry land and paddy field, respectively, recorded in the second soil census [51]. However, the average content of TN in the whole study area was 1.50 g/kg, which is slightly lower than that of 1.54 g/kg in the surface layer of soil in the second soil census [52]. The average content of TP in the study area was 0.80 g/kg, which was higher than the average content of TP in our soil of 0.56 g/kg [6]. When comparing shrub and forests, it was found that the SOC, TN and TP contents of shrubs were significantly higher than those of forests [53]. Previous studies showed that this is mainly related to the richness of Ca2+ and Mg2+ in the soils of karst areas [3,22,48], especially since the exchangeable Ca has a protective effect on the stability of SOC in the soil [11,54]. As SOC and TN are closely coupled in soils, higher Ca content not only facilitates N saturation but also reduces the decomposition of SOC and inhibits the uptake of soil nutrients by microorganisms [11,54]. This study is consistent with previous studies, finding that the content of Ca in soil in the karst area is higher than that in non-karst area, and Ca has a great influence on the accumulation of SOC (Figure 9).
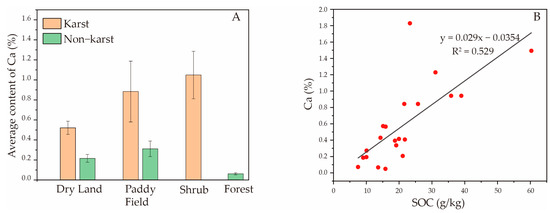
Figure 9.
Contents of Ca in different land-use types and the relationship between Ca and SOC. (A) The average content of Ca in karst and non-karst areas under different land-use types, and the error bar represents standard deviation. (B) The linear relationship between Ca and SOC in the study area.
4.2. Response of Soil C, N and P Stoichiometric Characteristics to Land-Use Change
Soil C:N:P can be a good parameter to measure the soil nutrient status during soil development [55]. The main factor for C:N was the type of land-use in this study. The C:N ratio was inversely related to its decomposition rate [56], largely because microorganisms in the soil not only require carbon for energy but also need access to nitrogen to compose their bodies [57]. The mean C:N values of soils in dry land and forests in non-karst areas of this study were 10.59 and 11.86, respectively, and these values were in the range of 10–12 for the mean C:N values of soils in China [58]. Meanwhile, the mean C:N value in paddy field was 12.08, slightly higher than the mean C:N value of soils in China. The mean C:N values of dry land and shrubs in the karst area were slightly lower than the Chinese soil C:N means, while the mean C:N values of paddy field and forests were within the range of the mean C:N values in China. The results of this study show that the C:N of karst forests was significantly smaller than that of non-karst forests, suggesting that SOC decomposes more rapidly in karst forests and that the structure of non-karst forests was relatively intact [53].
Soil C:P is not only an indicator of AvP, but also the potential of soil microorganisms to release P from mineralized organic matter or to sequester P from the external environment [42]. It has been suggested that when C:P < 200 in the soil [21], there is a transient increase in soil microbial C content, while net mineralization of microbial P occurs, resulting in an increase in soil TP content. The mean soil C:P values in the karst areas in our study area ranged from 29.07 to 64.59, and the soil C:P ratio varied widely among different land-use types, with the C:P ratio in forests being two times higher than that in dry land. The mean soil C:P values in non-karst areas ranged from 39.21 to 103.44, with the mean soil C:P values in both karst and non-karst areas being lower than the mean surface soil C:P values given by Li et al. [54] of 202.2. This indicates that the AvP in soils is relatively low and the mineralization rate of P is also relatively low; similar results were produced elsewhere [1,2]. The land-use types have great explanatory power for the C:P ratio, followed by parent materials, pH and AvP. The lower C:P in the study area, especially within the karst depression, is due to the fact that P released by mineralization in forest in karst areas is limited and the amount of phosphate available for uptake is insufficient, and the results of the study indicate that TP in karst areas is not readily converted to AvP [53].
The soil N:P ratio can be used not only as an indicator of N saturation but also as a specific indicator to respond to soil N and P limitations [27]. The N:P of 4.96 in the study area was much lower than 14, which indicates that the study area as a whole was severely deficient in N [59]. This result was mainly influenced by the interaction of these factors and land-use types: soil type, parent materials, elevation, slope, pH, TK, AvN, AvP and AvP. The mean values of N:P in karst shrubs and non-karst forests were 6.83 and 8.64, respectively, all slightly higher than that of global forests soils (6.60), indicating that there is an abundance of N in the forests in the study area, which also indicates that the effective N that can be absorbed and used by the forests is lower, reflecting that the growth of forests within karst areas is more susceptible to nitrogen limitation [21].
5. Conclusions
This study evaluated soil C, N, P and their stoichiometry under different land uses using geodetector methods. Among different land uses, significant differences were found in soil indicators and thus in soil stoichiometry, which supports that land-use types have significant effects on soil properties important to soil quality. The results indicate that the geodetector method could be used to characterize soil quality. The results of the factor detector and interaction detector analyses indicate that soil SOC, TN, TP and stoichiometry are mainly influenced by land-use type, AvN, soil type and the soil-forming parent material. We found significant differences in C, N and P and their stoichiometric characteristics of soils in karst and non-karst areas of the same land-use type in the study area. Overall, this study demonstrated that the geodetector method can effectively and precisely evaluate the impact of land-use on soil stoichiometry. In addition, our study is helpful in adopting a more suitable strategy and offering expanded guidance on the practice of ecological restoration and agricultural cultivation in fragile karst regions of southwest China.
Supplementary Materials
The following supporting information can be downloaded at: https://www.mdpi.com/article/10.3390/land12061126/s1, Figure S1: Physicochemical properties under different soil types.
Author Contributions
Conceptualization, C.Z. and H.Y.; data curation, Y.M. and Y.X.; methodology, Y.M., J.N. and Y.C.; validation, Y.M. and J.N.; visualization, J.N. and Y.X.; writing—original draft, Y.M.; writing—review and editing, H.Y., C.Z. and Y.M. All authors have read and agreed to the published version of the manuscript.
Funding
This work was supported by the Joint Fund Projects of the National Natural Science Foundation of China (U22A20619), the Guangxi Key Research and Development Program under Grant No. GuikeAB22035004, the Natural Science Foundation of Guangxi (2023GXNSFAA026465), and open foundation of the key laboratory of coupling process and effect of natural resources elements, grant number 2022KFKTC008.
Data Availability Statement
The data that support the findings of this study are available upon request from the corresponding author.
Acknowledgments
We thank the anonymous reviewers for their constructive comments.
Conflicts of Interest
The authors declare no conflict of interest.
References
- Elser, J.J.; Dobberfuhl, D.R.; MacKay, N.A.; Schampel, J.H. Organism Size, Life History, and N:P Stoichiometry. BioScience 1996, 46, 674–684. [Google Scholar] [CrossRef]
- Yu, Y.; Chi, Y. Ecological Stoichiometric Characteristics of Soilat Different Depths in a Karst Plateau Mountain Area of China. Pol. J. Environ. Stud. 2019, 29, 969–978. [Google Scholar] [CrossRef]
- Yang, H.; Zhang, P.; Zhu, T.B.; Li, Q.; Cao, J.H. The Characteristics of Soil C, N, and P Stoichiometric Ratios as Affected by Geological Background in a Karst Graben Area, Southwest China. Forests 2019, 10, 601. [Google Scholar] [CrossRef]
- Mao, R.; Chen, H.M.; Zhang, X.H.; Shi, F.X.; Song, C.C. Effects of P Addition on Plant C:N:P Stoichiometry in an N-Limited Temperate Wetland of Northeast China. Sci. Total Environ. 2016, 559, 1–6. [Google Scholar] [CrossRef]
- Song, M.; Peng, W.X.; Du, H.; Xu, Q.G. Responses of Soil and Microbial C:N:P Stoichiometry to Vegetation Succession in a Karst Region of Southwest China. Forests 2019, 10, 755. [Google Scholar] [CrossRef]
- Tian, H.; Chen, G.; Zhang, C.; Melillo, J.M.; Hall, C.A.S. Pattern and Variation of C:N:P Ratios in China’s Soils: A Synthesis of Observational Data. Biogeochemistry 2010, 98, 139–151. [Google Scholar] [CrossRef]
- Jiang, Z.C.; Lian, Y.Q.; Qin, X.Q. Rocky Desertification in Southwest China: Impacts, Causes, and Restoration. Earth-Sci. Rev. 2014, 132, 1–12. [Google Scholar] [CrossRef]
- Xiong, K.N.; Li, P.; Zhou, Z.F. Remote Sensing of Karst Stony Desertification a Typical Research of GIS/Taking Guizhou Province as an Example; Geology Publishing House: Beijing, China, 2002; pp. 134–137. (In Chinese) [Google Scholar]
- Sariyildiz, T.; Anderson, J.M.; Kucuk, M. Effects of Tree Species and Topography on Soil Chemistry, Litter Quality, and Decomposition in Northeast Turkey. Soil Biol. Biochem. 2005, 37, 1695–1706. [Google Scholar] [CrossRef]
- Fernández-Romero, M.L.; Lozano-García, B.; Parras-Alcántara, L. Topography and Land Use Change Effects on the Soil Organic Carbon Stock of Forest Soils in Mediterranean Natural Areas. Agric. Ecosyst. Environ. 2014, 195, 1–9. [Google Scholar] [CrossRef]
- Sun, M.M.; Yang, R.; Tang, Y.X.; Xiao, D.; Zhang, W.; Xu, Z.H.; Shi, Z.H.; Hu, P.L.; Wu, H.Q.; Wang, K.L. Lithologic Control of Soil C:N:P Stoichiometry across a Climatic Gradient in Southwest China. J. Soils Sediments 2023, 23, 1662–1673. [Google Scholar] [CrossRef]
- Li, D.J.; Wen, L.; Yang, L.Q.; Luo, P.; Xiao, K.C.; Chen, H.; Zhang, W.; He, X.Y.; Chen, H.S.; Wang, K.L. Dynamics of Soil Organic Carbon and Nitrogen Following Agricultural Abandonment in a Karst Region: Soil C and N Dynamics. J. Geophys. Res. Biogeosci. 2017, 122, 230–242. [Google Scholar] [CrossRef]
- Elser, J.J.; Fagan, W.F.; Denno, R.F.; Dobberfuhl, D.R.; Folarin, A.; Huberty, A.; Interlandi, S.; Kilham, S.S.; McCauley, E.; Schulz, K.L.; et al. Nutritional Constraints in Terrestrial and Freshwater Food Webs. Nature 2000, 408, 578–580. [Google Scholar] [CrossRef] [PubMed]
- Cleveland, C.C.; Liptzin, D. C:N:P Stoichiometry in Soil: Is There a “Redfield Ratio” for the Microbial Biomass? Biogeochemistry 2007, 85, 235–252. [Google Scholar] [CrossRef]
- Gao, Y.; He, N.P.; Yu, G.R.; Chen, W.L.; Wang, Q.F. Long-Term Effects of Different Land Use Types on C, N, and P Stoichiometry and Storage in Subtropical Ecosystems: A Case Study in China. Ecol. Eng. 2014, 67, 171–181. [Google Scholar] [CrossRef]
- Zhang, W.; Liu, W.C.; Xu, M.P.; Deng, J.; Han, X.H.; Yang, G.H.; Feng, Y.Z.; Ren, G.X. Response of Forest Growth to C:N:P Stoichiometry in Plants and Soils during Robinia Pseudoacacia Afforestation on the Loess Plateau, China. Geoderma 2019, 337, 280–289. [Google Scholar] [CrossRef]
- Li, Y.K.; Gong, J.Y.; Liu, J.; Hou, W.P.; Moroenyane, I.; Liu, Y.L.; Jin, J.; Liu, J.; Xiong, H.; Cheng, C.; et al. Effects of Different Land Use Types and Soil Depth on Soil Nutrients and Soil Bacterial Communities in a Karst Area, Southwest China. Soil Syst. 2022, 6, 20. [Google Scholar] [CrossRef]
- Fierer, N.; Jackson, R.B. The Diversity and Biogeography of Soil Bacterial Communities. Proc. Natl. Acad. Sci. USA 2006, 103, 626–631. [Google Scholar] [CrossRef]
- Chen, H.; Li, D.J.; Mao, Q.G.; Xiao, K.C.; Wang, K.L. Resource Limitation of Soil Microbes in Karst Ecosystems. Sci. Total Environ. 2019, 650, 241–248. [Google Scholar] [CrossRef]
- Zheng, S.M.; Xia, Y.H.; Hu, Y.J.; Chen, X.B.; Rui, Y.C.; Gunina, A.; He, X.Y.; Ge, T.D.; Wu, J.S.; Su, Y.R.; et al. Stoichiometry of Carbon, Nitrogen, and Phosphorus in Soil: Effects of Agricultural Land Use and Climate at a Continental Scale. Soil Tillage Res. 2021, 209, 104903. [Google Scholar] [CrossRef]
- Wu, P.; Cui, Y.C.; Zhao, W.J.; Shu, D.Y.; Hou, Y.J.; Ding, F.J.; Yang, W.B. Characteristics of soil stoichiometric in natural restoration process of Maolan karst forest vegetation, southwestern China. J. Beijing For. Univ. 2019, 41, 80–92. (In Chinese) [Google Scholar] [CrossRef]
- Lu, M.Z.; Liu, K.P.; Zhang, L.J.; Zeng, F.P.; Song, T.Q.; Peng, W.X.; Du, H. Stoichiometric Variation in Soil Carbon, Nitrogen, and Phosphorus Following Cropland Conversion to Forest in Southwest China. Forests 2022, 13, 1155. [Google Scholar] [CrossRef]
- Contreras-Cisneros, A.J.; Mata-González, R.; Trejo-Calzada, R.; Pedroza-Sandoval, A.; Prado-Tarango, D.; Abdallah, M.A.B. Carbon and Nitrogen Stocks through Time in Abandoned Croplands of the Comarca Lagunera, Mexico. Agric. Ecosyst. Environ. 2022, 327, 107828. [Google Scholar] [CrossRef]
- Abdallah, M.A.B.; Mata-González, R.; Noller, J.S.; Ochoa, C.G. Effects of Western Juniper (Juniperus Occidentalis) Control on Ecosystem Nitrogen Stocks in Central Oregon, USA. J. Plant Ecol. 2021, 14, 1073–1089. [Google Scholar] [CrossRef]
- Abdallah, M.A.B.; Mata-González, R.; Noller, J.S.; Ochoa, C.G. Ecosystem Carbon in Relation to Woody Plant Encroachment and Control: Juniper Systems in Oregon, USA. Agric. Ecosyst. Environ. 2020, 290, 106762. [Google Scholar] [CrossRef]
- Li, T.; Zeng, J.; He, B.; Chen, Z. Changes in Soil C, N, and P Concentrations and Stoichiometry in Karst Trough Valley Area under Ecological Restoration: The Role of Slope Aspect, Land Use, and Soil Depth. Forests 2021, 12, 144. [Google Scholar] [CrossRef]
- Zhang, C.L.; Yang, H.; Cao, J.H.; Liu, S.H. Spatial variability of soil carbon, nitrogen and phosphorus stoichiometry of different land use in karst area. Guangxi Agric. Sci. 2020, 51, 1650–1659. (In Chinese) [Google Scholar]
- Gu, J.; Yang, Q.; Jiang, Z.; Luo, W.; Zeng, H.; Qin, X.; Lan, F. Spatial variation analysis of soil carbon, nitrogen and phosphorus eco-stoichiometric ratios in karst and non-karst areas of Guangnan county, Yunan, China. Carsologica Sin. 2018, 37, 761–769. (In Chinese) [Google Scholar]
- Yan, K.; Duan, C.Q.; Fu, D.G.; Li, J.; Wong, M.H.G.; Qian, L.; Tian, Y.X. Leaf Nitrogen and Phosphorus Stoichiometry of Plant Communities in Geochemically Phosphorus-Enriched Soils in a Subtropical Mountainous Region, SW China. Environ. Earth Sci. 2015, 74, 3867–3876. [Google Scholar] [CrossRef]
- Feng, D.F.; Bao, W.K.; Pang, X.Y. Consistent Profile Pattern and Spatial Variation of Soil C/N/P Stoichiometric Ratios in the Subalpine Forests. J. Soils Sediments 2017, 17, 2054–2065. [Google Scholar] [CrossRef]
- Wang, J.F.; Xu, C.D. Geodetector: Principle and Prospective. Acta Geogr. Sin. 2017, 72, 116–134. (In Chinese) [Google Scholar] [CrossRef]
- IUSS Working Group. World reference base for soil resources 2014—International soil classification system for naming soils and creating legends for soil maps. In World Soil Resources Reports 106; FAO: Rome, Italy, 2014. [Google Scholar]
- Zhang, C.L.; Lu, L.M.; Yang, H.; Huang, F. Spatial variation analysis of soil organic matter in karst area. Carsologica Sin. 2022, 41, 228–239. (In Chinese) [Google Scholar] [CrossRef]
- Olsen, S.R. Estimation of Available Phosphorus in Soils by Extraction with Sodium Bicarbonate; United States Department of Agriculture: Washington, DC, USA, 1954. [Google Scholar]
- Tyler, G.; Olsson, T. Conditions Related to Solubility of Rare and Minor Elements in Forest Soils. J. Plant Nutr. Soil Sci. 2002, 165, 594–601. [Google Scholar] [CrossRef]
- Bao, S.D. Soil Agricultural Chemistry Analysis; China Agricultural Publishing House: Beijing, China, 2000. (In Chinese) [Google Scholar]
- Nielsen, D.R.; Bouma, J. Soil Spatial Variability: Proceeding of a Workshop of the ISSS and the SSSA; PUdoc: Las Vegas, NV, USA, 1985. [Google Scholar]
- Gauch, H.G.; Singer, S.B. A Program for Editing of Community Data Matrices. Vegetatio 1982, 49, 187–190. [Google Scholar] [CrossRef]
- Dove, N.C.; Stark, J.M.; Newman, G.S.; Hart, S.C. Carbon Control on Terrestrial Ecosystem Function across Contrasting Site Productivities: The Carbon Connection Revisited. Ecology 2019, 100, e02695. [Google Scholar] [CrossRef]
- Feng, J.G.; He, K.Y.; Zhang, Q.F.; Han, M.G.; Zhu, B. Changes in Plant Inputs Alter Soil Carbon and Microbial Communities in Forest Ecosystems. Glob. Chang. Biol. 2022, 28, 3426–3440. [Google Scholar] [CrossRef]
- Walker, T.W.; Syers, J.K. The Fate of Phosphorus during Pedogenesis. Geoderma 1976, 15, 1–19. [Google Scholar] [CrossRef]
- Gao, J.L.; Luo, F.M.; Gao, Y.; Dang, X.H.; Meng, Z.J.; Chen, X.N.; Duan, N. Ecological soil C, N, and P stoichiometry of different land use patterns in the agriculture-pasture ecotone of Northern China. Acta Ecol. Sin. 2019, 39, 5594–5602. (In Chinese) [Google Scholar] [CrossRef]
- Fang, L.L.; Wang, L.C.; Chen, W.X.; Sun, J.; Cao, Q.; Wang, S.Q.; Wang, L.Z. Identifying the Impacts of Natural and Human Factors on Ecosystem Service in the Yangtze and Yellow River Basins. J. Clean. Prod. 2021, 314, 127995. [Google Scholar] [CrossRef]
- Wang, K.L.; Zhang, C.H.; Chen, H.S.; Yue, Y.M.; Zhang, W.; Zhang, M.Y.; Qi, X.K.; Fu, Z.Y. Karst Landscapes of China: Patterns, Ecosystem Processes and Services. Landsc. Ecol. 2019, 34, 2743–2763. [Google Scholar] [CrossRef]
- Liu, Y.L.; Chen, Y.Y.; Wu, Z.H.; Wang, B.Z.; Wang, S.C. Geographical Detector-Based Stratified Regression Kriging Strategy for Mapping Soil Organic Carbon with High Spatial Heterogeneity. Catena 2021, 196, 104953. [Google Scholar] [CrossRef]
- Du, Z.B.; Gao, B.B.; Ou, C.; Du, Z.R.; Yang, J.Y.; Batsaikhan, B.; Dorjgotov, B.; Yun, W.J.; Zhu, D.H. A Quantitative Analysis of Factors Influencing Organic Matter Concentration in the Topsoil of Black Soil in Northeast China Based on Spatial Heterogeneous Patterns. ISPRS Int. J. Geo-Inf. 2021, 10, 348. [Google Scholar] [CrossRef]
- Ahmad, E.H.; Demisie, W.; Zhang, M. Effects of Land Use on Concentrations and Chemical Forms of Phosphorus in Different-Size Aggregates. Eurasian Soil Sci. 2017, 50, 1435–1443. [Google Scholar] [CrossRef]
- Cao, J.H.; Yuan, D.X.; Pan, G.X. Some Soil Features in Karst Ecosystem. Front. Earth Sci. 2003, 18, 37–44. (In Chinese) [Google Scholar] [CrossRef]
- Li, Y.; Ma, J.; Xiao, C.; Li, Y. Effects of Climate Factors and Soil Properties on Soil Nutrients and Elemental Stoichiometry across the Huang–Huai–Hai River Basin, China. J. Soils Sediments 2020, 20, 1970–1982. [Google Scholar] [CrossRef]
- Luo, Z.; Feng, W.; Luo, Y.; Baldock, J.; Wang, E. Soil Organic Carbon Dynamics Jointly Controlled by Climate, Carbon Inputs, Soil Properties and Soil Carbon Fractions. Glob. Chang. Biol. 2017, 23, 4430–4439. [Google Scholar] [CrossRef]
- Xu, Q.; Rui, W.Y.; Liu, J.L.; Liu, Z.; Yang, L.; Yin, Y.J.; Zhang, W.J. Spatial Variation of Coupling Characteristics of Soil Carbon and Nitrogen in Farmland of China. J. Ecol. Rural. Environ. 2006, 22, 4. [Google Scholar] [CrossRef]
- Li, Q.Q.; Yue, T.X.; Fan, Z.M.; Du, Z.P.; Chen, C.F.; Lu, Y.M. Spatial simulation of topsoil TN at the national scale in China. Geogr. Res. 2010, 11, 12. (In Chinese) [Google Scholar] [CrossRef]
- Yu, Y.H.; Zhong, X.P.; Zheng, W.; Chen, Z.X.; Wang, J.X. Species diversity, functional traits, stoichiometry and correlation of plant community in different succession stages of karst forest. Acta Ecol. Sin. 2021, 41, 2408–2417. (In Chinese) [Google Scholar] [CrossRef]
- Li, D.J.; Wen, L.; Zhang, W.; Yang, L.Q.; Xiao, K.C.; Chen, H.; Wang, K. L Afforestation Effects on Soil Organic Carbon and Nitrogen Pools Modulated by Lithology. For. Ecol. Manag. 2017, 400, 85–92. [Google Scholar] [CrossRef]
- Chen, L.L.; Deng, Q.; Yuan, Z.Y.; Mu, X.M.; Kallenbach, R.L. Age-Related C:N:P Stoichiometry in Two Plantation Forests in the Loess Plateau of China. Ecol. Eng. 2018, 120, 14–22. [Google Scholar] [CrossRef]
- Batjes, N.H. Total Carbon and Nitrogen in the Soils of the World. Eur. J. Soil Sci. 2014, 65, 10–21. [Google Scholar] [CrossRef]
- Wang, S.Q.; Yu, G.R. Ecological stoichiometry characteristics of ecosystem carbon, nitrogen and phosphorus elements. Acta Ecol. Sin. 2008, 8, 3937–3947. (In Chinese) [Google Scholar] [CrossRef]
- Huang, C.Y. Soil Science; China Agriculture Press: Beijing, China, 2000. (In Chinese) [Google Scholar]
- Olde Venterink, H.; Wassen, M.J.; Verkroost, A.W.M.; De Ruiter, P.C. Species Richness–Productivity Patterns Differ between N, P, and K Limited Wetlands. Ecology 2003, 84, 2191–2199. [Google Scholar] [CrossRef]
Disclaimer/Publisher’s Note: The statements, opinions and data contained in all publications are solely those of the individual author(s) and contributor(s) and not of MDPI and/or the editor(s). MDPI and/or the editor(s) disclaim responsibility for any injury to people or property resulting from any ideas, methods, instructions or products referred to in the content. |
© 2023 by the authors. Licensee MDPI, Basel, Switzerland. This article is an open access article distributed under the terms and conditions of the Creative Commons Attribution (CC BY) license (https://creativecommons.org/licenses/by/4.0/).