Abstract
Intensifying agricultural activity associated with rapid population growth in rural western Uganda exerts immense pressure on natural resources, threatening not only soil fertility in the uplands but also water quality of the region’s many small crater lakes. To assess the relative risk of excess sediment and nutrient loading to individual lakes due to (inter) rill erosion within the catchments, we used the revised universal soil loss equation (RUSLE) and sediment delivery distributed model (SEDD) to estimate soil loss and sedimentation in 75 crater-lake catchments with diverse types and intensities of land use, including 17 catchments situated partly or entirely in national parks. We found that variation in potential soil loss (Ap) among all studied catchments was strongly related to differences in mean slope within each catchment. We also found substantial seasonal variation in vegetation cover, and thus, estimated actual soil loss (Am), on both cultivated land and protected savanna grassland, whereas the vegetation cover of protected semi-deciduous tropical forest was seasonally stable. Lacking detailed field data to validate model output, we used the ratio between estimated actual soil loss (Am) and potential soil loss (Ap) to evaluate the relative influences of land-use intensity and type, as well as the impact of protective measures. Our results showed that due to their characteristically steep slopes (21% on average), all crater catchments were highly susceptible to soil loss, and because most of them were small (203 ha on average), a large portion of the eroded material was transported to and deposited in the lakes. Given the strong dependence of the local population on these crater lakes as source of water and fish protein, and on the surrounding land for crop production, increased effort by environmental planners and managers is required to safeguard or restore the long-term availability of these natural resources. Avoiding bare soil conditions by restoring natural vegetation or employing agricultural techniques that provide high vegetation cover throughout the year are likely to result in considerable improvements.
Keywords:
soil erosion; sedimentation; GIS; RUSLE; SEDD; Uganda; crater lake catchments; land use; protected grassland; protected forest 1. Introduction
Anthropogenic land use and land-cover change has far-reaching consequences for ecosystems all over the globe [1]. One of the greatest problems associated with land use for agriculture is soil erosion, which can substantially reduce soil fertility and crop yields as well as threaten the quality and availability of freshwater resources [2,3]. Rates of soil erosion are particularly high during the initial clearing of natural vegetation and conversion of the land for agricultural purposes [1,4]. As the highest rates of deforestation worldwide now occur in tropical regions [5], soil erosion became an enormous environmental challenge, particularly in the tropical regions. Tropical landscapes suffer higher rates of soil erosion than temperate-region landscapes also due to the higher frequency and especially intensity of tropical rainfall [6]. In sub-Saharan Africa, soil degradation already caused widespread depletion of soil nutrients [7,8], lowering the per capita food production [9,10]. With over half of the world’s population growth in the coming decades predicted to take place in Africa [11], food security in Africa is a pressing issue. Even more alarming is the threat of water scarcity spreading across the continent [12,13]. Unfortunately, despite high vulnerability of Africa’s freshwater resources to the combined impacts of deforestation, intensifying agriculture and climate change, local system understanding is still very limited [14], and thus, a substantial increase in research effort will be required to safeguard the important ecological services provided by Africa’s continental aquatic ecosystems.
With current population growth of 2.7% annually [16], the East African country of Uganda has one of the fastest growing populations in the world. As 82% of households inhabiting rural areas (and 69.4% of the total) obtain their livelihood from subsistence farming [17], Uganda’s natural resources are under immense demographic pressure and will continue to be in the foreseeable future. The present study focuses on the predominantly rural area of western Uganda immediately east of the Rwenzori Mountains and Lake Edward, where roughly 90 small lakes of volcanic origin occur in often steep-sided crater catchments (Figure 1). These lakes constitute an important natural asset to the region by providing a source of fish protein, as well as fresh water for both domestic and agricultural use [18,19,20]. However, during the past half century, the region’s population increased five-fold [21], and consequently, farmers are increasingly encroaching on the lakes, by clearing and cultivating even the steepest slopes inside the crater basins (Figure 2). This land-cover change not only resulted in locally severe soil degradation [22], but the excess sediment and nutrient loading caused the eutrophication of many lakes, as first documented in Lake Saka (site #72 in our dataset; see Figure 3 and Table 1) already 20 years ago [23]. Considering the ecosystem services that these lakes provide, finding a balance between exploitation of the land surrounding these lakes and conservation measures to preserve their water quality is crucial. However, to achieve this goal of sustainable human activity requires in-depth understanding of the geological, limnological and ecological processes that determine the vulnerability of these aquatic ecosystems to human impact on the adjacent terrestrial ecosystems.

Figure 1.
Overview of the study region in equatorial western Uganda with, from top to bottom, the lake clusters of Fort Portal, Kasenda and Bunyaruguru bounded by red-lined rectangles or polygons, as in Figure 3. Lakes of the Katwe-Kikorongo cluster situated westward of Lake George are all hypersaline and were not included in this study. (a) Map of regional land cover and land use-based RCMRD [15]. (b) True-color Sentinel-2A satellite image from 14 March 2016 representing peak dry-season conditions. Red arrow indicates recent grassland burning. (c) True-color Sentinel-2A satellite image from 2 June 2016 representing peak rainy-season conditions. Protected areas indicated as black or white dashed lines include Mt. Rwenzori National Park (1), Kibale National Park (2), Queen Elizabeth National Park (3), Maramagambo Forest (4), Kyambura Game Reserve (5), Mubuku Central Forest Reserve (6), Kakasi Central Forest Reserve (7), Kasyoha-Kitomi Central Forest Reserve (8) and Kalinzu Central Forest Reserve (9).
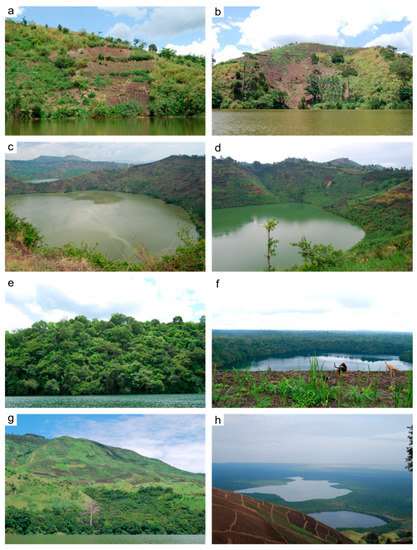
Figure 2.
Field photographs illustrating the contrasting land cover in protected and unprotected catchments of western Ugandan crater lakes. (a) Crop fields separated by narrow buffer strips on the steep crater slopes of Lake Wandakara (#74 in Table 1), recently cleared and sown (April 2015). (b) Steep crater slope of Lake Kifuruka (#27), showing quasi-complete clearing from the crater rim to the lakeshore without any measures to limit soil erosion (April 2015). (c) Catchment-wide cultivation of predominantly annual crops on the steep crater slopes of Lake Katinda (#24) (August 2014). (d) Catchment-wide cultivation of both annual crops and banana plantations on the steep crater walls of Lake Nyungu (#70; March 2014). (e) Intact semi-deciduous tropical forest covering the shore and crater slopes of Lake Karolero (#20) in Maramagambo Forest (April 2015). (f) Intact semi-deciduous tropical forest covering most of the Lake Kerere catchment (#26) in Kibale National Park (April 2015). (g) Intensive cultivation of steep slopes along the Rift-Valley shoulder bordering Queen Elizabeth National Park, forming upstream portions of the drainage basins of lakes Kyasanduka (#34) and Nyamusingiri (#65) (April 2015). (h) View from high up those highland slopes showing bare fields being prepared for sowing, with in the background lakes Kyasanduka (front) and Nyamusingiri (back) located within Queen Elizabeth National Park (March 2014). All photos by W. De Crop.
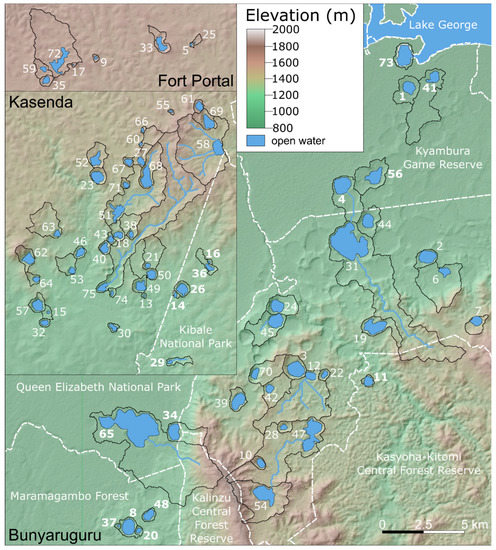
Figure 3.
Topographic map of the study area showing the location of the 75 crater-lake catchments (bordered by solid black lines) included in this study and numbered as in Table 1. Bold numbers indicate lakes located within the borders of protected areas, indicated as dashed white lines. Note that the catchment of five of these lakes (#4 Chibwera, #14 Kanyamansira, #26 Kerere, #34 Kyasanduka and #65 Nyamusingiri) is partly outside the protected area and under cultivation (see text). Blue lines indicate permanent or seasonal surface streams flowing into the lakes.

Table 1.
Catchment averages for all 75 Ugandan crater lakes catchments included in this study, listed alphabetically and numbered as in Figure 3, as well as means for all catchments and for the three catchment groups distinguished in this study according to protection status (UP: Unprotected catchment; PF: Protected forest catchment; PG: Protected grassland catchment). A0: Lake area; Ac: Catchment area; R: Rainfall erosivity factor; K: Soil erodibility factor; Slope: Mean and maximum (in brackets) slope gradient; LS: Slope length and slope steepness factor; Cm: Annual average cover management factor; Ap: Potential annual soil loss; Am: Estimated annual soil loss; Y: Annual sediment yield; SDRW: Catchment wide sediment delivery ratio; P.S.: Protection Status (where UP: Unprotected catchment; PF: Protected forest catchment; PG: Protected grassland catchment). Lakes with surface streams are indicated by *. Minimum and maximum estimates for Y and SDRW are shown for these lakes, with the exception of Mbajo (see text). Values from the Kabalogi catchment are included only in the averaged R, K, Slope, LS and Ap estimates for all lakes. Averages for Y and SDRW also do not include lakes with inflowing surface streams (except Mbajo): sample sizes are 63, 50 and 4 for all, UP and PG, respectively.
An important first step in acquiring this understanding is to assess the magnitude of soil erosion within these catchments and the relative importance of various controlling factors. To this aim, the present study assesses the susceptibility of 75 crater-lake catchments in western Uganda to rainfall-induced soil loss, by using the revised universal soil loss equation (RUSLE), [24] in combination with the sediment delivery distributed model SEDD [25], to identify the sources and amounts of sediment being delivered to the respective lakes. As is common for tropical regions [26], local field data pertinent to accurately quantify soil erosion and sedimentation in these systems, and hence, to validate RUSLE and SEDD output, are lacking or scarce. Therefore, the model-derived erosion and sedimentation rates obtained in this study, which are based on freely available environmental and remote-sensing data, should be considered as rough estimates only. Nevertheless, the comprehensive nature of our analysis, by covering all of the region’s freshwater crater lakes, allows comparative analyses of lake catchments situated along gradients of crater-basin topography, composition of natural vegetation, and the type and intensity of anthropogenic land use. Consequently, we suggest that the significance of our results extends beyond the study area in western Uganda to crater lake basins elsewhere in Africa and other rural tropical regions. Most importantly, they provide local policymakers and environmental resource managers in those regions with crucial indications as to which lakes can be expected to experience the highest impact of soil erosion, allowing them to focus conservation measures on the catchments of those highly susceptible lakes which are of greatest value to rural communities at the appropriate (sub-) county level of regional government.
2. Materials and Methods
2.1. Study Region
The region of equatorial western Uganda immediately east of the Rwenzori Mountains and Lake Edward, between 00°42′ N to 00°21′ S and 30°01′ E to 30°20′ E, is home to ca. 90 crater lakes [27] situated between 914 and 1574 m above sea level (a.s.l.). This region, known as the Edward–George extension of the western branch of the East African Rift System (EARS; [28]), experienced tectonic and volcanic activity over the last ca. 50,000 years, associated with local subduction of the earth’s crust [29]. Most of the crater basins currently holding lakes are likely considerably younger, and may have been formed during the latest Pleistocene or early Holocene (ca. 15,000–8000 years ago) when strengthened monsoon dynamics recharged the region’s geothermally heated aquifers. The 75 lakes included in this study are spread among three of the four lake clusters defined by Melack [27] (Figure 1 and Figure 3). Respectively, 8 and 38 lakes belong to the Fort Portal and Kasenda clusters equivalent to the volcanic sub-provinces of Kichwamba and Kyatwa [30], which are situated in the ‘highlands’ forming the northern boundary of the Rift Valley. The remaining 29 lakes are located in the Bunyaruguru cluster (or volcanic sub-province of the same name) just south of the Kazinga Channel between Lake George and Lake Edward. Lakes belonging to the Katwe-Kikorongo cluster situated immediately north of the Kazinga Channel and west of Lake George are all hypersaline [31,32], and were excluded from the present study.
The most common soil type based on the World Reference Base for Soil Resources [33] in the crater-lake region of western Uganda are Mollic Silandic Andosols, while Albic Luvisols, Lithic Leptosols and Haplic Podzols each occur in a small number of catchments Figure A1a [34]. Most lakes in the three named clusters are small under 60 ha [35] and fresh (all except four, namely #1 Bagusa, #41 Maseche, #56 Nshenyi and #57 Ntambi). The hydrologically open condition of the fresh lakes is believed to be mostly due to balance between groundwater inflow and seepage [32], even though 12 of them (see Section 3) have small, often seasonal, in- and/or outflowing surface streams. Mean annual precipitation ranges from 1000 mm on the floor of the Rift Valley to 1395 mm on the surrounding uplands, classifying the region’s climate as tropical sub-humid [36]. Rainfall has a distinctly bimodal seasonal distribution (Figure 4), controlled by twice-yearly migration of the tropical rain belt associated with the intertropical convergence zone (ITCZ) across the equator. It is highest during the wet seasons of March to May and August to December; however, their onset can vary substantially between years [37,38] and rainfall is also common during the intervening ‘dry’ seasons of June–July and January–February (Figure 4).
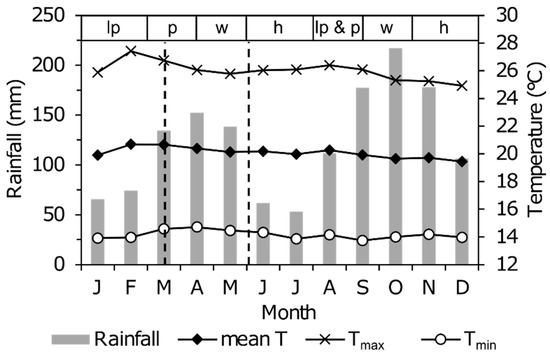
Figure 4.
Climatogram for Kibale National Park over the period 1997–2013 showing the bimodal pattern of mean monthly rainfall (grey bars, in mm) and mean monthly maximum (Tmax: crosses), minimum (Tmin: open circles) and daily-average (black diamonds) air temperature. Data from Makerere University Biological Field Station, plot adapted from De Crop and Verschuren [39]. Dashed lines show the timing of the two Sentinel-2A satellite images used in this study (Figure 1). The top bar shows the two seasonal cropping cycles during a typical year with successive periods of land preparation (lp), planting (p), weeding (w) and harvest (h). Adopted from FEWS [40].
Natural vegetation in the study area ranged from semi-deciduous lowland tropical forest in the uplands to savanna grassland or woodland on the rift-valley floor [41]. At present, however, the catchments of many lakes were fully converted to a cultural landscape of cropland, tree plantations and grazing meadows (Figure 1). These agricultural activities often reach down to the lakeshore, with little or no riparian buffer (Figure 2a–d). The exceptions are lakes located either within a National Park (NP) or Central Forest Reserve (CFR), or where natural vegetation was preserved or replanted in function of ecotourism. Of our 75 study lakes, 58 occurred outside of such protected areas and are, therefore, referred to as unprotected. Among the 17 lakes located within a protected area, the catchments of seven (#8 Kacuba, #11 Kamunzuka, #16 Kanyanchu, #20 Karolero, #36 Kyerbwato, #37 Kyogo and #48 Murabyo) were fully or mostly forested (e.g., Figure 2e), whereas those of five others (#1 Bagusa, #29 Kisibendi, #41 Maseche, #56 Nshenyi and #73 Tubengo) were largely covered by natural savanna grassland (Figure 1 and Figure 3). These two groups are referred to as protected forest and protected grassland lakes or catchments. Finally, there were five lakes (#4 Chibwera, #14 Kanyamansira, #26 Kerere, #34 Kyasanduka and #65 Nyamusingiri) which themselves were located in a protected area, but of which the catchment was partly outside the protected area and under cultivation (Figure 1, Figure 2f–h and Figure 3). This was most strikingly the case in the last-named two lakes, which were located within Queen Elizabeth National Park (QENP) at the foot of the western slopes of the Bunyaruguru highlands (Figure 3). Cultivation intensity was high on the steep-sloping eastern parts of both catchments (Figure 2g,h), even though these were located within Kalinzu Central Forest Reserve immediately adjacent to QENP (Figure 1). These five lakes were excluded in quantitative comparisons of soil erosion and sedimentation variables between protected and unprotected sites, to avoid the associated complexity.
2.2. RUSLE-Modeling
Due to the limited field data available for our study area, an empirical soil-erosion model was better suited than physically based models, which require more input data [42]. In order to estimate water-induced soil erosion, Wischmeier and Smith [43] developed the universal soil loss equation (USLE), which was revised by Renard et al. [24] (revised USLE or RUSLE). RUSLE is an empirical model and predicts the long-term average annual soil loss caused by rill and inter-rill erosion. As such, it cannot simulate individual erosion events nor does it consider gully erosion or landslides. For our aim of identifying those lake-catchment areas most prone to soil loss, these long-term averages suffice. Due to the small size of the catchments studied here, gullies are unlikely to form. There is anecdotal evidence of landslides occurring on the steep inner crater slopes surrounding some lakes, but these are certainly rare.
RUSLE predicts the average annual soil loss, A (t/ha×yr), by multiplying five factors:
where R = Rainfall erosivity factor (MJ×mm/h×ha×yr), K = Soil erodibility factor (t×ha×h/ha×MJ×mm), LS = Slope length and steepness factor, C = Cover management factor and P = Support practice factor. Multiplying the R, K and LS factors provides a measure of the susceptibility of an area to water-induced soil erosion or simply the potential annual soil loss (Ap), i.e., annual soil loss under unvegetated, clean-tilled conditions and in the absence of any erosion control measures (i.e., when both C and P have a value of 1). The five individual RUSLE parameters were estimated as follows.
2.2.1. Rainfall Erosivity (R) Factor
Wischmeier and Smith [44] found that, in their study area in the USA, R was best predicted by combining the kinetic energy and maximum 30 min intensity of individual rainstorms. Precipitation data of such high temporal resolution are often not easy to come by, especially in the tropics, and in such cases, R can be estimated using precipitation data of lower temporal resolution [45]. Renard and Freimund [46] demonstrated the importance of developing region-specific relationships between R and monthly or annual precipitation. However, earlier, Moore [47] had already developed estimates of R for different regions in East Africa based on annual precipitation. Assuming that his parameters for the Ugandan Plateau (all areas in the country between 900 and 1500 m a.s.l.) are representative for our study area, R was estimated as:
where P = mean annual rainfall (mm/yr) and 17.02 a conversion factor from imperial to metric units [48]. Long-term (1981–2016) mean annual precipitation data at 0.05° spatial resolution (ca. 5.5 km at the equator) for our study region were obtained from the climate hazards group infrared precipitation with stations (CHIRPS) dataset [49].
2.2.2. Soil Erodibility (K) Factor
Soil erodibility refers to the ease with which soil particles are detached and transported by the impacts of rainfall and overland water flow. As no field measurements were available, K was estimated from the geometric mean particle diameter (Dg; mm; Figure A1b) following Renard et al. [24]:
and
where fi is the percentage soil mass belonging to particle size fraction i, and mi the arithmetic mean of that fraction’s particle size limits [50]. Topsoil clay, silt and sand fractions in the study region at 250 m resolution (Figure A1b) were obtained from the Africa Soil Information Service (AfSIS) [51].
Dg = exp(0.01 × ∑fi × ln(mi))
2.2.3. Slope Length and Steepness (LS) Factor
As a combined factor of slope length (L) and slope steepness (S), LS is a measure of how topography and hydrology affect soil erosion [52]. Following Moore and Burch [53], Moore and Burch [54] and Moore and Wilson [52]:
where As = specific catchment area (m2/m), calculated as:
Maps of flow accumulation and slope for the study region (Figure A2) were calculated from the USGS [55] one arc-second (ca. 30 m) resolution digital elevation model (DEM) based on shuttle radar topography mission (SRTM) data.
2.2.4. Cover Management (C) Factor
The cover- or crop-management factor is defined as the ratio between the amount of soil loss on land with specific vegetation conditions and the soil loss on continuous, clean-tilled, but otherwise identical, fallow land. The original method of calculating C from soil loss ratios [24] is highly labor-intensive especially for large study areas with a wide range of vegetation types, and thus, was unfeasible here. Alternatively, look-up tables exist to assign C values to known vegetation or land cover classes, e.g., [43]. Lacking land-use and land-cover maps for the study area with sufficient detail to cope with the local diversity in vegetation cover; this approach was not suitable either. Instead, we estimated the C factor using high-resolution Sentinel-2A satellite images [56]. Since this satellite was launched fairly recently (in 2015), images with low cloud cover are scarce, especially during the rainy seasons. Nevertheless, two sets of images from 2016 with low cloud cover across the study region, and representing different seasonal conditions, could be retrieved. Considering that this study is part of a larger project assessing the impact of soil erosion on the water quality of the crater lakes, later images were not used, as they would be less representative of the vegetation cover in 2014–2016, the time of aquatic-ecological sampling [57]. The first set of images were taken on 14 March 2016 (Figure 1b), i.e., during planting time at the transition between the first dry and first wet season of the year [58] (Figure 4). At that time, the vegetation was yet to recover from seasonal drought; hence, these images represent dry-season vegetation cover, and Cd is the dry-season cover management factor derived from them. The second set of images were taken on 2 June 2016 (Figure 1c), i.e., during harvesting time at the end of the first rainy season (Figure 4); hence, they represent wet-season vegetation cover, and Cw is the wet-season cover management factor. Analysis of both sets of images, therefore, allows to take into account some of the seasonal variability in vegetation cover. We then averaged Cd and Cw to produce the annual-mean C-factor value (Cm) for use in the RUSLE model. Cd and Cw were derived from the natural difference vegetation index (NDVI):
where NIR = near infra-red band 8 and R = red band 4, both at 10 m resolution.
NDVI values were converted to C values using the formula developed by Van der Knijff et al. [59]:
Though originally developed for European contexts, this specific relationship was previously applied to Uganda by Jiang et al. [60] and Karamage et al. [61].
2.2.5. Support Practice (P) Factor
Erosion-control practices such as terracing, contouring and strip-cropping are represented by the support practice factor, the ratio between soil loss from land where such a practice is applied and soil loss from land ploughed along the slope. Although Ugandan farmers may locally apply some protective measures such as intercropping annual/seasonal crops with perennials [62] or maintaining (narrow) buffer strips, mulching and trash lines [63], this is certainly not always the case (e.g., Figure 2b), and the use of these practices cannot be generalized across the study area or even within individual catchments. Due to this lack of spatial information regarding support practices, P was held at a constant value of 1. Consequently, cell values of estimated annual soil loss (Am) in this study were obtained by multiplying AP and C values, and the influence of land cover on soil erosion is reflected in the difference between Am and Ap. However, where living vegetation is used as a measure to reduce soil loss, its effect on Am is represented in C.
2.3. SEDD-Modeling
The RUSLE model approach used in this study gives an indication of where in a lake catchment soil loss occurs but does not simulate sediment transport and deposition [64]. To estimate the sediment yield, i.e., the amount of eroded material that reaches the lake (or a stream draining towards it), the sediment delivery ratio (SDR) must be calculated. The catchment-wide sediment delivery ratio (SDRW) is defined as the catchment-wide mean fraction of all material eroded from within the catchment that is delivered to the lake within a certain period of time. Since this study aims to identify the most prominent sediment sources within individual catchments, a spatially distributed approach is needed. The sediment delivery distributed model (SEDD) developed by Ferro and Porto [25] combines RUSLE with a sediment delivery ratio for each morphological unit or cell i (SDRi). Following Ferro and Minacapilli [65], SDRi was determined from the travel time ti (h) required for eroded material from cell i to reach the nearest lake cell following the hydraulic path, following the equation:
where β is a catchment-specific coefficient. Due to lack of experimental yield data, β is here assumed to equal 1, as in Jain and Kothyari [66] and Fu et al. [67], among others. When the hydraulic path from cell i to the nearest lake cell transverses m cells, ti is defined as the summed travel time through each of these m cells.
where li is the length of flow path along the ith cell (i.e., the length of the side or diagonal of a cell depending on the direction of flow) and vi (m/s) is the velocity of flow in that cell. Here, the flow velocity is estimated from Manning’s equation [68]:
where si is the slope (m/m) of the ith cell and ai (m/s) is a coefficient of cell i determined by the Manning’s roughness coefficient and the hydraulic radius related to land cover [69]. In this study, prescribed ai values were given to the five distinct land-cover classes of pristine forest (0.76 m/s), tall-grass savanna (0.76 m/s), short-grass savanna (2.14 m/s), cultivation (2.62 m/s) and tree plantation (1.56 m/s) based on their equivalent class in Haan et al. [69]. The land cover class of each cell was determined using the land cover and land use (LCLU) map of Uganda [15] and the S2 prototype of the 20 m resolution land cover map of Africa 2016 [70], validated by site photographs taken during seven field visits between 2013 and 2017 (Figure 2).
Once SDRi was determined, the sediment production or yield Yi of each cell could be estimated:
where Ai is the annual estimated soil loss (t/ha×yr) in cell i and cell size is expressed in ha.
Subsequently, SDRW, the catchment-wide sediment delivery ratio, can be calculated as the ratio of weight of sediments ending up in the lake (total annual yield or Y) to the weight of material eroded within the catchment (total estimated annual soil loss or Am).
Topographic maps from the Uganda Department of Lands and Surveys showed that 12 of our 75 study lakes had inflowing surface streams (Figure 3, Table 1). The SEDD model does not account for sediment transport in streams [25]; therefore, it must be modeled separately instead [71]. As pertinent information about the flow rate of these streams, or even whether their inlets to the lakes are active throughout the year or seasonal, is lacking, we modeled sedimentation in these catchments for two end-member scenarios. In the first scenario, surface streams were not taken into account and all sediment transport within the catchment was considered to occur as overland flow. This provides minimum estimates for sediment delivery ratio (SDRmin) and yield (Ymin) equivalent to the SDR and Y values of catchments lacking surface streams. In the second scenario, all sediments entering the streams are assumed to immediately reach the lakes, resulting in maximum estimates SDRmax and Ymax. In the case of Lake Mbajo (#43), which is fed by a short (roughly 100 m) inlet stream from upstream Lake Kanyango (#18), both scenarios produced the same outcome because of the 30 m resolution of the USGS [55] DEM used in this study. We, therefore, treated its SDR and Y values as if it had no inlet stream, and present minimum and maximum estimates only for the 11 other lakes with inlet streams.
2.4. Data Analysis
Quantum GIS 3.4.5 [72] was used to calculate both the RUSLE factors and the eventual model output. Layers with different spatial resolution were all brought to 10 m resolution using the nearest neighbor algorithm. Within the catchments of our study lakes, urbanized area was mostly negligible. Where present (e.g., the catchments of #31 Kyamwiga, #42 Maturo and #47 Mugogo; Figure 5, Figure 6 and Figure 7), it was identified using the S2 prototype of the 20 m resolution land cover map of Africa 2016 [70] and excluded from analysis. The advantage of using the ESA [70] map is that it is based on sentinel-2 satellite images from 2016, whereas the RCMRD [15] LCLU map is older and often failed to correctly identify the small-scale urban areas in our study region. Catchment-wide mean soil loss estimates and separate RUSLE and SEDD factors were, thus, calculated for non-urbanized land only. In addition, clouds covering between 1% and 34% of the catchment of ten lakes were masked and values for the non-clouded areas used to estimate catchment-wide means for Cd, Cw, Cm, Am and Y. In June 2016, Sentinel-2A image clouds covered the entire catchment of Lake Kabalogi (#7), preventing calculation of Cw, and hence, Cm, Am and Y. Preprocessing of the DEM (filling of small sinks, i.e., small artefact depressions in the DEM), delineation of each lake’s catchment and calculation of sediment travel times was carried out using Whitebox GAT 3.4 [73]. Atmospheric correction of the Sentinel-2A images was performed using sen2cor 2.4.0, yielding bottom of atmosphere (BOA) reflectance images [74] that were used to calculate NDVI. Statistical analysis of the RUSLE and SEDD model output was performed using Kruskal–Wallis and Dunn’s test and the Wilcoxon signed-rank test in R 3.3.1 [75].
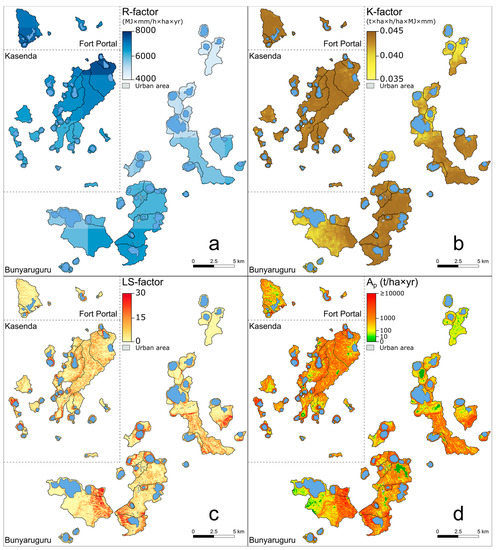
Figure 5.
Maps showing variation in RUSLE R-, K- and LS-factor within and between the 75 studied crater-lake catchments (panels (a–c)), as well as the potential soil loss Ap (panel (d)), obtained by multiplying these three factors. Note that areas of high potential soil loss generally coincide with areas having high LS-factor values.
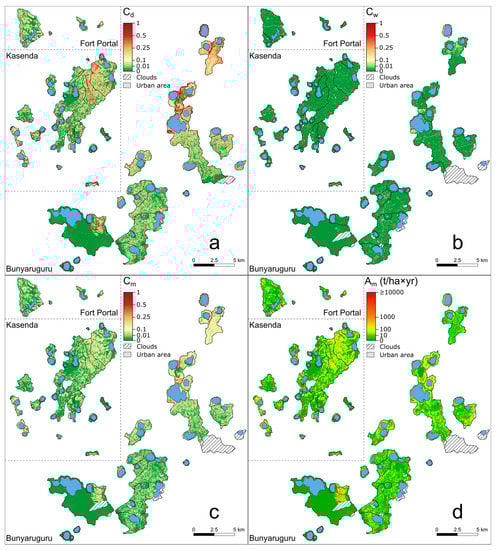
Figure 6.
Maps showing variation in dry-season (Cd), wet-season (Cw) and annual average (Cm) C- factor within and between the 75 studied crater-lake catchments (panels (a–c)) as well as annual soil loss Am (panel (d)), obtained by multiplying Ap and Cm. Portions of catchments that remained unassessed due to cloud cover in the Sentinel-2A images (Figure 1b,c) are indicated by hatched lines. This is the case for relatively minor portions of 10 catchments, but also the entire Kabalogi catchment (#7) during the wet season.
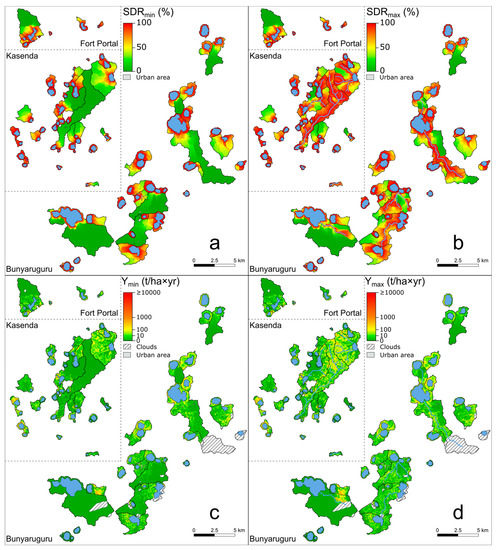
Figure 7.
Variation in sediment delivery ratio (SDR; panels (a,b)) and annual sediment yield (Y; panels (c,d)) within and between the 75 studied crater-lake catchments, according to two alternative scenarios (see text) in which the surface streams which are present in 11 of these catchments (blue lines in panels (b,d)) are ineffective (SDRmin and Ymin) or maximally effective (SDRmax, Ymax) in delivering eroded soil to the respective lakes. Portions of catchments that remained unassessed due to cloud cover in the Sentinel-2A images (Figure 1b,c) are indicated by hatched lines. This is the case for relatively minor portions of 10 catchments, but also the entire Kabalogi catchment (#7) during the wet season.
3. Results
3.1. Potential Annual Soil Loss, Ap
In our study region, rainfall erosivity (R-factor; Figure 5a), soil erodibility (K-factor; Figure 5b), slope length and steepness (LS-factor; Figure 5c), and thus, potential soil loss (Ap; Figure 5d) were generally higher on the shoulders of the rift valley and decreased towards the rift valley floor. The relatively high annual precipitation (1000–1400 mm and mainly proportional to elevation; Table A1) resulted in generally high R values (>4500 MJ×mm/h×ha×yr; Table 1). K values were lowest on the rift valley floor (western and northern portions of the Bunyaruguru cluster; Figure 5b), implying the local presence of coarser-grained, slightly less erodible soils (Figure A1b). Despite these spatial trends, the variation among the 75 catchments in both R and K was relatively modest (Table 1). Although possibly influenced by the low spatial resolution of the rainfall and soil data layers, this modest variation mostly reflects the small geographical scale of the study area. In any case, R and K explain only a relatively minor portion of the variation in Ap among the studied catchments (R2 = 0.09 and 0.13, respectively; p < 0.01 in both cases). In contrast, the maar crater basins containing our study lakes were often characterized by steep inner crater walls, with maximum slopes exceeding 100% (45° relative to horizontal) in 15 catchments and an overall average value of 21% (Table 1, Figure A2b). The shoulders of the rift valley especially were characterized by rugged terrain, whereas the rift valley floor had a more gently undulating topography. Variation in LS among and within catchments (Figure 5c) generally reflected the spatial patterns observed in the slope gradient (Figure A2b). The catchments were generally small (range 5.2–1882.1 but the majority < 100 ha), and consequently, the mean LS value per catchment showed a strong positive relationship with mean slope angle across all 75 catchments (R2 = 0.92; p < 0.001). In turn, due to the high variability in LS (range 1–14.3; Table 1), it was the main controlling factor of variation in mean Ap among catchments (R2 = 0.96; p < 0.001; Figure 5c,d).
As indicated by the overall high Ap values (on average 1570.5 t/ha×yr; Table 1) the catchments of our study lakes were highly susceptible to soil loss. The highest mean Ap values (up to 3719.2 t/ha×yr in #62 Nyamiteza) occurred in the rugged landscape of the rift valley shoulders where most unprotected catchments were located. Most protected catchments were located in flat or gently undulating landscape on or near the rift valley floor, and consequently, had lower Ap values. Overall, the average Ap of unprotected catchments (1726.0 t/ha×yr; n = 57) was significantly higher (p < 0.001) than that of fully protected forest catchments (820.8 t/ha×yr; n = 7) and fully protected grassland catchments (511.8 t/ha×yr; n = 5), while no significant difference was found between fully protected forest and grassland catchments (Table 1 and Table 2). This contrast in Ap between unprotected and protected catchments originates mostly because the mean K- and LS-factor values of unprotected catchments were significantly higher than those of protected forest and protected grassland catchments (Table 1 and Table 2). Notably, the R-factor values of unprotected catchments were significantly higher (p < 0.01) than those of protected grassland catchments but not those of protected forest catchments (Table 2). This reflects the fact that crater-lake catchments currently under cultivation mostly occurred in areas originally covered by dense woodland or semi-deciduous forest [36,41] and enjoyed a comparably wet climate, whereas currently protected grassland catchments were situated in drier areas that were historically less suitable for rain-fed agriculture [76]. At the same time, total Ap (i.e., catchment-wide mean Ap multiplied by catchment area; Table A1) was significantly higher in unprotected catchments compared to protected forest catchments, but not compared to protected grassland catchments (Table 2). This was because the surviving forested catchments tend to be very small (Ac = 25.5 ha on average), while the average catchment area of grassland catchments (200.4 ha) was similar to that of the unprotected catchments (203.1 ha; Table 1).
Table 2.
Results of Kruskal–Wallis and Dunn’s tests comparing different factors among the three catchment groups, indicating significance and in which group a factor has the highest value: UP (Unprotected catchment; n = 57), PF (Protected forest catchment; n = 7) and PG (Protected grassland catchment; n = 5). R: Mean rainfall erosivity factor; K: Mean soil erodibility factor; Flow acc.: Average number of cells contributing to an individual cell in each catchment; Slope: Mean slope gradient; LS: Mean slope length and slope steepness factor; Cd: Mean cover management factor during dry season conditions; Cw: Mean cover management factor during wet season conditions; Cm: Mean annual average cover management factor; Ap: Mean potential annual soil loss; Total Ap: Total potential annual soil loss within a catchment; Am: Mean estimated annual soil loss; Total Am: Total estimated annual soil loss within a catchment; Y: Mean annual sediment yield; Total Y: Total annual sediment yield within a catchment; SDRW: Catchment wide sediment delivery ratio. Significance levels are indicated as: not significant (p > 0.05): -; p < 0.05: *; <0.01: **; <0.001: ***. For tests related to Y and Total Y sample sizes are 49 and 4 for UP and PG, respectively.
3.2. Annual Soil Loss, Am
Both the protection status and natural vegetation type of catchments influence the magnitude of seasonal differences in vegetation cover. Whereas the cover management (C) factor was significantly higher (i.e., vegetation cover is lower) under dry-season conditions (Cd; Figure 6a) than under wet-season conditions (Cw; Figure 6b) in both unprotected catchments and protected grassland catchments, this was not the case in protected forest catchments (Table 3). In addition, in unprotected and protected grassland catchments, the C-factor (either Cd, Cw or Cm; Figure 6a–c) was consistently and significantly higher than in protected forest catchments, while no significant differences in C-factor were found between them (Table 2). In other words, vegetation cover was generally lower and more seasonally variable in unprotected catchments and protected grassland catchments than in protected forest catchments, where it remained high throughout the year.
Table 3.
Results of Wilcoxon signed-rank tests comparing different factors within each of the three catchment groups, indicating significance and in which factor has the highest value per group: UP (Unprotected catchment; n = 57), PF (Protected forest catchment; n = 7) and PG (Protected grassland catchment; n = 5). Cd: Mean cover management factor during dry season conditions; Cw: Mean cover management factor during wet season conditions; Ap: Mean potential annual soil loss; Total Ap: Total potential annual soil loss within a catchment; Am: Mean estimated annual soil loss; Total Am: Total estimated annual soil loss within a catchment; Y: Mean annual sediment yield; Total Y: Total annual sediment yield within a catchment. Significance levels are indicated as: not significant (p > 0.05): -; p < 0.05: *; p < 0.01: **; p < 0.001: ***. For tests related to Y and Total Y sample sizes are 49 and 4 for UP and PG, respectively.
Nevertheless, due to the protective effect of natural or anthropogenic vegetation cover present in all catchments, mean estimated annual soil loss (Am) amounted to only between 0.08% and 20.73% (on average 4.02%) of potential annual soil loss Ap in all catchments (p < 0.001, compare Figure 6d with Figure 5d; n = 74 as #7 Kabalogi is excluded). This effect was also visible in both mean and total soil loss in each of the separate catchment categories (unprotected, protected grassland and protected forest; Table 3). Mean Am was significantly higher in unprotected catchments (64.2 t/ha×yr, on average) and protected grassland catchments (45.8 t/ha×yr) than in protected forest catchments (2.1 t/ha×yr); however, no significant difference in Am was found between the former two categories (Table 2). The same pattern was found for total Am. The difference in Am between unprotected catchments and protected forest catchments was in accordance with the difference in Ap between these two categories. However, even when comparing protected forest catchments with the subgroup of 11 unprotected catchments which had comparable Ap values (<1100 t/ha×yr), the difference in Am holds (p < 0.001), confirming that the difference was not an artefact of the difference in Ap but a true land-cover effect. Specifically, in this subgroup of catchments with similar Ap ranges, average Am in unprotected catchments (39.8 t/ha×yr) was ca. 20 times higher than in protected forest catchments (2.1 t/ha×yr).
The high estimated Am values obtained for protected grassland sites were explained by relatively high C-factor values under especially dry-season (Cd) but also wet-season (Cw) conditions and, hence, their high annual (Cm) values. The seven highest Cd values (between 0.402 and 0.173; Table A1) obtained in our analysis occurred at #73 Tubengo, #56 Nshenyi, #44 Mbugo, #41 Maseche, #15 Kanyamukali, #4 Chibwera and #1 Bagusa, and four of these (Tubengo, Nshenyi, Maseche and Bagusa) belonged to the category of fully protected grassland catchments. However, with the exception of Kanyamukali, the lakes in these seven catchments were all located below 1000 m a.s.l. on the relatively dry rift valley floor (<1100 mm rainfall annually). It, thus, appears that the mitigating effects of gentler sloping terrain and reduced R- and K-factors on the rift valley floor were overshadowed by the lower vegetation cover. Consequently, there was no significant difference between the mean Am values of unprotected catchments and protected grassland catchments, as was the case for Ap.
3.3. Variation in Sediment Yield among Lakes
Similar to the mean and total Am, mean and total sediment yield (i.e., catchment-wide mean Y multiplied by catchment area; Table A1) of lakes lacking inlet streams were significantly lower in protected forest catchments than in unprotected catchments and protected grassland catchments, whereas no difference was found between the latter two (Table 2). In contrast, there were no significant differences between any of these three groups in terms of the catchment-wide sediment delivery ratio (SDRW). No significant difference between Am and Y was found within any of the groups (Table 3). A strongly inverse correlation occurred between SDRW and catchment area Ac of all catchments lacking streams (R2 = 0.60; p < 0.001; n = 63). This was not surprising because the average distance from a cell within the catchment to the lake increased with increasing catchment area, and therefore, so did the sediment travel time. Since most catchments are relatively small, eroded material generally has to travel only a moderate distance. In fact, in 61% of these catchments (38 out of 62) SDRW exceeded 90%, meaning that >90% of the total estimated annual soil loss was expected to reach the lake within one year. However, the size and position of the lake relative to the catchment are also important. For example, lakes Chema (#3) and Nyahirya (#60) had a similar catchment area (93.4 and 103.6 ha, respectively; Table 1 and Figure 3); yet SDRW in Chema was 95.4% of the total annual soil loss, whereas in Nyahirya, it was merely 40.7%. The important difference is that Chema had a surface area (70.0 ha) that was 75% as large as its catchment, and was located in the center of its roughly circular catchment, which was shaped like a typical explosion crater with steep inner walls. In contrast, Nyahirya (2.7 ha) was only 2.6% the size of its catchment, which mostly consisted of gently sloping terrain to the east of the original explosion crater. Therefore, on average, it takes more time for sediment to reach Nyahirya than Chema, explaining the much lower SDRW value of the former.
In the 11 lakes that had point inlets in the form of inflowing surface streams (and excluding Mbajo, #43, see the SEDD-modeling Section 2.3), important differences were evident in SDRW as well as in the resulting sediment yield (Y) between the two end-member scenarios considered in this study (Figure 7). Both variables were significantly higher (p < 0.01 and p < 0.05, resp.; n = 11) when all sediments entering the streams were assumed to reach the lake (‘max’ scenario), compared to when the influence of these streams on sediment transport efficiency was not taken into account (‘min’ scenario). Only in Lake Mirambi (#45), the effect of the stream on SDRW was rather modest: SDRW min and SDRW-max values (respectively 82.1% and 87.7%) for this lake differed by only 5.6%. This was because at Mirambi the highest erosion rates occurred on steep crater walls immediately surrounding the lake, while its short inlet stream flowed through the gentler south-western part of the catchment where erosion rates were lower (Figure 3, Figure 5c and Figure 6d). In the ten other lakes with inlet streams, the presence of these streams had a substantially greater impact, as reflected in SDRW-max values that exceeded the corresponding SDRW min values by between 22.3% and 83.0% (Table 1). Two pertinent examples were lakes Wankenzi (#75) and Nyamusingiri (#65). Wankenzi had, relative to its own surface area, the largest catchment of our dataset (Figure 3): the A0/Ac surface-area ratio was only 0.014 (Table A1). Itself located at the southern end of its elongated catchment; high modeled erosion rates occur mostly in the northern part (Figure 6d). Given the considerable distance between the area of high soil loss and the lake (roughly 7 km), when only overland sediment transport was considered, this area contributed little to overall sediment loading into the lake (Figure 7a,c), resulting in a SDRW min value of merely 3.3%. In contrast, the presence of a stream spanning almost the entire length of the catchment before entering the lake (Figure 3) leads to a very high SDRW-max value of 86.3%, implying that a much greater fraction of material eroded from the northern part of the catchment may in reality reach the lake (Figure 7b,d). This difference between the two end-member scenarios corresponded to a range in total sediment yield between 3468 t (Ymin) and 89,988 t (Ymax) entering the lake each year, i.e., an up to 26-fold difference depending on the efficiency by which the stream delivers eroded soil to the lake. Similar to Wankenzi, the highest erosion rates in the Nyamusingiri catchment occurred at a substantial distance from the lake (Figure 6d), but contrary to Wankenzi, little erosion took place outside of this distant erosion hotspot, since the majority of its catchment was protected and covered with natural forest vegetation (Figure 1, Figure 2h and Figure 3). Consequently, very little sediment would reach the lake if only overland flow occurred (Ymin = 384 t/yr). In contrast, if the stream was maximally effective in draining the area of high soil loss in the steep-sloping eastern part of the catchment (Figure 3), the modeled Ymax value reached 25,499 t/yr, i.e., a 66-fold increase relative to a hypothetical situation without surface stream.
4. Discussion
4.1. Methodological Issues Related to a Model-Based Approach to Estimating Soil Loss
Monitoring soil erosion through field experiments is labor-intensive, costly and time-consuming, especially in a rural tropical setting. The increasing volume and quality of freely available GIS data provide welcome opportunities for low-cost and time-efficient assessment of erosion risk, in allowing to derive pertinent area-integrated variables that can be used in relatively simple models such as RUSLE and SEDD. However, without sufficient local calibration of the different factors employed in those models, their validity outside of the settings were originally designed for is uncertain [77,78,79]. Lacking this local parameter validation, the absolute values for annual soil loss and sediment yield estimated here must be interpreted with care [80,81]. Nevertheless, because of the comprehensive nature of our analysis, involving 75 lake catchments within a single geographical area but distributed along regional gradients in topography, natural vegetation and land-use intensity, we suggest that the emerging general patterns are sufficiently robust to compare the relative vulnerability of catchments with contrasting land use. Therefore, at the very least, our results can serve as a useful tool to identify the areas most sensitive to soil erosion and contributing the most to the sediment loading into the region’s lakes [26,45]. Beyond high relevance for the study region, our results are also largely in accordance with known patterns in soil erosion along vegetation and cultivation gradients [43,82]: annual erosion rates are significantly lower in forested catchments with permanent high vegetation cover compared to grassland catchments subject to regular burning and grazing and cultivated areas where vegetation cover is lowest during the seedbed preparation stage. Still, four methodological issues related to our model-based approach require special attention: (i) possible influences of the NDVI land-cover proxy on RUSLE output; and the modeled representations of (ii) seasonal variability in land cover, (iii) soil erodibility and (iv) catchment hydrography.
4.1.1. Influence of the NDVI Land-Cover Proxy on RUSLE Output
An important downside of using NDVI as land-cover proxy to calculate the C-factor in RUSLE modeling is its dependency on vegetation condition [83]. Water-stressed vegetation produces lower NDVI and, consequently, higher C-factor values, whereas in reality, the vitality of vegetation is not relevant to erosion [59]. In the present study, this does not appear to have played a role in protected forest catchments, where Cd and Cw were (near-) identical. As discussed above, in unprotected catchments the significant difference between Cd and Cw was largely the result of agricultural activities: substantially more bare fields are exposed to returning rains in mid-March, when crops from the previous season were harvested and fields were again being prepared for planting, while the rainy-season image from early June displayed conditions of full-grown crops just prior to harvest. In the protected grassland catchments, of which four (out of five) were located in savanna on the rift valley floor, the sizable difference between Cd and Cw can be attributed partly to dry-season water stress. However, even over the driest areas of the rift valley floor in our study region, there was still some dry-season precipitation ~50 mm monthly; [84] and the local dry seasons were too short to fully dry out the grass vegetation [85]. Therefore, the high Am and Y values of protected grassland catchments in our dataset cannot solely be attributed to low NDVI values due to drought. We suggest that two other environmental factors may explain the high Cd values, and hence, Cm, Am and Y, in these grasslands. Firstly, 13.4% of the savanna area in QENP burns at least once a year, and over half (55.3%) burned in the course of a three-year study [84]. Fire promotes soil erosion by removing vegetation cover, exposing the underlying soil, and changing its water infiltration properties [82]. Thus, clear signs of recent fire in the Nshenyi catchment (#56) on the March 2016 image (Figure 1b) may explain why it has the second-highest mean Cd value in our dataset (Table A1). Secondly, the abundant presence of large wild mammals in QENP, the populations of which are mostly near carrying capacity [85], significantly alters plant communities and enhances soil erosion by overgrazing and soil trampling [86]. Additionally, the high grazing pressure by hippopotamuses near the lakes may lead to substantial reductions in vegetation cover and greater soil loss [87,88]. Consequently, negative NDVI anomalies causing elevated C-factor values in the protected grassland catchments of our study region appear strongly facilitated by the combined effect of fire and abundant wildlife rather than simply resulting from water-stress effects on dry-season vegetation.
In addition, differences in understory vegetation cover and canopy structure, though important in erosion prevention, may not always be well represented by the NDVI-based land-cover proxy [78,89,90]. Dense canopies of, for instance, natural forest vegetation and tree plantations may result in similar NDVI and, therefore, C values, despite potentially very different understories.
4.1.2. Representation of Seasonal Variability in Land Cover
The feasibility of assessing erosion risk through analysis of remote-sensing and GIS data ultimately depends on the availability of high-resolution satellite images with no or low cloud cover. For the target year of 2016 (cf. Section 2), suitable images from our study area in western Uganda proved to be scarce, especially during the rainy season, and consequently, our estimate of the annual mean C-factor was based on two snapshot observations assumed to represent dry-season and wet-season conditions. Although these two images provide clear indication of strong seasonal changes in land cover, they were collected three months apart immediately prior to and towards the end of the principal rain season, while the rest of the year was unrepresented. This does not appear problematic in protected forest catchments, where no significant land-cover change was found between dry- and wet-season conditions. In unprotected (cultivated) catchments and protected grassland catchments, we demonstrated a seasonal difference in the C-factor, but do not know how it varied through the year relative to the obtained Cd and Cw values, and thus, we remain uncertain about the true average annual C-factor in these catchments. On the scale of individual fields, especially those where vegetables with short crop rotations are grown, two snapshot observations may not adequately give an impression of average vegetation cover through a complete agricultural year. However, at the catchment scale on which we focus here, and in comparisons between catchments or groups of catchments, we suggest that this bias was largely averaged out, especially since most agricultural activity in the region concerns subsistence farming [21] (Figure 1a) with small plots owned by different local farmers growing a wide array of crops within a single catchment. This representativity issue would be more pressing in regions where fields are large, relative to the size of the catchments, and used for commercial crops with fixed planting and harvesting cycles, because in that case, the seasonal timing of satellite image acquisition might be subject to a greater hit or miss effect. The equatorial position of our study region, and bimodal precipitation regime with two comparable pairs of dry and rainy seasons likely also plays to our advantage. Therefore, while it goes without saying that better seasonal [or even multi-annual; 58] coverage of all phases of vegetation cover would benefit accurate estimation of the mean annual C-factor [81,91], it would not likely affect the overall contrasts observed between catchment categories in our study region.
4.1.3. Representation of Soil Erodibility
Lack of soil erodibility measurements meant the K-factor had to be estimated based on publicly available data of a subset of soil properties, in this case on topsoil clay, silt and sand, using empirical equations [24]. Without validation, the representativity of the chosen approach to our specific study region remains uncertain [92], as soil erodibility is not solely a product of soil texture but instead is a complex concept which may vary over time, resulting from a multitude of factors such as soil properties, climate and human activity [93,94]. Given the relatively small study region, it is reasonable to expect additional uncertainty regarding the K-factor as a result of spatial variation in land use and the occurrence of fire, more so than differences in soil type or climatic variation.
4.1.4. Representation of Catchment Hydrography
Surface streams flowing into 11 study lakes complicate the estimation of SDR within their catchments, and hence, comparison with the 64 other lakes with catchments lacking such hydrography (excluding #7 Kabalogi due to lack of data but including #43 Mbajo). Although these streams must certainly facilitate sediment transport, data needed to estimate the extent to which they do so [71] are unavailable. We, therefore, determined minimum and maximum SDR values, respectively, representing a scenario of only overland flow and a scenario in which all sediments reaching the streams are assumed to enter the lakes. Although either end-member scenario may be unrealistic, the magnitude of the difference in sediment yield between them is highly informative about the relative role of streams in the hydrology of individual catchments, and thus, the necessity to characterize the flow regime of these streams for accurate assessment of sediment transport to the respective lakes.
4.2. Susceptibility of Crater-Lake Catchments in Western Uganda to Soil Loss
4.2.1. Influence of Catchment Morphometry
The steeply sloping inner crater walls characterizing the large majority of western Uganda’s maar crater catchments (Table 1: mean slope averaging 21.0%, range 4.8–41.0%, n = 75) makes them highly prone to erosion, here reflected in the generally high values for potential soil loss, Ap (Figure 5d). This effect is damped in catchments close to or on the rift valley floor, where topography is gentler than on the rift valley shoulders (Figure 3). However, only three lake catchments (#1 Bagusa, #41 Maseche and #73 Tubengo) had a mean slope less than 10%, and in each of them, maximum slopes exceeded 23% (Table 1). Thus, the slope steepness of catchments included in the present study can be considered as generally high [95]. Secondly, mean sediment delivery ratios strongly depend on catchment size and shape, and because most catchments studied here were small, SDR values were generally high, irrespective of vegetation type or protection status (Figure 7a,b). The protected forest catchments were smaller, on average, than unprotected catchments and protected grassland catchments, and thus, under identical land-cover conditions their mean SDR values would be highest. Consequently, the higher sediment yields observed in unprotected and protected grassland catchments compared to protected forest catchments were clearly a reflection of their higher mean erosion rates and, thus, greater yields of soil material washed down to the lakes.
4.2.2. Influence of Seasonality
Potential soil loss was also high because of the relatively high precipitation in this sub-humid tropical region (1000–1395 mm/year), which, moreover, did not occur evenly through the year but followed a strongly bimodal pattern (Figure 4) with intense downpours characterizing the two rain seasons. In turn, this seasonality in rainfall generated strong seasonality in land cover, at least in unprotected catchments and protected catchments in the savanna. In the latter, this land-cover change was due to a combination of seasonal vegetation drying, fire prevalence and grazing/trampling by large wildlife. In unprotected catchments, the land-cover change was the direct result of crop cycles being tied to the alternation of dry and rainy seasons. In our study area, most agricultural activity involved small-field subsistence farming, complemented to modest extent only by commercial farming of timber wood (eucalyptus and pine), banana, coffee, cotton and tea. All these commercial crops except cotton were perennials. The most common subsistence crops were annuals such as cassava, maize, finger millet, sorghum, sweet potatoes and diverse legumes, all of which are seasonal. Therefore, the agricultural calendar is strongly tied to the onset of the two rainy seasons [40,58] (Figure 4). At the end of each dry season, after most seasonal crops were harvested, fields lie bare while being prepared for planting during the coming rain season. After harvest and especially during seedbed preparation, soils are left exposed (Figure 2f) W. De Crop, pers. obs [82]. Peak soil loss may, thus, be expected to occur at the start of the rainy season, when minimum field vegetation cover coincides with peak rainfall [45,47], and often with intense downpours on single days up to 80 mm; [96]. The exact timing of crop rotation relative to seasonal rainfall patterns is generally known to be an important controlling factor of soil erosion on cultivated lands [44], and also in our study region, the crop rotation cycle was the principal cause of contrasting land cover between the late dry season and late wet season in unprotected catchments, as observed in the Sentinel-2A images (Figure 1). It is, therefore, clear that not just the type of crop, but especially the seasonally bare condition of cultivated land enhances erosion risk in those catchments. Additionally, the overall very low annual soil-loss estimates in protected forest catchments, and their lack of seasonal variation, is not unexpected [82] because the permanently dense canopies of evergreen and semi-deciduous trees keep the C-factor low throughout the year. Although not taken into account when using NDVI as land-cover proxy, the C-factor of undisturbed forests is typically lowered further by the presence of a thick litter layer [43].
4.2.3. Influence of Land Use and Management
To separate the effect of land use on soil erosion in the catchments of western Ugandan crater lakes from confounding factors, impacted catchments must be compared with a set of unimpacted catchments in an otherwise comparable environmental setting. Climatic conditions over the large majority of unprotected catchments in this study are comparable to those in the currently protected forest catchments [97], and in the original pre-impact situation, their natural vegetation was predominantly dense woodland or semi-deciduous forest [36,98]. Within these categories, the effect of land use on soil erosion can best be assessed by comparing the Am values of currently and formerly forested catchments with similar Ap values. For example, the catchments of lakes Kerere (#26), Nyungu (#70) and Katinda (#24) have highly similar modeled Ap values (1996.4–2108.0 t/ha×yr; Table 1). The Kerere catchment is located almost entirely within Kibale National Park (Figure 3), and mostly covered by dense semi-deciduous forest, while only a small peripheral part is under cultivation (Figure 1a and Figure 2f). In contrast, the catchments of both Nyungu and Katinda are unprotected and fully under cultivation (Figure 1a). However, banana plantations provide (semi-) permanent ground cover in a significant part of the Nyungu catchment (Figure 2d), but much less so in the Katinda catchment (Figure 2c) because, according to local farmers, large portions are unsuitable for banana cultivation due to low soil depth and the occurrence of Fusarium wilt in many fields. Instead, the Katinda catchment is mostly covered with vegetable gardens and other annual crops. This contrasting land use between the three catchments is clearly reflected in their modelled Am values, which in Katinda (113.7 t/ha×yr) is 2.5× higher than in Nyungu (45.3 t/ha×yr) and 6.5× higher than in Kerere (17.6 t/ha×yr; Table 1). Expressed in terms of protection against soil erosion, Nyungu and Katinda, both completely under cultivation, rank 21st and 59th in our dataset of 74 catchments compared with the 10th rank of the largely unimpacted Kerere (Figure 8).
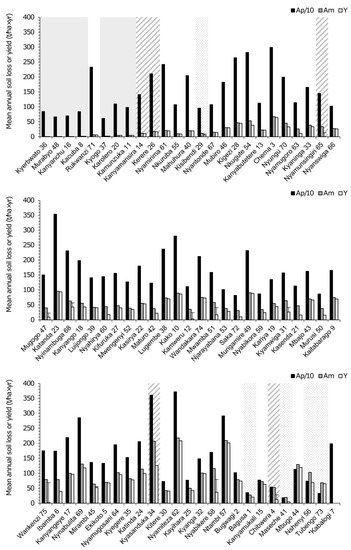
Figure 8.
Bar plot showing mean potential annual soil loss (Ap divided by 10 for scaling purposes; black), mean annual soil loss (Am; grey) and mean annual sediment yield (Y; white) for each of the 75 studied crater-lake catchments in western Uganda, arranged from left to right and top to bottom in rank order of increasing Am/Ap ratio as proxy of relative protection against soil erosion by vegetation cover (protection decreases with higher Am/Ap). Protected forest and grassland catchments are highlighted with a plain grey and dotted background, respectively, and protected lakes of which the catchment is partly located outside the protected area and thus cultivated have a striped background. Lake Kabalogi (7; indicated by *) lacks rainy-season land-cover data and consequently lacks estimates for Am and Y.
Noteworthy in this context are those catchments in our ‘unprotected’ category where private land-owner initiative preserved or restored (semi-) natural forest vegetation for the purpose of private or community-based ecotourism. Three successful cases are Rukwanzi (#71), Nyamirima (#61) and Nkuruba (#55), of which the low Am/Ap values (0.003–0.010; Table A1) were not significantly higher than those of the seven fully protected forest catchments (average 0.002, range 0.001–0.005, p > 0.05; Table A1), ranking them in 5th, 11th and 12th place with regard to protection against soil erosion (Figure 8). Due to the high vegetation cover throughout the year, forest recovery can be highly effective as erosion control measure [10], especially in combination with a well-developed understory and litter layer [78]. Conversely, at Kyaninga (#33), Kifuruka (#27), Kamweru (#12) and Kasenda (#21), local forest conservation and/or restoration efforts are thus far limited to certain areas of these catchments, and sizeable portions of cultivated or grazing land remain. The Am/Ap values of these four catchments (0.023–0.042; Table A1) were only modestly lower or similar to the average value of all unprotected catchments (0.039). A striking observation was that of these four catchments, where at least some soil conservation measures were being implemented, at present, only Kyaninga reaches a level of protection against soil erosion comparable to that of Nyungu, where no such measures are being taken but half of the catchment is under (near-) permanent banana cultivation.
4.3. Socioeconomic and Ecological Relevance
The crater-lake region of western Uganda was settled by mixed subsistence-farming and pastoralist communities for at least 1000 years [99,100,101], but before ca. 250 years ago when human impact on the region’s aquatic and terrestrial ecosystems became evident [102,103,104], only a small fraction of lake catchments and adjacent upland areas may have experienced significant farming activity at any one time. Considering the large number of crater lakes dotting this landscape, indigenous farming communities likely selected individual lake catchments for agricultural development on the basis of three main criteria: (1) the local availability of surface freshwater, (2) adequate precipitation for rain-fed subsistence agriculture [99] and (3) topographic factors such as ease of access and steepness of the land that would be converted into crop fields. The first criterion excluded the crater basins of Bagusa (#1), Maseche (#41) and Nshenyi (#56), the three hypersaline lakes in our category of protected grassland catchments, as well as all crater basins belonging to the Katwe-Kikorongo lake cluster not included in this study, which are also hypersaline [31,32]. The second criterion excluded the land adjacent to Lake George and Kazinga Channel (Figure 1a), which are supplied with abundant fresh water by streams draining the Rwenzori Mountains but are themselves located on the dry and hot rift-valley floor where evaporation far exceeds local rainfall [36]. These climatic conditions also apply to the Tubengo catchment (#73) and the greater part of the Chibwera catchment (#4), which were hence equally unattractive for settlement and eventually became protected from human encroachment when included in Kyambura Game Reserve. Consequently, agricultural development in this region historically focused on the catchments of freshwater crater lakes situated along the rift-valley shoulder, where sub-humid climate conditions prevail [36,105]. A special case is Lake Ntambi (#57), which is itself saline [32] but located immediately adjacent to the freshwater lakes Kyanga (#32) and Kanyamukali (#15), thereby meeting all three selection criteria.
Whereas before and during the colonial era, the magnitude of land conversion was relatively modest, rapid population growth in Uganda after independence in 1962 accelerated both the spread and intensity of farming activity [17,106,107,108]. Although Ugandan soils as a whole were historically perceived as very fertile [109], a decrease in productivity was soon observed under continuous cultivation [63]. Increases in soil erosion and landslides due to intensified agricultural activity and grazing on steep slopes, high nutrient depletion rates and declines in crop yields were reported by various authors [7,110,111,112]. In the crater-lake catchments studied here, soil loss not only affected farming activity but also water quality and fisheries of the lakes. By comparing data stretching over a 25-year period starting in the 1970s, Crisman et al. [23] demonstrated that eutrophication and water-quality loss of Lake Saka (#72) could largely be attributed to intensified agricultural activity in the lake’s catchment. Considering that the Saka catchment had the fifth lowest mean slope (11.0%) of our entire dataset, it is more than likely that similar or more severe eutrophication may occur in a large number of other lakes within the study region [57,113].
A first step towards sustainable land and water management in the crater-lake region of western Uganda is to set realistic goals that are in accordance with local conditions. For tropical soils, soil loss tolerance rates between 1 and 10 t/ha×yr were proposed below which annual soil erosion can be considered acceptable, based on different factors including soil formation rate, environmental impact and feasibility [61,114,115,116]. In our dataset 11 study, catchments were estimated to have mean annual erosion rates below or approaching the upper threshold value of 10 t/ha×yr, namely the seven fully protected forest catchments, one almost fully protected forest catchment (#14 Kanyamansira), one fully protected grassland catchment (#29 Kisibendi, in Kibale National Park) and two of the three ‘unprotected’ catchments under successful soil-protection management (#55 Nkuruba and #71 Rukwanzi). However, of the seven protected forest catchments, all located in gently undulating terrain (i.e., mean slope values well below average: Table 1), only three (#16 Kanyanchu, #36 Kyerbwato and #48 Murabyo) had annual soil loss estimates below 1 t/ha×yr, whereas soil loss in Kamunzuka (#11) was 4.6 t/ha×yr. Considering that protected forest catchments represent the natural vegetation status of most cultivated catchments in the crater-lake region of western Uganda, and taking into account the higher mean LS- and K-factors in these catchments relative to their protected counterparts, setting the sustainable management goal for these catchments to a soil loss tolerance of 5–10 t/ha×yr seems more reasonable. This objective cannot be extrapolated to protected grassland catchments, partly because the soil loss estimates for these catchments obtained in this study may not be fully equivalent to those obtained for the (originally) forested catchments, and secondly because soil erosion in these environments is enhanced by frequent burning and abundant wildlife congregating near the scarce surface waters.
5. Conclusions
The crater-lake catchments of equatorial western Uganda are highly susceptible to anthropogenic soil erosion by nature, mainly due to the local combination of steep inner crater slopes and high-intensity seasonal rainfall. Moreover, due to their generally small size, much of the eroded material is likely to reach the lakes, potentially leading to eutrophication involving nuisance algal blooms, deep-water oxygen loss and massive fish kills. In the larger catchments, the presence of a surface stream greatly enhances potential sediment delivery to the lake but its efficiency in doing so depends on discharge and whether the stream is permanent or seasonal and, consequently, could not be well constrained here. Compared to protected catchments covered by natural forest vegetation, which have an average soil loss of 2.1 t/ha×yr and sediment yield of 2.0 t/ha×yr, cultivated catchments experience high soil losses (64.2 t/ha×yr) and sediment yields (56.0 t/ha×yr) mostly because of the prevalence of bare ground or scarce vegetation cover in fields of annual subsistence crops at the start of the rain seasons. Soil loss can be made to approach levels of protected forest catchments if natural vegetation is restored or allowed to recover in the entire catchment, or drastically reduced by cultivation of (near-) permanent crops such as banana and coffee, or by tree plantations, in combination with a well-developed understory or soil cover.
Lack of field data validating the modeled estimates of annual soil loss and sediment yield obtained in this study implies that the absolute values must be considered with caution, and preferably only in a context of comparisons between different settings. However, this apparent weakness is compensated by the comprehensive nature of our approach, which included 75 protected and unprotected crater catchments in the study region. This allowed us to assess the relative influence of diverse confounding factors and environmental variability among catchments in a manner that would be unfeasible to incorporate in even a large-scale field study. On the contrary, the results of our analysis will now permit informed selection of a manageable subset of crater-lake catchments where detailed field experiments could be developed, with reduced risk of interpretative problems due to unavoidable environmental variability undermining the experiments’ statistical power. In addition, this study already allows us to draw several pertinent conclusions about the susceptibility of cultivated crater lake catchments in western Uganda to soil erosion and about options for sustainable soil-protection measures available to local land managers.
Author Contributions
Conceptualization, W.D.C., D.V. and A.V.; methodology, W.D.C., N.R., D.V. and A.V.; software, W.D.C.; validation, W.D.C.; formal analysis, W.D.C.; investigation, W.D.C., R.B. and J.T.O.; resources, W.D.C.; data curation, W.D.C.; writing—original draft preparation, W.D.C.; writing—review and editing, W.D.C., D.V., N.R., R.B., J.T.O. and A.V.; visualization, W.D.C.; supervision, W.D.C., D.V. and A.V.; project administration, D.V.; funding acquisition, W.D.C., D.V. and A.V. All authors have read and agreed to the published version of the manuscript.
Funding
This research was funded by a VLADOC PhD fellowship to W.D.C. through the Flemish Inter-University Council on Development Cooperation (VLIR-UOS). The APC was funded by the Limnology Unit at Ghent University.
Data Availability Statement
The data presented in this study are available in the article.
Acknowledgments
We thank the Uganda National Council for Science & Technology (UNCST) and Uganda Wildlife Authority (UWA) for permission to conduct the fieldwork (ref. NS471); the National Fisheries Resources Research Institute (NaFIRRI) and its current and previous directors Winnie Nkalubo, Anthony Taabu Munyaho and John Stephen Balirwa for facilitation; Caxton Oluseno and Johnson Bwambale for field assistance; and Makerere University Biological Field Station (MUBFS) staff for their hospitality and the sharing of rainfall and air-temperature data from Kibale National Park. Finally, we are grateful to Rudi Goossens for the advice on various remote-sensing products and Mattis Michel for his assistance in data processing.
Conflicts of Interest
The authors declare no conflict of interest. The funders had no role in the design of the study; in the collection, analyses, or interpretation of data; in the writing of the manuscript; or in the decision to publish the results.
Appendix A
Table A1.
Catchment averages (or totals, where mentioned) for all 75 Ugandan crater lakes catchments included in this study, listed alphabetically and numbered as in Figure 3, as well as for the three catchment groups distinguished in this study according to protection status (UP: Unprotected catchment; PF: Protected forest catchment; PG: Protected grassland catchment). A0/Ac: Ratio of lake area to catchment area; P: mean annual rainfall; Flow acc.: Average number of cells contributing to an individual cell in each catchment; Cd: Cover management factor during dry season conditions; Cw: Cover management factor during wet season conditions; Total Ap: Total potential annual soil loss within a catchment; Total Am: Total estimated annual soil loss within a catchment; Total Y: Total annual sediment yield within a catchment; Am/Ap: Ratio of estimated annual soil loss to potential annual soil loss; Lakes with surface streams are indicated by *. Minimum and maximum estimates for Total Y are shown for these lakes, with the exception of Mbajo (see text). Values from the Kabalogi catchment are included only in the averaged Flow acc. and Total Ap estimates for all lakes. Averages for Total Y also do not include lakes with inflowing surface streams (except Mbajo): sample sizes are 63, 50 and 4 for all, UP and PG, respectively.
| Lake | Elevation | A0/Ac | P | Flow acc. | Cd | Cw | Total Ap | Total Am | Total Y | Am/Ap | |
|---|---|---|---|---|---|---|---|---|---|---|---|
| (m a.s.l.) | (mm/yr) | (Cells) | (t/yr) | (t/yr) | (t/yr) | ||||||
| 1 | Bagusa | 909 | 0.271 | 1032 | 12.9 | 0.173 | 0.014 | 55,159 | 4269 | 3169 | 0.077 |
| 2 | Bugwagi | 1057 | 1.192 | 1089 | 4.8 | 0.147 | 0.017 | 53,123 | 4105 | 3851 | 0.077 |
| 3 | Chema | 1270 | 0.750 | 1191 | 6.1 | 0.050 | 0.007 | 279,160 | 6284 | 5995 | 0.023 |
| 4 | Chibwera * | 976 | 0.289 | 1076 | 28.9 | 0.188 | 0.015 | 151,588 | 14,748 | 3453–7937 | 0.097 |
| 5 | Ekikoto | 1538 | 0.314 | 1307 | 2.8 | 0.131 | 0.008 | 6970 | 364 | 356 | 0.052 |
| 6 | Ibamba | 1066 | 0.045 | 1167 | 35.7 | 0.101 | 0.006 | 929,649 | 42,240 | 21,134 | 0.045 |
| 7 | Kabalogi | 1361 | 0.353 | 1199 | 9.7 | 0.079 | - | 159,076 | - | - | - |
| 8 | Kacuba | 1115 | 1.181 | 1185 | 4.0 | 0.003 | 0.001 | 40,068 | 84 | 79 | 0.002 |
| 9 | Kaitabarago | 1550 | 0.190 | 1318 | 3.1 | 0.116 | 0.014 | 19,108 | 861 | 803 | 0.045 |
| 10 | Kako | 1409 | 0.619 | 1267 | 4.2 | 0.070 | 0.003 | 85,061 | 2699 | 2614 | 0.032 |
| 11 | Kamunzuka | 1286 | 1.444 | 1243 | 2.5 | 0.009 | 0.003 | 16,206 | 75 | 73 | 0.005 |
| 12 | Kamweru* | 1281 | 0.028 | 1203 | 64.5 | 0.056 | 0.008 | 919,859 | 29,430 | 2597–20,421 | 0.032 |
| 13 | Kanyabutetere | 1188 | 0.161 | 1222 | 2.4 | 0.044 | 0.005 | 7718 | 155 | 152 | 0.020 |
| 14 | Kanyamansira | 1169 | 0.377 | 1255 | 3.0 | 0.020 | 0.001 | 14,236 | 116 | 105 | 0.008 |
| 15 | Kanyamukali | 1153 | 0.060 | 1224 | 8.1 | 0.190 | 0.016 | 28,422 | 2659 | 2314 | 0.094 |
| 16 | Kanyanchu | 1239 | 0.285 | 1255 | 3.8 | 0.002 | 0.001 | 4425 | 5 | 4 | 0.001 |
| 17 | Kanyangeye | 1574 | 0.084 | 1318 | 3.1 | 0.108 | 0.001 | 13,035 | 592 | 574 | 0.045 |
| 18 | Kanyango | 1264 | 0.262 | 1265 | 9.8 | 0.052 | 0.009 | 118,025 | 3297 | 2563 | 0.028 |
| 19 | Kariya | 1252 | 0.591 | 1161 | 16.3 | 0.092 | 0.008 | 180,034 | 7323 | 5977 | 0.041 |
| 20 | Karolero | 1114 | 0.436 | 1185 | 2.8 | 0.007 | 0.001 | 16,586 | 69 | 64 | 0.004 |
| 21 | Kasenda | 1238 | 0.036 | 1223 | 37.1 | 0.078 | 0.003 | 215,128 | 8966 | 3070 | 0.042 |
| 22 | Kasirya | 1257 | 0.450 | 1203 | 2.9 | 0.063 | 0.007 | 45,033 | 1386 | 1346 | 0.031 |
| 23 | Katanda | 1343 | 0.916 | 1282 | 3.8 | 0.050 | 0.003 | 147,538 | 3987 | 3899 | 0.027 |
| 24 | Katinda | 1041 | 0.294 | 1140 | 13.7 | 0.118 | 0.004 | 313,271 | 17,320 | 15,093 | 0.055 |
| 25 | Kayihara | 1539 | 0.020 | 1303 | 8.0 | 0.131 | 0.011 | 16,409 | 1067 | 904 | 0.065 |
| 26 | Kerere | 1204 | 0.890 | 1255 | 3.1 | 0.026 | 0.001 | 72,686 | 605 | 566 | 0.008 |
| 27 | Kifuruka | 1402 | 0.205 | 1282 | 12.2 | 0.051 | 0.005 | 109,764 | 3358 | 2839 | 0.031 |
| 28 | Kigezi | 1294 | 0.219 | 1203 | 5.5 | 0.037 | 0.009 | 118,705 | 2090 | 2011 | 0.018 |
| 29 | Kisibendi * | 1129 | 0.090 | 1221 | 19.5 | 0.022 | 0.002 | 49,760 | 601 | 286–482 | 0.012 |
| 30 | Kitere | 1141 | 0.686 | 1172 | 2.6 | 0.123 | 0.011 | 11,376 | 661 | 635 | 0.058 |
| 31 | Kyamwiga * | 1023 | 0.181 | 1146 | 136.7 | 0.095 | 0.012 | 2,646,793 | 107,990 | 44,379–70,834 | 0.041 |
| 32 | Kyanga | 1150 | 0.691 | 1189 | 2.3 | 0.148 | 0.008 | 24,720 | 1681 | 1642 | 0.068 |
| 33 | Kyaninga | 1538 | 0.339 | 1301 | 8.7 | 0.067 | 0.003 | 134,725 | 3121 | 2754 | 0.023 |
| 34 | Kyasanduka | 1012 | 0.280 | 1193 | 24.5 | 0.125 | 0.002 | 674,190 | 38,661 | 23,437 | 0.057 |
| 35 | Kyegere | 1519 | 0.366 | 1365 | 4.4 | 0.094 | 0.008 | 48,773 | 2619 | 2487 | 0.054 |
| 36 | Kyerbwato | 1230 | 0.188 | 1255 | 13.2 | 0.001 | 0.000 | 51,579 | 39 | 36 | 0.001 |
| 37 | Kyogo | 1111 | 0.246 | 1185 | 2.8 | 0.003 | 0.002 | 5249 | 17 | 16 | 0.003 |
| 38 | Lugembe | 1284 | 0.270 | 1257 | 5.3 | 0.060 | 0.013 | 69,592 | 2155 | 2051 | 0.031 |
| 39 | Luijongo | 1267 | 0.939 | 1197 | 6.2 | 0.065 | 0.004 | 80,518 | 2409 | 2312 | 0.030 |
| 40 | Mahuhura | 1253 | 0.831 | 1222 | 2.6 | 0.028 | 0.003 | 50,565 | 494 | 482 | 0.010 |
| 41 | Maseche | 909 | 0.068 | 1031 | 68.5 | 0.228 | 0.008 | 93,061 | 9623 | 2285 | 0.103 |
| 42 | Maturo | 1266 | 0.089 | 1203 | 22.6 | 0.080 | 0.027 | 250,647 | 7718 | 4515 | 0.031 |
| 43 | Mbajo * | 1253 | 0.637 | 1226 | 3.4 | 0.094 | 0.006 | 23,830 | 1020 | 971 | 0.043 |
| 44 | Mbugo | 979 | 0.327 | 1088 | 8.2 | 0.252 | 0.015 | 156,175 | 17,829 | 16,486 | 0.114 |
| 45 | Mirambi * | 1084 | 0.246 | 1131 | 28.1 | 0.102 | 0.012 | 313,463 | 14,669 | 12,038–12,871 | 0.047 |
| 46 | Mubiro | 1213 | 0.725 | 1222 | 2.7 | 0.027 | 0.004 | 45,088 | 758 | 739 | 0.017 |
| 47 | Mugogo * | 1321 | 0.119 | 1237 | 79.4 | 0.061 | 0.012 | 1,499,376 | 40,206 | 9528–22,928 | 0.027 |
| 48 | Murabyo | 1115 | 1.147 | 1185 | 2.8 | 0.001 | 0.001 | 15,651 | 14 | 14 | 0.001 |
| 49 | Murigamire | 1200 | 0.638 | 1222 | 4.3 | 0.070 | 0.008 | 98,101 | 3836 | 3736 | 0.039 |
| 50 | Murusi | 1225 | 0.127 | 1222 | 37.6 | 0.065 | 0.004 | 147,228 | 6475 | 2705 | 0.044 |
| 51 | Mwamba * | 1303 | 0.063 | 1284 | 52.3 | 0.058 | 0.005 | 1,030,355 | 37,726 | 11,166–27,183 | 0.037 |
| 52 | Mwengenyi | 1399 | 0.303 | 1282 | 7.8 | 0.051 | 0.007 | 132,909 | 4091 | 3655 | 0.031 |
| 53 | Njarayabana | 1173 | 0.100 | 1223 | 18.5 | 0.079 | 0.007 | 106,315 | 4050 | 3031 | 0.038 |
| 54 | Nkugute | 1409 | 0.181 | 1264 | 24.5 | 0.038 | 0.010 | 1,450,638 | 27,481 | 19,823 | 0.019 |
| 55 | Nkuruba | 1501 | 0.402 | 1395 | 3.7 | 0.027 | 0.001 | 6673 | 64 | 56 | 0.010 |
| 56 | Nshenyi | 952 | 0.247 | 1057 | 12.2 | 0.291 | 0.004 | 174,057 | 24,332 | 16,238 | 0.140 |
| 57 | Ntambi | 1168 | 0.665 | 1224 | 4.5 | 0.162 | 0.006 | 139,992 | 10,062 | 9668 | 0.072 |
| 58 | Nyabikere * | 1382 | 0.048 | 1342 | 42.5 | 0.128 | 0.011 | 1,538,827 | 105,346 | 33,256–72,175 | 0.068 |
| 59 | Nyabikora | 1560 | 0.114 | 1365 | 10.6 | 0.063 | 0.008 | 59,400 | 2368 | 1673 | 0.040 |
| 60 | Nyahirya | 1443 | 0.026 | 1319 | 24.7 | 0.062 | 0.014 | 149,795 | 4578 | 1861 | 0.031 |
| 61 | Nyamirima | 1504 | 0.777 | 1395 | 5.2 | 0.034 | 0.002 | 54,128 | 464 | 439 | 0.009 |
| 62 | Nyamiteza | 1262 | 0.377 | 1224 | 8.3 | 0.095 | 0.012 | 289,444 | 16,958 | 16,214 | 0.059 |
| 63 | Nyamugoro | 1270 | 0.039 | 1256 | 39.0 | 0.041 | 0.008 | 306,641 | 6959 | 2975 | 0.023 |
| 64 | Nyamugosani | 1213 | 0.292 | 1224 | 6.8 | 0.109 | 0.006 | 66,893 | 3494 | 3261 | 0.052 |
| 65 | Nyamusingiri * | 983 | 0.216 | 1205 | 92.4 | 0.017 | 0.001 | 2,726,800 | 63,605 | 384–25,499 | 0.023 |
| 66 | Nyanswiga | 1458 | 0.379 | 1324 | 3.0 | 0.056 | 0.005 | 7523 | 200 | 194 | 0.027 |
| 67 | Nyantonde | 1393 | 0.845 | 1282 | 2.3 | 0.025 | 0.006 | 17,025 | 233 | 227 | 0.014 |
| 68 | Nyinambuga * | 1364 | 0.348 | 1282 | 20.7 | 0.054 | 0.003 | 377,320 | 10,288 | 7010–9302 | 0.027 |
| 69 | Nynabulita | 1425 | 0.487 | 1395 | 11.9 | 0.104 | 0.005 | 215,062 | 9843 | 8893 | 0.046 |
| 70 | Nyungu | 1185 | 0.085 | 1197 | 30.9 | 0.065 | 0.010 | 455,934 | 10346 | 7496 | 0.023 |
| 71 | Rukwanzi | 1330 | 0.472 | 1282 | 3.4 | 0.009 | 0.002 | 42,944 | 117 | 107 | 0.003 |
| 72 | Saka | 1565 | 0.076 | 1344 | 40.0 | 0.063 | 0.007 | 587,399 | 22,726 | 7262 | 0.039 |
| 73 | Tubengo | 914 | 1.543 | 1036 | 3.3 | 0.402 | 0.137 | 18,617 | 3859 | 3670 | 0.207 |
| 74 | Wandakara | 1156 | 0.186 | 1222 | 3.6 | 0.069 | 0.003 | 34,161 | 1206 | 1178 | 0.035 |
| 75 | Wankenzi * | 1167 | 0.014 | 1284 | 188.3 | 0.093 | 0.007 | 2,296,404 | 10,4217 | 3468–89,988 | 0.045 |
| all (75) | 1251 | 0.177 | 1230 | 19.5 | 0.083 | 0.009 | 305,490 | 12,100 | 4044 | 0.040 | |
| UP (57) | 1299 | 0.150 | 1249 | 20.2 | 0.081 | 0.008 | 325,838 | 12,888 | 4184 | 0.039 | |
| PF (7) | 1173 | 0.722 | 1213 | 4.6 | 0.004 | 0.001 | 21,395 | 43 | 41 | 0.002 | |
| PG (5) | 963 | 0.227 | 1075 | 23.3 | 0.223 | 0.033 | 78,131 | 8537 | 6341 | 0.108 | |

Figure A1.
Distribution of soil type and texture across the study region. (a) The dominant soil type is Mollic Silandic Andosols (ANsm, red); Lithic Leptosols (LPl, grey), Albic Luvisols (LVab, crimson) and Haplic Podzols (PZha, green) each occur in a handful of lake catchments; Haplic Acrisols (ACha, orange) Dystric Fluvisols (FLdy, blue) and Eutric Fluvisols (FLeu, dark blue) are not represented in the studied lake catchments. Map adopted from Jones et al. [34]. (b) Variation in the geometric mean diameter (Dg; in mm) of mineral topsoil particles within and between catchments, based on data from the Africa Soil Information Service AfSIS; [51].

Figure A2.
Variation in flow accumulation (a) and slope gradient (b) within and between the 75 studied crater-lake catchments, calculated from the [55] one arc-second (ca. 30 m) resolution Digital Elevation Model (DEM) based on Shuttle Radar Topography Mission (SRTM) data. Flow accumulation is shown as the number of grid cells of the 30 m resolution DEM contributing to each downstream cell.
References
- Foley, J.A.; DeFries, R.; Asner, G.P.; Barford, C.; Bonan, G.; Carpenter, S.R.; Chapin, F.S.; Coe, M.T.; Daily, G.C.; Gibbs, H.K.; et al. Global Consequences of Land Use. Science 2005, 309, 570–574. [Google Scholar] [CrossRef]
- Pimentel, D.; Harvey, C.; Resosudarmo, P.; Sinclair, K.; Kurz, D.; McNair, M.; Crist, S.; Shpritz, L.; Fitton, L.; Saffouri, R.; et al. Environmental and Economic Costs of Soil Erosion and Conservation Benefits. Science 1995, 267, 1117–1123. [Google Scholar] [CrossRef]
- Eswaran, H.; Lal, R.; Reich, P. Land Degradation: An overview. In Response to Land Degradation; Bridges, E.M., Ed.; CRC Press: Boca Raton, FL, USA, 2001. [Google Scholar]
- Borrelli, P.; Robinson, D.A.; Fleischer, L.R.; Lugato, E.; Ballabio, C.; Alewell, C.; Meusburger, K.; Modugno, S.; Schütt, B.; Ferro, V. An assessment of the global impact of 21st century land use change on soil erosion. Nat. Commun. 2017, 8, 2013. [Google Scholar] [CrossRef]
- Hansen, M.C.; Potapov, P.V.; Moore, R.; Hancher, M.; Turubanova, S.A.; Tyukavina, A.; Thau, D.; Stehman, S.V.; Goetz, S.J.; Loveland, T.R.; et al. High-Resolution Global Maps of 21st-Century Forest Cover Change. Science 2013, 342, 850–853. [Google Scholar] [CrossRef]
- Panagos, P.; Borrelli, P.; Meusburger, K.; Yu, B.; Klik, A.; Jae Lim, K.; Yang, J.E.; Ni, J.; Miao, C.; Chattopadhyay, N.; et al. Global rainfall erosivity assessment based on high-temporal resolution rainfall records. Sci. Rep. 2017, 7, 4175. [Google Scholar] [CrossRef]
- Stoorvogel, J.J.; Smaling, E.M.A. Assessment of Soil Nutrient Depletion in Sub-Saharan Africa: 1983–2000. Vol. 2: Nutrient Balances Per Crop and Per Land Use Systems; 0924-3062; ISRIC: Wageningen, The Netherlands, 1990. [Google Scholar]
- Tully, K.; Sullivan, C.; Weil, R.; Sanchez, P. The state of soil degradation in Sub-Saharan Africa: Baselines, trajectories, and solutions. Sustainability 2015, 7, 6523–6552. [Google Scholar] [CrossRef]
- Sanchez, P.A. Soil Fertility and Hunger in Africa. Science 2002, 295, 2019–2020. [Google Scholar] [CrossRef]
- FAO; ITPS. Status of the World’s Soil Resources (SWSR)–Main Report; Food and Agriculture Organization of the United Nations and Intergovernmental Technical Panel on Soils: Rome, Italy, 2015. [Google Scholar]
- UNDESA. World Population Prospects: The 2017 Revision, Key Findings and Advance Tables; United Nations: New York, NY, USA, 2017. [Google Scholar]
- Mekonnen, M.M.; Hoekstra, A.Y. Four billion people facing severe water scarcity. Sci. Adv. 2016, 2, e1500323. [Google Scholar] [CrossRef]
- WAPP. The United Nations World Water Development Report 2018: Nature-Based Solutions for Water; UNESCO: Paris, France, 2018. [Google Scholar]
- Fugère, V.; Nyboer, E.A.; Bleecker, J.C.; Chapman, L.J. Impacts of forest loss on inland waters: Identifying critical research zones based on deforestation rates, aquatic ecosystem services, and past research effort. Biol. Conserv. 2016, 201, 277–283. [Google Scholar] [CrossRef]
- RCMRD. Land Cover Viewer: Eastern and Southern Africa; RCMRD: Nairobi, Kenya, 2014. [Google Scholar]
- UNDESA. World Population Prospects 2019, Volume I: Comprehensive Tables; United Nations: New York, NY, USA, 2019. [Google Scholar]
- UBOS. The National Population and Housing Census 2014—Main Report; UBOS: Kampala, Uganda, 2016. [Google Scholar]
- Saulnier-Talbot, É.; Gregory-Eaves, I.; Simpson, K.G.; Efitre, J.; Nowlan, T.E.; Taranu, Z.E.; Chapman, L.J. Small Changes in Climate Can Profoundly Alter the Dynamics and Ecosystem Services of Tropical Crater Lakes. PLoS ONE 2014, 9, e86561. [Google Scholar] [CrossRef]
- Bwanika, G.N.; Makanga, B.; Kizito, Y.; Chapman, L.J.; Balirwa, J.S. Observations on the biology of Nile tilapia, Oreochromis niloticus L., in two Ugandan crater lakes. Afr. J. Ecol. 2004, 42, 93–101. [Google Scholar] [CrossRef]
- Poste, A.E.; Hecky, R.E.; Guildford, S.J. Phosphorus enrichment and carbon depletion contribute to high Microcystis biomass and microcystin concentrations in Ugandan lakes. Limnol. Oceanogr. 2013, 58, 1075–1088. [Google Scholar] [CrossRef]
- Hartter, J.; Ryan, S.J.; MacKenzie, C.A.; Goldman, A.; Dowhaniuk, N.; Palace, M.; Diem, J.E.; Chapman, C.A. Now there is no land: A story of ethnic migration in a protected area landscape in western Uganda. Popul. Environ. 2015, 36, 452–479. [Google Scholar] [CrossRef]
- Majaliwa, J.G.M.; Twongyirwe, R.; Nyenje, R.; Oluka, M.; Ongom, B.; Sirike, J.; Mfitumukiza, D.; Azanga, E.; Natumanya, R.; Mwerera, R.; et al. The Effect of Land Cover Change on Soil Properties around Kibale National Park in South Western Uganda. Appl. Environ. Soil Sci. 2010, 2010, 7. [Google Scholar] [CrossRef]
- Crisman, T.L.; Chapman, L.J.; Chapman, C.A.; Prenger, J. Cultural eutrophication of a Ugandan highland crater lake: A 25-year comparison of limnological parameters. Int. Ver. Theor. Angew. Limnol. Verh. 2001, 27, 3574–3578. [Google Scholar] [CrossRef]
- Renard, K.G.; Foster, G.R.; Weesies, G.A.; McCool, D.K.; Yoder, D.C. Predicting Soil Erosion by Water: A Guide to Conservation Planning with the Revised Universal Soil Loss Equation (RUSLE); U.S. Department of Agriculture, Agricultural Research Service: Washington, DC, USA, 1997; p. 384. [Google Scholar]
- Ferro, V.; Porto, P. Sediment delivery distributed (SEDD) model. J. Hydrol. Eng. 2000, 5, 411–422. [Google Scholar] [CrossRef]
- Avwunudiogba, A.; Hudson, P.F. A review of soil erosion models with special reference to the needs of humid tropical mountainous environments. Eur. J. Sustain. Dev. 2014, 3, 299–310. [Google Scholar] [CrossRef]
- Melack, J.M. Morphometric, physical and chemical features of the volcanic crater lakes of western Uganda. Arch. Hydrobiol. 1978, 84, 430–453. [Google Scholar]
- Rosendahl, B.R. Architecture of Continental Rifts with Special Reference to East Africa. Annu. Rev. Earth Planet. Sci. 1987, 15, 445–503. [Google Scholar] [CrossRef]
- Yamba, T.K.; Boven, A. Evolution Pliocène et Quaternaire du remplissage sédimentaire dans le sud du bassin du lac Edouard, branche occidentale du Rift Est-Africain. J. Afr. Earth Sci. 1998, 26, 423–439. [Google Scholar] [CrossRef]
- Boven, A.; Pasteels, P.; Punzalan, L.E.; Yamba, T.K.; Musisi, J.H. Quaternary perpotassic magmatism in Uganda (Toro-Ankole Volcanic Province): Age assessment and significance for magmatic evolution along the East African Rift. J. Afr. Earth Sci. 1998, 26, 463–476. [Google Scholar] [CrossRef]
- Mungoma, S. The alkaline, saline lakes of Uganda: A review. Hydrobiologia 1990, 208, 75–80. [Google Scholar] [CrossRef]
- Rumes, B.; Eggermont, H.; Verschuren, D. Distribution and faunal richness of Cladocera in western Uganda crater lakes. Hydrobiologia 2011, 676, 39–56. [Google Scholar] [CrossRef]
- IUSS Working Group. World Reference Base for Soil Resources; FAO: Rome, Italy, 2006. [Google Scholar]
- Jones, A.; Breuning-Madsen, H.; Brossard, M.; Dampha, A.; Deckers, J.; Dewitte, O.; Gallali, T.; Hallett, S.; Jones, R.; Kilasara, M.; et al. Soil atlas of Africa; Publications Office of the European Union: Luxembourg, 2013; p. 176. [Google Scholar]
- De Crop, W.; Verschuren, D. Mixing regimes in the equatorial crater lakes of western Uganda. Limnologica 2021, 90, 125891. [Google Scholar] [CrossRef]
- Ssemmanda, I.; Gelorini, V.; Verschuren, D. Sensitivity of East African savannah vegetation to historical moisture-balance variation. Clim. Past 2014, 10, 2067–2080. [Google Scholar] [CrossRef]
- Chapman, L.J.; Chapman, C.A.; Crisman, T.L.; Nordlie, F.G. Dissolved oxygen and thermal regimes of a Ugandan crater lake. Hydrobiologia 1998, 385, 201–211. [Google Scholar] [CrossRef]
- Hartter, J.; Stampone, M.D.; Ryan, S.J.; Kirner, K.; Chapman, C.A.; Goldman, A. Patterns and perceptions of climate change in a biodiversity conservation hotspot. PLoS ONE 2012, 7, e32408. [Google Scholar] [CrossRef]
- De Crop, W.; Verschuren, D. Determining patterns of stratification and mixing in tropical crater lakes through intermittent water-column profiling: A case study in western Uganda. J. Afr. Earth Sci. 2019, 153, 17–30. [Google Scholar] [CrossRef]
- FEWS. Famine Early Warning Systems Network; FEWS NET: Washington, DC, USA, 2013. [Google Scholar]
- White, F. The Vegetation of Africa: A Descriptive Memoir to Accompany the Unesco/AETFAT/UNSO Vegetation Map of Africa; Unesco: Paris, France, 1983. [Google Scholar]
- Merritt, W.S.; Letcher, R.A.; Jakeman, A.J. A review of erosion and sediment transport models. Environ. Model. Softw. 2003, 18, 761–799. [Google Scholar] [CrossRef]
- Wischmeier, W.H.; Smith, D.D. Predicting Rainfall Erosion Losses—A Guide To Conservation Planning; USDA, Science and Education Administration: Hyattsville, MD, USA, 1978; Volume 537, p. 62. [Google Scholar]
- Wischmeier, W.H.; Smith, D.D. Rainfall energy and its relationship to soil loss. Eos Trans. Am. Geophys. Union 1958, 39, 285–291. [Google Scholar] [CrossRef]
- Claessens, L.; Van Breugel, P.; Notenbaert, A.; Herrero, M.; Van De Steeg, J. Mapping potential soil erosion in East Africa using the Universal Soil Loss Equation and secondary data. IAHS Publ. 2008, 325, 398. [Google Scholar]
- Renard, K.G.; Freimund, J.R. Using monthly precipitation data to estimate the R-factor in the revised USLE. J. Hydrol. 1994, 157, 287–306. [Google Scholar] [CrossRef]
- Moore, T.R. Rainfall Erosivity in East Africa. Geogr. Annaler. Ser. A Phys. Geogr. 1979, 61, 147–156. [Google Scholar] [CrossRef]
- Foster, G.R.; McCool, D.; Renard, K.G.; Moldenhauer, W.C. Conversion of the Universal Soil Los Equation to SI metric units. J. Soil Water Conserv. 1981, 36, 355–359. [Google Scholar]
- Funk, C.; Peterson, P.; Landsfeld, M.; Pedreros, D.; Verdin, J.; Shukla, S.; Husak, G.; Rowland, J.; Harrison, L.; Hoell, A.; et al. The climate hazards infrared precipitation with stations—A new environmental record for monitoring extremes. Sci. Data 2015, 2, 150066. [Google Scholar] [CrossRef]
- Shirazi, M.A.; Boersma, L. A Unifying Quantitative Analysis of Soil Texture. Soil Sci. Soc. Am. J. 1984, 48, 142–147. [Google Scholar] [CrossRef]
- Hengl, T.; Heuvelink, G.B.M.; Kempen, B.; Leenaars, J.G.B.; Walsh, M.G.; Shepherd, K.D.; Sila, A.; MacMillan, R.A.; Mendes de Jesus, J.; Tamene, L.; et al. Mapping Soil Properties of Africa at 250 m Resolution: Random Forests Significantly Improve Current Predictions. PLoS ONE 2015, 10, e0125814. [Google Scholar] [CrossRef]
- Moore, I.D.; Wilson, J.P. Length-slope factors for the Revised Universal Soil Loss Equation: Simplified method of estimation. J. Soil Water Conserv. 1992, 47, 423–428. [Google Scholar]
- Moore, I.D.; Burch, G.J. Modelling Erosion and Deposition: Topographic Effects. Trans. ASAE 1986, 29, 1624. [Google Scholar] [CrossRef]
- Moore, I.D.; Burch, G.J. Physical Basis of the Length-slope Factor in the Universal Soil Loss Equation. Soil Sci. Soc. Am. J. 1986, 50, 1294–1298. [Google Scholar] [CrossRef]
- USGS. Shuttle Radar Topography Mission (SRTM) 1 Arc-Second Global; USGS: Reston, VA, USA, 2014. [Google Scholar] [CrossRef]
- ESA. Copernicus Sentinel-2A Data; ESA: Paris, France, 2016. [Google Scholar] [CrossRef]
- Nankabirwa, A.; De Crop, W.; Van der Meeren, T.; Cocquyt, C.; Plisnier, P.-D.; Balirwa, J.; Verschuren, D. Phytoplankton communities in the crater lakes of western Uganda, and their indicator species in relation to lake trophic status. Ecol. Indic. 2019, 107, 105563. [Google Scholar] [CrossRef]
- Phillips, J.; McIntyre, B. ENSO and interannual rainfall variability in Uganda: Implications for agricultural management. Int. J. Climatol. 2000, 20, 171–182. [Google Scholar] [CrossRef]
- Van der Knijff, J.M.F.; Jones, R.J.A.; Montanarella, L. Soil Erosion Risk Assessment in Italy; European Soil Bureau, European Commission: Brussels, Belgium, 1999; p. 54. [Google Scholar]
- Jiang, B.; Bamutaze, Y.; Pilesjö, P. Climate change and land degradation in Africa: A case study in the Mount Elgon region, Uganda. Geo-Spat. Inf. Sci. 2014, 17, 39–53. [Google Scholar] [CrossRef]
- Karamage, F.; Zhang, C.; Liu, T.; Maganda, A.; Isabwe, A. Soil Erosion Risk Assessment in Uganda. Forests 2017, 8, 52. [Google Scholar] [CrossRef]
- FAO; IFAD. A Review of Cassava in Africa with Country Case Studies on Nigeria, Ghana, the United Republic of Tanzania, Uganda and Benin; International Fund for Agricultural Development Food and Agriculture Organization of the United Nations: Rome, Italy, 2005. [Google Scholar]
- Ssali, H. A century of soils research and development in Uganda. Uganda J. Agric. Sci. 2000, 5, 22–27. [Google Scholar]
- Renard, K.G.; Foster, G.R.; Weesies, G.A.; Porter, J.P. RUSLE: Revised universal soil loss equation. J. Soil Water Conserv. 1991, 46, 30–33. [Google Scholar]
- Ferro, V.; Minacapilli, M. Sediment delivery processes at basin scale. Hydrol. Sci. J. 1995, 40, 703–717. [Google Scholar] [CrossRef]
- Jain, M.K.; Kothyari, U.C. Estimation of soil erosion and sediment yield using GIS. Hydrol. Sci. J. 2000, 45, 771–786. [Google Scholar] [CrossRef]
- Fu, G.; Chen, S.; McCool, D.K. Modeling the impacts of no-till practice on soil erosion and sediment yield with RUSLE, SEDD, and ArcView GIS. Soil Tillage Res. 2006, 85, 38–49. [Google Scholar] [CrossRef]
- Cronshey, R. Urban Hydrology for Small Watersheds; US Department of Agriculture, Soil Conservation Service, Engineering Division: Washington, DC, USA, 1986. [Google Scholar]
- Haan, C.T.; Barfield, B.J.; Hayes, J.C. Design Hydrology and Sedimentology for Small Catchments; Academic Press: New York, NY, USA, 1994. [Google Scholar]
- ESA. S2 prototype Land Cover 20m map of Africa 2016. Climate Change Initiative—Land Cover. 2017. Available online: https://2016africalandcover20m.esrin.esa.int/download.php (accessed on 1 March 2023).
- Atkinson, E. Methods for assessing sediment delivery in river systems. Hydrol. Sci. J. 1995, 40, 273–280. [Google Scholar] [CrossRef]
- QGIS Development Team. QGIS Geographic Information System; Open Source Geospatial Foundation: Beaverton, OR, USA, 2018. [Google Scholar]
- Lindsay, J.B. Whitebox GAT: A case study in geomorphometric analysis. Comput. Geosci. 2016, 95, 75–84. [Google Scholar] [CrossRef]
- Muller-Wilm, U.; Louis, J.; Richter, R.; Gascon, F.; Niezette, M. Sentinel-2 Level 2A Prototype Processor: Architecture, Algorithms and First Results; ESA Living Planet Symposium: Edinburgh, UK, 2013; pp. 9–13. [Google Scholar]
- R Core Team. R: A Language and Environment for Statistical Computing; R Foundation for Statistical Computing: Vienna, Austria, 2013. [Google Scholar]
- Gelorini, V.; Ssemmanda, I.; Verschuren, D. Validation of non-pollen palynomorphs as paleoenvironmental indicators in tropical Africa: Contrasting ~200-year paleolimnological records of climate change and human impact. Rev. Palaeobot. Palynol. 2012, 186, 90–101. [Google Scholar] [CrossRef]
- Cohen, M.J.; Shepherd, K.D.; Walsh, M.G. Empirical reformulation of the universal soil loss equation for erosion risk assessment in a tropical watershed. Geoderma 2005, 124, 235–252. [Google Scholar] [CrossRef]
- Labrière, N.; Locatelli, B.; Laumonier, Y.; Freycon, V.; Bernoux, M. Soil erosion in the humid tropics: A systematic quantitative review. Agric. Ecosyst. Environ. 2015, 203, 127–139. [Google Scholar] [CrossRef]
- El-Swaify, S.A. Factors affecting soil erosion hazards and conservation needs for tropical steeplands. Soil Technol. 1997, 11, 3–16. [Google Scholar] [CrossRef]
- Trimble, S.W.; Crosson, P.U.S. Soil Erosion Rates—Myth and Reality. Science 2000, 289, 248–250. [Google Scholar] [CrossRef]
- Vrieling, A. Satellite remote sensing for water erosion assessment: A review. CATENA 2006, 65, 2–18. [Google Scholar] [CrossRef]
- Lal, R. Soil erosion and sediment transport research in tropical Africa. Hydrol. Sci. J. 1985, 30, 239–256. [Google Scholar] [CrossRef]
- de Jong, S.M. Applications of Reflective Remote Sensing for Land Degradation Studies in a Mediterranean Environment; The Royal Dutch Geographical Society: Utrecht, The Netherlands, 1994; p. 256. [Google Scholar]
- Eltringham, S.K. The frequency and extent of uncontrolled grass fires in the Rwenzori National Park, Uganda. Afr. J. Ecol. 1976, 14, 215–222. [Google Scholar] [CrossRef]
- Plumptre, A.J.; Kirunda, B.; Mugabe, H.; Stabach, J.; Driciru, M.; Picton-Phillipps, G.; Ayebare, S.; Nangendo, G.; Laporte, N. The Impact of Fire and Large Mammals on the Ecology of Queen Elizabeth National Park; Wildlife Conservation Society and Woods Hole Research Centre: New York, NY, USA, 2010. [Google Scholar]
- Petrides, G.A. Population densities and the range-carrying capacity for large mammals in Queen Elizabeth National Park, Uganda. Afr. Zool. 1965, 209–225. [Google Scholar] [CrossRef]
- Thornton, D.D. The effect of complete removal of hippopotamus on grassland in the Queen Elizabeth National Park, Uganda. Afr. J. Ecol. 1971, 9, 47–55. [Google Scholar] [CrossRef]
- Eltringham, S.K. The Hippos: Natural History and Conservation; Princeton University Press: Princeton, NJ, USA, 1999. [Google Scholar]
- Zhongming, W.; Lees, B.G.; Feng, J.; Wanning, L.; Haijing, S. Stratified vegetation cover index: A new way to assess vegetation impact on soil erosion. Catena 2010, 83, 87–93. [Google Scholar] [CrossRef]
- Gautam, H.; Arulmalar, E.; Kulkarni, M.R.; Vidya, T.N.C. NDVI is not reliable as a surrogate of forage abundance for a large herbivore in tropical forest habitat. Biotropica 2019, 51, 443–456. [Google Scholar] [CrossRef]
- Alexandridis, T.K.; Sotiropoulou, A.M.; Bilas, G.; Karapetsas, N.; Silleos, N.G. The Effects of Seasonality in Estimating the C-Factor of Soil Erosion Studies. Land Degrad. Dev. 2015, 26, 596–603. [Google Scholar] [CrossRef]
- Anache, J.A.A.; Bacchi, C.G.V.; Panachuki, E.; Sobrinho, T.A. Assessment of methods for predicting soil erodibility in soil loss modeling. Geociencias 2015, 34, 32–40. [Google Scholar]
- Song, Y.; Liu, L.; Yan, P.; Cao, T. A review of soil erodibility in water and wind erosion research. J. Geogr. Sci. 2005, 15, 167–176. [Google Scholar] [CrossRef]
- Bryan, R.B. Soil erodibility and processes of water erosion on hillslope. Geomorphology 2000, 32, 385–415. [Google Scholar] [CrossRef]
- McCool, D.; Brown, L.; Foster, G.; Mutchler, C.; Meyer, L. Revised slope steepness factor for the Universal Soil Loss Equation. Trans. ASAE 1987, 30, 1387–1396. [Google Scholar] [CrossRef]
- Kizito, Y.S.; Nauwerck, A. Temporal and vertical distribution of planktonic rotifers in a meromictic crater lake, Lake Nyahirya (Western Uganda). Hydrobiologia 1995, 313, 303–312. [Google Scholar] [CrossRef]
- Makenzi, P.M. The Biosphere Reserve Concept as a Tool for Sustainable Natural Resource Management in the Eastern Africa Region. In AfriMAB: Biosphere Reserves in Sub-Saharan Africa; Showcasing Sustainable Development; Pool-Stanvliet, R., Clüsener-Godt, M., Eds.; Department of Environmental Affairs and UNESCO: Paris, France, 2013. [Google Scholar]
- Gelorini, V.; Verbeken, A.; Lens, L.; Eggermont, H.; Odgaard, B.V.; Verschuren, D. Effects of land use on the fungal spore richness in small crater-lake basins of western Uganda. Fungal Divers. 2012, 55, 125–142. [Google Scholar] [CrossRef]
- Ssemmanda, I.; Ryves, D.B.; Bennike, O.; Appleby, P.G. Vegetation history in western Uganda during the last 1200 years: A sedimentbased reconstruction from two crater lakes. Holocene 2005, 15, 119–132. [Google Scholar] [CrossRef]
- Sutton, J.E.G. Ntusi and Bigo: Farmers, cattle-herders and rulers in western Uganda, AD 1000–1500. Azania Archaeol. Res. Afr. 1998, 33, 39–72. [Google Scholar] [CrossRef]
- Taylor, D.; Robertshaw, P.; Marchant, R.A. Environmental change and political-economic upheaval in precolonial western Uganda. Holocene 2000, 10, 527–536. [Google Scholar] [CrossRef]
- Colombaroli, D.; Ssemmanda, I.; Gelorini, V.; Verschuren, D. Contrasting long-term records of biomass burning in wet and dry savannas of equatorial East Africa. Glob. Chang. Biol. 2014, 20, 2903–2914. [Google Scholar] [CrossRef] [PubMed]
- Gelorini, V.; Verschuren, D. Historical climate-human-ecosystem interaction in East Africa: A review. Afr. J. Ecol. 2012, 51, 409–421. [Google Scholar] [CrossRef]
- Mills, K.; Ryves, D.B.; Anderson, N.J.; Bryant, C.L.; Tyler, J.J. Expressions of climate perturbations in western Ugandan crater lake sediment records during the last 1000 years. Clim. Past 2014, 10, 1581–1601. [Google Scholar] [CrossRef]
- Goethals, L.; Verschuren, D. Tracing ancient animal husbandry in tropical Africa using the fossil spore assemblages of coprophilous fungi: A validation study in western Uganda. Veg. Hist. Archaeobotany 2020, 29, 509–526. [Google Scholar] [CrossRef]
- Mwanjalolo, M.G.J.; Bernard, B.; Paul, M.I.; Joshua, W.; Sophie, K.; Cotilda, N.; Bob, N.; John, D.; Edward, S.; Barbara, N. Assessing the Extent of Historical, Current, and Future Land Use Systems in Uganda. Land 2018, 7, 132. [Google Scholar] [CrossRef]
- Obua, J.; Agea, J.G.; Ogwal, J.J. Status of forests in Uganda. Afr. J. Ecol. 2010, 48, 853–859. [Google Scholar] [CrossRef]
- Banana, A.Y.; Byakagaba, P.; Russell, A.J.M.; Waiswa, D.; Bomuhangi, A. A Review of Uganda’s National Policies Relevant to Climate Change Adaptation and Mitigation: Insights from Mount Elgon; 602150447X; Center for International Forestry Research: Bogor, Indonesia, 2014. [Google Scholar]
- Chenery, E.M. An Introduction to the Soils of the Uganda Protectorate; Department of Agriculture: Entebbe, Uganda, 1960. [Google Scholar]
- Pender, J.; Jagger, P.; Nkonya, E.; Sserunkuuma, D. Development Pathways and Land Management in Uganda. World Dev. 2004, 32, 767–792. [Google Scholar] [CrossRef]
- Bagoora, F.D.K. Soil Erosion and Mass Wasting Risk in the Highland Area of Uganda. Mt. Res. Dev. 1988, 8, 173–182. [Google Scholar] [CrossRef]
- Pender, J.; Nkonya, E.; Jagger, P.; Sserunkuuma, D.; Ssali, H. Strategies to increase agricultural productivity and reduce land degradation: Evidence from Uganda. Agric. Econ. 2004, 31, 181–195. [Google Scholar] [CrossRef]
- Efitre, J. Life History Variation in Tilapia Populations within the Crater Lakes of Western Uganda: The Role of Size-Selective Predation. Ph.D. Thesis, University of Florida, Gainesville, FL, USA, 2007. [Google Scholar]
- Lufafa, A.; Tenywa, M.M.; Isabirye, M.; Majaliwa, M.J.G.; Woomer, P.L. Prediction of soil erosion in a Lake Victoria basin catchment using a GIS-based Universal Soil Loss model. Agric. Syst. 2003, 76, 883–894. [Google Scholar] [CrossRef]
- Morgan, R.P.C. Soil Erosion and Conservation; John Wiley & Sons: Hoboken, NJ, USA, 2009. [Google Scholar]
- Bamutaze, Y. Revisiting socio-ecological resilience and sustainability in the coupled mountain landscapes in Eastern Africa. Curr. Opin. Environ. Sustain. 2015, 14, 257–265. [Google Scholar] [CrossRef]
Disclaimer/Publisher’s Note: The statements, opinions and data contained in all publications are solely those of the individual author(s) and contributor(s) and not of MDPI and/or the editor(s). MDPI and/or the editor(s) disclaim responsibility for any injury to people or property resulting from any ideas, methods, instructions or products referred to in the content. |
© 2023 by the authors. Licensee MDPI, Basel, Switzerland. This article is an open access article distributed under the terms and conditions of the Creative Commons Attribution (CC BY) license (https://creativecommons.org/licenses/by/4.0/).