Spatial Structure and Evolution of Territorial Function of Rural Areas at Cultural Heritage Sites from the Perspective of Social Space
Abstract
1. Introduction
2. Materials and Methods
2.1. Study Area
2.2. Methods
2.2.1. Factor Analysis
2.2.2. Social–Spatial Differentiation Indices
2.2.3. Spatial Statistical Analysis and Spatial Dialectical Analysis
2.3. Data Source and Processing
3. Result
3.1. Spatial Distribution and Evolution of Principal Components of TFRA
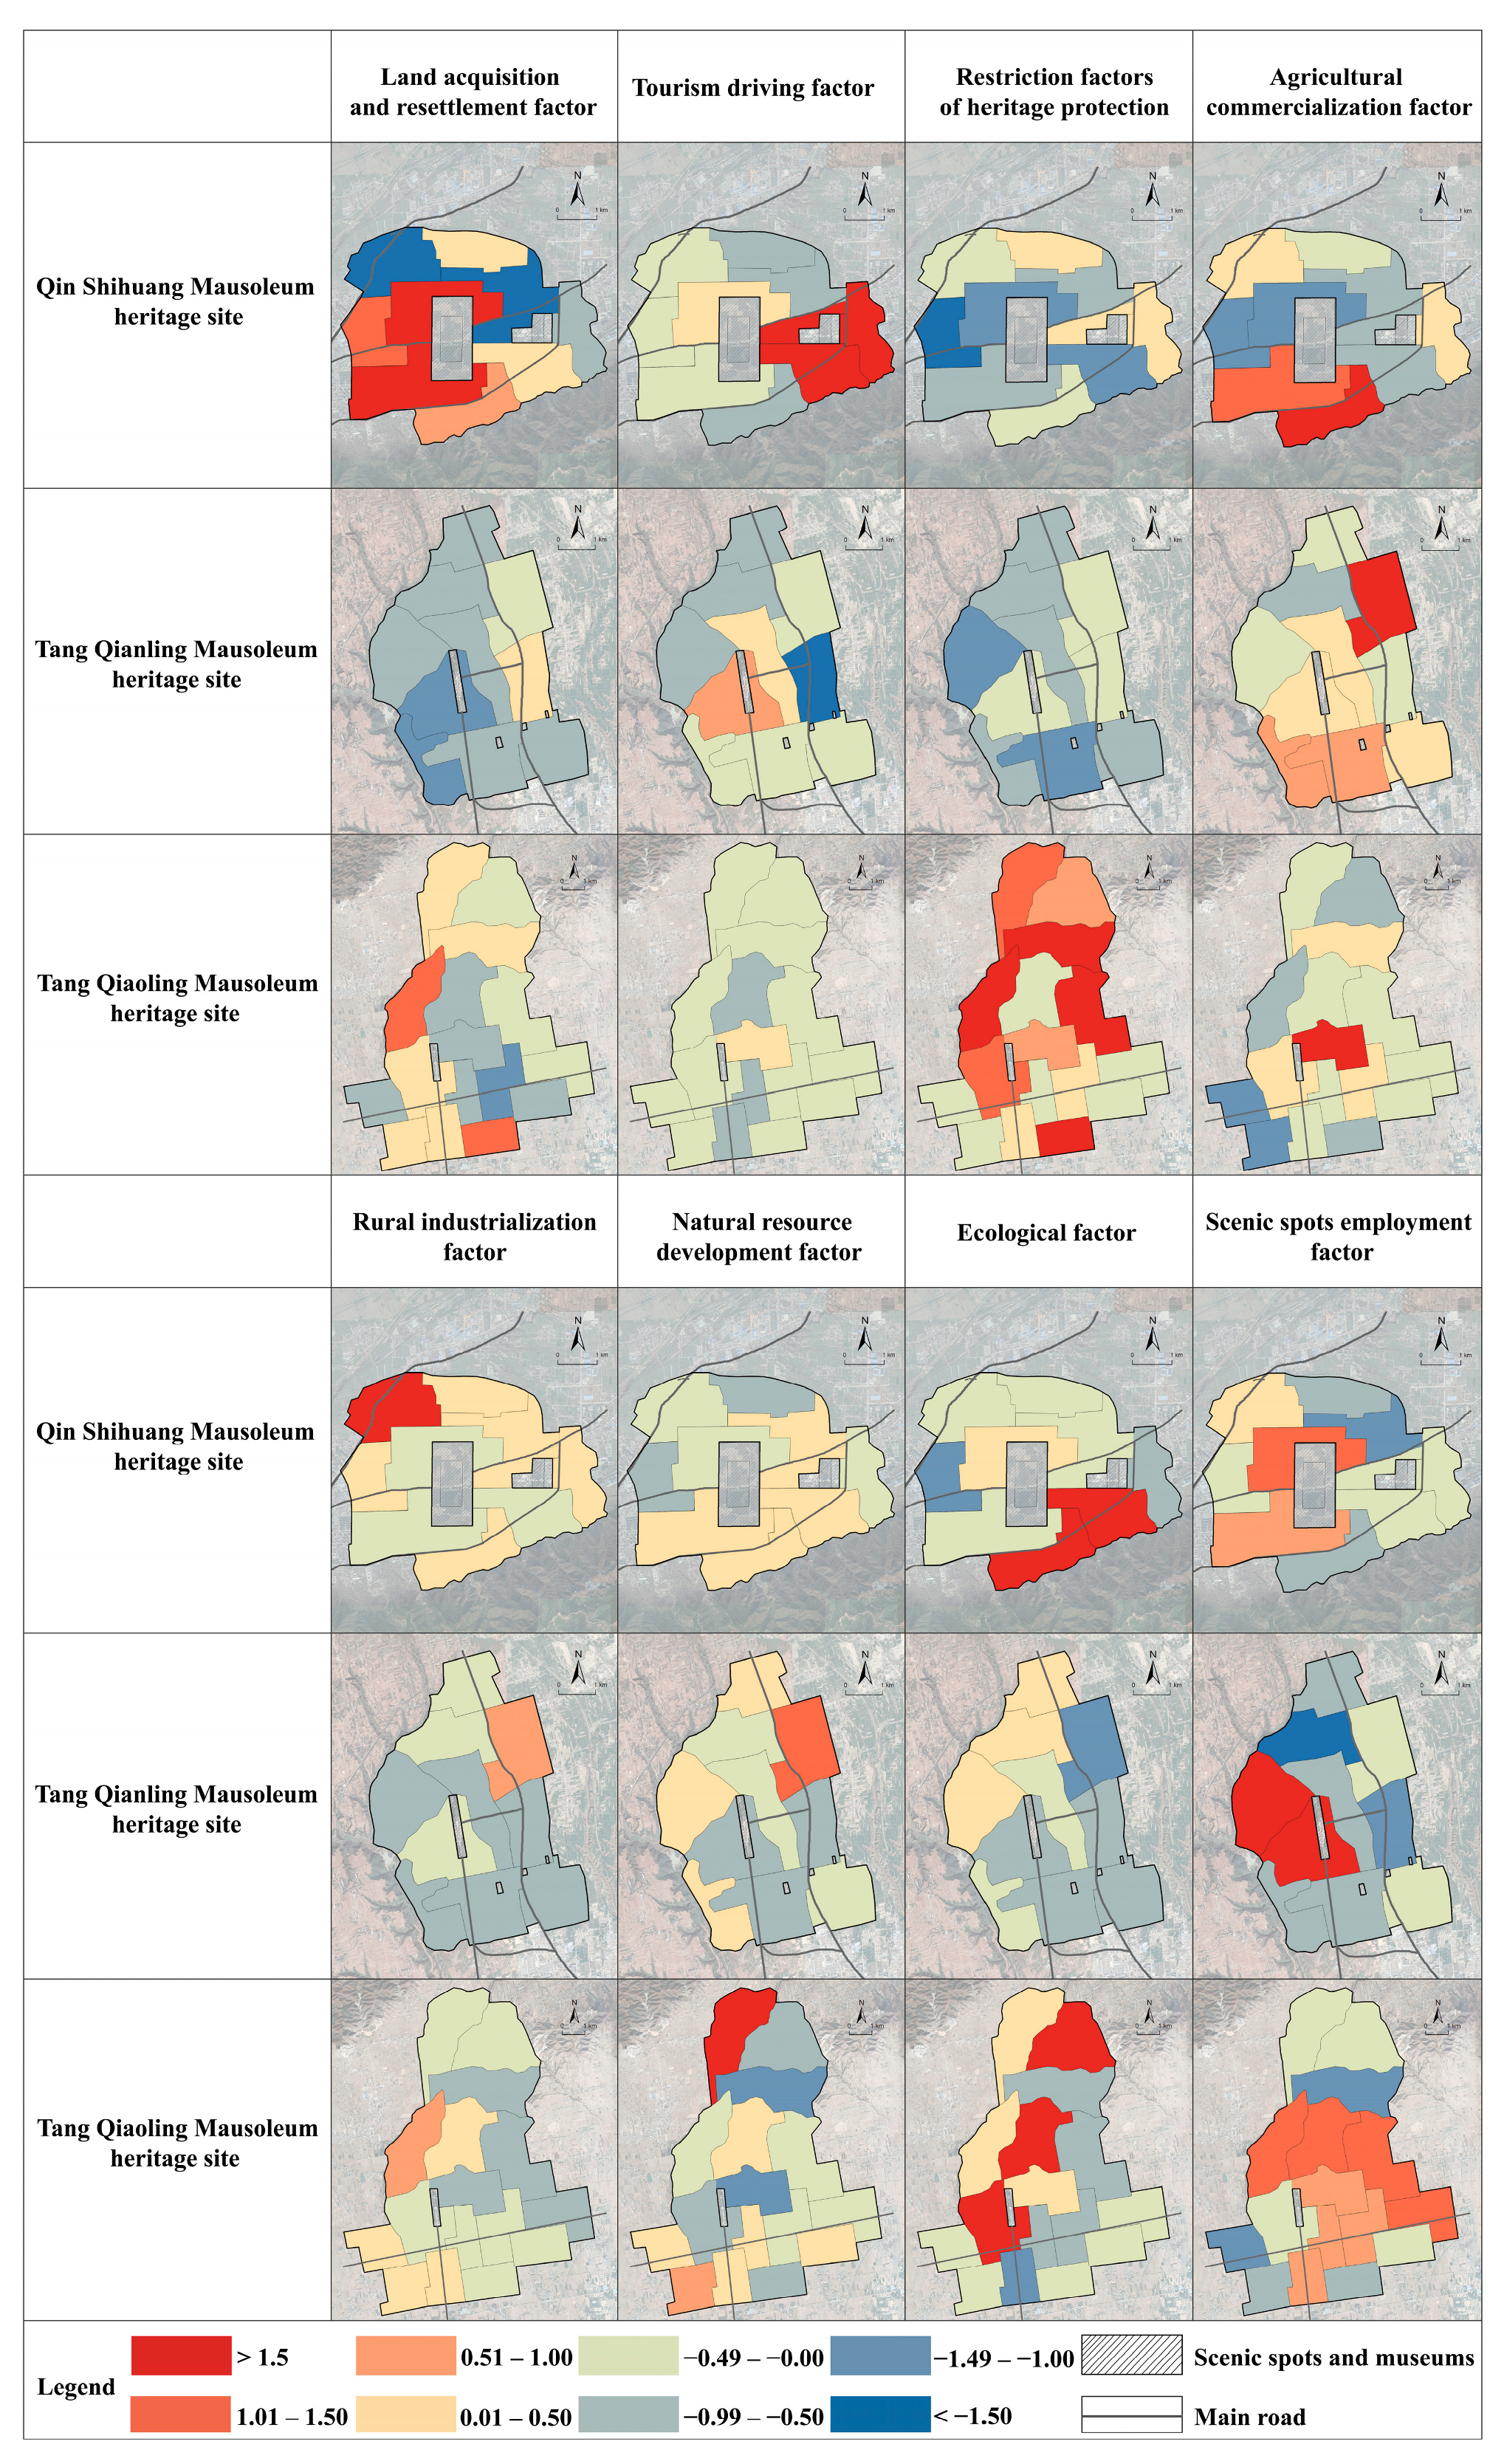
3.1.1. Spatial Characteristics of Principal Components of TFRA in 2020
- (1)
- Principal components of TFRA at heritage sites
- (2)
- Spatial distribution of principal components scores
- (I)
- The land acquisition and resettlement factor. This principal component reflects the impact of land acquisition and resettlement on rural development. In the spatial dimension, the area of requisitioned land is large (0.736), and the per capita cultivated land area is limited (−0.478). The housing conditions of the villagers are at a relatively better level, and most households are two-story buildings (0.547) with a concrete structure (0.842). In the social dimension, the registered residence population (0.833) is larger than the migrant population. In order to obtain more resettlement compensation, household divisions are common, so the number of households is large (0.925), and the per-household population is small (−0.572). On the one hand, the villages with a high score for this principal component are mostly distributed around scenic spots and museums. On the other hand, affected by urbanization, they are mostly distributed on the edges of the heritage sites.
- (II)
- The tourism driving factor. This principal component reflects the driving effect of tourism utilization on heritage villages. In the spatial dimension, although the per capita cultivated land area is limited (−0.482), there are a large number of collective service enterprises (0.937) and individual tourism enterprises (0.901). The degree of space capitalization is high, most of the households are two-story buildings (0.513), and the number of village parking lots is also large (0.808). In the social dimension, the number of migrant populations in the villages is large (0.917). The villagers are mostly engaged in agritainment (0.924), commodity sales (0.808), handicraft production (0.945), stall sales (0.833), tour guide or driving (0.596), and other livelihood activities. In terms of spatial distribution, villages with a high score for this principal component are mostly located around scenic spots and museums.
- (III)
- The restriction factor of heritage protection. This principal component reflects the restrictions and impacts of cultural heritage protection on the way of life and production in the surrounding villages. In the spatial dimension, there are a number of limitations on agricultural production, and the planting area of grain crops (0.750) is larger than that of cash crops. The housing conditions of the residents are relatively low, and most of the households are bungalows (0.616) with brick structures (0.486). In the social dimension, the working-age population is large, but the proportion of poor households is high (0.758). Most residents go out to work for employment (0.582). In terms of spatial distribution, villages with a high score for this principal component are mostly located in protected areas and far away from scenic spots and major traffic lines.
- (IV)
- The agricultural commercialization factor. This principal component reflects the level of agricultural commercialization, which means the formation of an agricultural–industrial chain relying on agricultural production, agricultural product processing, packaging, and delivery. In the spatial dimension, there are a large number of agricultural product processing enterprises (0.713) and logistics enterprises (0.508) in the villages. In the social dimension, the proportion of the population engaged in the transportation and logistics industry is relatively high (0.485). Villages with a high score for this principal component are mostly distributed around the main traffic lines at heritage sites.
- (V)
- The rural industrialization factor. This principal component reflects the development level of rural industrialization. In the spatial dimension, there are a large number of collective industrial enterprises (0.931) and individual manufacturing industries (0.675). In the social dimension, the proportion of villagers engaged in the logistics industry is high (0.648). Villages with a high score for this principal component are mostly located at the edges of heritage sites and close to the traffic trunk roads in these areas.
- (VI)
- The natural resource development factor. This principal component reflects the dependence of rural industries on natural resources. Rural enterprises cover a large area (0.715), and most of them are mining enterprises (0.867). Villages with a high score for this principal component are distributed around mountains in which the tombs of emperors are placed.
- (VII)
- The ecological factor. This principal component reflects the ecological conditions and afforestation status. There are large areas of forest land (0.876) and wasteland (0.635). Villages with a high score for this principal component are mainly distributed in areas with obvious topographic relief, and they have superior ecological resource conditions or large-scale afforestation due to cultural heritage protection.
- (VIII)
- The scenic spot employment factor. This principal component reflects the large number of villagers employed in scenic spots, including security staff, support staff, builders, and gardeners. Villages with a high score for this principal component are located around museums, heritage parks, and other scenic spots, but they are not close to their entrances or exits.
3.1.2. Evolution Characteristics of Principal Components of TFRA from 2010 to 2020
- (1)
- Evolution characteristics of principal components
- (2)
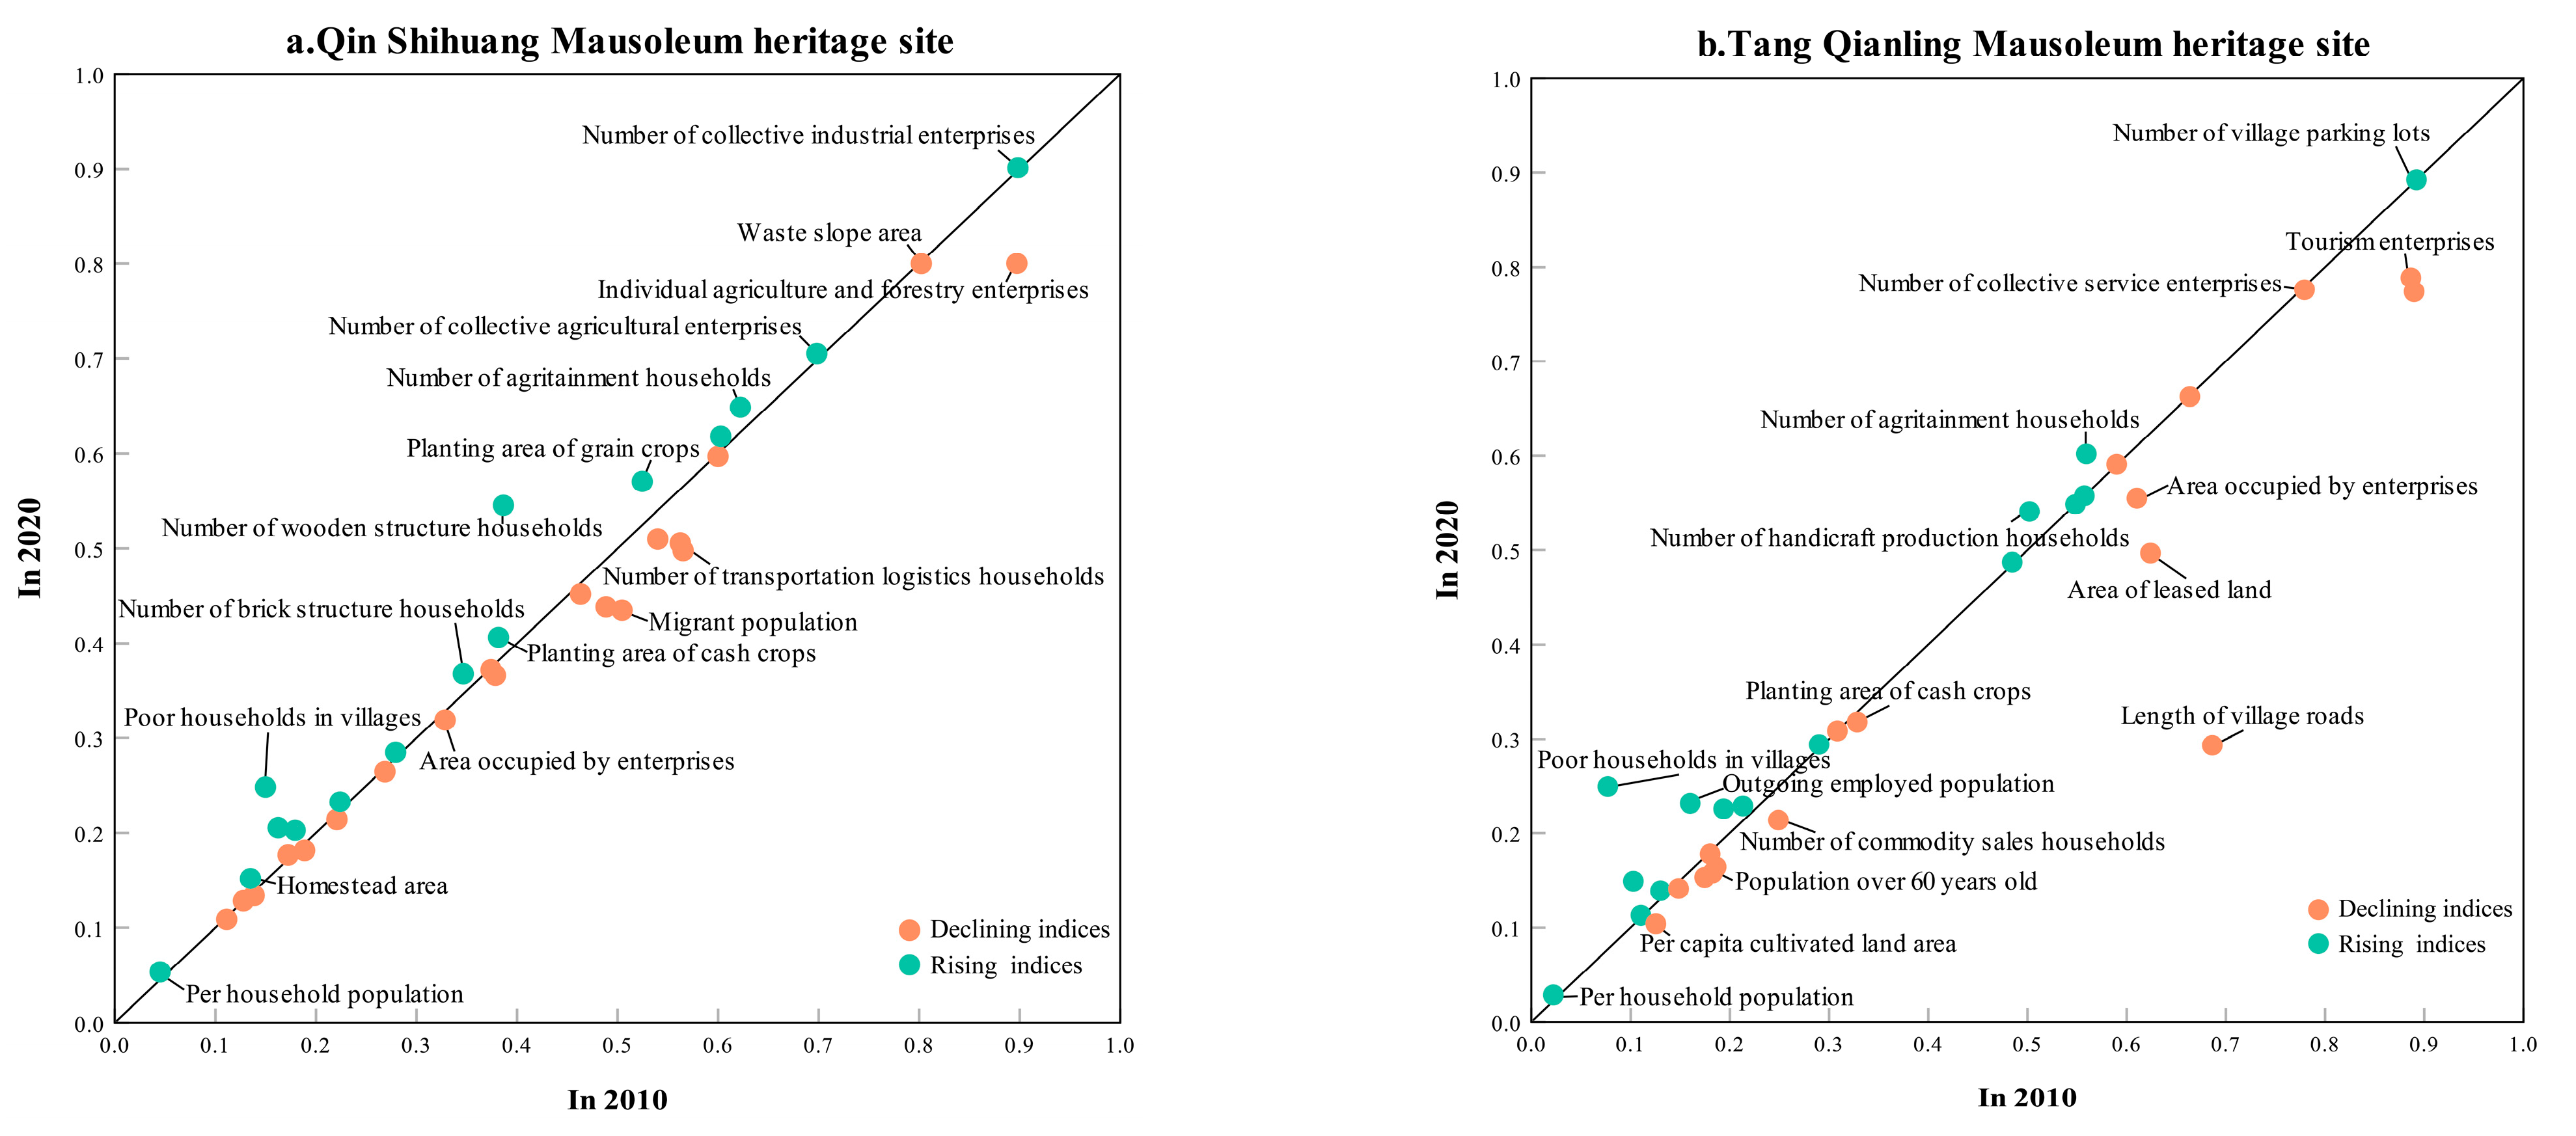
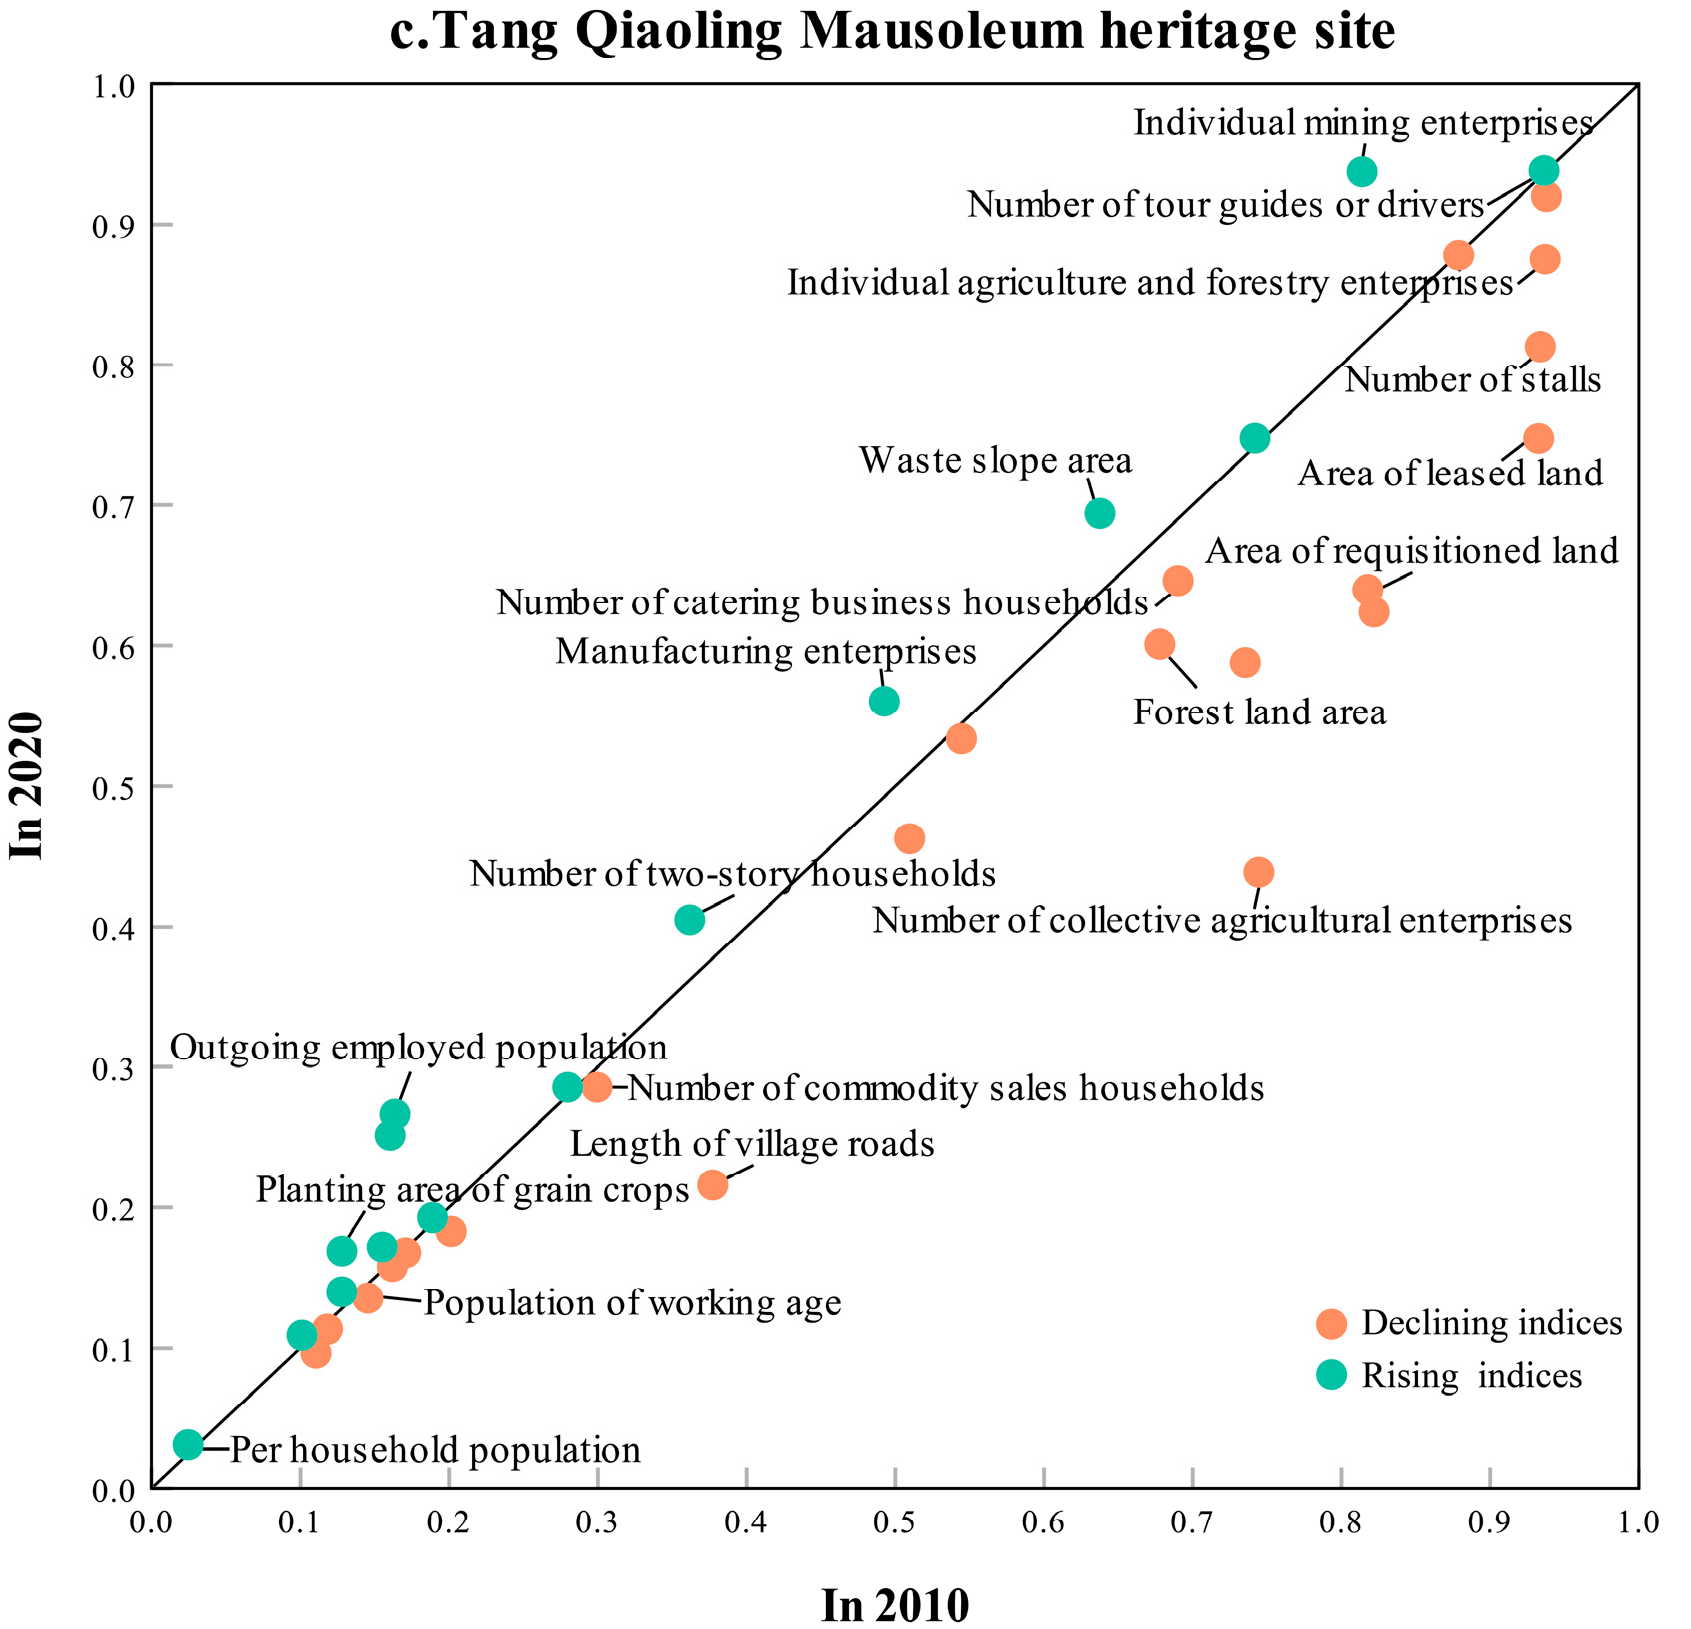
- Evolution of social–spatial differentiation indices
3.2. Spatial Structure and Evolution of TFRA at Cultural Heritage Sites
3.2.1. Spatial Structure Characteristics of TFRA in 2020
3.2.2. Evolution of TFRA from 2010 to 2020
- (1)
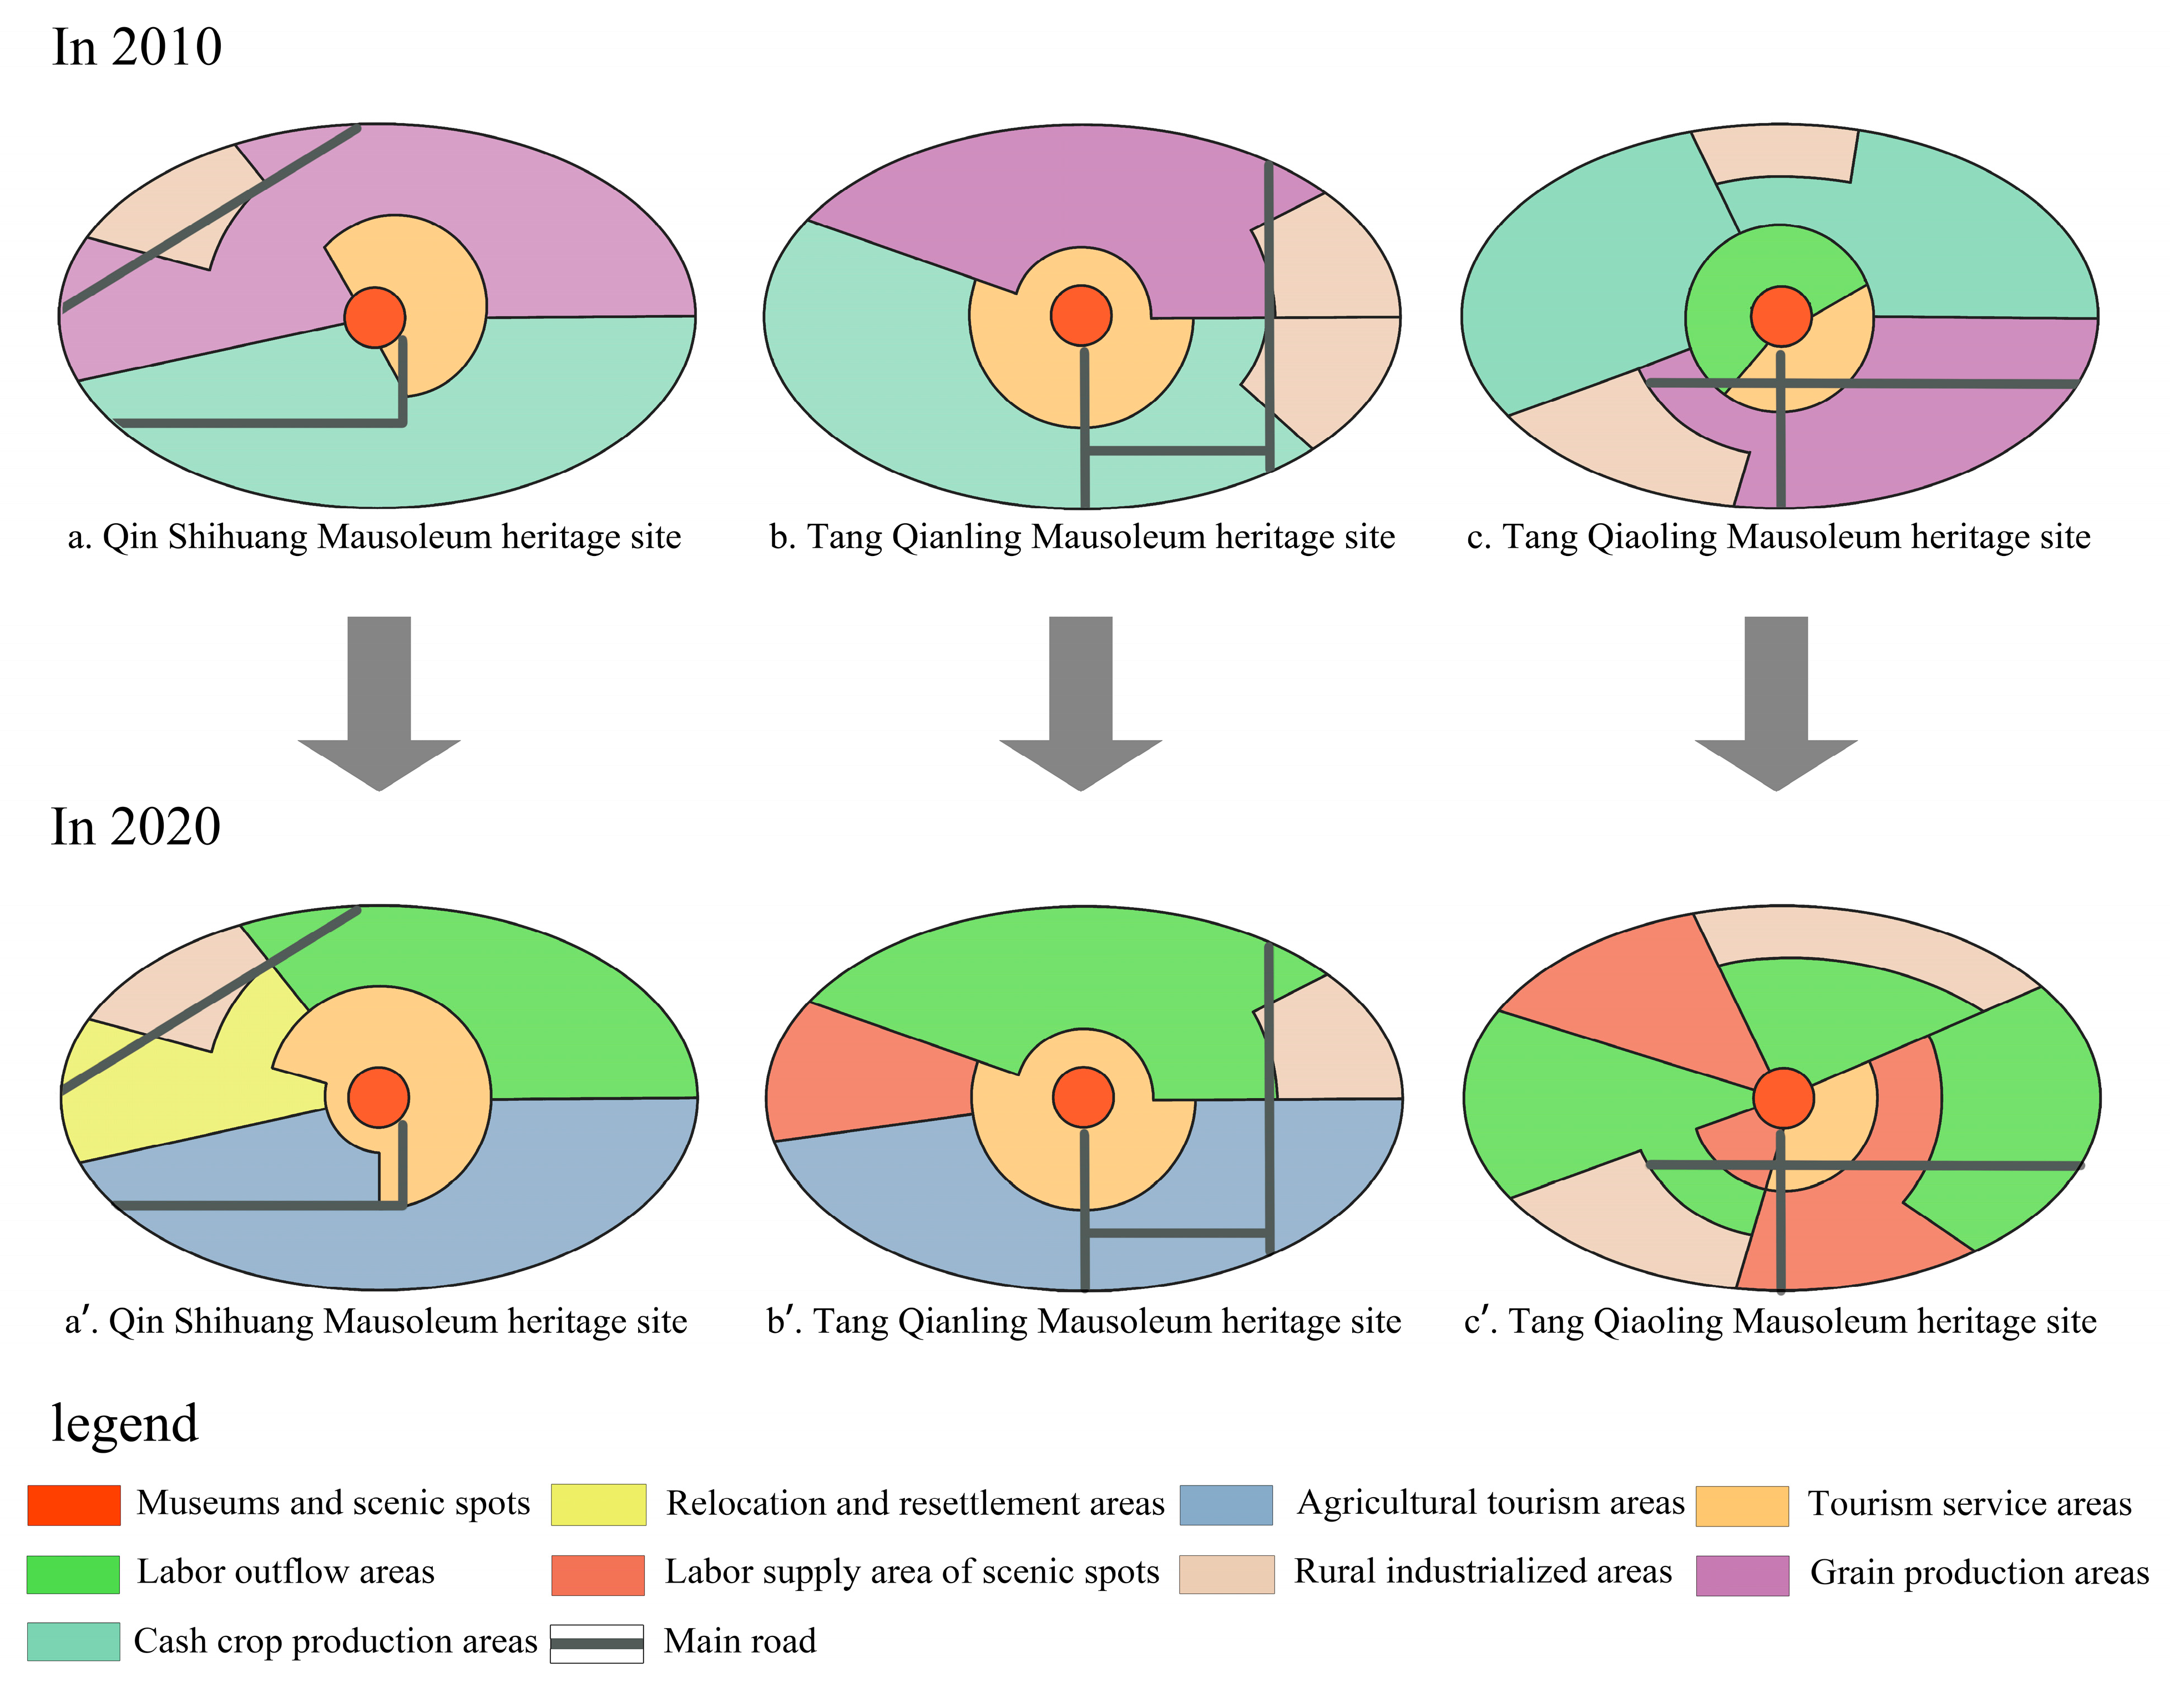
- The scales of tourism service areas and labor supply areas of scenic spots have gradually expanded since 2010 because of the development of heritage tourism. These two types of functional areas were distributed around scenic areas or museums in 2010, and since then, they have gradually formed an enclosure around scenic areas.
- (2)
- Cash crop production areas have evolved into agricultural tourism areas. This transformation is related to both the development of tourism and the construction of tourist roads. The leading industries in these villages gradually developed from cash crop cultivation to agricultural sightseeing, planting, logistics, packaging, and processing, which form a complete industrial chain.
- (3)
- Grain production areas have evolved into labor supply areas of scenic spots and labor outflow areas. The livelihood mode of residents has shifted from grain cultivation to employment in scenic areas or in the city. On the one hand, due to the “scissors gap” in the income between grain production and migrant workers, coupled with the restrictions on heritage protection, agricultural production is low, and residents choose to work outside in pursuit of a higher income. On the other hand, China’s large-scale urbanization and construction of scenic spots demand a large amount of rural surplus labor.
- (4)
- The scale of rural industrialized areas has decreased since 2010. Under the influence of the government’s heritage protection and environmental protection policies, the cement factories, lime factories, and brick factories in and around the heritage sites have been closed down, and the development of industrial production has stagnated.
- (5)
- Relocation and resettlement areas have been embedded in the heritage sites. The construction activities of scenic spots involved large-scale land acquisition, relocation, and resettlement, and a large number of resettlement houses for villagers have also been constructed during this period. This process is the impact of government power intervention on TFRA.
4. Discussion
4.1. Spatial Structure of TFRA at Heritage Sites
4.2. Traffic Routes and Value Spillover Effect at Heritage Sites
4.3. The Driving Role of Capital Proliferation in the Evolution of TFRA
- (1)
- Capital investment in the production of consumer goods. The productive input of capital into consumer goods, such as agricultural production, industrial production, tourism souvenir production, and heritage protection policies, and the optimal allocation choice of capital led to changes in the production modes of villages and their spatial differentiation. Since then, due to homogeneous competition and the overproduction of consumer goods, capital has begun to be invested in space construction to resolve the crisis of overproduction and to provide convenience for production and consumption.
- (2)
- Capital investment in spatial construction. In this round of the capital cycle, some villages built roads, warehouses, and factories to attract investment from fruit wholesalers, agricultural processing plants, and packaging plants in order to absorb excess agricultural production, thereby forming an agricultural–industrial chain. Some villages carried out rural residential renovation, landscaping, parking lot construction, stall construction, and market construction to facilitate catering operations and souvenir sales. The essence of this process is to maximize benefits and the investment of capital into space construction, and it embodies the characteristics of spatial capitalization.
- (3)
- Capital investment in social and cultural fields. The capital was invested in cultural services, productive services, and living services to resolve the crisis caused by spatial overproduction. For the purpose of cultural and environmental protection, some industrial enterprises stopped production, resulting in the contraction of rural industrialized areas. The development of the tourism industry requires higher standards for cultural activities and tourism experiences. The management rights of scenic spots were transferred from private to state-owned, and the standardized operation and construction of scenic spots required more labor, resulting in an increase in the scope of labor supply areas.
4.4. Coordination of Social and Spatial Development at Heritage Sites
5. Conclusions
- (1)
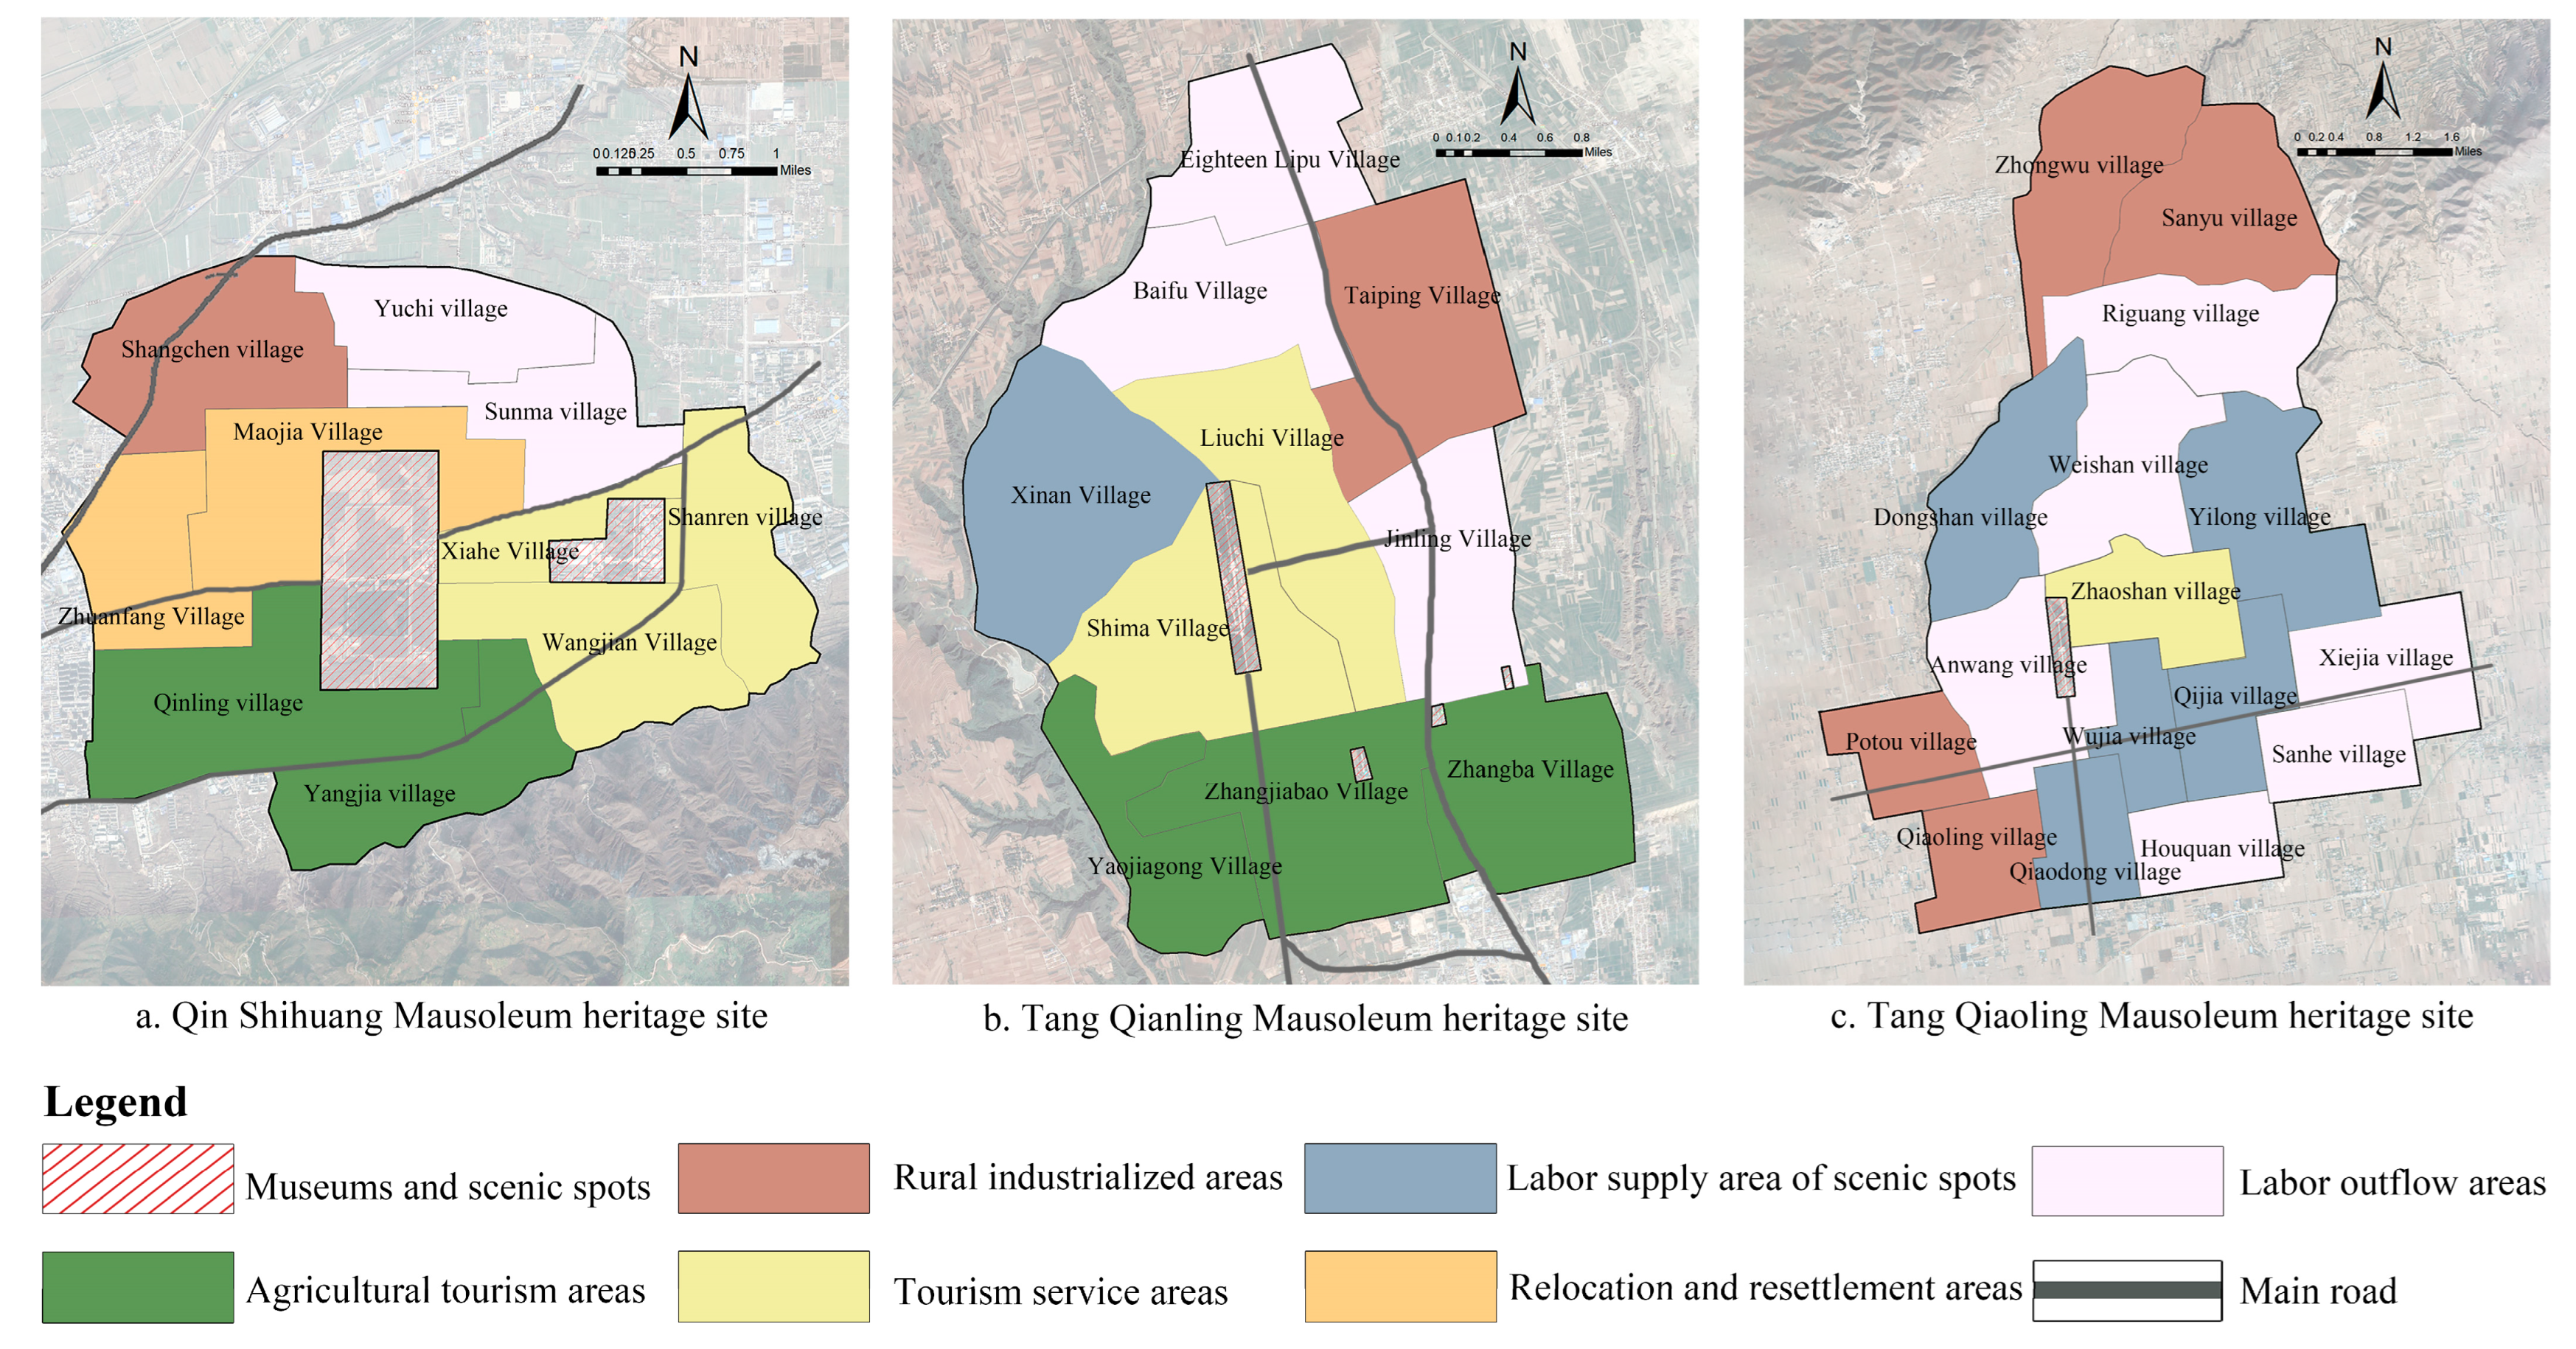
- Through a comprehensive analysis of society and space, it was found that the rural areas of heritage sites have obvious spatial differentiation characteristics and present six major functional areas. Due to the development of the tourism industry and the expansion of scenic spots, the scales of tourism service areas and labor supply areas increased. The cash crop production areas evolved into agricultural tourism areas. This transformation is related to both the development of tourism and the construction of tourist roads. The scale of rural industrialized areas was reduced because of heritage protection policies.
- (2)
- The social–spatial differentiation indices related to tourism and agricultural industrialization decreased over the past decade. This phenomenon indicates that heritage display and utilization drove the development of the tourism industry in a large region, so the regional balance of tourism development improved. The spatial differentiation indices concerning poor rural households, areas of food crops, etc., increased, which indicates that the gap between the rich and the poor is gradually increasing.
- (3)
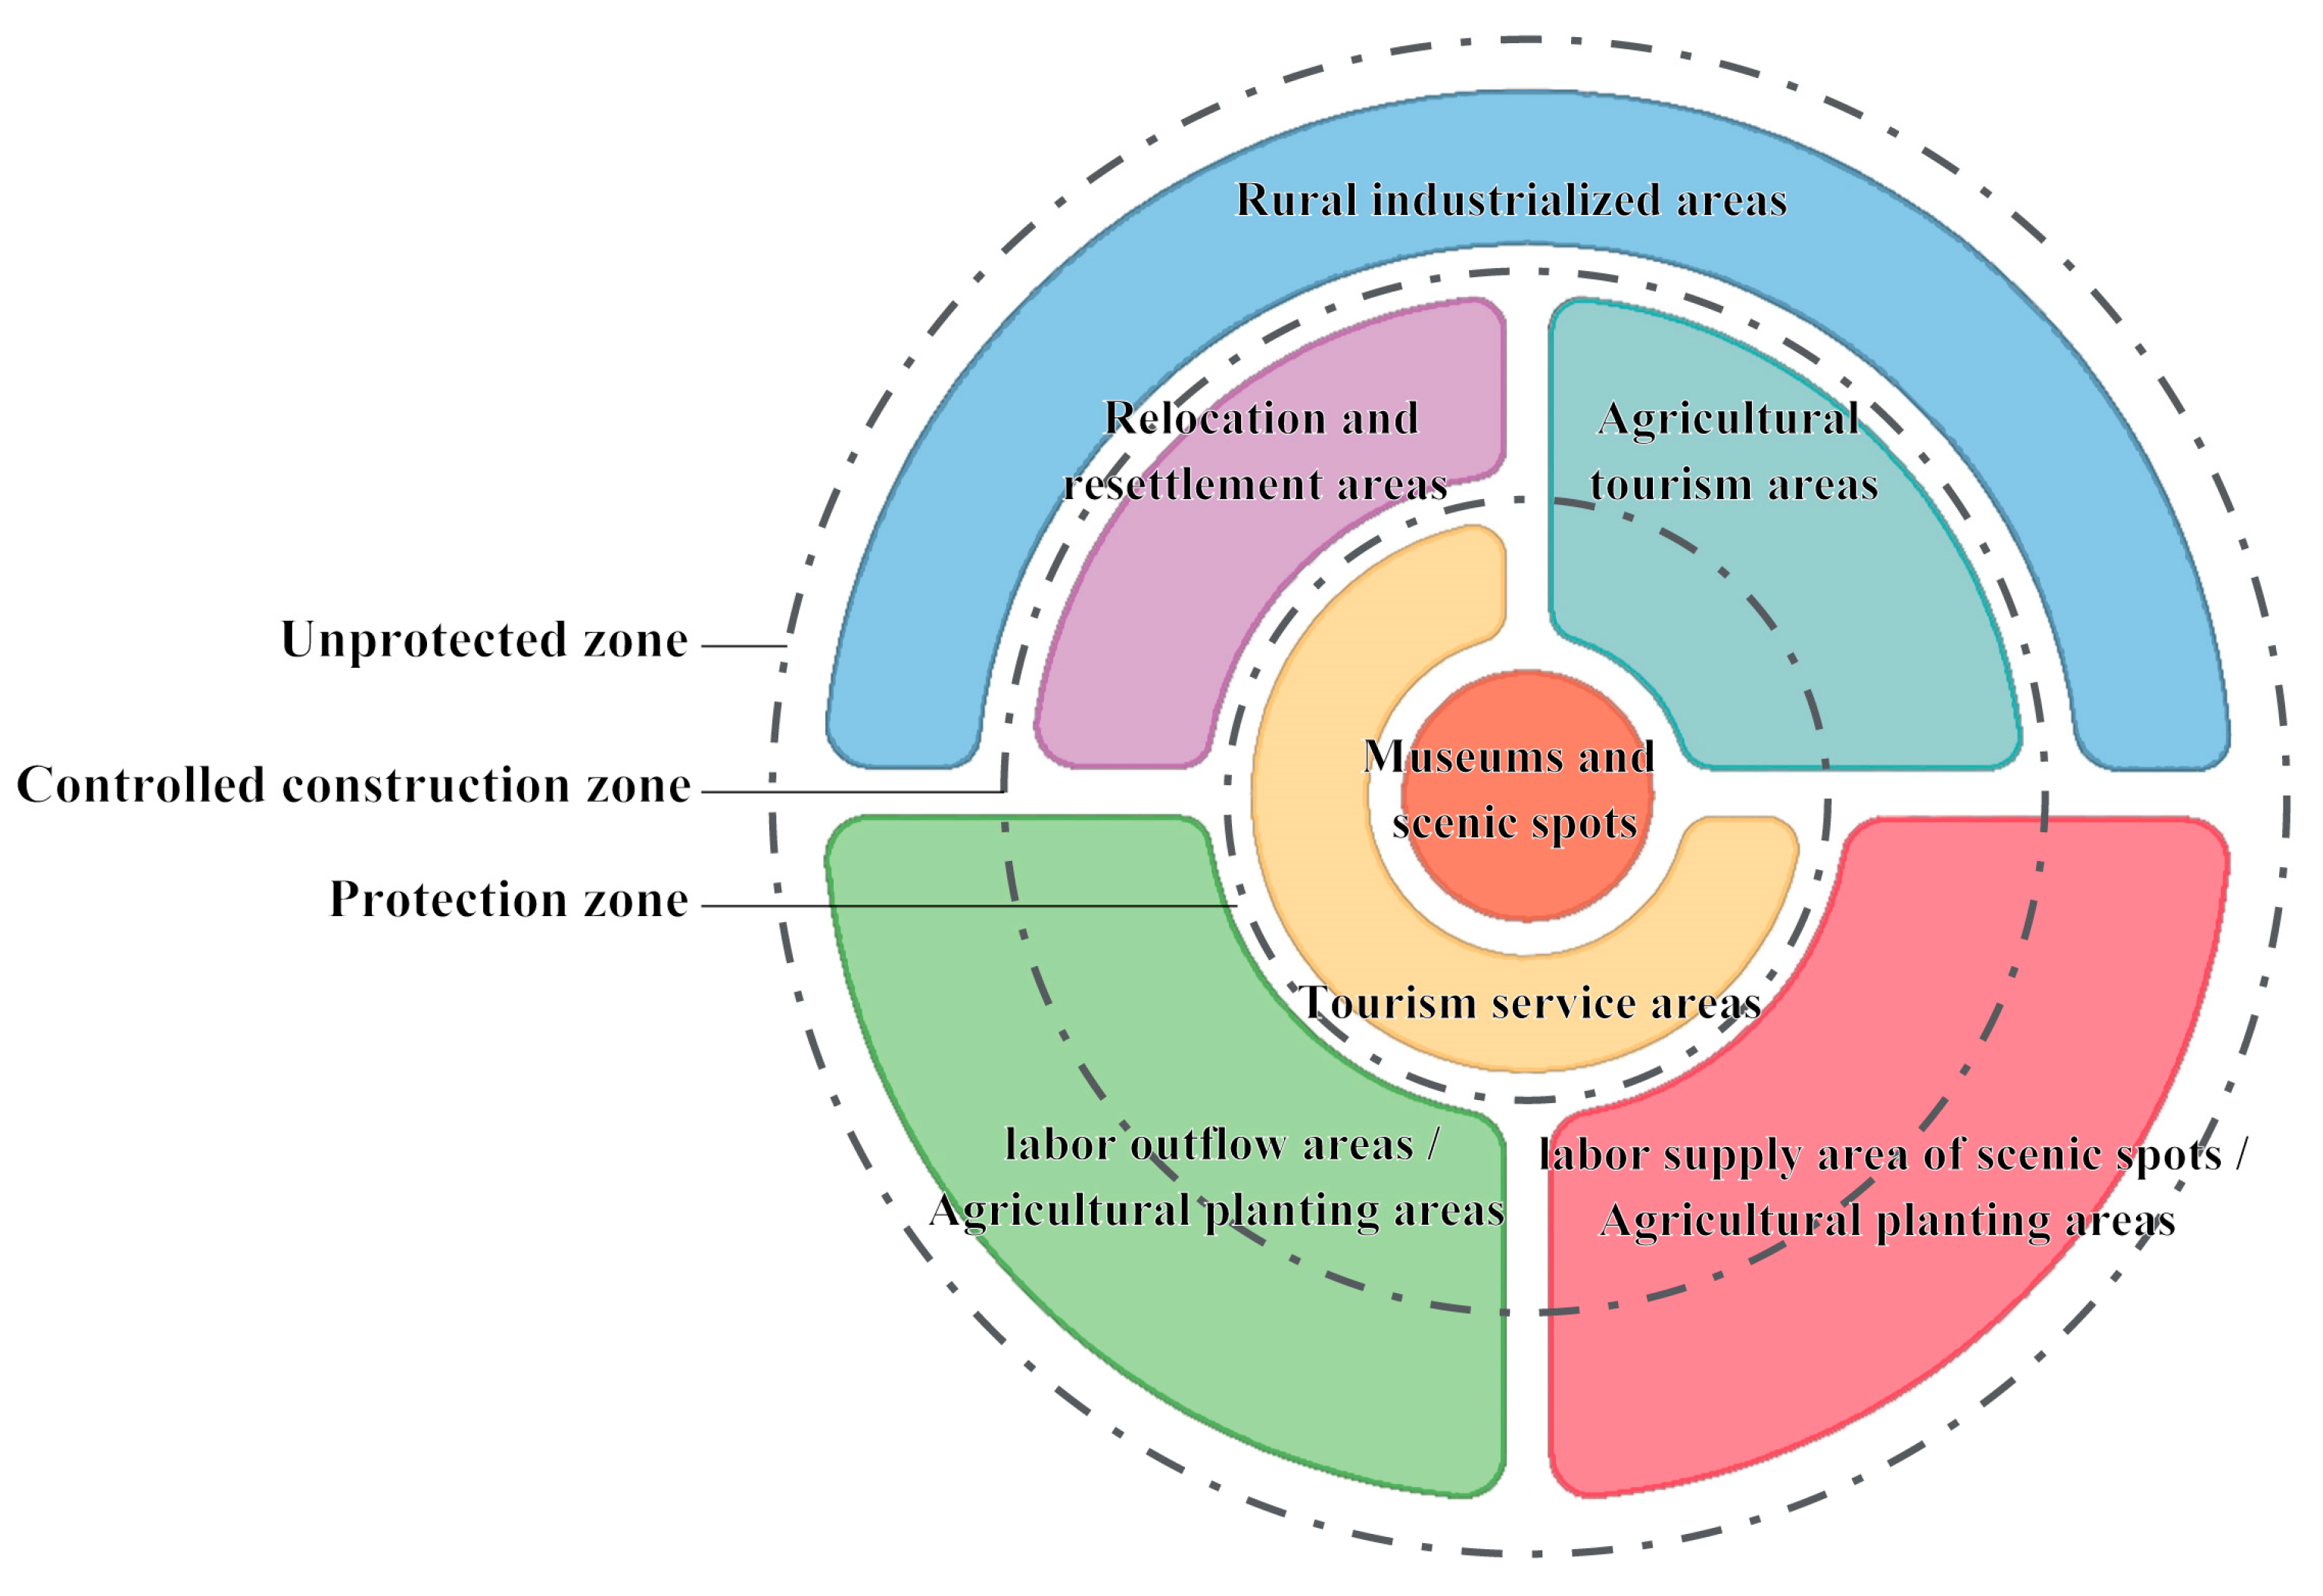
- The TFRA at heritage sites presents the spatial characteristic of a concentric circle because of the circular gradient control of heritage protection zoning. The protection zone, the controlled construction zone, and the environmental coordination zone, which are designated from the inside out, gradually slowed down the control intensity of industrial and agricultural production activities. Thus, the functional structure formed a concentric circle pattern of “service industry–surplus labor supply (agriculture)–rural industry” from the inside to the outside.
- (4)
- The high-value-added functional space of heritage sites is distributed along the transportation line, forming a concentric circle fan-shaped regional functional pattern. The value spillovers generated by tourism use radiate outward through transportation lines, thereby driving the development and transformation of villages along the line. The tourism service area, the tourism agriculture area, and the villages in rural industrialized areas are mostly located around the tourist roads connected to scenic spots.
- (5)
- The inherent demand for capital proliferation is the fundamental driving force for the differentiation and evolution of TFRA at heritage sites. The selection of the optimal investment allocation of capital under the heritage protection system led to regional functional differentiation. The evolution of TFRA can be seen as being the result of the flow and transformation of production factors, such as capital and labor. The phased investment of capital into consumer goods production, spatial construction, and cultural service industries led to the evolution of regional functions.
Author Contributions
Funding
Institutional Review Board Statement
Informed Consent Statement
Data Availability Statement
Conflicts of Interest
References
- People's Daily (Overseas Edition). Available online: http://paper.people.com.cn/rmrbhwb/html/2019-06/06/content_1928991.htm (accessed on 6 June 2019).
- Alazaizeha, M.M.; Hallo, J.C.; Backman, S.J.; Norman, W.C.; Vogel, M.A. Value orientations and heritage tourism management at Petra archaeological park, Jordan. Tour. Manag. 2016, 57, 149–158. [Google Scholar] [CrossRef]
- Tang, C.; Zheng, Q.; Ng, P. A study on the coordinative green development of tourist experience and commercialization of tourism at cultural heritage sites. Sustainability 2019, 11, 4732. [Google Scholar] [CrossRef]
- Vecco, M. A definition of cultural heritage: From the tangible to the intangible. J. Cult. Herit. 2010, 11, 321–324. [Google Scholar] [CrossRef]
- Wu, C.; Zhu, H.X.; Peng, B.W. Rural social space production mechanism in a Great Relics Area from the perspective of capital circulation theory of Harvey: A case of Qin Shihuang Mausoleum. Prog. Geogr. 2020, 39, 751–765. (In Chinese) [Google Scholar] [CrossRef]
- Liu, Y.L.; Wang, Y.; Dupre, K.; McIlwaine, C. The impacts of world cultural heritage site designation and heritage tourism on community livelihoods: A Chinese case study. Tour. Manag. Perspect. 2022, 43, 100994. [Google Scholar] [CrossRef]
- Hosseini, K.; Stefaniec, A.; Hosseini, S. World Heritage Sites in developing countries: Assessing impacts and handling complexities toward sustainable tourism. J. Destin. Mark. Manag. 2022, 20, 100616. [Google Scholar] [CrossRef]
- Fei, G.Y.; Xiong, K.N.; Fei, G.H.; Zhang, H.P.; Zhang, S.R. The conservation and tourism development of World Natural Heritage sites: The current situation and future prospects of research. J. Nat. Conserv. 2023, 72, 126347. [Google Scholar] [CrossRef]
- Banerjee, R.; Srivastava, P.K. Reconstruction of contested landscape: Detecting land cover transformation hosting cultural heritage sites from Central India using remote sensing. Land Use Policy 2013, 34, 193–203. [Google Scholar] [CrossRef]
- Saha, A.; Pal, S.C.; Santosh, M.; Janizadeh, S.; Chowdhuri, I.; Norouzi, A.; Roy, P.; Chakrabortty, R. Modelling multi-hazard threats to cultural heritage sites and environmental sustainability: The present and future scenarios. J. Clean. Prod. 2021, 320, 128713. [Google Scholar] [CrossRef]
- Nicu, I.C.; Stoleriu, C.C. Land use changes and dynamics over the last century around churches of Moldavia, Bukovina, Northern Romania–Challenges and future perspectives. Habitat Int. 2019, 88, 101979. [Google Scholar] [CrossRef]
- Agapiou, A.; Lysandrou, V.; Alexakis, D.D.; Themistocleous, K.; Cuca, B.; Argyriou, A. Cultural heritage management and monitoring using remote sensing data and GIS: The case study of Paphos area, Cyprus. Comput. Environ. Urban Syst. 2015, 54, 230–239. [Google Scholar] [CrossRef]
- Zuo, D.; Li, C.; Lin, M.; Chen, P.; Kong, X. Tourism, residents agent practice and traditional residential landscapes at a cultural heritage site: The case study of Hongcun village, China. Sustainability 2022, 14, 4423. [Google Scholar] [CrossRef]
- Kovacs, J.F.; Galvin, K.J.; Shipley, R. Assessing the success of Heritage Conservation Districts: Insights from Ontario, Canada. Cities 2015, 45, 123–132. [Google Scholar] [CrossRef]
- Bade, D.; Castillo, J.G.; Fernandez, M.A.; Aguilar, J. The price premium of heritage in the housing market: Evidence from Auckland, New Zealand. Land Use Policy 2020, 99, 105042. [Google Scholar] [CrossRef]
- Li, J.; Krishnamurthy, K.; Roders, A.P.; Wesemael, P.V. State-of-the-practice: Assessing community participation within Chinese cultural World Heritage properties. Habitat Int. 2020, 96, 102107. [Google Scholar] [CrossRef]
- Wang, X.; Aoki, N. Paradox between neoliberal urban redevelopment, heritage conservation, and community needs: Case study of a historic neighbourhood in Tianjin, China. Cities 2018, 85, 156–169. [Google Scholar] [CrossRef]
- Stephen, N.; Mensah, J.V. Urban management and heritage tourism for sustainable development: The case of Elmina Cultural Heritage and Management Programme in Ghana. Manag. Environ. Qual. Int. J. 2006, 17, 299–312. [Google Scholar]
- Jamal, S.; Ghosh, A.; Hazarika, R.; Sen, A. Livelihood, conflict and tourism: An assessment of livelihood impact in Sundarbans, West Bengal. Int. J. Geoheritage Park. 2022, 10, 383–399. [Google Scholar] [CrossRef]
- Mastura, J.; Shuhaida, M.; Mostafa, R. Perception of young local residents toward sustainable conservation programmes: A case study of the Lenggong World Cultural Heritage Site. Tour. Manag. 2015, 48, 154–163. [Google Scholar]
- Wang, L.; Xiao, S. Tourism space reconstruction of a world heritage site based on actor network theory: A case study of the Shibing Karst of the South China Karst World Heritage Site. Int. J. Geoheritage Park. 2020, 8, 140–151. [Google Scholar] [CrossRef]
- Ghahramani, L.; McArdle, K.; Fatoric, S. Minority community resilience and Cultural Heritage Preservation: A case study of the Gullah Geechee community. Sustainability 2020, 12, 2266. [Google Scholar] [CrossRef]
- Burgess, E. The growth of the city: An introduction to a research project. In The City; Park, R.E., Burgers, E.W., McKenzie, R.D., Eds.; University of Chicago Press: Chicago, IL, USA, 2020. [Google Scholar]
- Hoyt, H. The Structure and Growth of Residential Neighborhoods in American Cities; US Government Printing Office: Washington, WA, USA, 1939. [Google Scholar]
- Harris, C.D.; Ullman, E.L. The nature of cities. Ann. Am. Acad. Political Soc. Sci. 1945, 242, 7–17. [Google Scholar] [CrossRef]
- Shevky, E.; Williams, M. The Social Areas of Los Angeles; University of California Press: Los Angeles, CA, USA, 1949. [Google Scholar]
- Shevky, E.; Bell, W. Social Area Analysis; Stanford University Press: Stanford, USA, CA, 1955. [Google Scholar]
- Lo, C.P. Decentralization and polarization: Contradictory trends in Hong Kong's postcolonial social landscape. Urban Geogr. 2005, 26, 36–60. [Google Scholar] [CrossRef]
- Massey, D. Reflections on the dimensions of segregation. Soc. Forces 2012, 91, 39–43. [Google Scholar] [CrossRef]
- Schnell, I.; Benjamini, Y. Globalisation and the structure of urban social space: The lesson from Tel Aviv. Urban Stud. 2005, 42, 2489–2510. [Google Scholar] [CrossRef]
- Icel, J.; Sharp, G. White Residential segregation in U.S. metropolitan areas: Conceptual issues, patterns, and trends from the U.S. census, 1980 to 2010. Popul. Res. Policy Rev. 2013, 32, 663–686. [Google Scholar]
- Zhou, S.; Deng, L.; Kwan, M.P.; Yan, R. Social and spatial differentiation of high and low income groups' out-of-home activities in Guangzhou, China. Cities 2015, 45, 81–90. [Google Scholar] [CrossRef]
- Lefebvre, H. The Production of Space; Blackwell Press: Oxford, UK, 1991. [Google Scholar]
- Harvey, D. The Urbanization of Capital; Blackwell Press: Oxford, UK, 1985. [Google Scholar]
- Zhao, R. Exploration and practice of the new concept of the protection of the Great Relics in Shaanxi Province. Archaeol. Cult. Relics 2009, 2, 3–7. [Google Scholar]
- Caust, J.; Vecco, M. Is UNESCO World Heritage recognition a blessing or burden? Evidence from developing Asian countries. J. Cult. Herit. 2017, 27, 1–9. [Google Scholar] [CrossRef]
- Wright, W.; Eppink, F.V. Drivers of heritage value: A meta-analysis of monetary valuation studies of cultural heritage. Ecol. Econ. 2016, 130, 277–284. [Google Scholar] [CrossRef]
- Kim, S. Tourism impacts continuity of World Heritage List inscription and sustainable management of Hahoe Village, Korea: A case study of changes in tourist perceptions. Sustainability 2019, 11, 2573. [Google Scholar] [CrossRef]
- Shen, J.; Chou, R.; Zhu, R.; Chen, S. Experience of community resilience in rural areas around heritage sites in Quanzhou under transition to a knowledge economy. Land 2022, 11, 2155. [Google Scholar] [CrossRef]
- Harvey, D. Social Justice and the City; Edward Arnold: London, UK, 1973. [Google Scholar]
- Ye, C.; Chen, M.X.; Duan, J.J.; Yang, D.Y. Uneven development, urbanization and production of space in the middle-scale region based on the case of Jiangsu Province, China. Habitat Int. 2017, 66, 106–116. [Google Scholar] [CrossRef]
- Smith, N. Uneven Development: Nature, Capital, and the Production of Space; University of Georgia Press: Athens, Greece, 2010. [Google Scholar]
- Carlos, A.; Fani, A. The concept of “production of space” and contemporary urban dynamics under the dominance of financial capital. Rev. De Geogr. Norte Gd. 2022, 82, 89–107. [Google Scholar]
- Richardson, J.J.; Bernard, A.C. Zoning for conservation easements. Law Contemp. Probl. 2011, 74, 83–108. [Google Scholar] [CrossRef]
- Covataru, C.; Stal, C.; Florea, M.; Opris, I.; Simion, C.; Radulescu, I.; Calin, R.; Ignat, T.; Ghita, C.; Lazar, C. Human impact scale on the preservation of archaeological sites from Mostistea Valley (Romania). Front. Environ. Sci. 2022, 10, 1065. [Google Scholar] [CrossRef]
- Coad, L.; Campbell, A.; Miles, L.; Humphries, K. The Costs and Benefits of Protected Areas for Local Livelihoods: A Review of the Current Literature; UNEP World Conservation Monitoring Centre: Cambridge, UK, 2008. [Google Scholar]
- Yang, J.; You, Y.; Ye, X.; Li, J. Cultural heritage sites risk assessment based on RS and GIS—Takes the Fortified Manors of Yongtai as an example. Int. J. Disaster Risk Reduct. 2023, 88, 103593. [Google Scholar] [CrossRef]
- McKercher, B.; Ho, P.S.Y.; Cros, H.D. Relationship between tourism and cultural heritage management: Evidence from Hong Kong. Tour. Manag. 2005, 26, 539–548. [Google Scholar] [CrossRef]


| Type | Essential Factor | Specific Indicators |
|---|---|---|
| Spatial dimension: space of practice | Agriculture | Per capita cultivated land area, planting area of grain crops, planting area of cash crops, etc. |
| Rural enterprises | Area occupied by individual enterprises, number of individual enterprises, number of collective enterprises, area occupied by collective enterprises, etc. | |
| Traffic conditions | Length of village roads, number of village parking lots, etc. | |
| Living conditions | Homestead area, housing type, house structure, years of residence, etc. | |
| Ecological environment | Forest land area, waste slope area, etc. | |
| Social dimension: space of representation | Population structure | Local population, number of migrant populations, outgoing employed population, population employed in the village, sex ratio, age composition, etc. |
| Family composition | Total number of households, per household population, number of impoverished households, etc. | |
| Land ownership | Area of land requisitioned, area of leased land, etc. | |
| Employment status | Population employed in scenic areas, number of agritainment households, number of commodity sales households, number of stalls, number of tour guides or drivers, number of transportation logistics households, etc. |
| Type | Specific Indicators | Principal Components Load | |||||||
|---|---|---|---|---|---|---|---|---|---|
| Ⅰ | II | III | IV | V | VI | VII | VIII | ||
| Spatial dimension | Per capita cultivated land area | −0.478 | −0.482 | 0.451 | −0.079 | −0.271 | −0.013 | −0.065 | 0.314 |
| Planting area of grain crops | −0.121 | −0.368 | 0.750 | −0.117 | −0.125 | 0.153 | −0.12 | 0.224 | |
| Planting area of cash crops | 0.092 | −0.102 | 0.01 | 0.165 | −0.171 | −0.18 | 0.165 | 0.04 | |
| Area occupied by enterprises | −0.027 | −0.081 | 0.089 | 0.152 | 0.08 | 0.715 | −0.085 | −0.183 | |
| Number of collective agricultural enterprises | 0.226 | −0.155 | 0.383 | 0.044 | 0.158 | 0.321 | −0.019 | 0.177 | |
| Number of collective industrial enterprises | −0.027 | −0.044 | −0.025 | 0.049 | 0.931 | −0.063 | −0.072 | 0.029 | |
| Number of collective service enterprises | −0.151 | 0.937 | −0.092 | −0.051 | −0.027 | −0.053 | −0.042 | 0.094 | |
| Number of individual agricultural enterprises | 0.073 | −0.063 | 0.036 | 0.891 | −0.075 | 0.028 | 0.019 | −0.118 | |
| Number of individual mining enterprises | 0.041 | −0.003 | 0.222 | −0.027 | −0.063 | 0.867 | 0.012 | −0.012 | |
| Number of individual manufacturing enterprises | 0.153 | 0.185 | 0.022 | −0.281 | 0.675 | −0.047 | 0.359 | −0.063 | |
| Number of individual tourism enterprises | −0.035 | 0.901 | −0.092 | −0.104 | 0.003 | 0.018 | 0.131 | −0.074 | |
| Number of agricultural product processing enterprises | 0.443 | −0.052 | −0.149 | 0.713 | 0.239 | 0.003 | 0.19 | 0.068 | |
| Number of individual packaging logistics industries | 0.451 | −0.08 | −0.186 | 0.508 | 0.147 | 0.071 | 0.103 | −0.095 | |
| Length of village roads | 0.148 | −0.227 | 0.514 | −0.031 | 0.096 | 0.048 | 0.268 | 0.039 | |
| Number of village parking lots | 0.036 | 0.808 | −0.127 | 0.272 | 0.298 | −0.017 | 0.132 | 0.082 | |
| Homestead area | 0.563 | −0.047 | −0.056 | 0.353 | −0.047 | 0.123 | −0.041 | −0.071 | |
| Number of two-story households | 0.547 | 0.513 | −0.357 | 0.385 | −0.16 | −0.164 | 0.008 | 0.083 | |
| Number of bungalow households | 0.461 | −0.437 | 0.616 | −0.192 | 0.152 | 0.214 | −0.028 | −0.117 | |
| Number of concrete structure households | 0.842 | 0.257 | 0.036 | 0.212 | 0.125 | −0.15 | −0.067 | −0.046 | |
| Number of brick structure households | 0.460 | −0.329 | 0.486 | −0.037 | −0.153 | 0.332 | 0.07 | 0.043 | |
| Number of wooden structure households | −0.140 | −0.351 | 0.003 | −0.175 | −0.218 | −0.016 | −0.072 | −0.589 | |
| Housing built in the 70s | −0.033 | −0.249 | 0.213 | −0.241 | 0.446 | 0.306 | 0.106 | −0.119 | |
| Housing built in the 80s | 0.083 | 0.248 | −0.018 | −0.112 | −0.12 | 0.063 | 0.004 | −0.045 | |
| Housing built in the 90s | 0.618 | 0.218 | 0.04 | 0.119 | −0.039 | 0.297 | −0.059 | −0.129 | |
| Housing built after 2000 | 0.937 | −0.058 | 0.022 | −0.071 | 0.131 | 0.047 | 0.011 | 0.125 | |
| Housing built after 2010 | 0.232 | −0.104 | 0.638 | 0.41 | −0.148 | −0.239 | −0.025 | −0.183 | |
| Forest land area | −0.05 | 0.112 | −0.086 | 0.173 | −0.024 | −0.031 | 0.876 | 0.039 | |
| Waste slope area | −0.231 | −0.143 | 0.058 | −0.156 | 0.037 | 0.017 | 0.635 | 0.225 | |
| Social dimension | Local registered residence population | 0.833 | −0.131 | 0.488 | 0.141 | 0.03 | 0.035 | −0.009 | −0.078 |
| Migrant population | 0.130 | 0.917 | −0.127 | −0.051 | −0.014 | 0.179 | 0.011 | 0.002 | |
| Outgoing employed population | 0.317 | −0.305 | 0.582 | −0.193 | 0.139 | 0.218 | −0.012 | −0.216 | |
| Population employed in the village | 0.590 | 0.282 | 0.322 | 0.314 | −0.161 | −0.099 | 0.316 | −0.022 | |
| Sex ratio | −0.582 | 0.073 | −0.168 | 0.029 | 0.348 | 0.034 | −0.301 | −0.144 | |
| Population under 18 years old | 0.695 | −0.171 | 0.003 | 0.274 | 0.016 | −0.181 | −0.343 | −0.069 | |
| Population of working age | 0.607 | −0.089 | 0.713 | 0.162 | −0.008 | 0.08 | 0.152 | −0.088 | |
| Population over 60 years old | 0.875 | −0.11 | 0.088 | −0.065 | 0.093 | 0.067 | −0.095 | −0.021 | |
| Total number of households | 0.925 | 0.018 | 0.292 | 0.146 | 0.009 | 0.068 | −0.02 | −0.042 | |
| Per household population | −0.572 | −0.555 | 0.211 | −0.056 | −0.031 | −0.105 | 0.024 | 0.029 | |
| Poor households in villages | 0.013 | −0.293 | 0.758 | −0.165 | −0.071 | 0.183 | −0.065 | −0.069 | |
| Area of requisitioned land | 0.736 | 0.448 | −0.32 | −0.006 | −0.092 | −0.027 | 0.043 | 0.107 | |
| Area of leased land | −0.143 | −0.03 | −0.011 | −0.002 | −0.034 | 0.084 | −0.041 | −0.09 | |
| Population employed in scenic areas | −0.077 | 0.06 | −0.082 | −0.2 | −0.135 | −0.104 | 0.089 | 0.86 | |
| Number of agritainment households | −0.119 | 0.924 | −0.007 | 0.142 | −0.049 | −0.083 | −0.035 | −0.006 | |
| Number of commodity sales households | 0.239 | 0.808 | −0.142 | −0.127 | 0.052 | −0.113 | −0.178 | −0.023 | |
| Number of catering business households | 0.091 | −0.081 | 0.025 | −0.036 | −0.095 | 0.01 | −0.138 | −0.357 | |
| Number of stalls | −0.079 | 0.833 | −0.237 | −0.04 | −0.101 | −0.1 | −0.06 | 0.264 | |
| Number of handicraft production households | −0.012 | 0.945 | −0.146 | −0.089 | −0.017 | −0.005 | 0.09 | 0.001 | |
| Number of tour guides or drivers | 0.267 | 0.596 | −0.393 | −0.162 | −0.106 | −0.045 | 0.188 | 0.321 | |
| Number of transportation logistics households | 0.257 | 0.017 | −0.224 | 0.485 | 0.648 | 0.078 | −0.162 | −0.061 | |
| Type of Rural Area | Principal Components | |||||||
|---|---|---|---|---|---|---|---|---|
| I | II | III | IV | V | VI | VII | VIII | |
| Tourism service area | 0.143 | 0.174 | −0.130 | −0.291 | 0.137 | 0.096 | −0.019 | −0.184 |
| Agricultural tourism area | 0.259 | 0.582 | 0.488 | 0.523 | 0.481 | 0.372 | 0.202 | −0.081 |
| Labor supply area | −0.477 | −0.438 | 0.343 | −0.312 | −0.249 | −0.042 | −0.353 | 0.235 |
| Labor outflow area | 0.181 | 0.157 | 0.209 | 0.117 | −0.077 | −0.413 | 0.088 | 0.145 |
| Resettlement area | 0.424 | −0.013 | 0.411 | −0.008 | −0.698 | 0.306 | 0.352 | 0.358 |
| Rural industrialized areas | 0.006 | 0.008 | 0.181 | 0.047 | −0.078 | 0.172 | −0.187 | −0.002 |
Disclaimer/Publisher’s Note: The statements, opinions and data contained in all publications are solely those of the individual author(s) and contributor(s) and not of MDPI and/or the editor(s). MDPI and/or the editor(s) disclaim responsibility for any injury to people or property resulting from any ideas, methods, instructions or products referred to in the content. |
© 2023 by the authors. Licensee MDPI, Basel, Switzerland. This article is an open access article distributed under the terms and conditions of the Creative Commons Attribution (CC BY) license (https://creativecommons.org/licenses/by/4.0/).
Share and Cite
Wu, C.; Yang, M.; Zhang, H.; Yu, Y. Spatial Structure and Evolution of Territorial Function of Rural Areas at Cultural Heritage Sites from the Perspective of Social Space. Land 2023, 12, 1067. https://doi.org/10.3390/land12051067
Wu C, Yang M, Zhang H, Yu Y. Spatial Structure and Evolution of Territorial Function of Rural Areas at Cultural Heritage Sites from the Perspective of Social Space. Land. 2023; 12(5):1067. https://doi.org/10.3390/land12051067
Chicago/Turabian StyleWu, Chong, Mengling Yang, Hang Zhang, and Yafang Yu. 2023. "Spatial Structure and Evolution of Territorial Function of Rural Areas at Cultural Heritage Sites from the Perspective of Social Space" Land 12, no. 5: 1067. https://doi.org/10.3390/land12051067
APA StyleWu, C., Yang, M., Zhang, H., & Yu, Y. (2023). Spatial Structure and Evolution of Territorial Function of Rural Areas at Cultural Heritage Sites from the Perspective of Social Space. Land, 12(5), 1067. https://doi.org/10.3390/land12051067


