
How Do Heterogeneous Land Development Opportunities Affect Rural Household Nonfarm Employment: A Perspective of Spatial Regulation


Abstract
1. Introduction
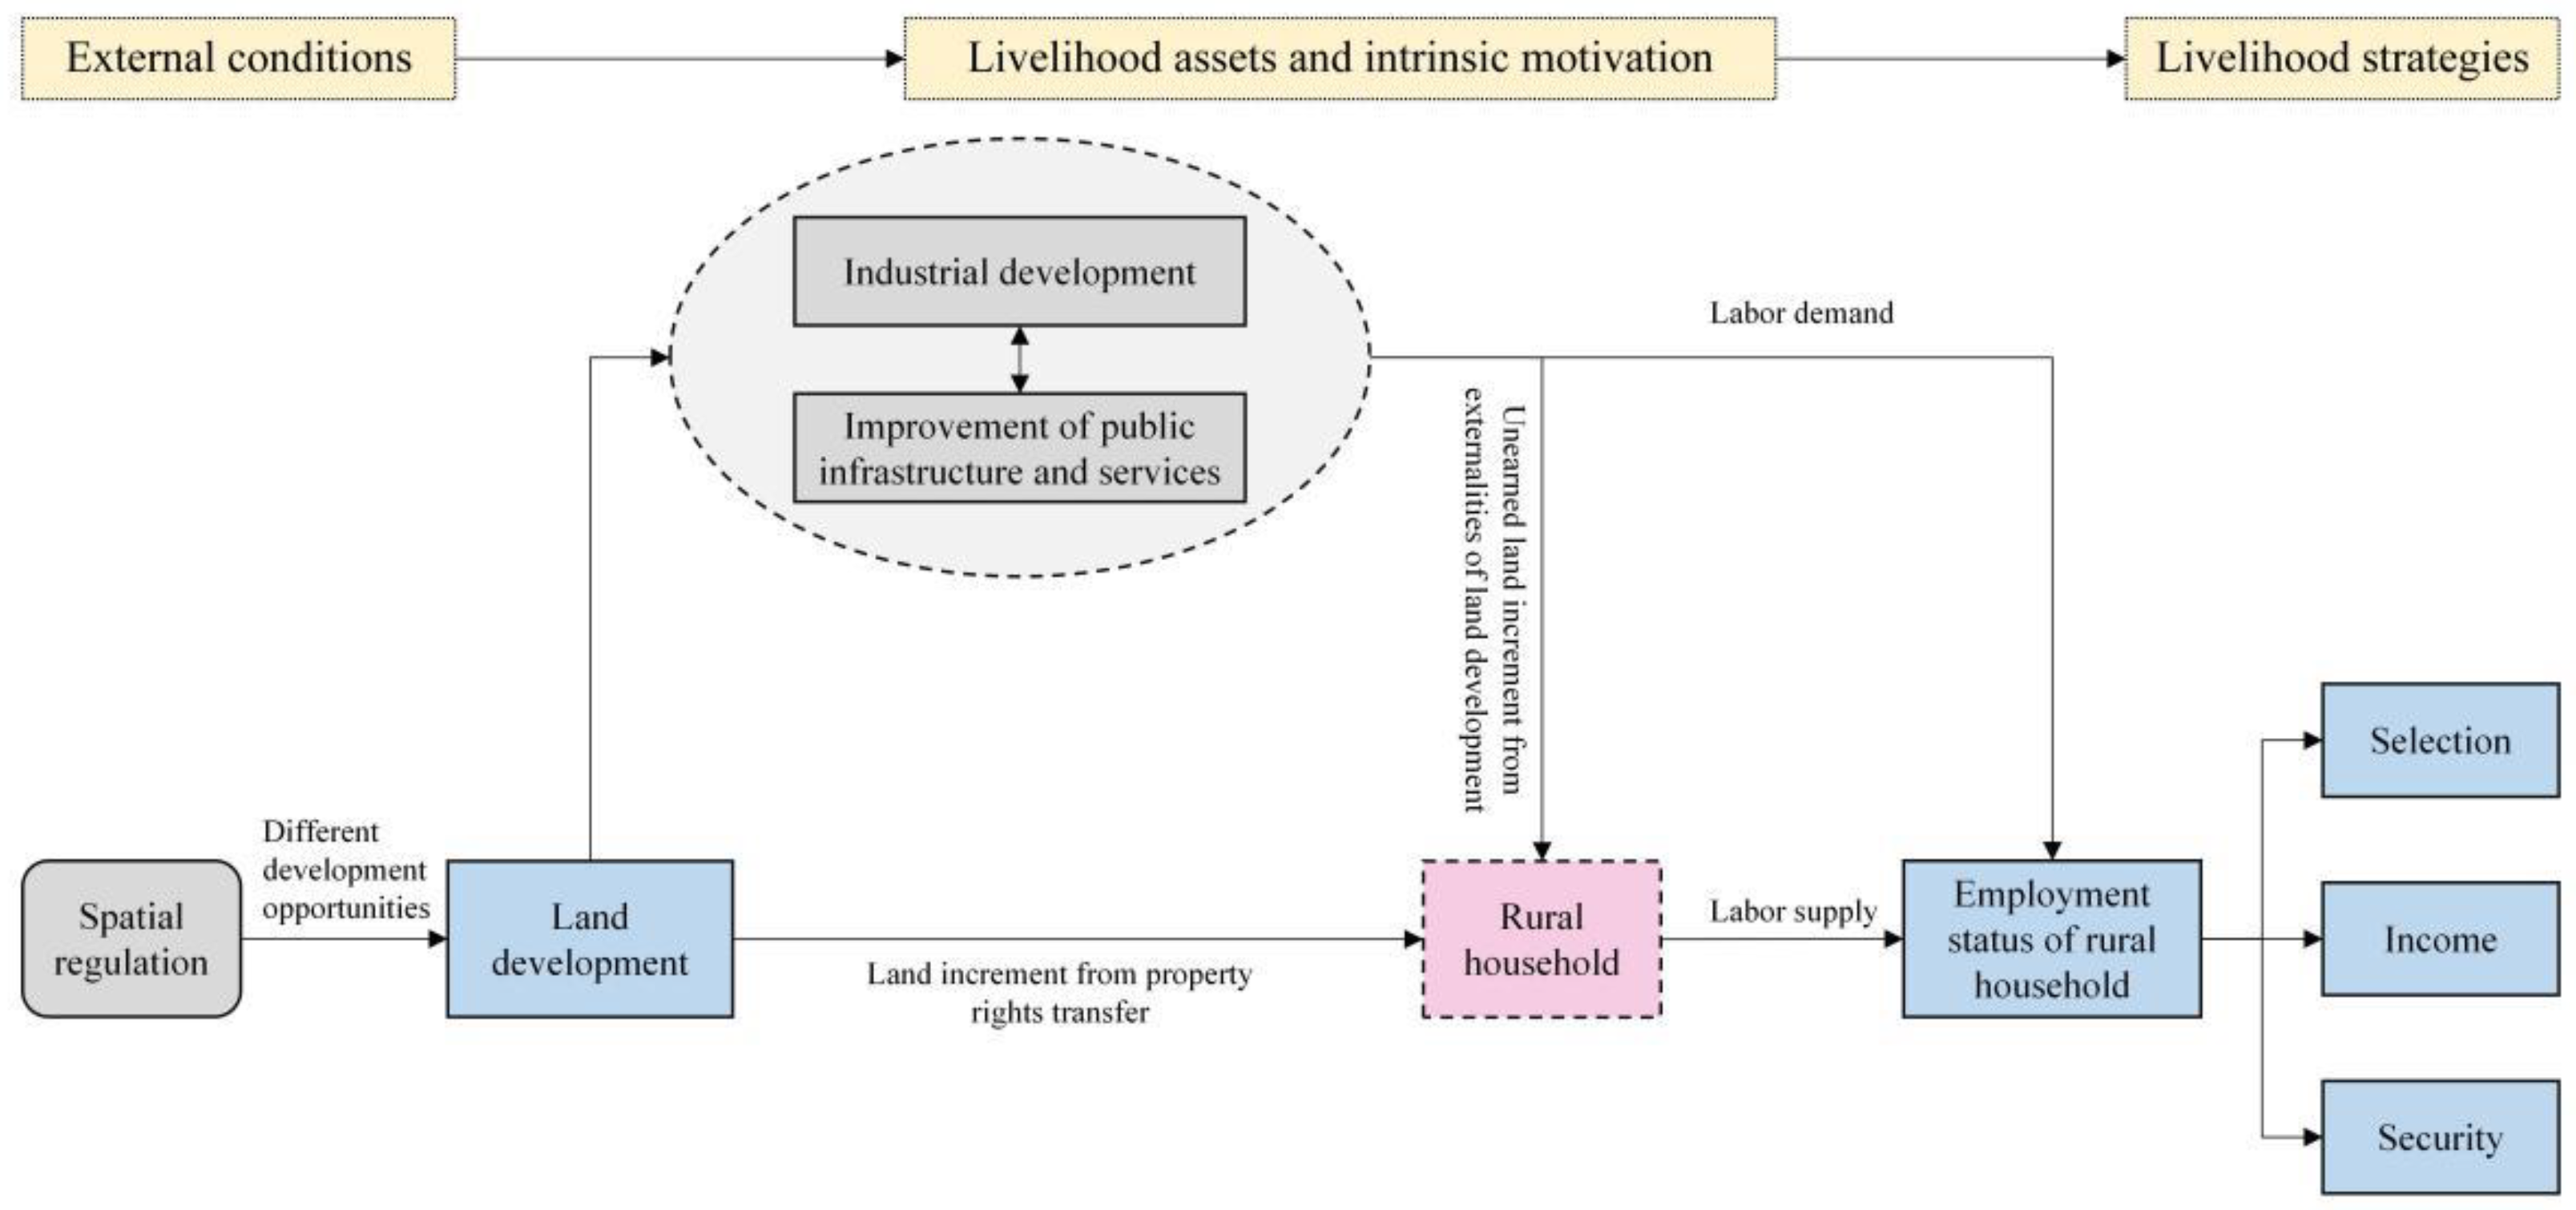
2. Theoretical Analysis and Research Hypotheses
3. Study Site, Variables, and Methods
3.1. Study Site and Data Source
3.1.1. Introduction to the Study Site
3.1.2. Data Sources
3.2. Variables
3.2.1. Dependent Variables
3.2.2. Independent Variables
3.2.3. Control Variables
3.3. Methodology
4. Results
4.1. Analysis of the Descriptive Results
4.2. Analysis of the Regression Results
4.3. Robustness Check
4.4. Heterogeneity Analysis
4.4.1. Heterogeneity Analysis of Households with Different Income Levels
4.4.2. Heterogeneity Analysis of Households with Different Human Capital Endowments
4.5. Further Analysis
5. Discussion
6. Conclusions and Policy Recommendations
Author Contributions
Funding
Data Availability Statement
Conflicts of Interest
| 1 | Random sampling means that each rural household in the study site has an equal chance to be selected. |
| 2 | The survey in UDPA was not carried out in the residence of the interviewees, and there were many cases where interviewees refused to continue the survey due to requests for sensitive information, so the efficiency of the survey questionnaire in this area is relatively low. |
| 3 | Household head refers to the head of the family on the household register. |
| 4 | Significance test is used to determine if the difference between the assumed value in the null hypothesis and the value observed from the experiment is large enough to reject the possibility that the result was a purely chance process. |
References
- Rogatka, K.; Starczewski, T.; Kowalski, M. Urban resilience in spatial planning of polish cities-True or false? Transformational perspective. Land Use Policy 2021, 101, 105172. [Google Scholar] [CrossRef]
- Gardner, B.D. The economics of agricultural land preservation. Am. J. Agric. Econ. 1977, 59, 1027–1036. [Google Scholar] [CrossRef]
- Cai, Y.Y.; Zhang, A.L. Researching trends of prime farmland’s economic compensation under land use planning control. China Popul. Resour. Environ. 2010, 20, 102–106. [Google Scholar]
- Qiu, Y.; Zhou, A.G.; Li, M.H.; Guo, Y.X.; Cui, H.; Ma, C.M. Territorial spatial usage regulation based on resources endowment and sustainable development: A case of Wuhan, China. J. Clean. Prod. 2023, 385, 135771. [Google Scholar] [CrossRef]
- Fuseini, I.; Kemp, J. A review of spatial planning in Ghana’s socio-economic development trajectory: A sustainable development perspective. Land Use Policy 2015, 47, 309–320. [Google Scholar] [CrossRef]
- Liu, Y.; Zhou, Y. Territory spatial planning and national governance system in China. Land Use Policy 2021, 102, 105288. [Google Scholar] [CrossRef]
- Deichmann, U.; Shilpi, F.; Vakis, R. Urban proximity, agricultural potential and rural non-farm employment: Evidence from Bangladesh. World Dev. 2009, 37, 645–660. [Google Scholar] [CrossRef]
- Tian, C.H.; Li, M.K. The impact of land market development on labor non-agricultural employment: Based on the experience of Zhejiang, Hubei, and Shaanxi. J. Agrotech. Econ. 2014, 8, 11–24. [Google Scholar] [CrossRef]
- Xie, X.X.; Deng, Y.; Liu, J.Y.; Lu, W.N.; Zhao, M.J. Impact of fallow on off-farm employment of farmers. Resour. Sci. 2021, 42, 280–292. [Google Scholar] [CrossRef]
- Sheng, Y.; Zhao, Y.H.; Zhang, Q.; Dong, W.L.; Huang, J.K. Boosting rural labor off-farm employment through urban expansion in China. World Dev. 2022, 151, 105727. [Google Scholar] [CrossRef]
- Hu, Y.; Zhang, Z.H. The Influence of Vocational Training on Farmers’ Off-farm Employment Behavior and Characteristics: Net Effect Estimation Based on Endogenous Treatment Effect Model. Reform 2022, 338, 110–126. [Google Scholar]
- Laszlo, S. Education, labor supply, and market development in rural Peru. World Dev. 2008, 36, 2421–2439. [Google Scholar] [CrossRef]
- Xin, L.; Jiang, H.P. Rural labor force’ non-agricultural employment and its impact factor analysis: Based on the survey of 1006 rural labors in Sichuan Province. J. Agrotech. Econ. 2009, 6, 19–25. [Google Scholar]
- Zhou, B.; Chen, Z.J. The impact of agricultural factors on rural households’ non-agricultural employment. J. Agrotech. Econ. 2011, 4, 19–24. [Google Scholar]
- Thompson, D.D. An externality from governmentally owned property may be a nuisance or even a taking. In Windfalls for Wipeouts: Land Value Capture and Compensation; Planner Press: Washington, DC, USA, 1987; pp. 203–221. [Google Scholar]
- Cai, Y.Y.; Yu, Y. The restriction of farmers’ land development rights under prime farmland planning control. China Popul. Resour. Environ. 2012, 22, 76–82. [Google Scholar]
- Zhu, L.L.; Cai, Y.Y. Regional differences of restriction on farmland development rights under land-use regulation and the economic compensation: Cases in Wuhan, Jingmen and Huanggang, Hubei Province. J. Nat. Resour. 2015, 30, 736–747. [Google Scholar]
- Clements, T.; Suon, S.; Wilkie, D.S.; Milner-Gulland, E.J. Impacts of Protected Areas on Local Livelihoods in Cambodia. World Dev. 2014, 64, S125–S134. [Google Scholar] [CrossRef]
- Duan, W.; Hogarth, N.J.; Shen, J.Y. Impacts of Protected Areas on Income Inequality: Evidence from the Giant Panda Biosphere Reserves in Sichuan Province, China. J. For. Econ. 2021, 36, 27–51. [Google Scholar] [CrossRef]
- Wang, H.; Cheng, P.; Liang, P.P.; Liu, K.; Nie, X. Invisible windfalls and wipeouts: What is the impact of spatial regulation on the welfare of land-lost farmers? Habitat Int. 2020, 99, 102159. [Google Scholar] [CrossRef]
- Yu, L.L.; Cai, Y.Y. Effects of national spatial planning to economic growth in key development areas: Evidence from the planning of Wuhan Urban Agglomeration. China Popul. Resour. Environ. 2016, 26, 101–109. [Google Scholar]
- Tobin, J. Estimation of Relationships for Limited Dependent Variables. Econometrica 1958, 26, 24–36. [Google Scholar] [CrossRef]
- Zhu, D.L.; Zhang, L.X.; Yun, W.J. Logic and Regulation of Planning Governance: Balance between Public Power and Private Rights. Planners 2021, 37, 19–22. [Google Scholar]
- Cao, R.F.; Zhang, A.L.; Cai, Y.Y.; Xie, X.X. How imbalanced land development affects local fiscal condition? A case study of Hubei Province, China. Land Use Policy 2020, 99, 105086. [Google Scholar] [CrossRef]
- Li, Y.H.; Li, Y.; Westlund, H.; Liu, Y.S. Urban-rural transformation in relation to cultivated land conversion in China: Implications for optimizing land use and balanced regional development. Land Use Policy 2015, 47, 218–224. [Google Scholar] [CrossRef]
- Chen, L.; Jiang, H. Land resource spatial allocation under the guidance of main functional areas: Rational thinking on the evolution discipline of land development. China Land Sci. 2019, 33, 22–30. [Google Scholar]
- Woods, M. Rural cosmopolitanism at the frontier? Chinese farmers and community relations in northern Queensland, c. 1890–1920. Aust. Geogr. 2018, 49, 107–131. [Google Scholar] [CrossRef]
- Yang, R.; Lin, Y. Rural spatial transformation and governance from the perspective of land development rights: A case study of Fenghe village in Guangzhou. Growth Chang. 2022, 53, 1102–1121. [Google Scholar] [CrossRef]
- Cao, R.F.; Zhang, A.L. Measurement and sensitivity analysis of unbalance degree of land development: From the perspective of farmland development restriction. J. Nat. Resour. 2017, 32, 715–726. [Google Scholar] [CrossRef]
- He, Q.S.; He, W.S.; Song, Y.; Wu, J.Y.; Yin, C.H.; Mou, Y.C. The impact of urban growth patterns on urban vitality in newly built-up areas based on an association rules analysis using geographical ‘big data’. Land Use Policy 2018, 78, 726–738. [Google Scholar] [CrossRef]
- Huang, X.J.; Huang, X.; He, Y.B.; Yang, X.J. Assessment of livelihood vulnerability of land-lost farmers in urban fringes: A case study of Xi’an, China. Habitat Int. 2017, 59, 1–9. [Google Scholar] [CrossRef]
- Cravino, J.; Sotelo, S. Trade-induced structural change and the skill premium. Am. Econ. J. Macroecon. 2019, 11, 289–326. [Google Scholar] [CrossRef]
- Uy, T.; Yi, K.M.; Zhang, J. Structural change in an open economy. J. Monet. Econ. 2013, 60, 667–682. [Google Scholar] [CrossRef]
- Choithani, C.; van Duijne, R.J.; Nijman, J. Changing livelihoods at India’s rural–urban transition. World Dev. 2021, 146, 105617. [Google Scholar] [CrossRef]
- Wu, J.Y.; Wu, G.F.; Kong, X.Y.; Luo, Y.L.; Zhang, X.B. Why should landowners in protected areas be compensated? A theoretical framework based on value capture. Land Use Policy 2020, 95, 104640. [Google Scholar] [CrossRef]
- Gibson, J.; Olivia, S. The effect of infrastructure access and quality on non-farm enterprises in rural Indonesia. World Dev. 2010, 38, 717–726. [Google Scholar] [CrossRef]
- Qiu, Y. Land development right allocation and farmer’s citizenship dilemma: Analysis of anti-urbanization behavior of farmers in The Pearl River Delta. Issues Agric. Econ. 2020, 11, 42–54. [Google Scholar] [CrossRef]
- Gui, H. Ways of land development and process of population urbanization: Comment on Land Expropriation System Reform. J. Huazhong Agric. Univ. (Soc. Sci.) 2019, 1, 155–161+170. [Google Scholar] [CrossRef]
- Yang, Q.; Cai, Y.Y. Housing property redistribution and elite capture in the redevelopment of urban villages: A case study in Wuhan, China. J. Clean. Prod. 2020, 262, 121192. [Google Scholar] [CrossRef]
- Giles, J.; Mu, R. Village Political Economy, Land Tenure Insecurity and the Rural to Urban Migration Decision: Evidence from China. Am. J. Agric. Econ. 2018, 100, 521–544. [Google Scholar] [CrossRef]
- Pan, M.M.; Cai, S.K.; Zhou, Y. Has Internet Use Promoted Non-agricultural Employment for rural Women? Empirical Research Based on the Survey Data of Jiangsu, Anhui, Henan and Hubei. J. Agrotech. Econ. 2021, 316, 133–144. [Google Scholar] [CrossRef]
- Wang, X.S.; Guo, Z.X.; Li, N.; Xu, H.Z. The impact of land acquisition on farmers’ employment and welfare: An empirical analysis using CHIP data. J. Public Manag. 2019, 16, 153–168+176. [Google Scholar] [CrossRef]
- Adesina, A.A.; Zinnah, M.M. Technology characteristics, farmers’ perceptions and adoption decisions: A Tobit model application in Sierra Leone. Agric. Econ. 1993, 9, 297–311. [Google Scholar] [CrossRef]
- Song, Y.; Yeung, G.; Zhu, D.L.; Xu, Y.; Zhang, L.X. Efficiency of urban land use in China’s resource-based cities, 2000–2018. Land Use Policy 2022, 115, 106009. [Google Scholar] [CrossRef]
- Chen, M.A.; Raveendran, G. Urban employment in India: Recent trends and patterns. Margin: J. Appl. Econ. Res. 2012, 6, 159–179. [Google Scholar] [CrossRef]
- Huffman, W. Farm and off-farm Work Decisions: The Role of Human Capital. Rev. Econ. Stat. 1980, 62, 14–23. [Google Scholar] [CrossRef]
- Yang, J.F.; Shi, J.T. The influence of human capital on non-farm employment: A literature review. China Rural Surv. 2006, 3, 74–79. [Google Scholar]
- Song, J.H.; Wu, H.T.; Cheng, W.T. Labor Endowment, Non-agricultural Employment and Relative Poverty. J. Huazhong Agric. Univ. (Soc. Sci.) 2022, 157, 64–74. [Google Scholar] [CrossRef]
- Lu, X.; White, H. Robustness checks and robustness tests in applied economics. J. Econom. 2014, 178, 194–206. [Google Scholar] [CrossRef]
- Bonnini, S.; Corain, L.; Marozzi, M.; Salmaso, L. Tests for Heterogeneity; Wiley Series in Probability and Statistics: Hoboken, NJ, USA, 2014; pp. 176–199. [Google Scholar] [CrossRef]
- Liu, R.; Yu, C.; Jiang, J.; Huang, Z.B.; Jiang, Y.M. Farmer differentiation, generational differences and farmers’ behaviors to withdraw from rural homesteads: Evidence from chengdu, China. Habitat Int. 2020, 103, 102231. [Google Scholar] [CrossRef]
- Long, H.L.; Tu, S.S.; Ge, D.Z.; Li, T.T.; Liu, Y.S. The allocation and management of critical resources in rural China under restructuring: Problems and prospects. J. Rural Stud. 2016, 47, 392–412. [Google Scholar] [CrossRef]
- Alobo Loison, S. Rural livelihood diversification in sub-Saharan Africa: A literature review. J. Dev. Stud. 2015, 51, 1125–1138. [Google Scholar] [CrossRef]
- Lv, P.L.; Feng, S.Y.; Wang, B.; Qu, F.T. Farming households’ decision of farmland and rural labor allocation and influencing factors. Resour. Sci. 2022, 44, 1577–1588. [Google Scholar] [CrossRef]
- Luo, C. Re-partitioning population age group and its implications. Popul. Res. 2017, 41, 16–25. [Google Scholar]
- Yeboah, F.K.; Jayne, T.S. Africa’s evolving employment trends. J. Dev. Stud. 2018, 54, 803–832. [Google Scholar] [CrossRef]
- Jou, J.B.; Lee, T. Taxation on Land Value and Development When There Are Negative Externalities from Development. J. Real Estate Financ. Econ. 2008, 36, 103–120. [Google Scholar] [CrossRef]
- Linkous, E.R. Transfer of development rights in theory and practice: The restructuring of TDR to incentivize development. Land Use Policy 2016, 51, 162–171. [Google Scholar] [CrossRef]
- Tian, L. Betterment and Compensation under the Land Use Rights System: A Perspective of Property Rights; China Architecture and Building Press: Beijing, China, 2008; pp. 28–36. [Google Scholar]
- Song, W.F.; Han, X.F. The Rural Income Gaps Among Ecological Protection Boundary, Social Capital and Poor Counties. Financ. Econ. 2020, 3, 107–119. [Google Scholar]
- Li, Y.; Gong, P.C.; Ke, J.S. Development opportunities, forest use transition, and farmers’ income differentiation: The impacts of Giant panda reserves in China. Ecol. Econ. 2021, 180, 106869. [Google Scholar] [CrossRef]
- Zhang, Y.; Xu, Q.; Wu, J.J. A Successful Anti-poverty War: Experience from China. Econ. Res. J. 2012, 47, 76–87. [Google Scholar]
- Liu, W.; Zhang, Y.L. Study on off-farm employment and income gap of farmers: Based on heterogeneity analysis of local off-farm employment and out-of-village employment. J. Huazhong Agric. Univ. (Soc. Sci.) 2018, 135, 56–64+155. [Google Scholar] [CrossRef]
- Burnett, P. Land use regulations and regional economic development. Land Econ. 2016, 92, 237–255. [Google Scholar] [CrossRef]
- Cao, R.; Zhang, A.L.; Wen, L.J. Trans-regional compensation mechanism under imbalanced land development: From the local government economic welfare perspective. Habitat Int. 2018, 77, 56–63. [Google Scholar] [CrossRef]


| Variables | Variable Descriptions | Total Sample (N = 907) | EPPA (N = 305) | IDPA (N = 280) | UDPA (N = 322) | |
|---|---|---|---|---|---|---|
| Mean | SD | Mean | Mean | Mean | ||
| Dependent variables | ||||||
| Employment selection | Proportion of labor employed to the total population of household labor (%) | 0.558 | 0.232 | 0.550 | 0.642 | 0.492 |
| Employment income | Proportion of wage income to the total household income (%) | 0.713 | 0.263 | 0.795 | 0.867 | 0.501 |
| Employment security | Proportion of employed labor with security to the total population of labor employed of household (%) | 0.474 | 0.427 | 0.292 | 0.449 | 0.667 |
| Independent variables | ||||||
| Ecological development opportunity (EDO) | Dummy variable of land development opportunities: EPPA = 1 and others = 0 | 0.336 | 0.473 | 1.000 | 0.000 | 0.000 |
| Industrial development opportunity (IDO) | Dummy variable of land development opportunities: IDPA = 1 and others = 0 | 0.309 | 0.462 | 0.000 | 1.000 | 0.000 |
| Urban development opportunity (UDO) | Dummy variable of land development opportunities: UDPA = 1 and others = 0 | 0.355 | 0.479 | 0.000 | 0.000 | 1.000 |
| Controlled variables | ||||||
| Head’s age | Age of household head (year) | 62.118 | 10.575 | 60.298 | 63.846 | 62.339 |
| Head’s education | Education of household head: 1–7 indicating from illiteracy to master or above | 2.510 | 0.929 | 2.472 | 2.400 | 2.643 |
| Head’s politics status | Politics status of household head: party member = 1, non-party member = 0 | 0.094 | 0.292 | 0.085 | 0.093 | 0.102 |
| Family size | Population of the household (person) | 4.722 | 1.323 | 4.679 | 4.829 | 4.671 |
| Labor force ratio | Proportion of labor force aged 20 and above with coefficient correction to the total population of household (%) | 0.800 | 0.144 | 0.780 | 0.768 | 0.847 |
| Education of labor force | The average education of people aged 20–69 in the labor force: 1–7 indicating from illiteracy to master or above | 4.596 | 1.214 | 4.325 | 4.511 | 4.929 |
| Health of labor force | The average health of people aged 20–69 in the labor force: 1–5 indicating from worst to best | 4.058 | 0.925 | 4.472 | 4.574 | 3.217 |
| Farmland area | Area of contracted farmland of household (mu) | 3.833 | 5.272 | 9.147 | 2.451 | 0.000 |
| Car | Households who have a car: have = 1, not have = 0 | 0.570 | 0.495 | 0.495 | 0.593 | 0.621 |
| Poverty allowance | Households who accepted poverty allowance: accepted = 1, not accepted = 0 | 0.040 | 0.195 | 0.059 | 0.061 | 0.003 |
| Variables | Employment Selection | Employment Income | Employment Security | |||
|---|---|---|---|---|---|---|
| (1) | (2) | (3) | (4) | (5) | (6) | |
| IDO | 0.104 *** | 0.111 *** | 0.083 *** | 0.080 *** | 0.542 *** | 0.325 ** |
| (0.021) | (0.026) | (0.018) | (0.022) | (0.114) | (0.133) | |
| UDO | −0.065 *** | −0.057 * | −0.296 *** | −0.320 *** | 1.264 *** | 0.944 *** |
| (0.021) | (0.034) | (0.018) | (0.029) | (0.124) | (0.183) | |
| Head’s age | −0.004 *** | −0.003 *** | 0.008 | |||
| (0.001) | (0.001) | (0.005) | ||||
| Head’s education | −0.008 | −0.037 *** | −0.209 *** | |||
| (0.012) | (0.011) | (0.065) | ||||
| Head’s politics status | −0.015 | −0.016 | 0.206 | |||
| (0.029) | (0.025) | (0.153) | ||||
| Family size | 0.002 | 0.011 * | 0.006 | |||
| (0.007) | (0.006) | (0.038) | ||||
| Labor force ratio | 0.149 ** | 0.079 | −0.538 | |||
| (0.067) | (0.059) | (0.361) | ||||
| Education of labor force | 0.055 *** | 0.070 *** | 0.638 *** | |||
| (0.014) | (0.012) | (0.080) | ||||
| Health of labor force | 0.028 ** | 0.010 | 0.045 | |||
| (0.012) | (0.011) | (0.067) | ||||
| Farmland area | 0.001 | 0.000 | −0.007 | |||
| (0.002) | (0.002) | (0.012) | ||||
| Car | 0.052 *** | 0.000 | 0.239 *** | |||
| (0.018) | (0.015) | (0.092) | ||||
| Poverty allowance | −0.036 | −0.169 *** | −0.054 | |||
| (0.044) | (0.038) | (0.241) | ||||
| _cons | 0.556 *** | 0.390 *** | 0.794 *** | 0.694 *** | −0.198 ** | −1.952 *** |
| (0.015) | (0.118) | (0.013) | (0.103) | (0.085) | (0.654) | |
| N | 907 | 907 | 907 | 907 | 907 | 907 |
| Log likelihood | −209.4 | −156.8 | −16.6 | 27.4 | −920.3 | −865.1 |
| Prob > Chi2 | 0 | 0 | 0 | 0 | 0 | 0 |
| Variables | Robustness Tests for Subsamples | Robustness Tests for Dependent Variable Replacement | |||||||
|---|---|---|---|---|---|---|---|---|---|
| Selection | Income | Security | Selection | Income | Security | Selection | Income | Security | |
| IDO | 0.109 *** | 0.085 *** | 0.328 *** | / | / | / | 0.733 | 0.236 *** | 0.953 *** |
| (0.026) | (0.021) | (0.119) | / | / | / | (0.722) | (0.066) | (0.212) | |
| UDO | / | / | / | −0.095 ** | −0.357 *** | 1.047 *** | −1.212 | −0.121 | 1.297 *** |
| / | / | / | (0.039) | (0.036) | (0.262) | (0.767) | (0.100) | (0.279) | |
| Control | YES | YES | YES | YES | YES | YES | YES | YES | YES |
| N | 585 | 585 | 585 | 627 | 627 | 627 | 907 | 907 | 907 |
| Log likelihood | −94.0 | 83.3 | −560.8 | −95.7 | −12.6 | −567.8 | −126.4 | / | −996.2 |
| Prob > Chi2(F) | 0.000 | 0.000 | 0.000 | 0.000 | 0.000 | 0.000 | 0.000 | 0.000 | 0.000 |
| Variables | Households with Different Income Levels | Households with Different Human Capital Endowments | ||||||
|---|---|---|---|---|---|---|---|---|
| Low-Income Group | Middle-Income Group | High-Income Group | Human Capital Quantity | Human Capital Quality | ||||
| Low-Quantity Group | High-Quantity Group | Low-Quality Group | High-Quality Group | |||||
| Selection | IDO | 0.108 * | 0.142 *** | 0.076 | 0.095 ** | 0.127 *** | 0.072 ** | 0.154 *** |
| (0.060) | (0.031) | (0.051) | (0.042) | (0.032) | (0.035) | (0.038) | ||
| UDO | −0.008 | −0.036 | −0.239 *** | −0.042 | −0.061 | −0.108 ** | −0.021 | |
| (0.073) | (0.041) | (0.071) | (0.056) | (0.042) | (0.046) | (0.050) | ||
| Control | YES | YES | YES | YES | YES | YES | YES | |
| N | 228 | 450 | 229 | 404 | 503 | 434 | 473 | |
| Prob > Chi2 | 0 | 0 | 0 | 0 | 0 | 0 | 0 | |
| Income | IDO | 0.176 *** | 0.058 ** | 0.020 | 0.109 *** | 0.054 ** | 0.062 ** | 0.098 *** |
| (0.067) | (0.023) | (0.045) | (0.038) | (0.026) | (0.030) | (0.033) | ||
| UDO | −0.238 *** | −0.343 *** | −0.444 *** | −0.245 *** | −0.366 *** | −0.368 *** | −0.300 *** | |
| (0.082) | (0.031) | (0.063) | (0.051) | (0.034) | (0.039) | (0.044) | ||
| Control | YES | YES | YES | YES | YES | YES | YES | |
| N | 228 | 450 | 229 | 404 | 503 | 434 | 473 | |
| Prob > Chi2 | 0 | 0 | 0 | 0 | 0 | 0 | 0 | |
| Security | IDO | 1.212 ** | 0.464 ** | −0.033 | 0.416 * | 0.260 * | 0.432 | 0.276 ** |
| (0.592) | (0.197) | (0.136) | (0.250) | (0.152) | (0.316) | (0.128) | ||
| UDO | 2.110 *** | 1.097 *** | 0.361 * | 1.358 *** | 0.695 *** | 1.418 *** | 0.707 *** | |
| (0.751) | (0.276) | (0.196) | (0.359) | (0.205) | (0.434) | (0.180) | ||
| Control | YES | YES | YES | YES | YES | YES | YES | |
| N | 228 | 450 | 229 | 404 | 503 | 434 | 473 | |
| Prob > Chi2 | 0.0001 | 0 | 0 | 0 | 0 | 0 | 0 | |
| Variables | Young Labor | Middle-Aged Labor | Elderly Labor | |||||
|---|---|---|---|---|---|---|---|---|
| Selection | Income | Security | Selection | Income | Security | Selection | Income | |
| IDO | 0.835 ** | 0.175 * | 2.194 ** | 0.804 *** | 0.456 *** | 2.462 *** | 0.631 *** | 0.206 *** |
| (0.407) | (0.105) | (0.878) | (0.212) | (0.114) | (0.759) | (0.245) | (0.073) | |
| UDO | 0.516 | −0.037 | 2.795 ** | 0.311 | 0.143 | 4.503 *** | −1.577 *** | −0.259 *** |
| (0.518) | (0.142) | (1.156) | (0.266) | (0.156) | (1.091) | (0.399) | (0.082) | |
| Control | YES | YES | YES | YES | YES | YES | YES | YES |
| N | 727 | 727 | 727 | 694 | 694 | 694 | 649 | 649 |
| Log likelihood | 0 | 0 | 0 | 0 | 0 | 0 | 0 | 0 |
| Prob > Chi2(F) | 0.0303 | 0.0868 | 0.0752 | 0.0867 | 0.2223 | 0.1708 | 0.1337 | 0.1444 |
Disclaimer/Publisher’s Note: The statements, opinions and data contained in all publications are solely those of the individual author(s) and contributor(s) and not of MDPI and/or the editor(s). MDPI and/or the editor(s) disclaim responsibility for any injury to people or property resulting from any ideas, methods, instructions or products referred to in the content. |
© 2023 by the authors. Licensee MDPI, Basel, Switzerland. This article is an open access article distributed under the terms and conditions of the Creative Commons Attribution (CC BY) license (https://creativecommons.org/licenses/by/4.0/).
Share and Cite
Tian, X.; Cai, Y.; Yang, Q.; Xie, J. How Do Heterogeneous Land Development Opportunities Affect Rural Household Nonfarm Employment: A Perspective of Spatial Regulation. Land 2023, 12, 907. https://doi.org/10.3390/land12040907
Tian X, Cai Y, Yang Q, Xie J. How Do Heterogeneous Land Development Opportunities Affect Rural Household Nonfarm Employment: A Perspective of Spatial Regulation. Land. 2023; 12(4):907. https://doi.org/10.3390/land12040907
Chicago/Turabian StyleTian, Xia, Yinying Cai, Qing Yang, and Jin Xie. 2023. "How Do Heterogeneous Land Development Opportunities Affect Rural Household Nonfarm Employment: A Perspective of Spatial Regulation" Land 12, no. 4: 907. https://doi.org/10.3390/land12040907
APA StyleTian, X., Cai, Y., Yang, Q., & Xie, J. (2023). How Do Heterogeneous Land Development Opportunities Affect Rural Household Nonfarm Employment: A Perspective of Spatial Regulation. Land, 12(4), 907. https://doi.org/10.3390/land12040907