Article

Determination of Soil Physical Properties and Pre-Sowing Irrigation Depth from Electrical Resistivity, Moisture, and Salinity Measurements

by
Christian Y. Cordero-Vázquez
1,
Omar Delgado-Rodríguez
1,*,
Rodolfo Cisneros-Almazán
2 and
Héctor J. Peinado-Guevara
3
1
División de Geociencias Aplicadas, Instituto Potosino de Investigación Científica y Tecnológica A.C., Camino a la Presa San José 2055, Lomas 4a Sección, San Luis Potosí 78216, Mexico
2
Facultad de Ingeniería, Universidad Autónoma de San Luis Potosí, Av. Dr. Manuel Nava 304, Zona Universitaria, San Luis Potosí 78210, Mexico
3
Facultad de Ciencias Económicas y Administrativas, Universidad Autónoma de Sinaloa, Juan de Dios Bátiz S/N, San Joachin, Guasave 81101, Mexico
*
Author to whom correspondence should be addressed.
Land 2023, 12(4), 877; https://doi.org/10.3390/land12040877
Submission received: 10 March 2023 / Revised: 9 April 2023 / Accepted: 12 April 2023 / Published: 13 April 2023

Abstract

:
Seeds require adequate soil moisture prior to planting, and pre-sowing irrigation depth (PSID) represents the optimum seed moisture level. This work proposes a new methodology to obtain soil physical properties and PSID, that includes the application of the electromagnetic profiling method (EMP) as a fast and non-invasive technique. Soil electrical resistivity measurements obtained from an EMP survey are combined with soil moisture and salinity information as experimental input for the PetroWin program. The PetroWin program uses Ryjov’s theoretical model to determine fines content and porosity, and then, PSID values are determined. At the study site, variations in soil resistivity were controlled by variations in fines content and soil moisture, and not by variations in soil salinity. The rooting depth of the crops was limited by a soil thickness of 0.6 m. A PSID between 8 and 9 cm was determined for the site, resulting in a total water volume required of 5313 m3 to ensure that soil moisture reaches the field capacity. The proposed methodology constitutes an effective and efficient tool for the determination of the physical properties and irrigation parameters of agricultural soils and, consequently, for the sustainable use of irrigation water.

1. Introduction

Agricultural activity consumes 70% of the water withdrawn in the world and it is expected that competition for water resources in this area will increase soon [1]. The use of water-optimizing irrigation techniques is essential to achieve sustainable agriculture, especially in arid and semiarid regions [2].
The variability observed in crops is the result of the complex interaction between various parameters such as soil texture, compaction, erosion, and the uneven application of fertilizer and irrigation [2,3]. Traditionally, to evaluate the characteristics of agricultural soils, soil samples are collected to determine properties based on chemical and textural analysis. More recently, indirect techniques such as Global Navigation Satellite Systems (GNSS), remote sensing with satellite imagery, and drones equipped with multispectral cameras [4,5,6,7,8] have been used to investigate the spatio-temporal variability of the factors that define the optimization of fertilizers and irrigation, thus reducing the environmental impacts of agricultural activity. These techniques and procedures are known as “Precision Agriculture”, where the challenge is the study and mapping of soil properties in the most accurate, fastest, and most economical way possible [9,10].
Recent advances in instrumentation have made geophysical methods a robust, cost-effective, and non-invasive tool for soil study. Agricultural geophysics is a set of non-invasive methods applied to obtain information on soil properties [11,12]. The two groups of geophysical methods most used for the implementation of precision agriculture are electrical (Electrical Resistivity Tomography, Electrical Profiling) and electromagnetic (Electromagnetic Profiling and Penetrating Radar), proving to be cost-effective for soil electrical resistivity mapping [13,14,15].
The electrical resistivity of soil depends on three main factors: soil texture, moisture, and salinity. The effectiveness of irrigation-water management depends on knowledge of the agricultural soil texture [16]. The content of fines particles and sand, and therefore the soil porosity, determines the water holding capacity. For a proper determination of the physical properties of the soil (fines content and porosity) based on its electrical resistivity, it is necessary to consider variations in the amount and salinity of pore water [17]. Tso et al. [18] demonstrated the inaccuracy of converting geoelectric sections obtained from the application of the Electrical Resistivity Tomography (ERT) method to moisture images, without considering other factors such as changes in texture and/or pore water salinity. Ozegin et al. [19] presented successful results on the application of the ERT method in the determination of chemical properties of agricultural soils. Correlation analyses between the results of chemical analyses performed on soil samples and geoelectric models were required for the estimation of soil chemical properties.
A theoretical model of the soil was reported by Ryjov and Shevnin [20] based on electrical conductivity (or its inverse, resistivity), considering both geometrical microstructure and electrochemical processes for wide ranges of moisture, pore water salinity, and clay concentrations. The theoretical soil model integrates the values of electrical resistivity, soil moisture and soil salinity obtained at a study site as input data to the PetroWin program, solving both the direct and inverse problems [20]. The solution of the forward problem consists of the calculation of soil resistivity values based on the properties of a poorly consolidated or unconsolidated formation (mixture of sand and fines). The solution of the inverse problem consists of estimating the fines content, porosity, and cation exchange capacity (CEC) from knowledge of the soil resistivity vs. pore water salinity. The PetroWin program was successfully used in Mexico for environmental impact studies of the oil industry. Delgado-Rodríguez et al. [21] developed a new methodology based on electrical measurements and Ryjov’s theoretical model to determine the geoelectric boundary between clean and hydrocarbon-contaminated soils [22,23,24,25].
Ryjov’s theoretical model, under the PetroWin program, was used in the study of agricultural soils for the first time by Delgado-Rodríguez et al. [26]. In a small plot located near the city of Oaxaca, Mexico, soil samples were collected to determine the fines content using two techniques: (1) by means of Ryjov’s model using soil electrical, salinity and, temperature measurements performed in a laboratory, and (2) the traditional Bouyoucos procedure, both results showing a good statistical correlation and giving reliability to Ryjov’s model. In addition, the resistivity sections, obtained from ERT surveys, were converted to fines content sections. In this case, the fines content sections showed fair correlation with the Bouyoucos results, due to the impossibility of obtaining reliable values of moisture and salinity for the entire soil profile. Both methods (electrical measurements on soil samples in the laboratory and ERT) are unsuitable for studying large extensions of agricultural soil due to their low efficiency. For the second experiment, the theoretical model was used for the study of a 10-ha agricultural plot, where the electrical profiling (EP) method was used to obtain the apparent resistivity values. In this case, as the EP method is faster than the ERT one, an important step forward was achieved in the application of Ryjov’s theoretical model in studies of larger plots sizes. The values of the fines content determined by the traditional Bouyoucos method and by Ryjov’s theoretical model, using the EP method, showed a coefficient of determination (R2) value of 0.91. Maps of the fines content, porosity and hydraulic conductivity were obtained [27]. In a third case study, the EP method was again applied on 20.6 ha distributed over three barley crop plots. The Ryjov theoretical model allowed CEC maps to be obtained. The behavior of the CEC in the three plots was consistent with crop yields since there was no irrigation system or fertilization activities [28].
The Ryjov theoretical model allows the estimation of soil physical properties without requiring direct measurements at the study site to calibrate results. The determination of the fines (and porosity) content is performed by integrating electrical resistivity, moisture, and salinity values as input data to the PetroWin program. No direct textural determinations performed on soil samples in the laboratory are required.
Damage to crops due to drought is considerable, while water resources are limited. Because of this, there is a need for proper irrigation strategies that include the use of optimal amounts of water. Seeds require adequate soil moisture prior to planting. Pre-sowing irrigation depth (PSID) is the irrigation lamina that ensures optimum moisture prior to planting for the effective rooting zone, reaching the soil at its field capacity.
In this work, fines content and soil porosity values are calculated from soil resistivity, moisture and salinity values using the PetroWin Program, and PSID is determined. The electromagnetic profiling (EMP) method, being a faster technique than the EP one, is applied to obtain the apparent electrical resistivity measurements of the soil. Soil moisture and salinity measurements are determined in situ and in the laboratory, respectively.

2. Materials and Methods

2.1. Study Site

For the application of the methods described previously, an area of study of 6 ha, split into five agricultural plots, was selected. The site is in the municipality of San Felipe, Guanajuato, Mexico (Figure 1), with a mean altitude of 2089 m.a.s.l. with predominantly Phaeozem and Luvisol soils [29].

2.2. Measurement of Soil Electrical Resistivity

The geoelectrical methods most used in soil studies are the EP and EMP methods. Now, the question arises: which electrical or electromagnetic method is more convenient for use in agricultural soil surveys? The EP method needs more instrumentation and accessories (cable reels, resistivity meter, and batteries) and requires the use of steel electrodes with good galvanic contact with the soil. The EMP method has the advantage of being faster than EP since no galvanic contact with the soil is needed; however, it is more sensitive to electromagnetic noise [30]. Plots may include a metallic pipeline irrigation system, which can affect an EMP survey; however, irrigation systems are commonly composed of HDPE pipes, which do not affect the electromagnetic measurements.
To perform an EMP survey, a transmitter and receiver coils are arrayed near the ground surface either in horizontal or vertical planes, operating into the low induction number. The electromagnetic signal of frequency f is directly detected as a primary magnetic field in the receiver coil. The alternating current generated in the transmitter coil induces currents in the subsurface, which in turn create a secondary magnetic field that is also detected in the receiver coil. The relationship between both magnetic fields (primary and secondary) in the receiver coil is given by the following equation [30]:
H s H p i   ω   μ 0   σ   S 2 4
where:
Hs = secondary magnetic field (A.m−1).
Hp = primary magnetic field (A.m−1).
ω = 2π f, where f = signal frequency (Hz).
μo = vacuum magnetic permeability (H.m−1).
σ = conductivity of the soil (S.m−1)
S = separation between receiver and transmitter coils (m).
i = 1
Soil is a heterogeneous medium consisting of solid material with pores, which are filled with water and air. Therefore, the soil conductivity value determined by the EMP method is called apparent conductivity. Apparent conductivity (σa) can be calculated using the following expression [30]:
σ a = 4 ω   μ 0   S 2 H s H p
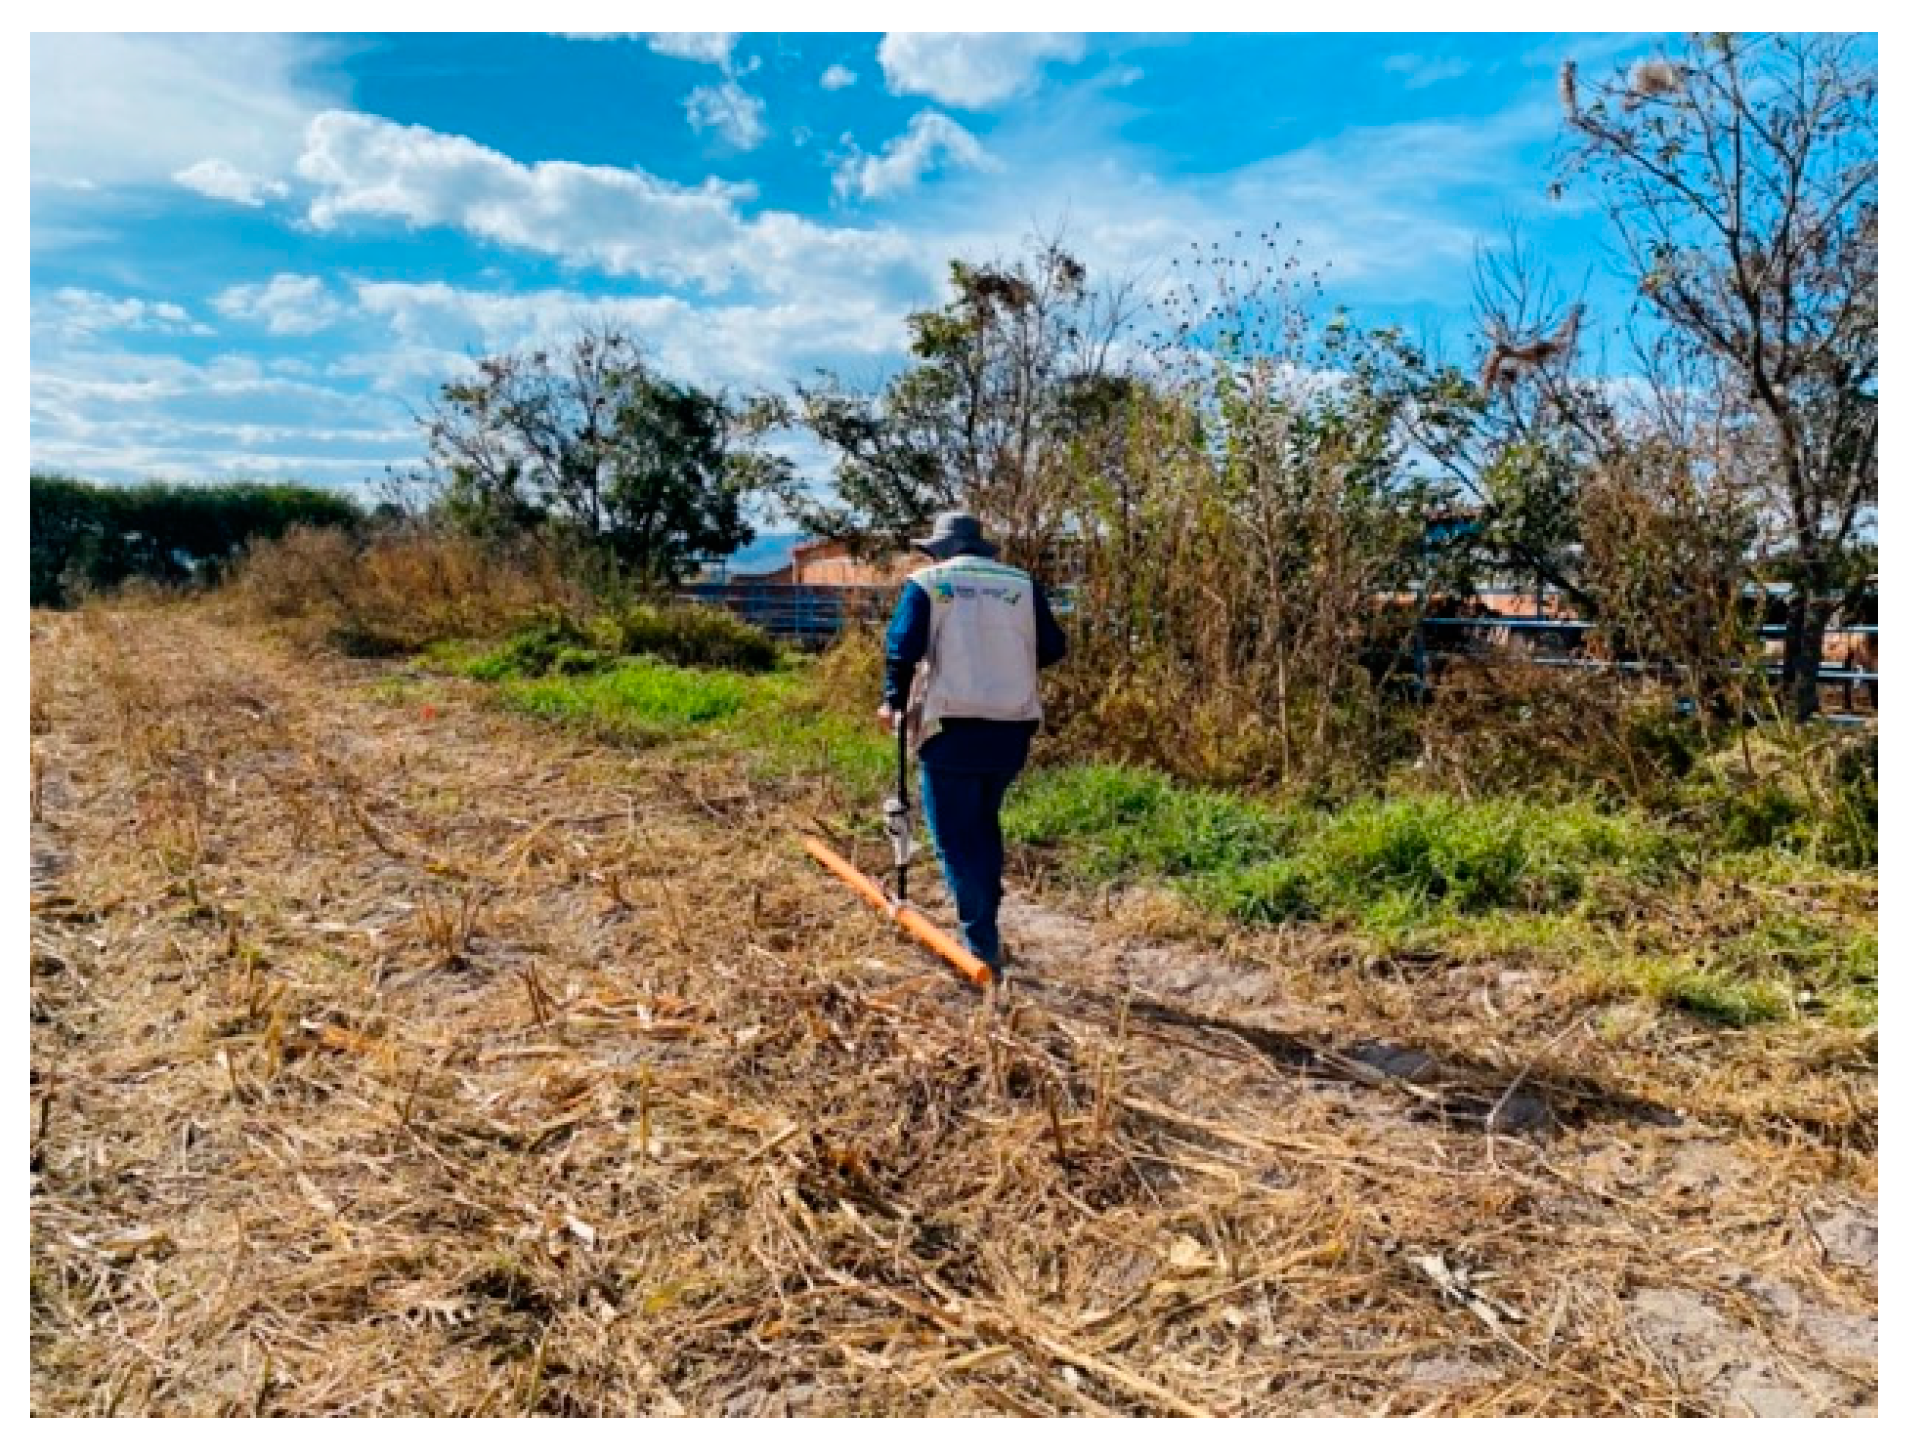
In this work, an EMP instrument was used for the resistivity survey. The CMD MiniExplorer 6L (GF Instruments, Brno, Czech Republic) is an EMP multifrequency instrument consisting of a probe with one transmitter coil (Tx) and six receiver coils (Rx) located at different separations (S) from Tx. A probe holder with a Bluetooth unit enables easy handling of the equipment (Figure 2). By using a control unit with Global Position System (GPS) (Figure 2), georeferenced σa values in mS.m−1 are obtained in both manual and automatic modes [31].
Different values of S and f allow six values of σa to be obtained simultaneously at the same point, using the Equation (2), for six different depths of study, and for each type of polarization of the electromagnetic field (Table 1).
Resistivity is the reciprocal of conductivity [32]. To facilitate the interpretation of the geoelectrical results, the σa values in mS.m−1 are converted into apparent resistivity values (ρa) in Ohm.m by: ρa = 1000/σa. However, it is necessary to make sure that the ρa value corresponds to the soil layer and does not include the contribution of the bedrock. Let us assume a geological medium with a soil thickness equal to h1 and resistivity ρ1, overlying a basement of resistivity ρ2. If the current flow injected at the surface reaches a study depth greater than h1, then the ρa value includes the contribution of ρ1 and ρ2. On the other hand, when the maximum study depth reached by the current flow does not exceed h1, the ρa value will be like ρ1 (soil electrical resistivity). Therefore, it is possible to use the EMP method to determine soil electrical resistivity if the agricultural soil thickness is greater than the study depth.
An important advantage of this EMP meter is the ability to convert a section of σa values obtained along a profile into a section of ρa values, resulting from the application of the ERT method in a Schlumberger array. The ρa section can be inverted into a section of true resistivities using the Res2DInv program [33], which can define the thickness of the agricultural soil. Hereafter, we will refer to the application of the ERT method from EMP measurements along a profile as the ERT-EMP method.
EMP measurements were performed in two ways: on routes and on profiles (Figure 3). The measurements on routes allowed the obtaining of σa values in an approximate grid of 10 × 10 m, facilitating the construction of the apparent resistivity maps. Automatic and geo-referenced measurements of σa on routes were performed in each agricultural plot of the site. Considering walking at an average speed of 5 km.h−1, an acquisition of conductivity measurement every 7 s was programmed, while the paths were separated by approximately 10 m to have an approximate data network of 10 m × 10 m.
Measurements of σa on profiles, with an approximate interval of 0.5 m, would allow the obtaining of two-dimensional resistivity sections through the ERT-EMP method. To determine the soil thickness at the study site, one ERT-EMP profile was performed on each plot.

2.3. Measurement of Soil Moisture and Salinity

The value of the electrical resistivity of the soil depends on its moisture, so simultaneous acquisition of both magnitudes is needed. Soil moisture measurements can be taken in situ using a soil moisture meter. In this work, moisture values were obtained using a Lutron PMS-714 meter with a 20 cm stainless steel probe. One hundred and ninety-four moisture measurements were obtained to create the soil moisture map.
Another factor that significantly influences the ρa value is soil salinity; just as in the case of moisture, soil salinity is inversely proportional to soil resistivity. Because of this, both magnitudes, salinity, and moisture, must be considered together with ρa to determine the physical properties of the soil. To determine soil salinity, the most frequent method used is the saturated paste extract. The application of this method requires that enough soil samples are collected to ensure an adequate mapping of the spatial variation of soil salinity. Forty-one soil samples were collected to determine soil salinity. Sample collection was carried out manually by digging a 0.3 × 0.3 m area to a depth of 0.4 m. Subsequently, at each sampling point, the collected soil was homogenized and quartered to take a soil sample of about 1 kg. Soil samples were air-dried, homogenized, and sieved at ≤2 mm. Subsequently, 100 mL of distilled water was added to 20 g of each soil sample and mixed properly [4]. Pore water was extracted by vacuum using a Kitazate flask, a Buchner funnel, and a Whatman No. 42 filter. Finally, electrical conductivity was measured using a Thermo Fisher Scientific digital multiparameter model calibrated at 25 °C and, consequently, the soil salinity was determined based on the electrical conductivity value.

2.4. Determination of Soil Physical Properties from Electrical Measurements Using the Ryjov´s Soil Model

Ryjov’s theoretical model includes the components of unconsolidated sediments and the estimation of the electrochemical resistivity of pore water, which allows the calculation of the resistivity of the rock [20]. This model is composed of hollow cylinder-like capillaries of different radii, forming an insulating structure. For the sand component, the insulating structure has wide pores, which prevent the effect of the electrical double layer (EDL). For the fines particulate component (clay and silt) the capillaries are narrow or very narrow and commensurate with the thickness of the EDL. EDL thickness is inversely proportional to pore water salinity. The bulk porosity of the soil sample is calculated considering the porosities of the sand and fines components. The bulk porosity φt of the soil can be determined by the following equations:
φt = (φsand − Cfines) + φfines Cfines, when Cfines < φsand
φt = Cfines φfines, when Cfines ≥ φsand
In case all capillaries are connected in parallel, the bulk conductivity of the soil (σt) can be simplified as follows:
σprl = σfinescap φfines Cfines + σsandcapsand − Cfines),
where σprl is the bulk conductivity of a soil with parallel connections of capillaries, Cfines is the volumetric fines content (clay + silt) in a sand-fines mixture, φsand is the porosity of the sand component, φfines is the porosity of the fines component, σfinescap is the electrical conductivity of the fines component, and σfinescap is the electrical conductivity of the sand component.
In the case of capillaries connected in parallel, σt is simplified to:
σser = [(1 − Cfinessand) (1/φsand σsandcap) + (Cfinessand) (1/φsand φfines σfinescap)],
In common cases of the presence of parallel and series connections in the same soil capillary system, σt is calculated according to:
σt = Mσprl + (1 − M) σser, when Cfines < φsand,
where M is a volumetric part of parallel capillaries and 1 − M is a volumetric part of serial capillaries.
When Cfines ≥ φsand, the σt is equal to:
σt = σfinescap Cfines φfines
This model is described in detail in [25].
The process of calculating the fines content and porosity of the soil is as follows. From apparent resistivity, soil moisture and salinity maps, a 10 m × 10 m grid value is defined as experimental input information for the PetroWin program [20].
By solving the forward problem, a grid of theoretical soil resistivity values like the experimental one is constructed, and the Root Mean Square Error (RMSE) between both sets of values is determined. An iterative process of minimization of the RMSE is performed using the PetroWin program. Finally, once the RMSE is minimized, the theoretical model is defined at each grid point, which allows the construction of the fines content and porosity maps of the site as a solution of the inverse problem.

2.5. Calculation of the Pre-Sowing Irrigation Depth (PSID)

For agricultural soils it is crucial to know the irrigation parameters that define the optimum water volume for healthy crop growth and soil conservation. Among these parameters are the following: Available Water (AW) content is the volume of pore water that is used by crops, Field Capacity (FC) is the superior limit of AW, this being the moisture after the soil is drained by gravity, and the Permanent Wilting Point (PWP) is the volume of pore water that is not usable by the plant. Once the soil moisture drops to the PWP, if water is not added to the soil the plant begins to wilt. The amount of soil water usable by the plant, which lies between the FC and PWP limits, up to the rooting depth, must then be provided before planting.
FC values were determined based on texture from the following equation [34]:
F C = 0.332 7.251 10 4 C s a n d + 0.1276 log 10 C f i n e s
The PWP is calculated using the equation [35]:
P W P = 5 + 0.74 F C
Mathematically, AW is the difference between FC and PWP.
Bulk density depends on the structural condition of the soil and is therefore considered a dynamic property. The bulk density of a soil sample is the weight of the sample divided by its bulk volume. The bulk density value is used to determine whether the soil porosity allows for storing the air and water necessary for root penetration and proper plant development [36]. Therefore, bulk density is also used to evaluate the compaction of agricultural soils and its negative effects on crop yields [37]. Brogowski et al. [38] describe procedures for calculating bulk density (δb) from soil porosity (θ), which is determined as a function of the particle size in the different textural fractions. In this work, the δb was calculated from soil porosity values determined using the PetroWin program, by means of the simplified relation [39]:
δ b = δ p θ δ p
where: δp is the average density of the soil particles equal to 2.63 g.cm−3 and θ is the soil porosity in percentage.
Finally, values of FC, PWP, δb and the rooting depth (RD) are used to calculate the PSID using the equation [40]:
P S I D = A W δ b R D 100

3. Results

3.1. ERT-EMP Results

Figure 4 shows the resistivity section obtained in the plot used for sweet sorghum crops (Figure 1) using the Res2DInv program [33]. A superficial layer of thickness between 0.3 and 0.6 m was found with a wide resistivity range between 80 and 250 Ohm.m. Underlying the resistive superficial layer, a second layer shows resistivity values varying between 35 and 80 Ohm.m, which corresponds to weathered tepetate. Finally, a rather homogeneous layer of resistivity values below 30 Ohm.m defines a conductive basement.
An excavation performed at X = 52 m of the profile (Figure 4B) shows a soil thickness of 0.6 m (topsoil, Figure 4A), over a fractured and weathered hardened conductive soil named tepetate (second layer, Figure 4A) as parent material. At a depth of 1 m, non-fractured tepetate is found (conductive basement, Figure 4A). For the other agricultural plots, similar results were obtained from ERT-EMP survey, and therefore a mean soil thickness of 0.6 m can be assumed for the study area.

3.2. Apparent Resistivity, Moisture, and Salinity Maps

At each measurement point, as mentioned above, the EMP device records six σa values corresponding to six different survey depths. Therefore, the measurements over routes generate six soil resistivity maps for maximum survey depth values between 0.3 m and 2.3 m (see Table 1). Which resistivity map adequately represents the variation of the true soil resistivity? The highest resistivity values are presented for the 0.3 m study depth (see Figure 4A). The shallowest part of the topsoil is frequently disturbed by agricultural tillage such as plowing. Consequently, the second maximum study depth, i.e., 0.5 m, was selected to obtain a reliable ρa map. At a greater survey depth (e.g., 0.8 m), the ρa values would be affected by weathered tepetate (Figure 4).
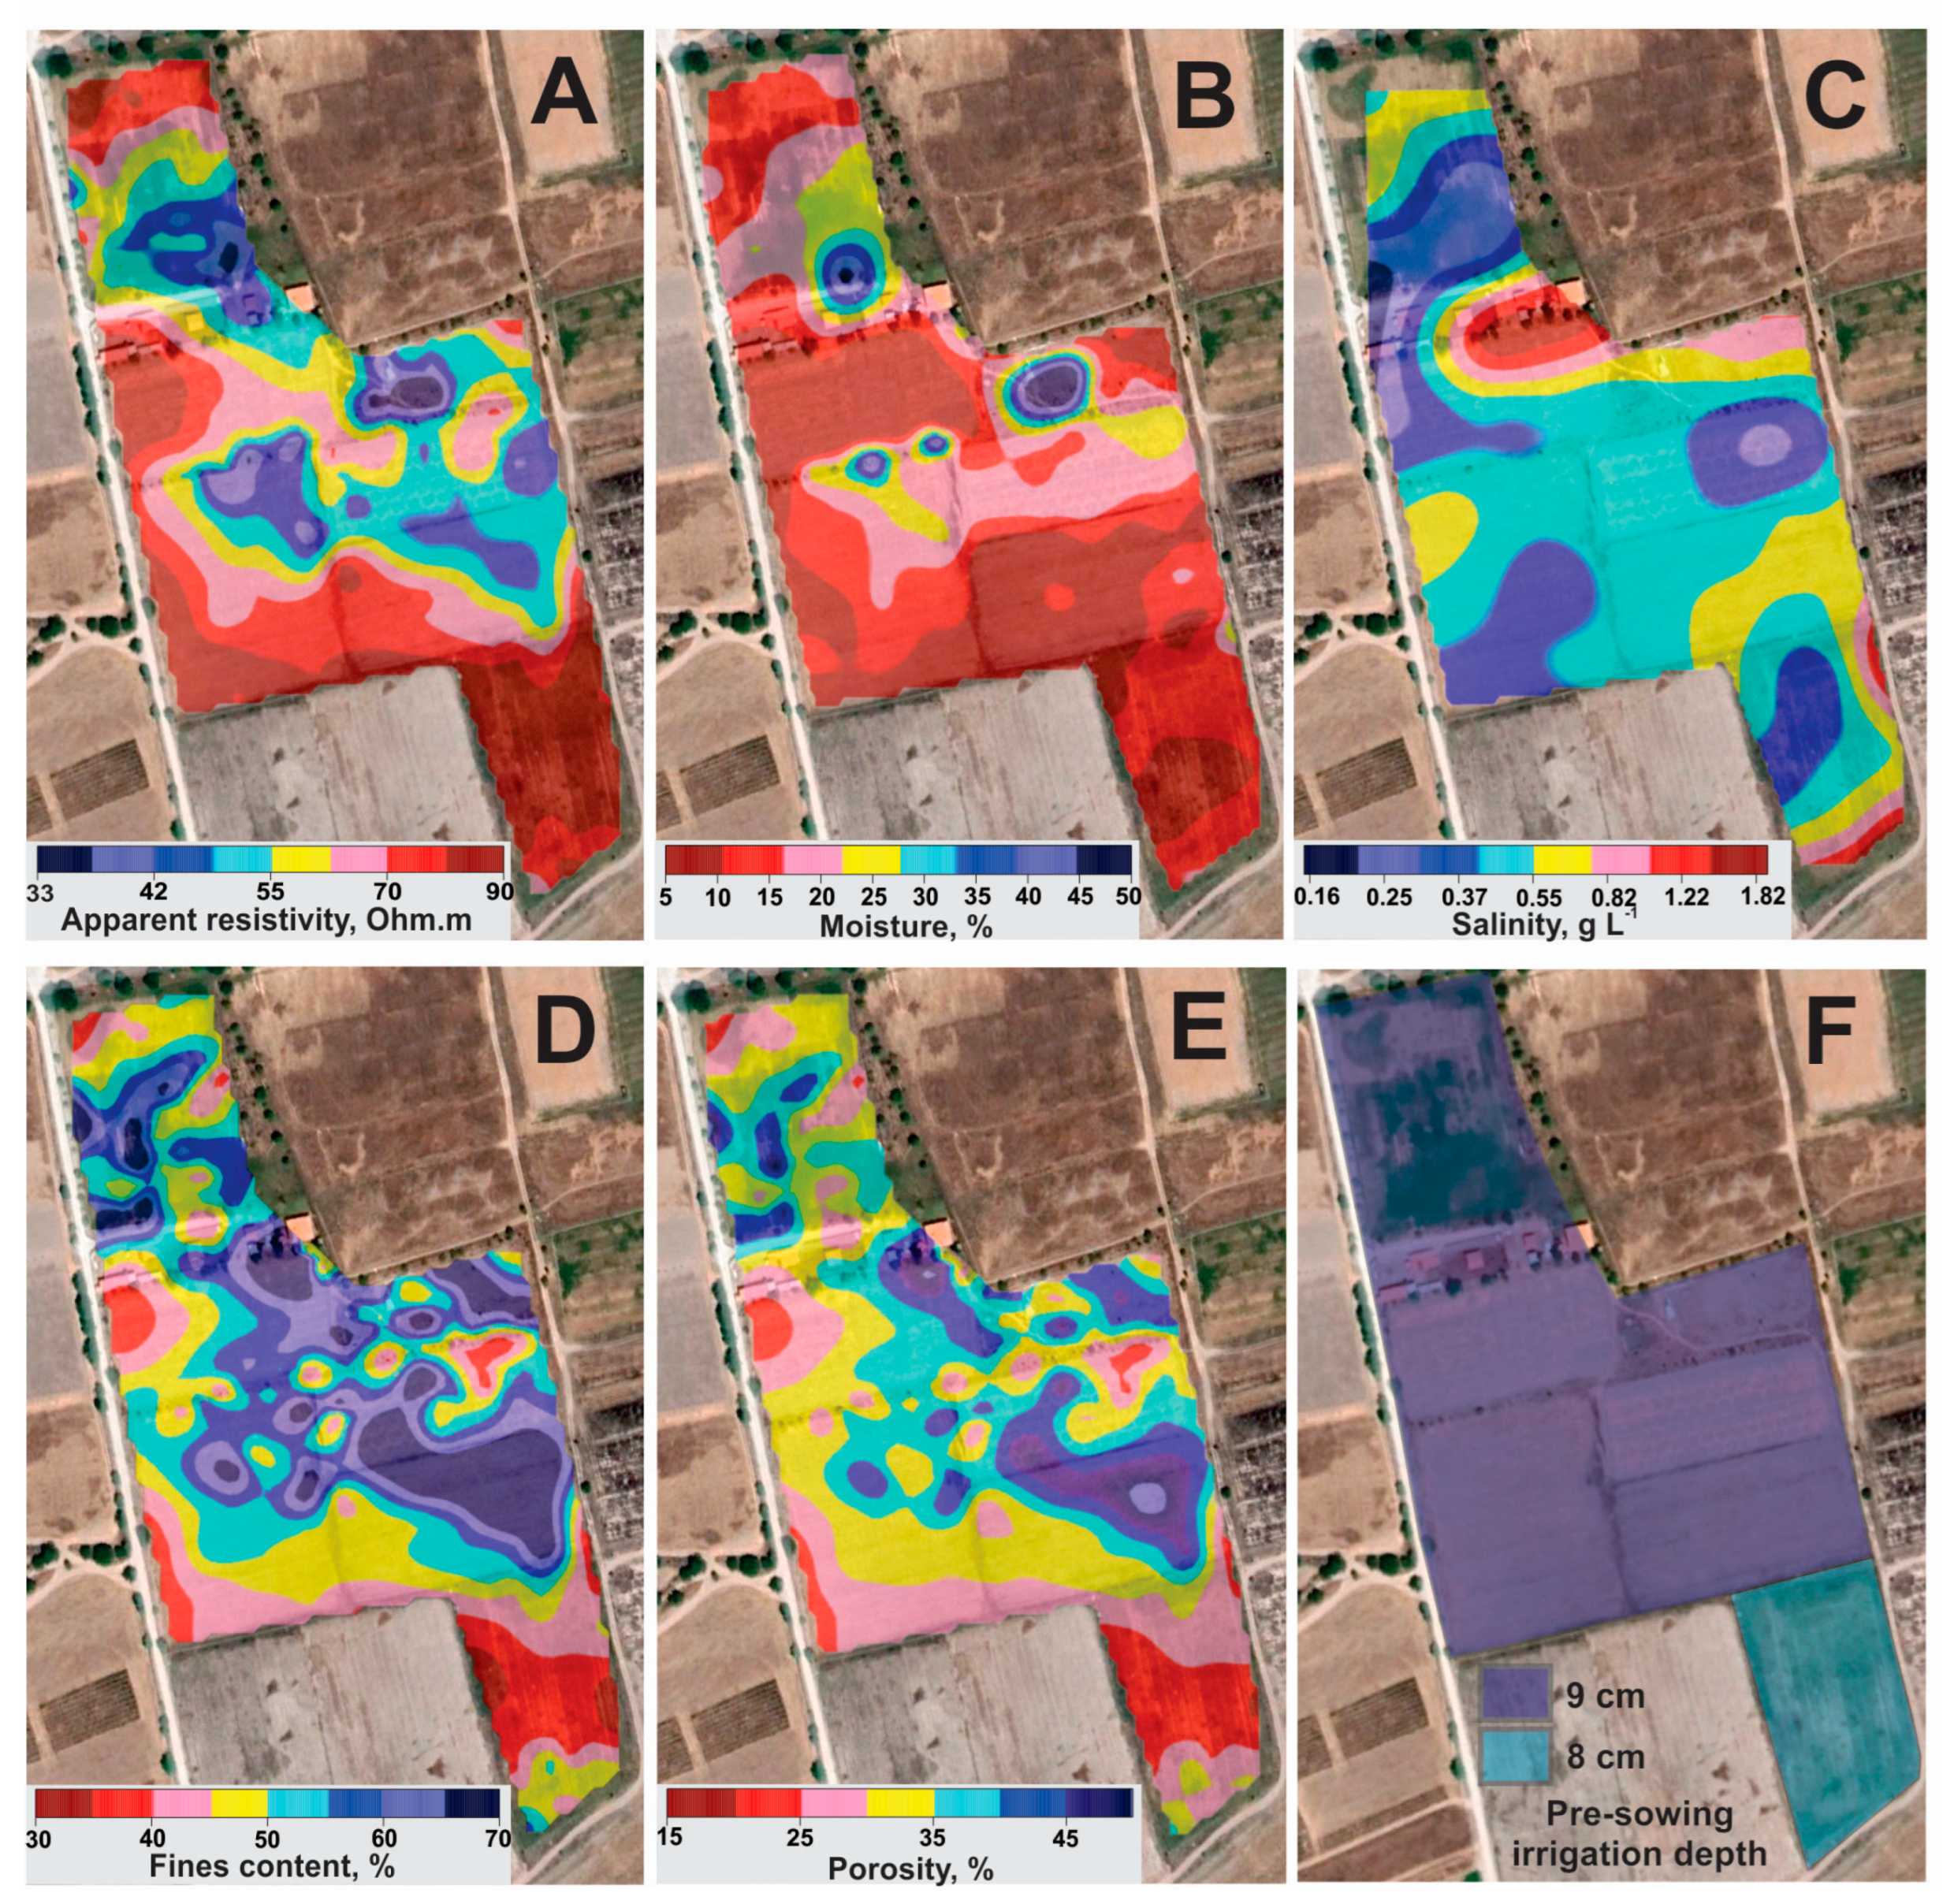
As a result of the EMP survey, an accurate soil resistivity map is shown in Figure 5A. Resistivity values between 55 and 90 Ohm.m predominate at the site, while some zones with resistivity values below 40 Ohm.m occur in the northern and central portions of the study area.
The moisture map is observed in Figure 5B. In general, the soil of the site is quite dry (moisture < 15%). Again, in the central and northern portion of the site, where water leakage from the irrigation system occurs, there are small areas with higher humidity, reaching values above 30%.
The soil salinity map obtained from the extract method is presented in Figure 5C. Soil salinity values in the range of 0.2 g·L−1 to 1.2 g·L−1 are shown (Figure 5C). High soil salinity limits crop yields. In general, soil salinity values do not exceed 0.7 g·L−1, so it is classified as soil unaffected by salinity. Only three sampling points in the south-eastern end of the site show slightly saline soil with values above 0.7 g·L−1 (Figure 5C).

3.3. Fines Content and Porosity Maps

The resistivity, moisture, and salinity maps shown in Figure 5A–C were used to create a data grid input for the PetroWin program [20], resulting in fines–content and porosity–values georeferenced data grids.
The soil fines content and porosity maps (Figure 5D,E) show a remarkable variability in soil texture. An increase in fines content (clay + silt) results in an increase in soil porosity. Furthermore, both fines content and soil porosity are inversely proportional to soil permeability.

3.4. Pre-Sowing Irrigation Depth (PSID)

The georeferenced database of fines content (Figure 5D) was used to calculate FC and PWP, using Equations (9) and (10), respectively. Bulk porosity ( δ b ) was determined using Equation (11) and the georeferenced database from the porosity map (Figure 5E). Finally, PSID values were calculated using Equation (12).
The distribution of the calculated PSID values delimit large and small areas of the same irrigation depth value, within the interval 7–9 cm. For practical purposes, in each agricultural plot the modal value was determined, resulting in the map in Figure 5F. Four plots have a value of PSID = 9 cm, while the plot located at the southern end of the study site requires a water sheet of 8 cm. Consequently, 5.13 ha requires an irrigation water volume of 4617 m3. The rest of the study site, 0.87 ha, requires an irrigation water volume of 696 m3.

4. Discussion

The electrical resistivity of the soil depends mainly on factors such as texture, moisture, and salinity. Electrical resistivity values were obtained rapidly by applying the EMP method. The PetroWin program performs the joint analysis of the electrical resistivity, moisture, and salinity values of the soil in a theoretical model to determine the physical properties of the soil, which in our case are fines content and porosity. In this way, textural analysis of soil samples for calibration purposes are not required.
In most of the study area, the soil has high resistivity values (ρa > 55 Ohm.m) (Figure 5A), coinciding with moisture values below 15% (Figure 5B). In addition, the low resistivity zones (Figure 5A) coincide with those areas where the moisture is higher than 20% (Figure 5B), highlighting the inversely proportional relationship between soil resistivity and moisture.
Furthermore, soil salinity values do not exceed 0.7 g·L−1, so it is classified as soil that is unaffected by salinity. Only three sampling points in the south-eastern end of the site show slightly saline soil with values higher than 1 g·L−1 (Figure 5C); therefore, we consider that variations in resistivity are controlled by variations in soil texture and moisture, and not by variations in soil salinity.
The fines content map (Figure 5D) shows the predominance of values between 30% and 60%. Very high values of fines content (>60%, Figure 5D) are not favorable for proper soil drainage, due to high pore-water absorption and low transmittance. This causes moisture, even if it remains for a long time, to be unavailable to the plants. The porosity map (Figure 5E) shows zones of high porosity in its central and northern portions. Porosity values between 35% and 45% indicate a predominance of clay in the fines component, as it is the soil with the lowest permeability.
According to the results presented in Figure 5F, 5313 m3 of water is needed to achieve the PSID, which ensures that soil moisture reaches the FC. PSID is the first irrigation necessary to start planting. Subsequently, successive irrigations at certain time intervals are necessary to restore the lost moisture, preventing the soil moisture level from dropping to the PWP. Therefore, considering evapotranspiration levels, a gross irrigation depth should be calculated to ensure that a net irrigation depth, equivalent to a fraction of the PSID, restores the soil moisture up to FC.
The methodology developed can be efficiently used in large agricultural soil extensions. The use of orthophotos and satellite images would allow the generation of moisture and salinity maps using a minimum of in situ measurements. The use of a vehicle with a system that allows the EMP meter to be towed will increase the efficiency in determining the soil ρa map.

5. Conclusions

The application of the EMP method, together with soil moisture and salinity information, constitutes an effective and efficient tool for the determination of physical properties and irrigation parameters for agricultural soils. The Ryjov theoretical model, implemented in the PetroWin program, uses soil resistivity, moisture, and salinity values to determine soil fines content and porosity.
In the study site, the observed variations in soil resistivity were controlled by variations in soil texture and moisture, and not by variations in soil salinity. Although this study has not considered volume losses due to evapotranspiration, PSID values provide optimum soil moisture prior to planting in the different crop plots, contributing to irrigation water savings.
The obtained results present an opportunity for the creation of a new methodology for the calculation of physical and irrigation parameters. The use of orthophotos and satellite images for the generation of moisture and salinity maps, as well as the incorporation of vehicles and dragging systems for resistivity survey, will considerably increase efficiency in the determination of the PSID in large extensions of agricultural soils.

Author Contributions

C.Y.C.-V. and O.D.-R. designed the experiment, performed the field measurements, processing and interpretation of the acquired data, and drafted the original manuscript. R.C.-A. and H.J.P.-G. reviewed and corrected the calculation processes of the soil parameters and assisted in drafting the manuscript. All authors have read and agreed to the published version of the manuscript.

Funding

This research received no external funding.

Data Availability Statement

The data used in this work are available on request from the corresponding author.

Acknowledgments

The authors thank to the staff of the Instituto Potosino de Investigación Científica y Tecnológica (IPICyT) for the operational support provided for this study. The authors are thankful to the three anonymous reviewers and the editor for providing suggestions and comments, which significantly improved the manuscript.

Conflicts of Interest

The authors declare no conflict of interest.

References

  1. Work Bank Group. World Development Report 2021: Data for Better Lives; World Bank Publications: Washington, DC, USA, 2021. [Google Scholar] [CrossRef]
  2. González-Trinidad, J.; Júnez-Ferreira, H.E.; Bautista-Capetillo, C.; Ávila Dávila, L. Robles Rovelo CO Improving the Water-Use Efficiency and the Agricultural Productivity: An Application Case in a Modernized Semiarid Region in North-Central Mexico. Sustainability 2020, 12, 8122. [Google Scholar] [CrossRef]
  3. Kitchen, N.R.; Clay, S.A. Understanding and Identifying Variability. In Precision Agriculture Basics; Kent, S., Clay, D.E., Kitchen, N.R., Eds.; Book Series: ASA, CSSA, and SSSA Books; American Society of Agronomy, Crop Science Society of America, and Soil Science Society of America: Madison, WI, USA, 2018; Chapter 2; pp. 13–24. [Google Scholar] [CrossRef]
  4. Wang, J.; Ding, J.; Yu, D.; Ma, X.; Zhang, Z.; Ge, X.; Teng, D.; Li, X.; Liang, J.; Lizaga, I.; et al. Capability of Sentinel-2 MSI data for monitoring and mapping of soil salinity in dry and wet seasons in the Ebinur Lake region, Xinjiang, China. Geoderma 2019, 353, 172–187. [Google Scholar] [CrossRef]
  5. Lu, F.; Sun, Y.; Hou, F. Using. UAV visible images to estimate the soil moisture of steppe. Water 2020, 12, 2334. [Google Scholar] [CrossRef]
  6. Zhuang, R.; Zeng, Y.; Manfreda, S.; Su, Z. Quantifying Long-Term Land Surface and Root Zone Soil Moisture over Tibetan Plateau. Remote Sens. 2020, 12, 509. [Google Scholar] [CrossRef] [Green Version]
  7. Bertalan, L.; Holb, I.; Pataki, A.; Négyesi, G.; Szabó, G.; Szalóki, A.K.; Szabó, S. UAV-based multispectral and thermal cameras to predict soil water content–A machine learning approach. Comput. Electron. Agric. 2022, 200, 107262. [Google Scholar] [CrossRef]
  8. Celik, M.F.; Isik, M.S.; Yuzugullu, O.; Fajraoui, N.; Erten, E. Soil Moisture Prediction from Remote Sensing Images Coupled with Climate, Soil Texture and Topography via Deep Learning. Remote Sens. 2022, 14, 5584. [Google Scholar] [CrossRef]
  9. Robert, P.C. Precision agriculture: A challenge for crop nutrition management. Plant Soil 2002, 247, 143–149. [Google Scholar] [CrossRef]
  10. Zhang, N.; Wang, M.; Wang, N. Precision agriculture-A worldwide overview. Comput. Electron. Agric. 2002, 36, 113–132. [Google Scholar] [CrossRef]
  11. Bitella, G.; Rossi, R.; Loperte, A.; Satriani, A.; Lapenna, V.; Perniola, M.; Amato, M. Geophysical Techniques for Plant, Soil, and Root Research Related to Sustainability. In The Sustainability of Agro-Food and Natural Resource Systems in the Mediterranean Basin; Vastola, A., Ed.; Springer: Cham, Switzerland, 2015. [Google Scholar] [CrossRef] [Green Version]
  12. Romero-Ruiz, A.; Linde, N.; Keller, T.; Or, D. A review of geophysical methods for soil structure characterization. Rev. Geophys. 2019, 56, 672–697. [Google Scholar] [CrossRef] [Green Version]
  13. Corwin, D.L.; Lesch, S.M. Application of soil electrical conductivity to precision agriculture. Agron. J. 2003, 95, 455–471. [Google Scholar] [CrossRef]
  14. Allred, B.J.; Freeland, R.S.; Farahani, H.J.; Collins, M.E. Agricultural Geophysics: Past, Present, and Future. In 23rd EEGS Symposium on the Application of Geophysics to Engineering and Environmental Problems; European Association of Geoscientists & Engineers: Las Vegas, NV, USA, 2010. [Google Scholar] [CrossRef]
  15. Algeo, J.; Van Dam, R.L.; Slater, L. Early-time GPR: A method to monitor spatial variations in soil water content during irrigation in clay soils. Vadose Zone J. 2016, 15, 1–9. [Google Scholar] [CrossRef] [Green Version]
  16. Vories, E.; O’Shaughnessy, S.; Sudduth, K.; Evett, S.; Andrade, M.; Drummond, S. Comparison of precision and conventional irrigation management of cotton and impact of soil texture. Precis. Agric. 2021, 22, 414–431. [Google Scholar] [CrossRef]
  17. Garré, S.; Hyndman, D.; Mary, B.; Werban, U. Geophysics conquering new territories: The rise of “agrogeophysics”. Vadose Zone J. 2021, 20, e20115. [Google Scholar] [CrossRef]
  18. Tso, C.-H.M.; Kuras, O.; Binley, A. On the field estimation of moisture content using electrical geophysics: The impact of petrophysical model uncertainty. Water Resour. Res. 2019, 55, 7196–7211. [Google Scholar] [CrossRef]
  19. Ozegin, K.O.; Salufu, S.O. Electrical Geophysical method and GIS in Agricultural Crop Productivity in a Typical Sedimentary Environment. NRIAG J. Astron. Geophys. 2022, 11, 69–80. [Google Scholar] [CrossRef]
  20. Ryjov, A.; Shevnin, V. Theoretical calculation of rocks electrical resistivity and some examples of algorithm’s application. In Proceedings of the 15th EEGS Symposium on the Application of Geophysics to Engineering and Environmental Problems, Las Vegas, NV, USA, 10–14 February 2002; EAGE: Las Vegas, NV, USA, 2002. [Google Scholar] [CrossRef]
  21. Delgado-Rodríguez, O.; Shevnin, V.; Peinado-Guevara, H.; Ladrón-de-Guevara-Torres, M.A. Characterization of Hydrocarbon-Contaminated Sites Based on Geoelectrical Methods of Geophysical Exploration. In Book Geophysics; Okiwelu, A., Ed.; InTechOpen: London, UK, 2018; Chapter 5; pp. 85–93. [Google Scholar] [CrossRef] [Green Version]
  22. Shevnin, V.; Delgado-Rodríguez, O.; Mousatov, A.; Ryjov, A. Soil resistivity measurements for clay content estimation and its application for petroleum contamination study. In Proceedings of the 17th EEGS Symposium on the Application of Geophysics to Engineering and Environmental Problems, Colorado Springs, CO, USA, 22–26 February 2004; EAGE: Colorado Springs, CO, USA, 2004; pp. 396–408. [Google Scholar]
  23. Shevnin, V.; Delgado-Rodríguez, O.; Mousatov, A.; Flores-Hernández, D.; Zegarra-Martínez, H.; Ryjov, A. Estimation of soil petrophysical parameters from resistivity data: Application to oil-contaminated site characterization. Geofis. Int. 2006, 45, 179–193. [Google Scholar] [CrossRef]
  24. Shevnin, V.; Delgado-Rodríguez, O.; Mousatov, A.; Ryjov, A. Estimation of hydraulic conductivity on clay content in soil determined from resistivity data. Geofis. Int. 2006, 45, 195–207. [Google Scholar] [CrossRef]
  25. Shevnin, V.; Mousatov, A.; Ryjov, A.; Delgado-Rodríguez, O. Estimation of clay content in soil based on resistivity modeling and laboratory measurements. Geophys. Prospect. 2007, 55, 265–275. [Google Scholar] [CrossRef]
  26. Delgado-Rodríguez, O.; Ladrón-de-Guevara-Torres, M.A.; Shevnin, V.; Ryjov, A. Estimation of soil petrophysical parameters based on electrical resistivity values obtained from lab and in-field measurements. Geofis. Int. 2012, 51, 5–15. [Google Scholar] [CrossRef]
  27. Gastélum-Contreras, A.K.; Espinoza-Ortiz, M.; Peinado-Guevara, H.J.; Delgado-Rodríguez, O.; Ladrón de Guevara, M.; Peinado-Guevara, V.M. Using electrical profiling to determine soil petrophysical parameters in an agricultural field. Pol. J. Environ. Stud. 2017, 26, 1077–1087. [Google Scholar] [CrossRef]
  28. Cordero-Vázquez, C.Y.; Delgado-Rodríguez, O.; Peinado-Guevara, H.J.; Ladrón-de-Guevara-Torres, M.; Hernández-Ramos, J.O.; Peinado-Guevara, V.M. Determination of soil properties from electrical measurements in agricultural plots, Villa de Arriaga, San Luis Potosí, Mexico. Geofis. Int. 2021, 60, 76–100. [Google Scholar] [CrossRef]
  29. INEGI. Summary on Municipal Geographic Information of the United Mexican States: San Felipe, Guanajuato; Instituto Nacional de Estadística y Geografía: Guanajuato, Mexico, 2009; Available online: https://docplayer.es/38475767-Prontuario-de-informacion-geografica-municipal-de-los-estados-unidos-mexicanos-san-felipe-del-progreso-mexico-clave-geoestadistica-15074.html (accessed on 10 February 2023).
  30. McNeill. Electromagnetic terrain conductivity measurements at low induction numbers. In Technical Note TN-6; Geonics Limited: Mississauga, ON, Canada, 1980; Available online: http://www.geonics.com/pdfs/technicalnotes/tn6.pdf (accessed on 25 January 2023).
  31. Gf Instruments, S.R.O. Electromagnetic Conductivity Meters for Multi-Layer Survey. 2020. Available online: http://www.gfinstruments.cz/version_cz/downloads/CMD_2020.pdf (accessed on 25 January 2023).
  32. Kearey, P.; Brooks, M.; Hill, I. An Introduction to Geophysical Exploration, 3rd ed.; Blackwell Science Ltd.: Hoboken, NJ, USA, 2002. [Google Scholar]
  33. Loke, M.H.; Barker, R.D. Rapid least-squares inversion of apparent resistivity pseudosections using a quasi-Newton method. Geophys. Prospect. 1996, 44, 131–152. [Google Scholar] [CrossRef]
  34. Saxton, K.E.; Rawls, W.J.; Romberger, J.S.; Papendick, R.I. Estimating generalized soil-water characteristics from texture. Soil Sci. Soc. Am. J. 1986, 50, 1031–1036. [Google Scholar] [CrossRef]
  35. Silva, A.; Ponce de León, J.; García, F.; Artigas, D. Methodological aspects in the determination of the water holding capacity of soils in Uruguay. In Boletín de Investigación 10; Facultad de Agronomía, Universidad de la República: Montevideo, Uruguay, 1988; Available online: https://www.colibri.udelar.edu.uy/jspui/bitstream/20.500.12008/31373/1/boletin_de_investigacion_1988_10.pdf (accessed on 10 February 2023).
  36. Chaudhari, P.R.; Ahire, D.V.; Ahire, V.D.; Chkravarty, M.; Maity, S. Soil bulk density as related to soil texture, organic matter content and available total nutrients of coimbatore soil. IJSRP 2013, 3, 1–8. Available online: https://www.ijsrp.org/research-paper-0213/ijsrp-p1439.pdf (accessed on 13 February 2023).
  37. Lestariningsih, I.D.; Widianto Hairiah, K. Assessing Soil Compaction with Two Different Methods of Soil Bulk Density Measurement in Oil Palm Plantation Soil. Procedia Environ. Sci. 2013, 17, 172–178. [Google Scholar] [CrossRef] [Green Version]
  38. Brogowski, Z.; Kwasowski, W.; Madyniak, R. Calculating particle density, bulk density, and total porosity of soil based on its textura. Soil Sci. Ann. 2014, 65, 139–149. [Google Scholar] [CrossRef] [Green Version]
  39. Richards, L.A. Diagnosis and improvement of saline and alkali soils. In United States Department of Agriculture. Agriculture Handbook 60; U.S. Government Printing Office: Washington, DC, USA, 1954. Available online: https://www.ars.usda.gov/ARSUserFiles/20360500/hb60_pdf/hb60complete.pdf (accessed on 12 February 2023).
  40. Quimbita, W.; Toapaxi, E.; Llanos, J. Smart irrigation system considering optimal energy management based on model predictive control (MPC). Appl. Sci. 2022, 12, 4235. [Google Scholar] [CrossRef]
Figure 1. Study area of 6 ha split into five agricultural plots. A small area not used to crop is separated by dashed red lines.
Land 12 00877 g001
Figure 2. CMD MiniExplorer 6L meter including probe with one Tx coil and six Rx coils, probe holder with a Bluetooth unit and control unit with GPS.
Land 12 00877 g002
Figure 3. Electrical conductivity survey using the EMP meter on route or on profile.
Land 12 00877 g003
Figure 4. (A) Resistivity section from ERT-EMP procedure obtained in the plot used for sweet sorghum crops. (B) Soil profile observed near to profile ERT-EMP.
Land 12 00877 g004
Figure 5. (A) soil apparent resistivity, (B) moisture, (C) salinity (D) fines content, (E) porosity and (F) PSID maps.
Land 12 00877 g005
Table 1. Maximum study depths reached by CMD MiniExplorer 6L meter for the different separations (S) between Tx and Rx coils. VP = Vertical Polarization, HP = Horizontal Polarization.
Depth VP/Depth HPS
0.30/0.15 m0.20 m
0.50/0.25 m0.33 m
0.80/0.40 m0.50 m
1.10/0.50 m0.72 m
1.60/0.80 m1.03 m
2.30/1.10 m1.50 m
Disclaimer/Publisher’s Note: The statements, opinions and data contained in all publications are solely those of the individual author(s) and contributor(s) and not of MDPI and/or the editor(s). MDPI and/or the editor(s) disclaim responsibility for any injury to people or property resulting from any ideas, methods, instructions or products referred to in the content.