Abstract
Because the relationship between cultivated land and the surrounding land types is not taken into account, there existed a deviation in the assessment of cultivated landscape ecological security. A novel methodology assessing the cultivated landscape ecological security is presented in this study, in the grid scale adjusted cultivated landscape ecological security index by the cultivated land disturbance index and the surrounding environment index. This method was applied in Xintai City, Shandong Province. The results demonstrate that (1) between 1985 and 2015, there was a constant loss of 173.2 km2 cultivated land, the bulk of which was converted to building land, primarily on the outskirts of cities. (2) The landscape ecological security of cultivated land has decreased; the bulk of high-risk grids are located in central metropolitan areas and mining districts, and have a tendency to spread out over time. (3) We applied a three–dimensional model to generate a spatial combination of cultivated land and presented zoning suggestions for regional cultivated land use and management. This assessment technique reduces errors that may occur when relying solely on landscape features for cultivated ecological security evaluation. The evaluation’s results more accurately reflect the impact of human activity and urban growth, are more consistent with local features, and have a higher quality of reference value.
1. Introduction
Cultivated land provides food and essential resources for humans, making it a crucial component of food security and human livelihood. However, over the past half-century, rapid industrialization and urbanization have led to the expansion of construction land, resulting in the steady erosion of prime cultivated land surrounding cities. This trend has caused fragmentation of cultivated land and changes in landscape patterns, leading to a decrease in the quantity of available land for cultivation [1,2]. Changes in industrial structure and agricultural workforce have led to the abandonment of a significant amount of cultivated land [3], which poses a serious threat to food security [4]; additionally, the high intensity of cultivated land use has demolished the soil function of the cultivated land, preventing its sustainable use [5,6,7]. Conservation of cultivated land has long been a concern for all governments across the world. Several countries, including China, have implemented various measures to protect cultivated land, on the one hand by legislating to restrict the occupation and reduction of cultivated land, and on the other hand by clearing forest and grassland to replenish the amount of cultivated land, but these measures have resulted in a conflict between ecological protection and agricultural production [8], which is not conducive to the sustainability of the ecosystem’s development [5,9,10]. At the same time, restored cultivated land often performs less efficiently in terms of production compared to original cultivated land due to its lower quality. In China, the importance of cultivated land fragmentation for agricultural production is gradually being acknowledged and therefore the negative effects of cultivated land fragmentation are being mitigated through land transfer, intensive management and land consolidation [11].
Studies show that landscape changes can depict the morphology of the land as well as the conditions under which its resources are used [12,13]. The ecological security of various types of landscapes, such as cities [14], wetland [15], river basin [16], and nature reserves [17], has been studied and demonstrated by domestic scholars. The methods used mainly include comprehensive index analysis [18], hierarchical analysis [19], principal component projection [20], and PSR (pressure–state–response) model [21], etc. By applying theoretical approaches related to landscape ecological security to cultivated landscapes, in addition to being able to quantify the dynamics of landscape patterns on cultivated land, the structural composition and spatial relationships of the landscape can also be clearly depicted [10,22,23,24]. For a long time, researchers in this field have been striving to develop a reliable method for assessing the security of cultivated land [25]. Application of these theories and methods to cultivated landscapes can be further used to evaluate the cultivated landscape ecological security [7]. Some scholars have conducted research on the subject. Turner and Gardner offered techniques for analysing cultivated landscapes in detail and claim that long–term anthropogenic disturbance complicates the structure of regional landscapes, i.e., that disturbance from human activities diminishes the security of cultivated landscapes [1]. Pei et al. assessed the security of cultivated landscapes in Chinese coastal cities [20]. Inkoom et al. used numerous landscape indicators to analyse the possible dangers in heavily anthropogenic dominated cultivated landscapes in the Sudanese savannah area [26]. Peng et al. established a landscape ecological security evaluation model for cultivated land based on the landscape ecological security theory by selecting a landscape index and analysing its evolution process [27]. By presenting basic methodologies and concepts based on landscape patterns, these works have enhanced the theoretical and methodological framework of cultivated landscape ecological security evaluation.
However, as cultivated land is an open system that interacts with other types of land, its ecological security is often underestimated in assessments that focus solely on cultivated landscape indicators [24,28]. Moreover, the topographic characteristics of the region can affect the accuracy of the cultivated landscape ecological security evaluation [29]. To ensure the precision of the results, it is crucial to examine the ecological security of cultivated landscapes in conjunction with the surrounding land types and the interactions between them. To address regional problems in cultivated landscapes, it is essential to analyse the security pattern and evolution of the cultivated system. This study proposes an adjusted assessment methodology for evaluating landscape ecological security of cultivated land by taking into account the relationship between cultivated lands and surrounding land types. Xintai city in Shandong Province is utilised as a validation case to demonstrate the method’s dependability. In 2011, Xintai was designated a resource-depleted city. As the core area of the industrialisation process, the city’s rapid urban development and frequent mining operations have accelerated the disturbance of cultivated land, putting a double strain on the region’s food security [30]. Examining the effects of resource-based urban development on cultivated land is critical in this context. This research holds both theoretical and practical significance, as it can inform the development of regional strategies for the optimal use of cultivated land, ultimately supporting agricultural modernization and ensuring food security.
2. Theoretical Framework
Cultivated land is the outcome of human intervention and utilization of natural land cover for agricultural production [31]. It serves as an artificial ecosystem that connects people to nature and is shaped by both human activities and the environment [5,6,10]. As human civilization developed and industrial structures changed, agricultural production zones became condensed, and the proportion of agricultural production decreased. This led to a significant shift in the population, with many people involved in agriculture relocating to cities, causing an abrupt increase in urban populations and city expansion [28,32,33]. However, this shift has had negative consequences for the quality of cultivated land. The use of chemical fertilizers and pesticides, intense human use of cultivated land, and technical improvements have all contributed to a decline in the quality of the soil and the environment [25,27,34]. The threats to cultivated land are summarised in the following four aspects: (1) Cultivated land conversion: due to land occupancy for development, China loses up to 2.5–2.8 million acres of cultivated land per year, mostly in peri–urban areas. This process is irreversible [6,11,35]. (2) Cultivated land non-grainization: as living standards rise and the populations’ food needs to diversify, farmers are willing to plant increasingly valuable fruits, vegetables, and cash crops instead of grain, and a sizeable portion of cultivated land is losing its ability to produce grain [12,32]. (3) Fragmentation: high-quality cultivated land cannot be centralized in distribution due to the construction of industrial facilities and highways, because it is fragmented and cannot be scaled for crop cultivation. This leads to higher management costs [32,33,36]. (4) Marginalisation: particularly in mountainous and hilly regions where topographical defects result in inadequate mechanisation and large abandonment of cultivated land to forestry, there is not enough cultivated land to meet the needs of the population [6,12]. The interaction of cultivated land with surrounding land types is a clear manifestation of the problems associated with land use, which involves the process of transferring cultivated land to and from other land types, is the most obvious outward manifestation of these problems [1,37,38]. Examples include the interconversion of cultivated land and forests, utilised land and water, and the occupancy of cultivated land by construction and infrastructure. The basis of the security of cultivated land and the assurance of food security among these is the amount of cultivated land; the availability of cultivated land has a direct impact on food production. The more cultivated land that is available, the greater the potential for food output. However, it is important to note that other factors, such as soil fertility, access to water, and appropriate agricultural practices, also play a significant role in determining food production levels [22,39,40]. The landscape pattern of cultivated land also indicates the extent and availability of intensive and mechanised agricultural production. When cultivated land is clustered and contiguous, it tends to facilitate a higher degree of mechanization and more efficient production. This is because mechanized farming techniques often require large, uniform plots of land that can be easily accessed by machinery. The correlation between the complexity of the terrain surrounding a field and the likelihood of farmland conversion highlights the potential risk of agricultural land being converted for other uses. As the surrounding land use becomes more intricate, the challenges of cultivating crops or raising livestock increase, making it more attractive for landowners to sell or lease their land for non-agricultural purposes. Therefore, changes in cultivated land area, cultivated landscape pattern, and cultivated land surroundings all pose security risks to cultivated landscape (Figure 1).
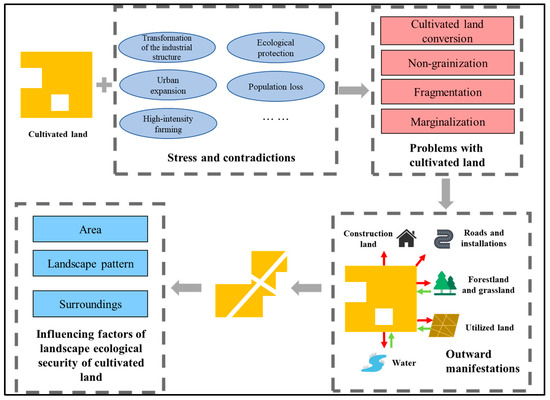
Figure 1.
Cultivated landscape security Theoretical framework.
3. Materials and Methods
3.1. Study Area Overview
In this study, Xintai City, Shandong Province was selected as the study area to apply and validate the evaluation method. Xintai is a county-level city located in the middle of Shandong Province, between latitude 35°37′–36°07′ N and longitude 117°16′–118° E (Figure 2). The city has a total land area of 1946 km2 and is 68 km long from east to west and 53 km long from north to south. It is a typical agricultural, forestry, and mining city with a diversified topography that includes steep hills in the north, east, and south, flat terrain in the middle, and a river depression plain in the west. Mining activity has lasted almost fifty years, dating back to the 1970s. In 2011, it was identified as a resource-depleted city need transformation development. Figure A1 illustrates that the percentage of primary industries is decreasing, the proportion of secondary industries is increasing and then decreasing, and the percentage of tertiary industries is steadily rising, demonstrating a clear pattern of transition. The need to safeguard cultivated land has increased as a result of mines, urbanisation, and the need to preserve forests.
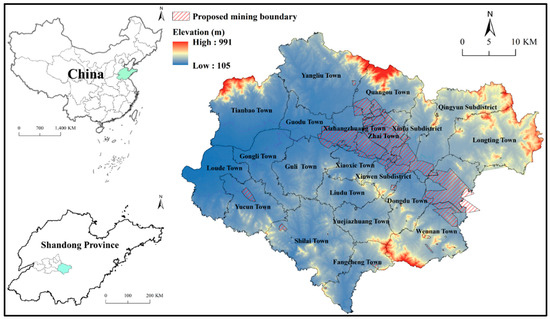
Figure 2.
Location and overview of the study area.
3.2. Data Source and Processing
The USGS Landsat Thematic Map (TM) and Operational Land Imager (OLI) images data were used in this study to provide land use data for four time periods (1985, 1995, 2005, and 2015), which covered the stages of resource-based cities’ expansion. Radiometric calibration, atmospheric correction, and geometric correction were applied to all images. Land use was classified into five types: cultivated land, forestland and grassland, water, utilized land and construction land. Land-use classification was performed by ENVI 5.2 software, while field surveys, historical records and Google Earth maps were used to verify, correct and settle the land-use maps. The interpreted precision for 1985, 1995, 2005, and 2015, respectively, was 90.1%, 90.8%, 91.6%, and 92.4%, which fulfilled the study’s standards. The Shandong Provincial Planning and Design Institute provided the statistics and vector boundary data (Table 1).

Table 1.
Data categories and sources.
3.3. Methods
3.3.1. Determine the Evaluation Grid Scale
In this study, the regional cultivated landscape security index was calculated by grid. To minimize the effect of scale on evaluation results, the mean and standard deviation of the Shannon index was used to calculate the best scale of the regional grid, which was 1.2 km in this region, and 1463 grids were constructed in total (Figure A2).
3.3.2. Landscape Ecological Security of Cultivated Land Evaluation Method
Figure 3 depicts the adjusted landscape ecological security of cultivated land evaluation method, which is based on the landscape ecological security (LES), and is modified by the cultivated disturbance index (DI) and the cultivated surrounding index (CSI).
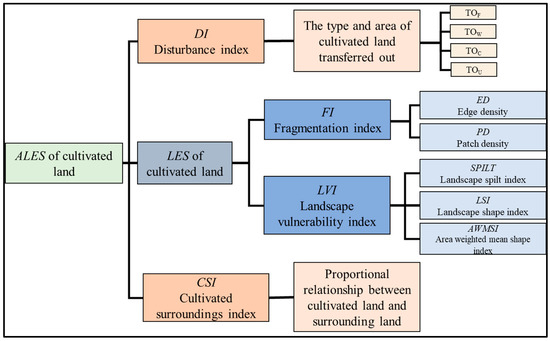
Figure 3.
The conceptual framework for the ALES assessment of cultivated land.
The DI measures the extent of cultivated land that has been converted to other land-use types within each assessment grid during a specific time period. A higher value implies a greater degree of cultivated land disturbance, i.e., a higher risk to the landscape ecological security of cultivated land. CSI is indicated by the ratio of cultivated land to other land types in the grid. A smaller proportion of cultivated land in a grid indicates a higher potential risk of conversion to other land uses. Therefore, a higher CSI value signifies a greater susceptibility of cultivated land to conversion and a higher potential risk level.
- Calculation of cultivated landscape ecological security index
The landscape ecological security of cultivated land index is considered from both the cultivated fragmentation index (FI) and the cultivated landscape vulnerability index (LVI). Among them, FI quantifies the degree of fragmentation of cultivated land patches, higher values of FI indicate the worse the agricultural output efficiency. PD is commonly used to reflect the degree of fragmentation or patchiness of the overall landscape, with high patch density indicating small patch size per unit area and high landscape heterogeneity, and ED reflecting the complexity of the patch’s edges, with higher values indicating higher fragmentation [29,38,41]. In order to eliminate the effect of inconsistent units of measurement, we normalised the results for both, with values in the interval [0, 1], and finally sum the two values with equal weights. The formula for calculation is shown below:
where is the perimeter of the cultivated land patch, is the number of cultivated land patches in the grid and is the total area of the cultivated patches in the grid.
The landscape vulnerability index (LVI) represents the availability, stability, and resilience of cultivated land to external perturbation. SPLIT indicates the degree of landscape fragmentation, which reflects the complexity of the spatial structure of the landscape as well as, to some extent, the degree of human interference in the landscape. In general, the higher values of fragmentation indicate more impact on the landscape caused by humans [24]. The LSI calculates the degree to which a patch shape deviates from a circle or rectangle of the same size, representing the variability of the landscape patch; higher irregularity in the patch is indicated by higher LSI values [40]. Higher AWMSI values imply poorer utilisation efficiency and availability of cultivated land resources [42]. The formula for calculation is shown below:
where is the total number of cultivated patches, is the perimeter of cultivated patch , is the area of cultivated land patch , and is the total area of cultivated patches in the grid. According to a previous study on the LES of cultivated land,
was set to 0.59,
was set to 0.28,
was set to 0.12 [20,29].
Cultivated landscape indicators were calculated through Fragstats 4.2 software. Cultivated landscape security indicators LES were calculated via ArcGIS 10.2 software.
- 2.
- Adjusted landscape ecological security index calculation method
DI is determined by the types and amount of land converted from cultivated land during the monitoring period. The higher DI values indicate a higher risk of disruption on cultivated land inside the grid. According to the findings of the changes in cultivated land, cultivated land, forest land, utilized land, and water occurred interconversion. However, cultivated to construction land conversion is irreversible, posing the greatest risk of cropland. Moreover, the conversion between cultivated land and forest land and grassland is the most common and widespread, and can help to supply additional cultivated land while promoting ecological functions. According to field survey, an increasing number of farmers are choosing fruit trees and forestry over food agriculture, which provide greater returns and have a positive influence on improving economic output. As a result, the conversion to wooded grassland reduces the weight assigned to the DI value. Based on the hierarchical analysis [29],
was set to 0.29,
was set to 0.18,
was set to 0.42 and was set to 0.11. CSI is the ratio of cultivated land to other land types inside a grid that reflects the potential risk index of cultivated land within the pixel, with higher CSI values indicating a higher proportion of cultivated land and a lower potential danger. The formula for calculation is shown below:
where is the area of cultivated land in the image element and is the area of all land types in the image element.
3.3.3. Cultivated Land Use and Management Zoning Identification
We applied a three-dimensional model to generate a spatial combination of cultivated land features and presented zoning suggestions for regional cultivated land use and management based on the evaluation results of the ALES. Specifically, the three dimensions of the model consist of the three aspects of cultivated DI (X), CLSI (Y) and CSI (Z). As shown in Figure 4, the natural breakpoint method classifies X, Y and Z into four classes (lowest, lower, higher and highest, corresponding to the numbers 1, 2, 3 and 4). The higher value indicates a higher risk to the cultivated land. To enhance homogeneity and reduce intra-group variability, we integrated the 64 categories with the help of relevant specialists. Finally, the research area was subsequently separated into four regions: cultivated land stabilization region, cultivated land consolidation region, characteristic farming region and edge protection region (Table 2).
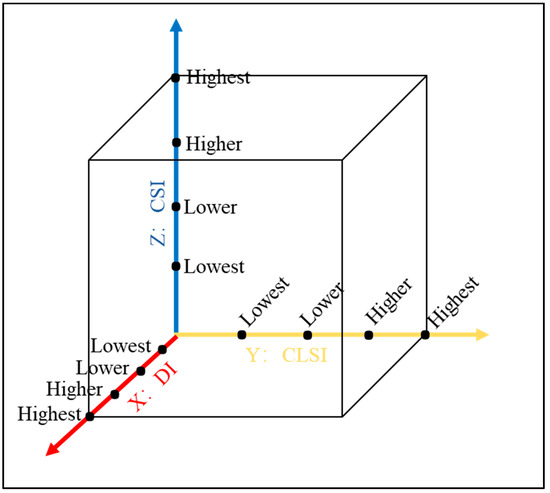
Figure 4.
The diagram for cultivated land zoning identification three-dimensional model.

Table 2.
The rules of cultivated land zoning identification.
4. Results
4.1. Cultivated Land Change Results
Based on the results of land-use classification in Xintai, a total of 173.2 km2 of cultivated land was changed to other land types between 1985 and 2015, accounting for 11.7% of total cultivated land area. Specifically, 154.3 km2 of cultivated land was transformed into construction land, while 14.36 km2 turned to forestland and grassland. As shown in Figure 5 and Figure A3, the conversion to construction land occurs mainly near the city and on the fringes of the mining area, indicating the characteristics of a resource-based city founded on mining, representing the simultaneous pressures of mineral extraction and urban growth on cultivated land encroachment. Moreover, 84.1 km2 of other land types were converted to cultivated land, with 82.1 km2 coming from forestland and grassland, primarily in the northern and southern highland hilly areas, where forestland and grassland and cultivated land coexist in a more dispersed spatial distribution. We also determined that the geographical pattern indicates that forest land and cultivated land interconverted during the same time period.
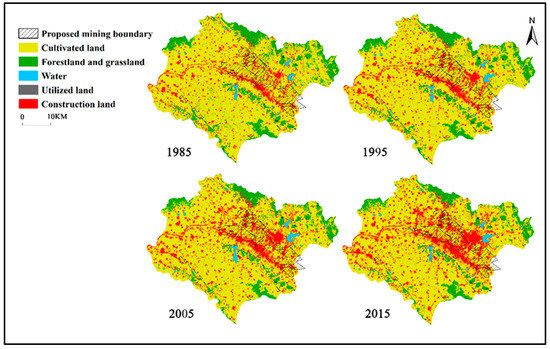
Figure 5.
Land–Use Classification Map.
Figure A4 illustrates that the area of cultivated land converted to other land types increases over the three monitoring time periods, particularly in the transformation of cultivated land into construction land, forestland, and grassland. Conversely, the area of forestland and grassland that has been converted into cultivated land is decreasing year by year. When considering the industrial structure, it is evident that with resource extraction, the proportion of industry in the industrial structure is growing, while urban building and human activities have hastened the decrease in cultivated land. Along with resource depletion, the industrial structure transformation process is progressively diminishing the percentage of primary industry. Farmers are becoming less and less inclined to practice farming since the income from food production is no longer sufficient to meet their needs for a living. Furthermore, cultivated land in the highland steep parts is vulnerable to severe soil and nutrient erosion, and its productivity is lower than that of the plains, while geography restricts fragmentation, low mechanization, and higher management costs. The majority of farmers have shifted their focus away from agricultural production and tend to fruit plants and forests instead. Moreover, the formulation of regional environmental protection objectives, as well as the steady execution of the policy of returning farmland to forestry, has led to the conversion of cultivated land to forestland and grassland.
4.2. Results of Cultivated Land DI and CSI
According to the distribution of DI values throughout time, high values were concentrated around mine margins between 1985 and 1995 (Figure 6(a1)), which is related to the development of the mining sector, population concentration, and city expansion. In addition to being concentrated on the suburbs of cities, the geographical distribution extended further between 1995 and 2005 (Figure 6(a2)). Outside the original urban area, DI values increased in the Xizhangzhuang town, Yangliu town, and the western Yucun town and Loude town between 2005 and 2015 (Figure 6(a3)), which is associated to the creation of regional urban sub-centres.
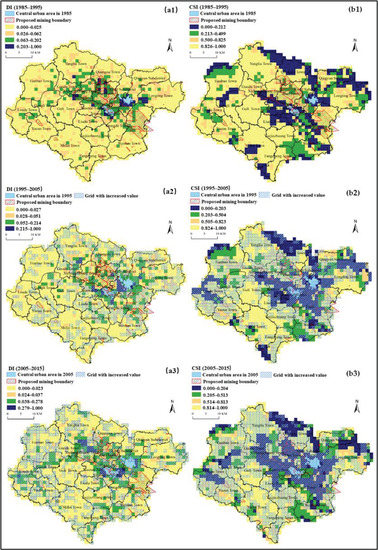
Figure 6.
Temporal–spatial distribution of cultivated land DI and CSI. (a1) disturbance index (DI) in 1985–1995. (a2) disturbance index (DI) in 1995–2005, (a3) disturbance index (DI) in 2005–2015. (b1) cultivated surrounding index (CSI) in 1985–1995. (b2) cultivated surrounding index (CSI) in 1995–2005. (b3) cultivated surrounding index (CSI) in 2005–2015.
The CSI represents the potential danger of cultivated land conversion. The lower the value, the lower the proportion of cultivated land inside the grid and the higher the likelihood of convert to other land types, the higher the potential risk. Between 1985 and 1995, low-value regions were distributed in the northern and southern mountainous hilly regions, where forestland and grassland were more prevalent. In addition, there are other low-value areas scattered around mining areas that might be developed into construction property (Figure 6(b1)). Over time, CSI values have tended to decline significantly around cities and to extend outward (Figure 6(b2,b3)), showing that the amount of cultivated land around cities and rural towns is steadily diminishing. Additionally, CSI values in the central plains have grown, indicating that people are paying attention to the conservation of cultivated land resources in the plains and expanding the amount of cultivated land through land reclamation (Figure 6(b2)). There is also an increase in CSI values in the northern and southern hilly areas, which is tied to the local strategy of cultivated land consolidation projects and restocking cultivated land resources.
4.3. Estimated Results of ALES
To facilitate comparison, LES and ALES values are normalized. The natural breakpoint method was used to classify the assessment results into four levels of security (I, II, III, and IV, with values increasing from I to IV; the higher the level, the higher the risk to cultivated land), which could then be used to compare changes in grid risk levels. Table 3 shows the detailed classification criteria for the LES and ALES levels.

Table 3.
LES and ALES value grading standards.
Over the three monitoring periods, the spatial distribution of the FI and LVI (Figure 7) are consistent with the cultivated LES (Figure 8) results. The higher risk areas of LES are located in the northern, central, and southern mountainous hilly regions and do not vary significantly across the three time periods. Compared to 1985–1995 (Figure 8(a1)), 88 grids (6.02% of the total) increased in risk from 1995 to 2005 (Figure 8(a2)), and 86 grids (5.87% of the total) increased risk from 2005 to 2015 (Figure 8(a3)). These increases in risk are mostly scattered throughout the city, with the northern, southern, and central mountainous hilly regions being particularly vulnerable. The results indicated landscape security around the urban edge too hazily, despite the fact that this area has a very variable pattern of land use. This is a result of the topographic circumstances in these places, which naturally mix cultivated land with forestland and grassland. Hence, when just the landscape features of cultivated land are taken into consideration in the LES of cultivated land evaluation, the dynamic change in landscape security is ineffective. This biases the evaluation results and supports our hypothesis.
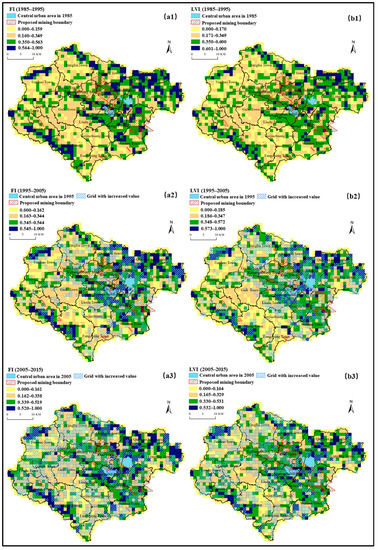
Figure 7.
Temporal–spatial distribution of cultivated land FI and LVI. (a1) fragmentation index (FI) in 1985–1995. (a2) fragmentation index (FI) in 1995–2005, (a3) fragmentation index (FI) in 2005–2015. (b1) landscape vulnerability index (LVI) in 1985–1995. (b2) landscape vulnerability index (LVI) in 1995–2005. (b3) landscape vulnerability index (LVI) in 2005–2015.
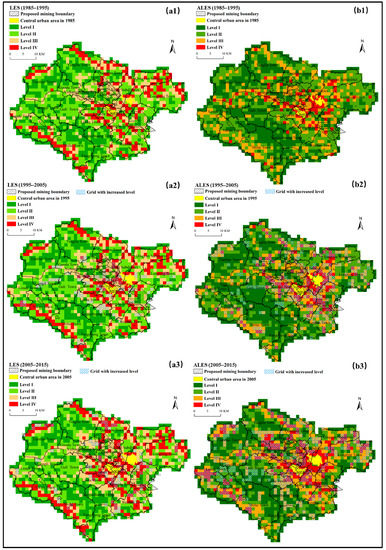
Figure 8.
Temporal–spatial distribution of cultivated land LES and ALES. (a1) landscape ecological security (LES) in 1985–1995. (a2) landscape ecological security (LES) in 1995–2005. (a3) landscape ecological security (LES) in 2005–2015. (b1) adjusted landscape ecological security (ALES) in 1985–1995. (b2) adjusted landscape ecological security (ALES) in 1995–2005. (b3) adjusted landscape ecological security (ALES) in 2005–2015.
The results of the cultivated ALES (Figure 8(b1–b3)) evaluation differ greatly from those of the LES assessment and more accurately depict the ways in which urbanization and human activity have changed agricultural landscapes. The results show that 104 grids (7.12% of the total grids) and 358 grids (24.47% of the total grids) from 1995 to 2005 (Figure 8(b2)) and 2005 to 2015 (Figure 8(b3)), respectively, had an increase in risk level relative to the previous period. The grids of increased risk are mainly located near mining and suburban regions and have a tendency to spread out over time. The results of the ALES evaluation for cultivated land indicate a widespread decline in the level of security for urban and mining areas. Even if it has been slightly improved, the farmed terrain around the city is not protected. However, this risk continues to exert pressure in the majority of areas. The ALES of cultivated land assessment is better suited for hilly regions as it accurately reflects the effects of human activities and reduces the impact of topography on the evaluation results. It also provides a more precise representation of the effects of urban sprawl on cultivated land.
4.4. Zoning Results for Cultivated Land Use and Management
Based on the results of the zoning of cultivated land use and management calculated by the three-dimensional models, we visualized them and the results are shown in Figure 9.
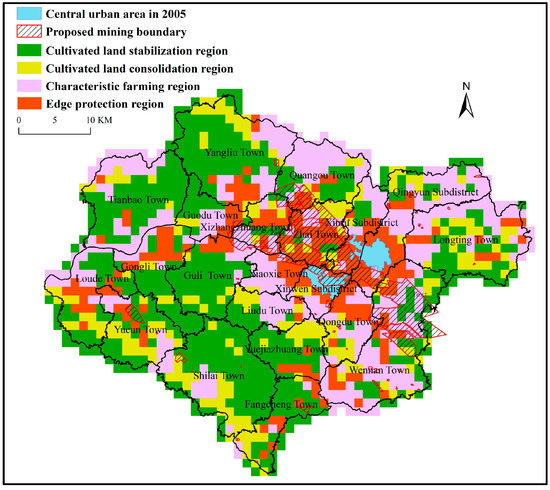
Figure 9.
Spatial distribution of cultivated land zoning identification results.
Cultivated land stabilization regions (green regions) are areas that have been developed to be more resilient to disturbances caused by human activity, typically located in plain regions that are far from cities. The benefits of concentrated spatial distribution and the practical use of cultivated land resources should be fully exploited, and it should encourage the growth of large-scale operations, modern agriculture, resources, and agricultural production facilities. To optimize the use of cultivated land resources, it is imperative to prioritize agricultural technology innovation. The usage of cultivated land should concentrate on enhancing living and production conditions, including the development of infrastructure for water conservation, and farmland protection. For instance, field design for roads, irrigation and drainage systems, and field protection forests.
In cultivated land consolidation regions (yellow regions), the cultivated resources have obvious advantages of scale and convenience, but their spatial organization is dispersed and fragmented, particularly in regions where plains and hills intersect. The scale of cultivated land management is increased to accommodate irrigation, drainage, and mechanized farming demands by taking steps to level abandoned ditches and ridges. Conditions for moderate size farmland management and agricultural modernization will be created by the merger of small scattered fields and the concurrent modification of land tenure.
Characteristic farming regions (pink regions) are primarily located in mountainous and hilly regions, and because of the topography of the land, which is interspersed with forestland and grassland, this leads to a serious fragmentation of cultivated land. To address this issue, farmers should be encouraged to develop specialized agricultural planting in accordance with local conditions, such as appropriate fruit tree relaxation and economic forest, which can increase their income while preserving the stability of the cultivated land system and conforming to the surrounding terrain.
In edge protection regions (red regions) optimizing the spatial organization of cultivated land, merging rural construction land consolidation, and encouraging a concentrated and continuous layout should be the main goals. To achieve this, rural construction land consolidation should be performed in rural communities with a fragmented and chaotic spatial layout, with the main objective of promoting the concentration of farmers’ residential land and the continuous distribution of cultivated land. Rural communities should specifically retain the productive function of cultivated land, intensify construction growth, and minimize disruption to cultivated land.
5. Discussion
Cultivated land security is crucial aspect of the interplay between human activities, socioeconomic growth, and the conservation of cultivated land resources. It results from a combination of environmental, economic, and social factors [43,44]. Achieving the objectives of ensuring the security of cultivated landscape and fostering sustainable socioeconomic development has become increasingly challenging due to various factors, including limited availability of cultivated land resources, fast population increase, and urbanization [45,46]. To ensure the preservation of cultivated land and prevent its fragmentation, land management methods such as land preparation have been employed [5,9,26,47]. The Chinese government is taking measures to improve the fragmentation of cultivated land and ensure the sustainability of the land by investing in the construction of high-standard farmland and land reclamation [48,49,50]. Unfortunately, because uniform models of cultivated land preparation fail to account for regional differences in resource and environmental use and partially undermine local distinctiveness, there is a disconnect between larger-scale resource use objectives and smaller-scale improvements in cultivated land use [51,52]. To ensure effective decision-making regarding resource use and agricultural development planning, it is crucial for policy-makers such as national and local governments to have a comprehensive understanding of the condition of cultivated land. This includes an understanding of its multiple dimensions, including landscape character, resource scale, and spatial distribution. By taking these factors into consideration, policy-makers can make informed decisions that are both practical and sustainable.
In order to achieve higher quality and sustainable cultivated land use, a scientific and reasonable evaluation of the cultivated landscapes ecological security can serve as a guide for the rational design and categorization guidance of land consolidation planning [36,53]. A comprehensive evaluation of the ecological security of cultivated landscapes serves as a crucial foundation for planning the geographical distribution of essential resources, resource use, and regional agricultural development plans. However, current research on local natural environmental conditions and agricultural production methods tends to overlook important factors such as topography, meteorology, hydrology, soil conditions, cropping systems, and irrigation and drainage methods, as well as the natural, spatial, and utilization characteristics of cultivated resources. As a result, there is a serious spatial mismatch between regional cultivated resources, including the scale, spatial pattern, and regional differences, that needs to be addressed [35,54].
The new theory of cultivated landscape ecological security that takes into account the spatial relationships and natural characteristics of the interaction between cultivated land and the surrounding land types is crucial to solving the problem of evaluating cultivated landscape security and improving its suitability for local characteristics. The study’s useful references and recommendations can aid in evaluating and optimizing the ecological security of cultivated landscapes in mountainous and hilly locations. This is crucial for effectively utilizing cultivated land resources and ensuring national food security.
Combined with the research findings, we recommend:
- Promoting the improvement and transfer of cultivated land, effectively managing the resources of rural cultivated land, enhancing pertinent rules and regulations, and controlling the uses of cultivated land. On the basis of thorough research, the national legislature should aggressively develop a solid legal structure for land transfer, supervise the transfer of rural land in compliance with the law, and establish a framework for dispute settlement. In order to guarantee the quantity of cultivated land and boost capacity per unit, it is crucial to implement strict management practices for land use after restoration.
- Considering the issue of abandonment, which is still widespread. Farmers are earning lower returns, which is leading to a decline in their willingness to engage in agricultural production. The cost of managing cultivated land and agricultural food is rising, and the number of people engaged in agricultural production is declining. This trend is leading to an increase in the phenomenon of abandoned cultivated land. Farmers have the option to grow cash crops that require low management costs, such as forestry or oil crops, in regions where cultivated land is fragmented.
- Improving advice on the use and protection of cultivated land resources. Cultivated landscape ecological security should be utilized as a scientific planning foundation and its execution should be enhanced. Governments have the responsibility to monitor changes in cultivated landscapes, including the amounts, forms, causes, methods, and all their repercussions, through rigorous and thorough surveys on an annual or frequent basis. Therefore, when making appropriate planning changes, revisions, or redesigns, resource allocation decisions regarding financing, markets, agricultural infrastructure, and regional development strategies should take into account regional variations in cultivated landscape security.
This study had some limitations, including the small amount of data that was available, which prevented it from studying changes in cultivated land outside of urban areas, which would have been more practically useful had the study’s scope been restricted to villages.
6. Conclusions
Cultivated land serves as a crucial role in connecting people and the environment. To preserve cultivated resources and people’s livelihoods, it is important to evaluate the ecological security of the landscape where cultivation occurs. Landscape ecological security (LES) evaluation method applied in cultivated land may cause inaccuracies by only assessing landscape elements of cultivated land. Thus, we expanded LES to adjusted landscape ecological security (ALES) evaluation system by adding the assessment of the interaction between cultivated land and the surrounding land types, which significantly reduce such inaccuracies. To verify the feasibility of ALES evaluation method, we apply it in Xintai City, Shandong Province.
This study indicates that between 1985 and 2015, 173.2 km2 of regional cultivated land was continually transferred or relocated due to mining and urban expansion. This land was generally converted to construction land, primarily in the mining region and urban periphery.
The regional LES high risk rating is a scattered distribution across the city, while there are long-term high-risk locations in the mountainous and hilly areas in the north, south, and in the middle areas. It is clear that topography has a significant impact on the assessment results. Most of the high-risk grids of ALES, except for a few scattered locations in the mountainous areas which are located near urban centers and mining areas, showed a tendency to expand outwards over time.
The evaluation results reduced impact of natural elements such as elevation and terrain on the cultivated landscape ecological security, more accurately reflecting the impact of human activity and urban growth, which is more consistent with local features. The ALES evaluation system is suitable for mountain city cultivated landscape security evaluation and has a higher quality of reference value for optimized allocation of cultivated land resources and ensuring the food security.
Author Contributions
Y.W. and L.C. designed the paper framework; Y.W. and Y.Z. analyzed the data; Y.W. wrote the paper; L.C. edited the paper. All authors have read and agreed to the published version of the manuscript.
Funding
This research was supported by the National Key R&D Program of China (2018YFD1100803).
Institutional Review Board Statement
Not applicable.
Data Availability Statement
Not applicable.
Acknowledgments
The authors would like to thank the editors and anonymous reviewers for their detailed and constructive feedback. We would also like to thank the students the students from Peking university and Capital Normal University for collecting with data.
Conflicts of Interest
The authors declare no conflict of interest.
Appendix A
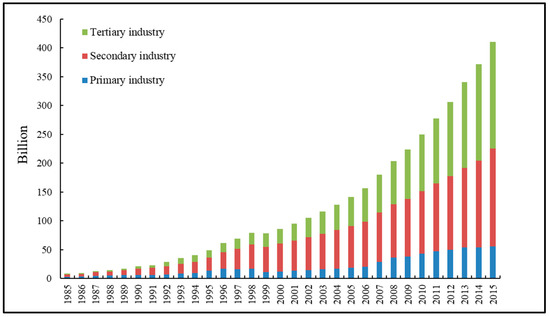
Figure A1.
Industry proportion map of Xintai.
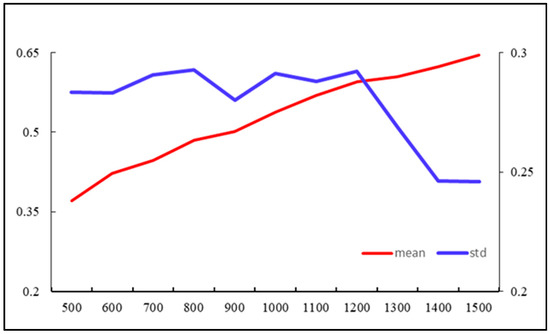
Figure A2.
Diagram of the optimum scale of the grid.
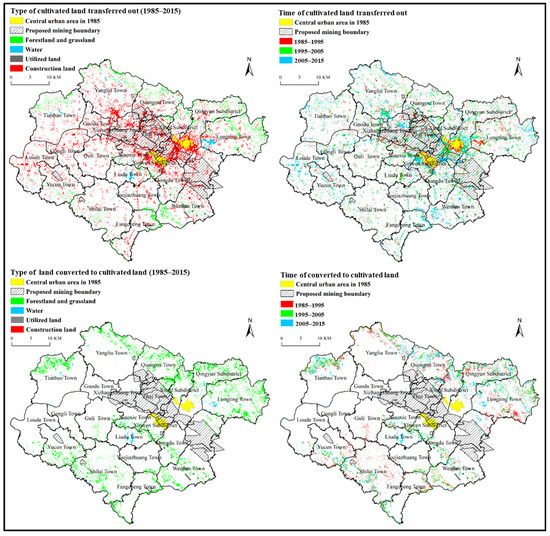
Figure A3.
Types and time of changes in cultivated land.
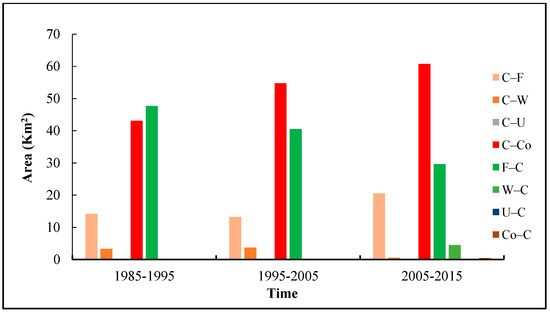
Figure A4.
Area of cultivated land conversion statistics.
References
- Turner, M.G.; Gardner, R.H. Landscape Dynamics in a Rapidly Changing World. In Landscape Ecology in Theory and Practice: Pattern and Process; Turner, M.G., Gardner, R.H., Eds.; Springer: New York, NY, USA, 2015; pp. 333–381. [Google Scholar]
- Zhou, Y.; Chen, T.; Feng, Z.; Wu, K. Identifying the contradiction between the cultivated land fragmentation and the construction land expansion from the perspective of urban-rural differences. Ecol. Inform. 2022, 71, 101826. [Google Scholar] [CrossRef]
- Maciel, A.M.; Picoli, M.C.A.; Vinhas, L.; Camara, G. Identifying Land Use Change Trajectories in Brazil’s Agricultural Frontier. Land 2020, 9, 506. [Google Scholar] [CrossRef]
- Prishchepov, A.V.; Müller, D.; Dubinin, M.; Baumann, M.; Radeloff, V.C. Determinants of agricultural land abandonment in post-Soviet European Russia. Land Use Policy 2013, 30, 873–884. [Google Scholar] [CrossRef]
- Li, J.; Zhou, K.; Dong, H.; Xie, B. Cultivated Land Change, Driving Forces and Its Impact on Landscape Pattern Changes in the Dongting Lake Basin. Int. J. Environ. Res. Public Health 2020, 17, 7988. [Google Scholar] [CrossRef]
- Li, W.; Wang, D.; Li, H.; Liu, S. Urbanization-induced site condition changes of peri-urban cultivated land in the black soil region of northeast China. Ecol. Indic. 2017, 80, 215–223. [Google Scholar] [CrossRef]
- Li, W.; Wang, D.; Liu, S.; Zhu, Y. Measuring urbanization-occupation and internal conversion of peri-urban cultivated land to determine changes in the peri-urban agriculture of the black soil region. Ecol. Indic. 2019, 102, 328–337. [Google Scholar] [CrossRef]
- Zhou, Q.; Li, B.; Kurban, A. Trajectory analysis of land cover change in arid environment of China. Int. J. Remote Sens. 2007, 29, 1093–1107. [Google Scholar] [CrossRef]
- Hartvigsen, M. Land reform and land fragmentation in Central and Eastern Europe. Land Use Policy 2014, 36, 330–341. [Google Scholar] [CrossRef]
- Jürgenson, E. Land reform, land fragmentation and perspectives for future land consolidation in Estonia. Land Use Policy 2016, 57, 34–43. [Google Scholar] [CrossRef]
- Liu, J.; Jin, X.; Xu, W.; Sun, R.; Han, B.; Yang, X.; Gu, Z.; Xu, C.; Sui, X.; Zhou, Y. Influential factors and classification of cultivated land fragmentation, and implications for future land consolidation: A case study of Jiangsu Province in eastern China. Land Use Policy 2019, 88, 104185. [Google Scholar] [CrossRef]
- Sui, F.; Yang, Y.; Zhao, S. Labor Structure, Land Fragmentation, and Land-Use Efficiency from the Perspective of Mediation Effect: Based on a Survey of Garlic Growers in Lanling, China. Land 2022, 11, 952. [Google Scholar] [CrossRef]
- Angel, S.; Parent, J.; Civco, D.L. The fragmentation of urban landscapes: Global evidence of a key attribute of the spatial structure of cities, 1990–2000. Environ. Urban. 2012, 24, 249–283. [Google Scholar] [CrossRef]
- Fahrig, L.; Fahrig, L. Effects of Habitat Fragmentation on Biodiversity. Annu. Rev. Ecol. Evol. Syst. 2003, 34, 487–515. [Google Scholar] [CrossRef]
- Malekmohammadi, B.; Rahimi Blouchi, L. Ecological risk assessment of wetland ecosystems using Multi Criteria Decision Making and Geographic Information System. Ecol. Indic. 2014, 41, 133–144. [Google Scholar] [CrossRef]
- Gao, Y.; Wu, Z.; Lou, Q.; Huang, H.; Cheng, J.; Chen, Z. Landscape ecological security assessment based on projection pursuit in Pearl River Delta. Environ. Monit. Assess. 2012, 184, 2307–2319. [Google Scholar] [CrossRef] [PubMed]
- Zhang, Y.; Yin, H.; Zhu, L.; Miao, C. Landscape Fragmentation in Qinling–Daba Mountains Nature Reserves and Its Influencing Factors. Land 2021, 10, 1124. [Google Scholar] [CrossRef]
- Su, S.; Li, D.; Yu, X.; Zhang, Z.; Zhang, Q.; Xiao, R.; Zhi, J.; Wu, J. Assessing land ecological security in Shanghai (China) based on catastrophe theory. Stoch. Environ. Res. Risk Assess. 2011, 25, 737–746. [Google Scholar] [CrossRef]
- Zhang, R.; Pu, L.; Li, J.; Zhang, J.; Xu, Y. Landscape ecological security response to land use change in the tidal flat reclamation zone, China. Environ. Monit. Assess. 2015, 188, 1. [Google Scholar] [CrossRef]
- Pei, H.; Wei, Y.; Wang, X.; Qin, Z.; Hou, C. Method of cultivated land landscape ecological security evaluation and its application (In Chinese). Trans. Chin. Soc. Agric. Eng. 2014, 30, 212–219. [Google Scholar]
- Zhang, Y.; Zhang, L.; Guo, W.; Yu, K.; Bo, Y.N. Analysis of ecological security evaluation and zoning threshold determination of typical energy industrial area based on PSR model. Environ. Res. Commun. 2022, 4, 105004. [Google Scholar] [CrossRef]
- Ciaian, P.; Guri, F.; Rajcaniova, M.; Drabik, D.; Gomez y Paloma, S. Land fragmentation and production diversification: A case study from rural Albania. Land Use Policy 2018, 76, 589–599. [Google Scholar] [CrossRef]
- Qiu, F.; Laliberté, L.; Swallow, B.; Jeffrey, S. Impacts of fragmentation and neighbor influences on farmland conversion: A case study of the Edmonton-Calgary Corridor, Canada. Land Use Policy 2015, 48, 482–494. [Google Scholar] [CrossRef]
- Shrestha, M.K.; York, A.M.; Boone, C.G.; Zhang, S. Land fragmentation due to rapid urbanization in the Phoenix Metropolitan Area: Analyzing the spatiotemporal patterns and drivers. Appl. Geogr. 2012, 32, 522–531. [Google Scholar] [CrossRef]
- Lu, H.; Xie, H.; Yao, G. Impact of land fragmentation on marginal productivity of agricultural labor and non-agricultural labor supply: A case study of Jiangsu, China. Habitat Int. 2019, 83, 65–72. [Google Scholar] [CrossRef]
- Inkoom, J.N.; Frank, S.; Greve, K.; Walz, U.; Fürst, C. Suitability of different landscape metrics for the assessments of patchy landscapes in West Africa. Ecol. Indic. 2018, 85, 117–127. [Google Scholar] [CrossRef]
- Peng, J.; Chen, X.; Liu, Y.; Lü, H.; Hu, X. Spatial identification of multifunctional landscapes and associated influencing factors in the Beijing-Tianjin-Hebei region, China. Appl. Geogr. 2016, 74, 170–181. [Google Scholar] [CrossRef]
- Song, W.; Liu, M. Farmland conversion decreases regional and national land quality in China. Land Degrad. Dev. 2017, 28, 459–471. [Google Scholar] [CrossRef]
- Yu, D.; Wang, D.; Li, W.; Liu, S.; Zhu, Y.; Wu, W.; Zhou, Y. Decreased Landscape Ecological Security of Peri-Urban Cultivated Land Following Rapid Urbanization: An Impediment to Sustainable Agriculture. Sustainability 2018, 10, 394. [Google Scholar] [CrossRef]
- Wang, Y.; Cheng, L.; Zheng, Y. Rural Effectiveness Evaluation: A New Way of Assessing Village Development Status. Sustainability 2022, 14, 9059. [Google Scholar] [CrossRef]
- Kaminski, A.; Bauer, D.M.; Bell, K.P.; Loftin, C.S.; Nelson, E.J. Using landscape metrics to characterize towns along an urban-rural gradient. Landsc. Ecol. 2021, 36, 2937–2956. [Google Scholar] [CrossRef]
- Tan, M.; Li, X.; Xie, H.; Lu, C. Urban land expansion and arable land loss in China—A case study of Beijing–Tianjin–Hebei region. Land Use Policy 2005, 22, 187–196. [Google Scholar] [CrossRef]
- Wu, Y.; Shan, L.; Guo, Z.; Peng, Y. Cultivated land protection policies in China facing 2030: Dynamic balance system versus basic farmland zoning. Habitat Int. 2017, 69, 126–138. [Google Scholar] [CrossRef]
- Perrin, C.; Clément, C.; Melot, R.; Nougarèdes, B. Preserving Farmland on the Urban Fringe: A Literature Review on Land Policies in Developed Countries. Land 2020, 9, 223. [Google Scholar] [CrossRef]
- Song, X.; Li, X. Theoretical explanation and case study of regional cultivated land use function transition. Acta Geogr. Sin. 2019, 74, 992–1010. [Google Scholar]
- Niroula, G.S.; Thapa, G.B. Impacts and causes of land fragmentation, and lessons learned from land consolidation in South Asia. Land Use Policy 2005, 22, 358–372. [Google Scholar] [CrossRef]
- Tran, T.A.; Nguyen, T.H.; Vo, T.T. Adaptation to flood and salinity environments in the Vietnamese Mekong Delta: Empirical analysis of farmer-led innovations. Agric. Water Manag. 2019, 216, 89–97. [Google Scholar] [CrossRef]
- Vizzari, M.; Sigura, M. Landscape sequences along the urban–rural–natural gradient: A novel geospatial approach for identification and analysis. Landsc. Urban Plan. 2015, 140, 42–55. [Google Scholar] [CrossRef]
- Chen, L.; Zhao, H.; Song, G.; Liu, Y. Optimization of cultivated land pattern for achieving cultivated land system security: A case study in Heilongjiang Province, China. Land Use Policy 2021, 108, 105589. [Google Scholar] [CrossRef]
- Di Falco, S.; Penov, I.; Aleksiev, A.; Van Rensburg, T.M. Agrobiodiversity, farm profits and land fragmentation: Evidence from Bulgaria. Land Use Policy 2010, 27, 763–771. [Google Scholar] [CrossRef]
- Liu, J.; Jin, X.; Xu, W.; Zhou, Y. Evolution of cultivated land fragmentation and its driving mechanism in rural development: A case study of Jiangsu Province. J. Rural Stud. 2022, 91, 58–72. [Google Scholar] [CrossRef]
- Looga, J.; Jürgenson, E.; Sikk, K.; Matveev, E.; Maasikamäe, S. Land fragmentation and other determinants of agricultural farm productivity: The case of Estonia. Land Use Policy 2018, 79, 285–292. [Google Scholar] [CrossRef]
- Deng, X.; Huang, J.; Rozelle, S.; Zhang, J.; Li, Z. Impact of urbanization on cultivated land changes in China. Land Use Policy 2015, 45, 1–7. [Google Scholar] [CrossRef]
- Gao, J.; Zhu, Y.; Zhao, R.; Sui, H. The Use of Cultivated Land for Multiple Functions in Major Grain-Producing Areas in Northeast China: Spatial-Temporal Pattern and Driving Forces. Land 2022, 11, 1476. [Google Scholar] [CrossRef]
- Gomes, E.; Banos, A.; Abrantes, P.; Rocha, J.; Kristensen, S.B.P.; Busck, A. Agricultural land fragmentation analysis in a peri-urban context: From the past into the future. Ecol. Indic. 2019, 97, 380–388. [Google Scholar] [CrossRef]
- Gónzalez, X.P.; Marey, M.F.; Álvarez, C.J. Evaluation of productive rural land patterns with joint regard to the size, shape and dispersion of plots. Agric. Syst. 2007, 92, 52–62. [Google Scholar] [CrossRef]
- Hu, G.; Li, X.; Zhou, B.-B.; Ma, Q.; Meng, X.; Liu, Y.; Chen, Y.; Liu, X. How to minimize the impacts of urban expansion on farmland loss: Developing a few large or many small cities? Landsc. Ecol. 2020, 35, 2487–2499. [Google Scholar] [CrossRef]
- Wang, S.; Zhuang, Y.; Cao, Y.; Yang, K. Ecosystem Service Assessment and Sensitivity Analysis of a Typical Mine–Agriculture–Urban Compound Area in North Shanxi, China. Land 2022, 11, 1378. [Google Scholar] [CrossRef]
- Xu, W.; Jin, X.; Liu, J.; Zhou, Y. Analysis of influencing factors of cultivated land fragmentation based on hierarchical linear model: A case study of Jiangsu Province, China. Land Use Policy 2021, 101, 105119. [Google Scholar] [CrossRef]
- Yan, H.; Liu, J.; Huang, H.Q.; Tao, B.; Cao, M. Assessing the consequence of land use change on agricultural productivity in China. Glob. Planet. Chang. 2009, 67, 13–19. [Google Scholar] [CrossRef]
- Liu, J.; Liu, X.; Wang, Y.; Li, Y.; Jiang, Y.; Wang, M.; Wu, J. Landscape pattern at the class level regulates the stream water nitrogen and phosphorus levels in a Chinese subtropical agricultural catchment. Agric. Ecosyst. Environ. 2020, 295, 106897. [Google Scholar] [CrossRef]
- Liu, S.; Wang, D.; Li, H.; Li, W.; Wang, Q. Ecological Land Fragmentation Evaluation and Dynamic Change of a Typical Black Soil Farming Area in Northeast China. Sustainability 2017, 9, 300. [Google Scholar] [CrossRef]
- Ntihinyurwa, P.D.; de Vries, W.T. Farmland fragmentation and defragmentation nexus: Scoping the causes, impacts, and the conditions determining its management decisions. Ecol. Indic. 2020, 119, 106828. [Google Scholar] [CrossRef]
- Zhou, G.; Li, C.; Li, M.; Zhang, J.; Liu, Y. Agglomeration and diffusion of urban functions: An approach based on urban land use conversion. Habitat Int. 2016, 56, 20–30. [Google Scholar] [CrossRef]
Disclaimer/Publisher’s Note: The statements, opinions and data contained in all publications are solely those of the individual author(s) and contributor(s) and not of MDPI and/or the editor(s). MDPI and/or the editor(s) disclaim responsibility for any injury to people or property resulting from any ideas, methods, instructions or products referred to in the content. |
© 2023 by the authors. Licensee MDPI, Basel, Switzerland. This article is an open access article distributed under the terms and conditions of the Creative Commons Attribution (CC BY) license (https://creativecommons.org/licenses/by/4.0/).