Abstract
Industrial agglomeration is one of the primary driving factors in city creation, and the improvement of urban land green use efficiency (ULGUE) is an important part in green development. This study concentrates on the impact of industrial agglomeration on ULGUE in the process of urbanization. Based on the panel data of 283 cities in China from 2003 to 2019, this paper constructs a super efficiency SBM-DEA model including unexpected outputs to evaluate ULGUE. Using a spatial Durbin model, we examine the spatial spillover effects of manufacturing and productive services agglomeration on ULGUE. The results show the following: (1) There has been fluctuation over the study period, which can be classified into three stages, and ULGUE in China as a whole is on the rise. (2) Chinese ULGUE has increased greatly in the western and northeastern regions, changed massively in the eastern region, and stayed largely steady in the middle region. The degree of manufacturing agglomeration is further improved, exhibiting a feature resembling a ladder, with high concentrations in the southeast coastal region and low concentrations in the interior. Production service industry agglomeration intensity has declined, revealing a more dispersed spatial pattern. (3) The rise in local ULGUE will have a beneficial impact on the ULGUE of spatially correlated regions, according to ULGUE’s relatively strong spillover effect. (4) Manufacturing agglomerations can enhance the ULGUE in the neighborhood, but it is not obvious how this will impact the local regions. The agglomeration of production service industry can enhance the improvement of ULGUE in local and spatially correlated regions, but the direct effect is weak. (5) The integration of the manufacturing and productive service industry does not quite strengthen its stimulatory effects on the growth of ULGUE.
1. Introduction
China has experienced rapid economic expansion and urbanization since acceding to the WTO. However, China’s development has been accompanied by several problems, such as the inefficiency of urban land use and the contamination of the ecological environment. In accordance with the report of the 19th National Congress, the goals of development are to advance green development and to strengthen the ecological civilization. The report of the 20th National Congress emphasized the necessity of coordinating industrial restructuring and advancing ecological priorities, conservation, and high-intensity, environmentally friendly low-carbon development. Urban social and economic development depends heavily on the green use of land, so implementing ecological priorities and green low-carbon development requires the reasonable use of land resources [1,2]. Land green use is both a land use process and a land use goal. Firstly, it is the process of introducing the concept of green development into land use. Secondly, it is the goal of land use that achieves the greatest increase in economic output and social well-being of land. Finally, it is the goal of land use that achieves the greatest reduction in the risk of environmental pollution. The 2035 Vision and the 14th Five-Year Plan’s general framework both highlight the development needs for an overall increase in resource usage efficiency. In order to ensure sustainable growth and prosperity, it is essential to increase the efficiency of how land is used.
Industrial agglomeration is one of the primary driving factors in city creation [3]. Industrial agglomeration and the agglomeration of capital elements and technology elements are complementary to each other. According to the theory of endogenous growth, both technology elements and capital elements including intellectual capital and material capital have significant spatial spillover effects. This implies that industrial agglomeration leads to significant spillover effects as well [4]. Urban land green use efficiency primarily focuses on maximizing expected output under the input of quantitative land elements and minimizing unexpected pollutants and CO2 in the absence of advances in green technology like clean alternative energy. Several studies have been developed to explain how industrial agglomerations assist in the reduction of environmental pollutants and how they affect the growth of economic performance [5]. This study focuses on the geographical and temporal aspects of industrial agglomeration from an urban perspective, and examines ways to boost the urban land green use efficiency based on panel data of 283 Chinese cities of prefecture-level or higher from 2003 to 2019.
The main contributions of this study are as follows: (1) This study contributes to the understanding on the concept of ULGUE and provides a more rational and comprehensive evaluation of unexpected outputs in the context of China’s Double Carbon. In the existing ULGUE measurement, only the emissions of sulfur dioxide, industrial wastewater and industrial smoke (dust) are included in the unexpected output. In this study, the emissions of carbon dioxide, together with the emissions of the other three pollutants, are included in the super-efficient SBM-DEA model for the first time to measure the unexpected output of ULGUE. (2) This study is complementary to the existing literature. In the existent literature, the impact of the manufacturing agglomeration and productive service agglomeration’s interactive effects on ULGUE and its spatial spillover effects have not been explored. This study thoroughly analyzes the impact of the interaction effect of the two industrial agglomerations on ULGUE, based on the study of the spatial-temporal evolution pattern of two industrial agglomerations and the ULGUE. (3) In the previous studies of spatial spillover effects, most of them only used a simple geographic weight matrix or an economic weight matrix. In this study, the spatial Durbin model with two forms of economic-geographic embedded weight matrices has been applied in addition to the traditional geographic weight matrix. It can better reflect the direct and indirect effects of industrial agglomeration on urban land green use efficiency, which has greatly improved the robustness and reliability of the research results.
The remainder of this paper is structured as follows. Section 2 presents the theoretical framework of this study. Section 3 presents the data sources and main methods, such as super efficiency SBM-DEA model and spatial Durbin model to prepare for the Section 4 and Section 5 empirical analyses. Section 4 demonstrates the temporal development trend and its spatio-temporal evolution pattern of urban green land use efficiency, as well as the industrial agglomeration trend. Section 5 presents the empirical findings, results, and analysis. Section 6 provides conclusions, policy implications, and research limitations.
2. Theoretical Framework
2.1. Urban Land Green Use Efficiency
The term land green use efficiency (LGUE), with its association with eco-efficiency, was initially introduced to the traditional land use efficiency [6]. With the goal of achieving sustainable use of land resources as the human–land relationship reaches a boundary point, we must control pollution emissions within the upper threshold of ecological self-restoration based on the ongoing expansion of economic output. As a result, some scholars have incorporated pollution emissions into the LGUE evaluation system [7]. Following the 19th National Congress of China, the concepts of green development and coordinated development have gained widespread adoption. Some researchers have further enhanced the meaning of LGUE by including social advantages in addition to the basic outputs of economic and ecological benefits [8]. In terms of the objects of empirical studies, there are mainly arable land [9], forest land [10], industrial land [11], and urban construction land [12], while the object of this study is urban land.
Urban land economic efficiency is different from urban land green use efficiency in that economic efficiency is focused on the goal of maximizing economic advantages. Green efficiency aims to minimize environmental damage while maximizing economic and social advantages. The existing literature defines urban land green use efficiency as a land use system with the goal of maximizing economic benefits and social dimensional outputs which are considered as expected outputs and minimizing environmental pollution as non-expected outputs. In addition, the urbanization process requires the effective governance of waste landscape and brownfield sites that do not generate economic benefits but cause environmental pollution. Thus this study also integrates waste landscape and brownfield sites into the land use system [13,14]. Therefore, this study defines the concept of urban land green use efficiency (ULGUE) as a land use system (land and other production factors, including drosscapes and brownfields) that under specific production technology conditions, generates the greatest amount of benefits (economic, social, and ecological) and the least amount of pollution effects, with the least amount of input costs in a city.
The focus of research on ULGUE has shifted from theoretical exploration to empirical studies. For measuring land use efficiency, the main methods which have been adopted in previous studies include analytic hierarchy process [15] (AHP), principal component analysis [16] (PCA), data envelopment analysis [17] (DEA), factor analysis [18], Malmquist productivity index [19], etc. However, compared to DEA AHP, PCA and factor analysis can only be used to measure a single aspect of input or output, and cannot measure ULGUE from the land use system as a whole. Addressing the patterns, trends, and development of ULGUE over time and space, mainly at the scale of cities, there are Yellow River Basin [20], Yangtze River Economic Belt [21], 284 prefecture-level cities in China [22], etc. Regarding the mainly influencing factors of ULGUE, there are environmental regulations [23], regional integration [24], new urbanization [25], economic development level, urban land intensification, ecological environment, governmental behavior, and social development level [26], etc. There has been no study on the influence of industrial agglomeration as a driving factor until now. Regarding the evaluation indicators, capital, land, and labor are mainly used as input indicators, while energy resources are not considered in most studies. The pollutants in the unexpected output are mainly SO2, industrial wastewater, industrial soot, and CO2 emissions are not considered in the era of the carbon peaking and carbon neutrality goals.
2.2. Manufacturing, Productive Service Agglomeration, and Urban Land Green Use Efficiency
In the existing literature, the influence of industrial agglomeration on green land use efficiency in cities has been rarely mentioned. Therefore, this study summarizes the theoretical framework from the impact of industrial agglomeration on both expected and unexpected outputs of the land use system in order to gain a preliminary comprehension of the impact of industrial agglomeration on ULGUE. Manufacturing (MA) and productive services (PS) are the most dominant components of the industry. Existing studies show that industrial agglomeration has a non-linear relationship with urban economy, and there is a significant inverse “U” shape relationship between industrial agglomeration and environmental pollution [27]. Among them, there is a significant inverse “U” shape relationship between the agglomeration of PS and green total factor productivity of cities, and there are different effects in different cities of different sizes, and the effect of agglomeration of different industries in PS on urban pollution reduction is different [28,29]. There is also a significant inverted “U” shape relationship between MA agglomeration and urban green development, and there is also significant regional heterogeneity in the degree of influence. Some scholars have found that the influence of MA agglomeration on pollutant emissions is an “N” shape relationship [30,31].
Research on the relationship between MA and PS has two main aspects, the interaction between the industry level from the micro perspective, and the collaborative agglomeration relationship between the city cluster levels from the macro perspective. The following findings are drawn from existing research: (1) Association effect. MA and PS have a strong favorable relationship in terms of economic aggregates, and the impact of PS on MA is stronger than the impact of MA on PS. (2) Spillover effects. Although there is a spillover between PS and MA, the impact is minimal. (3) Radiation effect. The promotion of PS to MA is significantly smaller than the pulling effect of MA on it [32]. As a result, the industrial agglomeration in various regions will also have different effects on ULGUE [33].
On the impact of industrial agglomeration, it is mainly in the centripetal force and centrifugal force of industrial agglomeration. Centripetal force, i.e., positive effect, is mainly generated from the following perspectives: (1) Knowledge and technology spillover, as well as the spillover of green innovation technology, is accompanied by the knowledge and technology transfer in the process of manufacturing products that will conserve energy and protect the environment. (2) Intermediate input sharing, the sharing of intellectual, material, and capital inputs in the production process, also accompanied by the sharing of environmental protection personnel, environmental protection facilities, and environmental protection funds. (3) Industrial structure upgrading, the elimination of massive, heavy industry with high energy consumption and high pollution, which really is vital for emission reduction and promotes the balancing and lengthy economy to grow. (4) Economies of scale, so that the industrial linkage between upstream and downstream industries is closer, reducing inter-regional transportation costs and further enhancing energy and environmental sustainability throughout the production cycle [34]. Centrifugal forces, or detrimental impacts, are primarily seen from the following angles: environmental pollution, resource scarcity, unhealthy competition, and crowding effects [35]. In summary, the positive environmental effects of industrial agglomeration may reduce pollutant emissions through inter-industry or intra-industry cooperation and sharing, or reduce relative pollution emissions by improving relative economic benefits. The negative environmental effects may deteriorate the business environment and cause the transfer or dispersion of backward industries. The mechanism of transfer between industries will not be discussed here. The positive environmental effect generated by industrial agglomeration will improve ULGUE, while the negative effect of agglomeration may reduce ULGUE. Therefore, the above transmission mechanism of industrial agglomeration impacting urban land green use efficiency is visualized as shown in Figure 1.
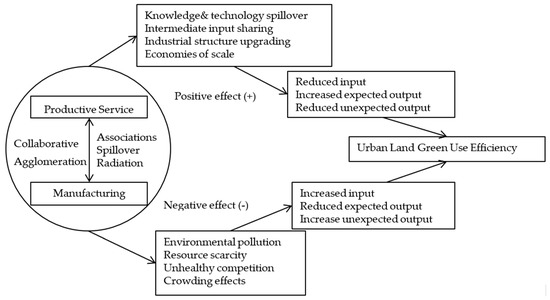
Figure 1.
The transmission mechanism of industrial agglomeration impacting urban land green use efficiency.
3. Methods and Data Source
3.1. Measurement of Urban Land Green Use Efficiency
In this study, we use the super efficiency SBM-DEA model with unexpected outputs proposed by Tone et al. (2001) to determine the input-output indicators (Table 1) and then measure the ULGUE by combining the concept of ULGUE [36]. Firstly, in the input indicators of the land use system, we need to consider not only the traditional land, capital, and labor inputs, but also energy inputs, because energy consumption brings economic benefits and pollutant emissions [37,38]. Hence, the downtown fixed asset investment serves as an indicator of capital input. The total number of people employed in secondary and tertiary industries serves as an indicator of capital input. The urban built-up area serves as an indicator of land input, and the total annual electricity consumption in the city is the proxy of energy input. Secondly, in the expected output indicators, the outputs of three benefits (economic, social and ecological) are adopted as the first level of indicators. The Science, Education, Culture, and Health Development Index is used to measure the output of social benefits, where the number of invention patents, primary and secondary school teachers, library collections, and hospital beds are comprehensively calculated using the entropy value method [39]. Meanwhile, the downtown GDP and downtown landscaped area are adopted as indicators of economic and ecological benefits, respectively. Finally, based on existing literature, the emissions of three traditional pollutants, sulfur dioxide, industrial wastewater, and industrial smoke (dust) are included in the unexpected output indicators [40]. In the context of the ‘double carbon’ goal in China, we also include the emissions of carbon dioxide in the unexpected outputs.

Table 1.
The Evaluation system of urban land green use efficiency.
The model takes the assumption that the land use system has decision units, and each decision unit contains three input-output variables, which are input, expected output, and unexpected output, as in Equation (1):
In Equation (1), is the ULGUE; , , denote the input, expected output, and unexpected output of DMU in period , respectively; , , denote the number of input, expected output, and unexpected output elements, respectively; , , are the slack vectors of input, expected output, and unexpected output, respectively, and is the weight vector of the decision unit.
3.2. The Impact of Industrial Agglomeration on Urban Land Green Use Efficiency
Due to the extensive industrial and economic linkages between cities in China, regions show strong correlations between environmental governance and macroeconomic policies. The literature confirms that variables such as industrial agglomeration and emission reduction effects between regions in China have significant spatial spillover effects [41,42,43]. It is inferred that ULGUE, which takes into account both economic and social benefits and pollutant emissions, may likewise exhibit spatial correlation. Due to this, it is crucial to control and evaluate the spatial correlation between MA and PS when researching their effects on ULGUE. Therefore, the spatial Durbin model (SDM) was constructed using the spatial econometric model set by Elhorst et al. [44], as in Equation (2):
In Equation (2), denotes the explained variable of the city i in year t, i.e., ULGUE; and denote the th explanatory variable of the city in year and its spatial lag term, respectively, which includes core explanatory variables and control variables; is an element in the spatial weight matrix; and denote individual and time fixed effects, respectively; is a random disturbance term; denotes the number of cities; , , and are all parameters to be estimated.
For the spatial weight matrix setting, the most commonly used geographic distance weight matrix is first used, i.e., the inverse of the Euclidean distance between the geographic coordinates of two cities is used as the element in the weight matrix, as in Equation (3). To avoid the inaccuracies generated by the weight matrix constructed by a single distance criterion, this paper draws on related studies to construct economic-geographic embedded weight matrices and that consider both geographic and economic distances [45,46], as in Equations (4) and (5).
In Equations (3)–(5), is the spatial distance between city and city , is the average value of GDP of the all cities in the study period, is the average value of national GDP in the study period, and is the average value of per GDP of city in the study period:
3.3. Spatial Effect Decomposition
As there is a spatial lag term in the model set, the regression coefficients in Equation (2) cannot directly respond to the actual effect of the explanatory variables on ULGUE. Therefore, to avoid the erroneous research results caused by the point estimation of the regression model setting, this study adopts the partial differential method proposed by LeSage et al. (2009) to decompose the total effect of industrial agglomeration on ULGUE [47], and the above SDM model is rewritten as Equation (6):
In Equation (6), is the residual term including the random perturbation term and the intercept term, and is the unit matrix. For the explanatory variable , the matrix of partial derivatives of the expected values of the corresponding explained variable can be rewritten as Equation (7):
In Equation (7), the average value of the elements on the diagonal of the matrix at the right end is the direct effect, which indicates the average combined effect of a change in an explanatory variable in the city on its ULGUE; the average value of the elements on the non-diagonal line is the indirect effect, i.e., the spillover effect, which indicates the average combined effect of a change in an explanatory variable in the city on the ULGUE in spatially associated areas.
3.4. Variable Setting and Data Source
The explained variable is ULGUE, which is described in Section 3.1. Regarding relevant literature, this study adopts the location quotient as a measure of industrial agglomeration, and uses the number of employed persons in productive service and manufacturing industries as the base indicators to respectively measure the agglomeration degree of the productive service industry (PS) and manufacturing industry (MA) [48]. Among them, the productive service industry mainly includes six industries: wholesale and retail trade; transportation, storage, and postal service; information transmission, computer service, and software; finance, leasing, and business service; scientific research, technical service; geological survey [49]. Meanwhile, to measure whether the two core explanatory variables have complementary effects on the ULGUE, the interaction term of two industrial agglomerations (MP) is introduced.
Combined with the aforementioned factors affecting industrial agglomeration, we also introduced five indicators as control variables into the econometric model to control for other important factors that affect ULGUE, including economic development (DEV), information technology (INF), government intervention (GOV), science and technology expenditure (TECH), and infrastructure (ROAD) [50,51,52,53,54,55]. The variables are described in Table 2.
Table 2.
Description of variables.
As data on some individual cities are not available, and some areas are not established as prefecture-level cities or above in the administrative division, such as the Yanbian Ethnic Autonomous Prefecture, these cities and regions are not included in the study area. Eventually, 283 cities above prefecture level were selected in this study. They account for 97.3% of the total number of cities in the country, which is representative. Therefore, this study uses 283 Chinese cities as its study units, and it chooses the years 2003 to 2019 as the study period. In addition, the data are from the China Urban Statistic Yearbook (2004–2020), in which the carbon emission data are from the database of CEADs. The patent data are from the statistical yearbook of each province in China. The arithmetical method of linear interpolation with Stata software is used to supplement the missing data.
4. Spatial and Temporal Evolution Pattern
4.1. Temporal Evolution Pattern
Using the MaxDEA program to calculate the ULGUE of 283 Chinese cities from 2003 to 2019, the super efficiency SBM-DEA model with unexpected outputs is evaluated using the ULGUE evaluation index method developed in this study. By looking at the average value of efficiency across the time period, one can get a general idea of the level of ULGUE in China as shown by Figure 2.
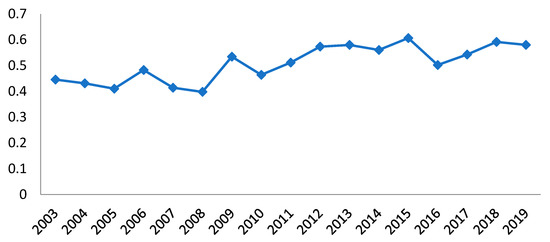
Figure 2.
The Trend of urban land green use efficiency in Chinese cities.
The ULGUE decreased between 2003 and 2005, falling from 0.466 in 2003 to 0.410 in 2005. It then increased to 0.483 in 2006, decreased to 0.398 in 2008, and then increased to 0.535 in 2009, at the transitional year between the 10th and 11th Five-Year Plans. China’s ULGUE has been progressively rising from 2010 to 2015, from 0.464 in 2010 to 0.607 in 2015, at a period when economic restructuring has sped up the closure of businesses, improved resource allocation, and increased the efficiency of land use. China has made some progress in ULGUE under the efforts of ecological civilization construction and comprehensive promotion of energy conservation and emission reduction, as evidenced by the steady increase in ULGUE year over year, which coincides with the 12th Five-Year Plan. The year 2019 coincides with the 13th Five-Year Plan of the country to develop a modern energy system, promote the economical and intensive use of resources, increase comprehensive environmental improvement, and practice the innovation-driven development strategy. There was a brief decline from 2015 to 2016, but after 2016, it continued to rise, from 0.502 to 0.580. This is the development trend of ULGUE in China as shown in Figure 2.
4.2. Spatial Evolution Pattern
After using Jenks’ natural breakpoint method to divide the ULGUE in the study period into seven levels based on the evaluation results of 283 cities from 2003 to 2019 in China, further research was performed on the spatial evolutionary pattern of ULGUE in Chinese cities using ArcGIS 10.2, as shown in Figure 3. From 2003 to 2019 as a whole, Chinese ULGUE has increased substantially in the western region and northeastern region, changed drastically in the eastern region, and remained relatively stable in the central region, exhibiting an overall evolutionary pattern that is balanced.
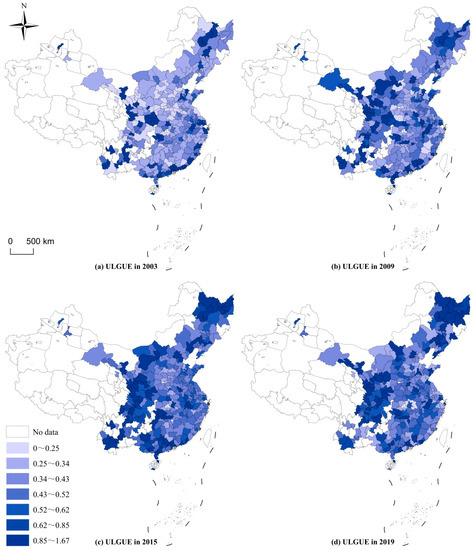
Figure 3.
Result for urban land green use efficiency in 283 cities in China from 2003 to 2019. (a) Result for urban land green use efficiency in 2003. (b) Result for urban land green use efficiency in 2009. (c) Result for urban land green use efficiency in 2015. (d) Result for urban land green use efficiency in 2019.
- (1)
- From 2003 to 2009, the western region went from having only a few cities at high-efficiency values to having all cities in a row at high-efficiency values, indicating that the western region has achieved higher results in pollution control. The efficiency value of the northeast region has also improved and is more balanced among cities. The central region itself has a more balanced development and also has a smaller increase. The eastern region has seen drastic changes with some high-value cities declining and some low-value cities improving, indicating that the industrialization of some cities tends to result in greater environmental contamination and the use of urban land is more extensive. Furthermore, some cities have ensured economic development while ensuring the conservation of the environment and the effective and efficient utilization of natural resource.
- (2)
- From 2009 to 2015, the efficiency values of individual high-value cities in the western region declined, while the whole region showed a more balanced development, indicating that the whole region has a balanced environmental regulation and economic development in the land use system. The efficiency values of the northeast region also improved compared to the previous period, indicating further progress in the transformation of highly polluting industries. The efficiency values of the eastern and central regions are spatially more evenly developed than in 2009, while there is little change in the specific efficiency values, indicating that the urban development in that period tends to stabilize, shifting from the high growth of individual cities to the coordinated development among regions.
- (3)
- From 2015 to 2019, on the whole, the spatial pattern of ULGUE in 2019 for 283 cities did not change dramatically compared with 2015. The efficiency values of individual cities in the northeast region have increased, and those of individual cities in the western region have decreased, but with a little change from 2015, indicating that the development of ULGUE in the northeast and western regions entered a bottleneck during this period. More obvious growth poles emerged in the eastern and central regions, but there was also a little change from 2015. It indicates a new driver for ULGUE development in the eastern and central regions during this period, such as innovation-driven, cross-regional environmental regulation or a shift in regional economic growth patterns.
4.3. Trend in the Evolution of Industrial Agglomeration
From 2003 to 2019, 283 Chinese cities’ MA and PS agglomeration indices were calculated using the location quotient. For the time period under consideration, the agglomeration indices were divided into four levels using Jenks’ natural breakpoint method, and ArcGIS 10.2 was used to spatially visualize and produce bivariate mapping maps in order to further analyze the trends of industrial agglomeration evolution in Chinese cities. As shown in Figure 4 and Table 3, from 2003 to 2019 as a whole, the degree of MA in China has further increased, showing a ladder feature of high in the southeast coastal region and low in the inland region. The degree of Chinese PS has decreased, showing a more dispersed spatial pattern, and this is basically consistent with existing literatures [56].
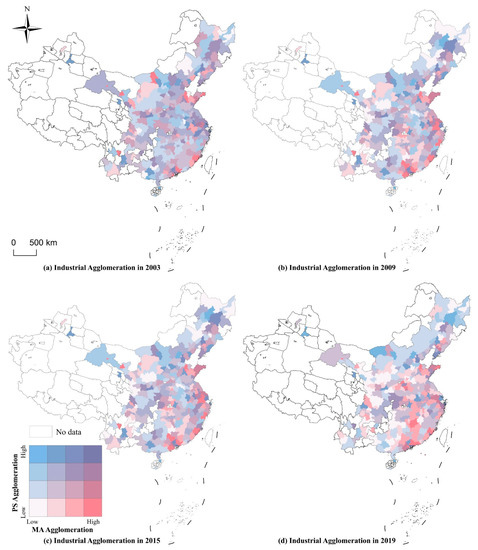
Figure 4.
Result for industrial agglomeration in 283 cities in China from 2003 to 2019. (a) Result for industrial agglomeration in 2003. (b) Result for industrial agglomeration in 2009. (c) Result for industrial agglomeration in 2015. (d) Result for industrial agglomeration in 2019.
Table 3.
Industrial agglomeration level.
- (1)
- From 2003 to 2009, the MA concentrated in the Yangtze River Delta and the Pearl River Delta, and the overall industrial pattern in the northeast region did not change significantly, while the degree of MA concentration in the central and western regions decreased, indicating that the MA began to move to regions with sufficient talent, capital, technology, and other factors. The cities in the eastern region are the main areas of agglomeration of productive services, and it is difficult to judge how much the level of agglomeration has changed.
- (2)
- From 2009 to 2015, the overall pattern of MA agglomeration in the country remained basically consistent compared to 2009, while the degree of PS agglomeration decreased. Among them, the agglomeration index of PS is higher in large cities in the eastern region, indicating that productive service industries are mainly clustered in cities with high levels of economic development and wide distribution in the region.
- (3)
- From 2015 to 2019, it appears that medium-sized and small cities in the southeast began to take over the industry on a large scale and that the level of MA in the core cities decreased as the MA started to move away from the Yangtze River Delta and Pearl River Delta’s central cities to the surrounding cities. The PS is mostly concentrated in a small number of major cities, although there is a general pattern of dispersion because the productive service industry, such as finance and technology, is required to aggregate industrial resources from regional or urban clusters.
5. The Impact of Industrial Agglomeration on Urban Land Green Use Efficiency
5.1. Spatial Correlation Test and Parameter Estimation
Before parameter estimation, the significance of the spatial spillover effect of the ULGUE needs to be judged using Moran’s I. The results, as presented in Table 4, show that the global Moran’s index of ULGUE for 2003–2019 is greater than 0 under the three spatial weight matrix settings, and all of them strongly reject the original hypothesis of no spatial correlation at the 0.1% level. The corresponding test results are given in Table 5. Under the three spatial weight matrix settings, the LM test results indicate that both the lagged and residual terms of the explained variable are spatially correlated. In addition, the LR and Wald test results indicate that the hypothesis using the spatial Durbin model (SDM) degenerates into a spatial lagged model (SLM) or a spatial error model (SEM) and can be rejected, i.e., the setting of the spatial Durbin model is reasonable. Meanwhile, the Hausman test is used and passed the 1% significance test at all spatial weight matrix settings, which can reject the original hypothesis that the real model is an individual random effect model, i.e., the fixed effect SDM is chosen as the optimal model for the spatial econometric analysis of this paper. Based on the above evidence that ULGUE has spatial spillover effects, this study uses the relevant spatial measures for parameter estimation of Equation (2) based on controlling for both individual and temporal effects, i.e., the SDM with dual fixed effects in space and time.
Table 4.
Global Moran’s Index of urban land green use efficiency in Chinese cities from 2003 to 2019.
Table 5.
Parameter estimation results of the spatial Durbin model.
From the parameter estimation results in Table 5, there is a significantly positive spatial spillover effect of ULGUE under all three spatial weight matrix settings, indicating that the improvement of ULGUE in this city will significantly improve the ULGUE in other cities through geographical and economic correlations. The positive spatial spillover effect of ULGUE can be attributed to the following three aspects: (1) Competition effect, local governments’ fiscal competition behavior which has been proven to promote regional economic growth, and tax competition. The widespread fiscal competition among local governments has been proven to promote regional economic growth, and tax competition prompted local governments to develop stricter environmental policies that are conducive to reducing pollution emissions, while environmental management policies have obvious strategic interaction effects among local governments, thus leading to healthy competition among local governments in the process of improving ULGUE [57,58]. (2) Demonstration effect, the successful practical experience of urban green transformation, can be transferred across regions through information exchange, personnel flow, and technology spillover, thus generating imitation and demonstration for other regions and prompting cities with low land use efficiency to improve structural efficiency, agglomeration efficiency, and technical efficiency, thus enhancing ULGUE. (3) Economic linkage effect, rapid transportation networks such as aviation and high-speed railways promote urban spatial linkage and economic spillover, while the optimization and adjustment of the economic growth mode will be transferred to economically linked areas through the use of market mechanisms to link regional industries, thus promoting the transformation of the economic growth mode in cities with low efficiency [59,60]. In summary, the competition effect, demonstration effect and economic linkage effect can collaborate to enhance ULGUE’s positive spatial spillover impact.
The direction and significance of the coefficients of all core explanatory variables and their spatial lagged terms are consistent under the three spatial weight matrix settings, so the SDM estimation results including spatio-temporal dual fixed effects are robust. The coefficients of MA and its spatial lag term are positive, but the coefficient of MA does not pass the significance test, while the coefficient of the spatial lag term of MA passes the significance test at the 1% level. The coefficients of production service agglomeration and its spatial lag term are positive and both pass the significance test, but the significance of the coefficient of production service agglomeration is lower than the significance of the lag term coefficient. It is noteworthy that the coefficients of the spatial lag term of MA and PS are much larger than their own coefficients, indicating that MA and PS have significantly positive spatial spillover effects. First of all, it enhances local ULGUE through knowledge and technology exchange within the industry, and sharing of intermediate inputs. In addition, industrial structure upgrading is realized through agglomeration effect and scale effect, which diminishes the use of resources locally as well as pollution emissions, and realizes the improvement of ULGUE. Meanwhile, the interaction between MA and PS and its spatial lag term can narrow the contribution of industrial agglomeration to the improvement of ULGUE, while its spatial spillover effect is under-identified, causing the direct impact of industrial agglomeration to be underestimated [61].
5.2. Spatial Effects Analysis
If the coefficient of the ULGUE spatial lag term is significantly non-zero, the estimation results of the spatial Durbin model will be inaccurate by point estimates, so the total effects of the core explanatory variables and control variables have to be decomposed to measure the specific direct and indirect effects [62]. Therefore, the regression analysis was performed under three spatial weight matrix settings, and the effect decomposition was performed using partial differential methods. The results are shown in Table 6. The directions of the effects of each variable on ULGUE are consistent under the three spatial weight matrix settings, and they all pass the significance test except for the direct effect of MA, indicating that the study results are robust. Among the indirect and total effects, the absolute values of the coefficients measured by the geographic weight matrix W1 are significantly larger than those of the economic-geographic embedded weight matrices W2 and W3, indicating that the geographic spatial linkage is stronger than the economic linkage in the spillover effect of industrial agglomeration on ULGUE.
Table 6.
Spatial effect decomposition of the spatial Durbin model.
- (1)
- MA has a positive spillover effect on the improvement of ULGUE significantly, while the direct promotion effect is not significant. The agglomeration of manufacturing industry optimizes cross-regional resource allocation efficiency and energy use efficiency through production factors of reallocation, cost reduction, and scale effect resulting which improves land use efficiency of neighboring cities [63]. It achieves positive environmental effects through centralized pollution control in multiple regions, green technology spillover, and green industrial structure upgrading, consequently promoting green development in neighboring cities [64]. However, the negative environmental effects and diseconomies of scale such as vicious competition, crowding effect, resource scarcity, and environmental degradation caused by the agglomeration of manufacturing industry mainly occur in the region, but because of other factors, it does not cause the reduction of ULGUE of the cities in this region [65]. Therefore, MA can upgrade the ULGUE in the neighboring areas, but the impact on this region is not obvious.
- (2)
- PS significantly improves ULGUE through direct promotion and positive spillover effect. However, the direct effect’s coefficient is much lower than the indirect effect. It shows that the agglomeration of productive service industries not only improves ULGUE in the local area but also improves ULGUE in neighboring regions, with the positive spillover impact being significantly bigger than the beneficial effect on the local area. As a result, it is clear that the PS and MA are taking distinct steps to enhance ULGUE. In order to achieve high-quality economic growth and enhance the ULGUE of the city, the PS immediately enhances the effectiveness of foreign direct investment and the green economy in the city through knowledge and technology spillover, intermediate input sharing, industrial structure upgrading, and economies of scale [66,67]. The PS reduces urban air pollution by increasing energy efficiency and industrial structure, but the environmental benefits of the agglomeration of high-end productive service industries, such as the financial sector and scientific and technology services, are more substantial [68]. Due to the fact that atmospheric pollution is spatially dependent [69], the PS reduces air pollution to produce a favorable spillover effect on ULGUE.
- (3)
- The coefficients of the interaction terms (PM) are significantly negative, implying that the MA and PS are not conducive to strengthen the promotion effect of the MA or PS on the improvement of ULGUE. Existing studies show that the effect of industrial agglomeration on emission reduction and urban economic efficiency is non-linear, i.e., the effect of industrial agglomeration on ULGUE is “1 + 1 < 2” [69]. It is presumed that the agglomeration of the two will produce negative environmental effects of industrial agglomeration. Therefore, in urban and cross-regional industrial layout policies, we should cultivate differentiated leading industries, optimize and adjust the internal structure of PS, and promote the integration of PS with MA to enhance the economic and environmental effects to promote the improvement of ULGUE.
6. Conclusions and Discussion
6.1. Conclusions
In summary, based on the spatial panel data of 283 cities in China from 2003 to 2019, this study measures the ULGUE through a super efficiency SBM-DEA model including unexpected output, portrays the spatial evolution pattern of industrial agglomeration and ULGUE in China, and applies a spatial Durbin model with multiple weights to comprehensively examine the direct and indirect effects of manufacturing and productive service industries.
The following are the study’s principal findings. (1) Although there has been fluctuation over the study period, which can be classified into three stages (2003–2009, 2009–2015, and 2015–2019), ULGUE in China as a whole is on the rise. (2) With sustainable growth features overall, Chinese ULGUE has increased greatly in the western and northeastern regions, changed massively in the eastern region, and stayed largely steady in the middle region. (3) The degree of manufacturing agglomeration is further improved, exhibiting a feature resembling a ladder, with high concentrations in the southeast coastal region and low concentrations in the interior. Production service industry agglomeration intensity has declined, revealing a more dispersed spatial pattern. (4) Due to the competition effect, demonstration effect, and economic linkage effect among cities, the rise in local ULGUE will have a beneficial impact on the ULGUE of spatially correlated regions, thus according to ULGUE’s relatively strong spillover effect. (5) Manufacturing agglomerations can enhance the ULGUE in the neighborhood, but it is not obvious how this will impact the local regions. (6) The agglomeration of the production service industry can enhance the improvement of ULGUE in local and spatially correlated regions, but the direct effect is weak. (7) The integration of the manufacturing and PS does not quite strengthen its stimulatory effects of the integration of the manufacturing or PS on the growth of ULGUE.
6.2. Policy Implications
Our conclusions have significant policy implications for how to improve ULGUE through industrial design.
- (1)
- Our study results show that manufacturing agglomerations can enhance the ULGUE in the neighborhood, but it is not obvious how this will impact the local regions. Thus, in a multi-city regional industrial layout, the government can promote the relocation of manufacturing industries with higher pollution and energy consumption to a minority of cities with a low level of economic development, increase the investment in environmental management in these cities and reduce the investment in neighboring cities as a way to promote the overall interregional improvement of ULGUE. The government can designate tax reduction policies to stimulate manufacturing industries in developed regions to advance to the middle and high end of the value chain, like the Yangtze River Delta and Pearl River Delta regions, promote spatial clustering of manufacturing industries by granting subsidies to enterprises in specific regions to achieve intensive land consumption and conservation, and realize the technological effect of manufacturing clustering, resulting in improved ULGUE.
- (2)
- By implementing relevant industrial policies, the government can adjust the internal structure of the productive service industry and the production capacity of each specific industry to match the local manufacturing level and urban development level, and reasonably integrate with the manufacturing industry to achieve saving energy and emission reduction through the structural effect and promote the improvement of regional ULGUE. For example, it is necessary to promote the financial industry and technology industry to cities with high-end manufacturing that can produce high value-added products, and guide the retail or wholesale and other trade industries to cities with mainly medium manufacturing that can produce bulk products.
- (3)
- In urban and cross-regional industrial layout policies, we should cultivate differentiated leading industries, optimize and adjust the internal structure of productive service industries, and promote the integration of productive service industries with manufacturing industries to enhance the economic and environmental effects to promote the ULGUE. In addition, it is important to avoid excessive industrial agglomeration, and promptly divert low-value manufacturing and productive services to diminish some of the negative effects caused by excessive agglomeration.
6.3. Discussion
As a complement to previous studies on the impact of industrial agglomeration on ULGUE and an empirical test of the spatial spillover effect of industrial agglomeration and ULGUE, this paper examines the impact of MA and PS agglomeration on ULGUE and its spillover effect. However, there are still some shortcomings in this paper: (1) The influence mechanism of industrial agglomeration on ULGUE has not been explored. (2) The differences brought by different types of MA and PA agglomeration are not explored. (3) The heterogeneity of the influence of MA and PA agglomeration on ULGUE in different regions or cities is not explored. (4) This study does not precisely identify drosscapes and brownfields in the city or include the utilization and management process of this type of land in the measurement of ULGUE. As a result, future study should concentrate on the theoretical process and the impact of industrial agglomeration on ULGUE in various industry sectors and geographical locations.
Author Contributions
Conceptualization, B.X.; data curation and methodology, B.X.; resources, Y.S.; writing—review and editing, B.X.; visualization, B.X.; revision and editing, Y.S.; project administration, Y.S.; funding acquisition, Y.S. All authors have read and agreed to the published version of the manuscript.
Funding
This research was funded by the National Social Science Foundation of China, grant number 22BJL135.
Institutional Review Board Statement
Not applicable.
Informed Consent Statement
Not applicable.
Data Availability Statement
The data used to support the findings of this study are available from the corresponding author upon request (E-mail: ymsun@re.ecnu.edu.cn).
Conflicts of Interest
The authors declare no conflict of interest.
References
- Zhang, W.; Wang, B.; Wang, J.; Wu, Q.; Wei, Y.D. How does industrial agglomeration affect urban land use efficiency? A spatial analysis of Chinese cities. Land Use Policy 2022, 119, 106178. [Google Scholar] [CrossRef]
- Ribeiro, H.V.; Rybski, D.; Kropp, J.P. Effects of changing population or density on urban carbon dioxide emissions. Nat. Commun. 2019, 10, 3204. [Google Scholar] [CrossRef]
- Davidoff, T. A Review of Volume 5 of the Handbook of Regional and Urban Economics, Parts III and IV. J. Reg. Sci. 2017, 57, 713–730. [Google Scholar] [CrossRef]
- Hu, Y.; Kemp, M.C.; Shimomura, K. Endogenous Growth: Fragile Foundations? Rev. Dev. Econ. 2006, 10, 113–115. [Google Scholar] [CrossRef]
- Lund-Thomsen, P.; Lindgreen, A.; Vanhamme, J. Industrial Clusters and Corporate Social Responsibility in Developing Countries: What We Know, What We do not Know, and What We Need to Know. J. Bus. Ethics 2016, 133, 9–24. (In Chinese) [Google Scholar] [CrossRef]
- Chen, Y.; Li, S.; Cheng, L. Evaluation of Cultivated Land Use Efficiency with Environmental Constraints in the Dongting Lake Eco-Economic Zone of Hunan Province, China. Land 2020, 9, 440. [Google Scholar] [CrossRef]
- Xie, H.; Chen, Q.; Lu, F.; Wu, Q.; Wang, W. Spatial-temporal disparities, saving potential and influential factors of industrial land use efficiency: A case study in urban agglomeration in the middle reaches of the Yangtze River. Land Use Policy 2018, 75, 518–529. [Google Scholar] [CrossRef]
- Liang, L.; Yong, Y.; Yuan, C. Measurement of Urban Land Green Use Efficiency and Its Spatial Differentiation Characteristics: An Empirical Study based on 284 Cities. China Land Sci. 2019, 33, 80–87. [Google Scholar]
- Xie, H.; Chen, Q.; Wang, W.; He, Y. Analyzing the green efficiency of arable land use in China. Technol. Forecast. Soc. Chang. 2018, 133, 15–28. [Google Scholar] [CrossRef]
- He, Y.; Xie, H.; Fan, Y.; Wang, W.; Xie, X. Forested Land Use Efficiency in China: Spatiotemporal Patterns and Influencing Factors from 1999 to 2010. Sustainability 2016, 8, 772. [Google Scholar] [CrossRef]
- Chen, W.; Shen, Y.; Wang, Y.; Wu, Q. The effect of industrial relocation on industrial land use efficiency in China: A spatial econometrics approach. J. Clean. Prod. 2018, 205, 525–535. [Google Scholar] [CrossRef]
- Liu, X.; Xin, L. Assessment of the Efficiency of Cultivated Land Occupied by Urban and Rural Construction Land in China from 1990 to 2020. Land 2022, 11, 941. [Google Scholar] [CrossRef]
- Westervelt, N. ‘Drosscape’: Wasting land in urban America. Urban Morphol. 2007, 11, 75. [Google Scholar]
- Sullivan, K.A. Brownfields Remediation: Impact on Local Residential Property Tax Revenue. J. Environ. Assess. Policy Manag. 2017, 19, 1750013. [Google Scholar] [CrossRef]
- Juanmin, C.U.I.; Wenguang, J.I. AHP-based Fuzzy Comprehensive Evaluating for Land Intensive Use Level. Res. Soil Water Conserv. 2011, 18, 122–125. (In Chinese) [Google Scholar]
- Jun, M.-J.; Choi, K.; Jeong, J.-E.; Kwon, K.-H.; Kim, H.-J. Land use characteristics of subway catchment areas and their influence on subway ridership in Seoul. J. Transp. Geogr. 2015, 48, 30–40. [Google Scholar] [CrossRef]
- Feng, Y.; Peng, J.; Deng, Z.; Wang, J. Spatial-temporal Variation of Cultivated Land’s Utilization Efficiency in China Basedon the Dual Perspective of Non-point Source Pollution and Carbon Emission. China Popul. Resour. Environ. 2015, 25, 18–25. (In Chinese) [Google Scholar]
- Kanellopoulos, A.; Reidsma, P.; Wolf, J.; van Ittersum, M. Assessing climate change and associated socio-economic scenarios for arable farming in The Netherlands: An application of benchmarking and bio-economic farm modelling. Eur. J. Agron. 2014, 52, 69–80. [Google Scholar] [CrossRef]
- Liu, Y.; Cheng, X. Does agroecological efficiency contribute to poverty alleviation? An empirical study based on panel data regression. Environ. Sci. Pollut. Res. 2022, 29, 51892–51908. [Google Scholar] [CrossRef]
- Chen, M.; Wang, Q.; Bai, Z.; Shi, Z.; Meng, P.; Hao, M. Green Land Use Efficiency and Influencing Factors of Resource-Based Cities in the Yellow River Basin under Carbon Emission Constraints. Buildings 2022, 12, 551. [Google Scholar] [CrossRef]
- Wang, J.; Chen, T. A Multi-Scenario Land Expansion Simulation Method from Ecosystem Services Perspective of Coastal Urban Agglomeration: A Case Study of GHM-GBA, China. Land 2022, 11, 1934. [Google Scholar] [CrossRef]
- Lu, C.-Y.; Wen, F.; Yang, Q.-Y.; Zhang, P.-F. Characteristics and Driving Factors of Urban Land Use Structure of Cities at Provincial Level and Above. Sci. Geogr. Sin. 2011, 31, 600–607. (In Chinese) [Google Scholar]
- Xu, Z.; Xu, W.; Liu, C. Influences of Environmental Regulations on Green Land Use Efficiency. China Land Sci. 2021, 35, 87–95. (In Chinese) [Google Scholar]
- Wang, Z.; Zhang, X.; Zhang, C.; Yang, Q. How Regional Integration Affects Urban Green Development Efficiency: Evidence from Urban Agglomeration in the Middle Reaches of the Yangtze River. Int. J. Environ. Res. Public Health 2022, 19, 7937. [Google Scholar] [CrossRef] [PubMed]
- Wang, S.; Yang, C.; Li, Z. Spatio-Temporal Evolution Characteristics and Spatial Interaction Spillover Effects of New-Urbanization and Green Land Utilization Efficiency. Land 2021, 10, 1105. [Google Scholar] [CrossRef]
- Lu, X.; Li, J.; Liu, C.; Kuang, B.; Cai, D.; Hou, J. Driving Factors and Spatial Differentiation of the Urban Land Green Use Efficiency in China. Sci. Geogr. Sin. 2022, 42, 611–621. (In Chinese) [Google Scholar]
- Zhu, D.; Li, H. Environmental effect of industrial agglomeration in China and its mechanism. China Popul. Resour. Environ. 2021, 31, 62–70. (In Chinese) [Google Scholar]
- Hong, J.; Yu, W.; Guo, X.; Zhao, D. Creative industries agglomeration, regional innovation and productivity growth in China. Chin. Geogr. Sci. 2014, 24, 258–268. [Google Scholar] [CrossRef]
- Han, F.; Xie, R. Does the Agglomeration of Producer Services Reduce Carbon Emissions? Quant. Tech. Econ. 2017, 34, 40–58. (In Chinese) [Google Scholar]
- Yuan, H.; Zou, L.; Feng, Y.; Huang, L. Does manufacturing agglomeration promote or hinder green development efficiency? Evidence from Yangtze River Economic Belt, China. Environ. Sci. Pollut. Res. 2022, 1–22. [Google Scholar] [CrossRef]
- Cheng, Z. The spatial correlation and interaction between manufacturing agglomeration and environmental pollution. Ecol. Indic. 2016, 61, 1024–1032. [Google Scholar] [CrossRef]
- Mani, S. The Mobile Communications Services Industry in India: Has it led to India becoming a manufacturing hub for telecommunication equipment? Pac. Aff. 2012, 85, 511–530, 464. [Google Scholar] [CrossRef]
- Amiti, M. Location of vertically linked industries: Agglomeration versus comparative advantage. Eur. Econ. Rev. 2005, 49, 809–832. [Google Scholar] [CrossRef]
- Zeng, D.Z.; Zhao, L. Pollution havens and industrial agglomeration. J. Environ. Econ. Manag. 2009, 58, 141–153. [Google Scholar] [CrossRef]
- Rahman, T.; Nielsen, R.; Khan, A. Agglomeration externalities and technical efficiency: An empirical application to the pond aquaculture of Pangas and Tilapia in Bangladesh. Aquac. Econ. Manag. 2019, 23, 158–187. [Google Scholar] [CrossRef]
- Tone, K. A slacks-based measure of efficiency in data envelopment analysis. Eur. J. Oper. Res. 2001, 130, 498–509. [Google Scholar] [CrossRef]
- Nie, L.; Guo, Z.; Peng, C. Construction land utilization efficiency based on SBM-Undesirable and Meta-frontier model. Resour. Sci. 2017, 39, 836–845. (In Chinese) [Google Scholar]
- Zhang, S.; Meng, L.; Li, Y. Impact of spatial agglomeration of energy production capacity on regional energy efficiency. China Popul. Resour. Environ. 2021, 31, 58–66. (In Chinese) [Google Scholar]
- Chua, H.-W.; Wong, A.K.W.; Shek, D.T.L. Social Development in Hong Kong: Development Issues Identified by Social Development Index (SDI). Soc. Indic. Res. 2010, 95, 535–551. [Google Scholar] [CrossRef]
- Popp, D. International innovation and diffusion of air pollution control technologies: The effects of NOX and SO2 regulation in the US, Japan, and Germany. J. Environ. Econ. Manag. 2006, 51, 46–71. [Google Scholar] [CrossRef]
- Li, T.; Xue, L.; Li, G. The evolution of spatial pattern of industrial agglomeration and its impact on the high-quality economic development: Empirical analysis based on the data of 278 cities in China. Geogr. Res. 2022, 41, 1092–1106. (In Chinese) [Google Scholar]
- Sun, Y.; Shen, S. The spatio-temporal evolutionary pattern and driving forces mechanism of green technology innovation efficiency in the Yangtze River Delta region. Geogr. Res. 2021, 40, 2743–2759. (In Chinese) [Google Scholar]
- Karkalakos, S. Capital Heterogeneity, Industrial Clusters and Environmental Consciousness. J. Econ. Integr. 2010, 25, 353–375. [Google Scholar] [CrossRef]
- Elhorst, J.P. Dynamic spatial panels: Models, methods, and inferences. J. Geogr. Syst. 2011, 14, 5–28. [Google Scholar] [CrossRef]
- Shao, S.; Zhang, Y.; Tian, Z.; Li, D.; Yang, L. The regional Dutch disease effect within China: A spatial econometric investigation. Energy Econ. 2020, 88, 104766. [Google Scholar] [CrossRef]
- Wang, H.; Shen, L. A spatial panel statistical analysis on Chinese economic growth and energy consumption. J. Quant. Tech. Econ. 2007, 12, 98–107. (In Chinese) [Google Scholar]
- Pace, R.K.; LeSage, J.P. A sampling approach to estimate the log determinant used in spatial likelihood problems. J. Geogr. Syst. 2009, 11, 209–225. [Google Scholar] [CrossRef]
- Zheng, H.; He, Y. How does industrial co-agglomeration affect high-quality economic development? Evidence from Chengdu-Chongqing Economic Circle in China. J. Clean. Prod. 2022, 371, 133485. [Google Scholar] [CrossRef]
- Zhang, Y.; Zhao, F.; Zhang, J.; Wang, Z. Fluctuation in the transformation of economic development and the coupling mechanism with the environmental quality of resource-based cities—A case study of Northeast China. Resour. Policy 2021, 72, 102128. [Google Scholar] [CrossRef]
- Jiang, L.; Zhou, H.; Bai, L. Spatial Heterogeneity Analysis of Impacts of Foreign Direct Investment on Air Pollution: Empirical Evidence from 150 Cities in China Based on AQI. Sci. Geogr. Sin. 2018, 38, 351–360. (In Chinese) [Google Scholar]
- Tanaka, K.; Managi, S. Industrial agglomeration effect for energy efficiency in Japanese production plants. Energy Policy 2021, 156, 112442. [Google Scholar] [CrossRef]
- Prasertsoong, N.; Puttanapong, N. Regional Wage Differences and Agglomeration Externalities: Micro Evidence from Thai Manufacturing Workers. Economies 2022, 10, 319. [Google Scholar] [CrossRef]
- Peng, X. Strategic interaction of environmental regulation and green productivity growth in China: Green innovation or pollution refuge? Sci. Total. Environ. 2020, 732, 139200. [Google Scholar] [CrossRef] [PubMed]
- Song, Y.; Zhu, D.; Yeung, G.; Xu, Y.; Zhang, L. Spatio-temporal evolution and driving mechanism of urban land use structure with the context of urban shrinkage: Evidence from Northeast China. Geogr. Res. 2021, 40, 1387–1403. (In Chinese) [Google Scholar]
- Li, J.; Sun, T.; Zhang, W. Spatial Cluster Characteristics and Modes of Producer Services in China. Sci. Geogr. Sin. 2014, 34, 385–393. (In Chinese) [Google Scholar]
- Becker, D.; Rauscher, M. Fiscal Competition and Growth When Capital Is Imperfectly Mobile. Scand. J. Econ. 2013, 115, 211–233. [Google Scholar] [CrossRef]
- Withagen, C.; Halsema, A. Tax competition leading to strict environmental policy. Int. Tax Public Financ. 2013, 20, 434–449. [Google Scholar] [CrossRef]
- Vickerman, R. Can high-speed rail have a transformative effect on the economy? Transp. Policy 2018, 62, 31–37. [Google Scholar] [CrossRef]
- Mahutga, M.C.; Ma, X.; Smith, D.A.; Timberlake, M. Economic Globalisation and the Structure of the World City System: The Case of Airline Passenger Data. Urban Stud. 2010, 47, 1925–1947. [Google Scholar] [CrossRef]
- Cainelli, G.; Fracasso, A.; Marzetti, G.V. Spatial agglomeration and productivity in Italy: A panel smooth transition regression approach. Pap. Reg. Sci. 2015, 94, S39–S67. [Google Scholar] [CrossRef]
- Elhorst, J.P. Matlab Software for Spatial Panels. Int. Reg. Sci. Rev. 2014, 37, 389–405. [Google Scholar] [CrossRef]
- Sigler, T. Book Review: Triumph of the City: How Our Greatest Invention Makes Us Richer, Smarter, Healthier, and Happier. Urban Aff. Rev. 2012, 48, 141–142. [Google Scholar] [CrossRef]
- Liu, X.; Zhang, X. Industrial agglomeration, technological innovation and carbon productivity: Evidence from China. Resour. Conserv. Recycl. 2021, 166, 105330. [Google Scholar] [CrossRef]
- Yuan, H.; Zou, L.; Luo, X.; Feng, Y. How Does Manufacturing Agglomeration Affect Green Development? A Spatial and Nonlinear Perspective. Int. J. Environ. Res. Public Health 2022, 19, 10404. [Google Scholar] [CrossRef]
- Javorcik, B.S.; Turco, A.L.; Maggioni, D. New and Improved: Does FDI Boost Production Complexity in Host Countries? Econ. J. 2018, 128, 2507–2537. [Google Scholar] [CrossRef]
- Maine, E.; Shapiro, D.M.; Vining, A.R. The role of clustering in the growth of new technology-based firms. Small Bus. Econ. 2010, 34, 127–146. [Google Scholar] [CrossRef]
- Verhoef, E.T.; Nijkamp, P. Externalities in urban sustainability: Environmental versus localization-type agglomeration externalities in a general spatial equilibrium model of a single-sector monocentric industrial city. Ecol. Econ. 2002, 40, 157–179. [Google Scholar] [CrossRef]
- Qin, X.; Sun, Y. Cross-Regional Comparative Study on Environmental–Economic Efficiency and Driving Forces behind Efficiency Improvement in China: A Multistage Perspective. Int. J. Environ. Res. Public Health 2019, 16, 1160. [Google Scholar] [CrossRef]
- Helsley, R.W.; Strange, W.C. Coagglomeration, Clusters, and the Scale and Composition of Cities. J. Political Econ. 2014, 122, 1064–1093. [Google Scholar] [CrossRef]
Disclaimer/Publisher’s Note: The statements, opinions and data contained in all publications are solely those of the individual author(s) and contributor(s) and not of MDPI and/or the editor(s). MDPI and/or the editor(s) disclaim responsibility for any injury to people or property resulting from any ideas, methods, instructions or products referred to in the content. |
© 2023 by the authors. Licensee MDPI, Basel, Switzerland. This article is an open access article distributed under the terms and conditions of the Creative Commons Attribution (CC BY) license (https://creativecommons.org/licenses/by/4.0/).