Article

Spatial Tools for Inclusive Landscape Governance: Negotiating Land Use, Land-Cover Change, and Future Landscape Scenarios in Two Multistakeholder Platforms in Zambia

by
Freddie Sayi Siangulube
1,2,*,
Mirjam A. F. Ros-Tonen
1,
James Reed
2,3,
Eric Rega Christophe Bayala
1,2 and
Terry Sunderland
2,4
1
Amsterdam Institute for Social Science Research (AISSR), University of Amsterdam, Nieuwe Achtergracht 166, 1018 VW Amsterdam, The Netherlands
2
Centre for International Forestry Research (CIFOR), Bogor 16115, Indonesia
3
School of International Development, University of East Anglia, Norwich Research Park, Norwich NR4 7TJ, UK
4
Faculty of Forestry, University of British Columbia, 2424 Main Hall, Vancouver, BC V6T 124, Canada
*
Author to whom correspondence should be addressed.
Land 2023, 12(4), 804; https://doi.org/10.3390/land12040804
Submission received: 20 January 2023 / Revised: 27 March 2023 / Accepted: 31 March 2023 / Published: 1 April 2023
(This article belongs to the Special Issue Future Scenarios of Land Use and Land Cover Change)

Abstract

:
Landscape approaches are being promoted as a form of negotiated governance to help reconcile competing land uses and identify common concerns for planning envisioned future landscapes. Multistakeholder platforms play a key role in these efforts. This paper aims to contribute to an emerging scholarship that explores how spatial tools can be used in such platforms as boundary objects and if and how they can contribute to inclusive landscape negotiations and governance. We used spatial mapping to observe and document stakeholder perceptions about drivers of land-use and land-cover change and desired future scenarios that accommodate competing land uses. We found that land-cover maps derived from satellite images helped participants identify land-use change dynamics and drivers. The ensuing community mapping of desired landscape scenarios in both multistakeholder platforms (MSPs) triggered a process of identifying common concerns and defining actionable priorities. However, in one MSP, stakeholders ultimately reached a compromise on a draft land-use map that was widely regarded as an entry point for further negotiations in Local Area Plans, while the other lacked consensus due to deep-seated social-cultural issues, such as social-class-based disagreements. This paper illustrates, first, that instead of focusing on the end product (participatory maps), understanding negotiation processes helps uncover why spatial tools may fail to achieve the intended purpose of reconciling land uses. Second, spatial tools only work for landscape approaches if MSPs are inclusive and foster a collaborative process that considers the views of all participants. The authors recommend that those steering MSPs stimulate them to evolve from “mere consultation forums” to “innovative, participatory platforms”, encouraging stakeholders to engage in genuine negotiation processes that allow negotiated and alternative outcomes. We contend that such an approach, supported by spatial tools, is likely to contribute to the implementation of landscape approaches. Policymakers and land users can use these spatial tools as boundary objects in user-focused strategies that engender inclusive stakeholder participation and ensure legitimate, acceptable, and sustainable outcomes.

1. Introduction

The complexity of addressing landscape challenges requires novel approaches to effectively conserve biodiversity while simultaneously satisfying human socioeconomic needs and planning the future [1,2]. Landscapes in the tropics are becoming increasingly fragmented along land-use features due to a range of socioeconomic, development, and cultural drivers [3]. As such, forest remnants in human-habited tropical landscapes and other natural habitats are now ecologically stressed hotspots. These landscapes are losing habitat connectivity, and their capabilities to provide ecosystem services such as food, folder, air purification, water infiltration, climate change regulation, and carbon sequestration are diminishing [3,4]. To address these complexities, there is a need to visualise how landscapes evolve and establish drivers of landscape change, especially in contested landscapes where human and non-human factors interact [4].
The use of spatial tools proliferated in urban and rural development and planning literature as important policy instruments [5], traditionally focusing on space efficiency and identifying sustainable land-use synergies and conflict management [6,7]. Later, spatial tools have been adopted in different natural resource management contexts to support decision-making processes, helping local people visualise their landscapes and, to some extent, informing the ‘good governance’ criteria of participation and inclusivity [8]. Several studies addressing the values and challenges of spatial tools as decision-support tools attempt to contextualise the social-cultural and economic parameters as inputs in the design principles of land-use planning [9]. Uncovering local perceptions and their experiences through participatory spatial tools that help visualise people’s desired future landscapes has recently received attention in the landscape governance literature [10,11]. However, these participatory spatial tools are often employed in isolation without combining them with remote sensing. Empirical data on how a mix of multiple spatial tools might be integrated to enhance stakeholder negotiation processes and enable inclusive engagement in landscape governance remains scarce [11]. Moreover, technological limitations and user subjectivity influence landscape-level negotiations involving various stakeholders [11,12]. Therefore, holistic and user-friendly spatial approaches are crucial, particularly in decision-making processes involving local communities with extensive knowledge of landscape dynamics.
Participatory mapping, remote sensing maps, three-dimensional (3D) modelling, and place-based future scenario-building processes are examples of spatial tools that enable land managers and users to analyse spatial and temporal transitions to inform landscape governance strategies and attain collective objectives [11]. These spatial tools, notably time series remote sensing maps, can be effective aids as boundary objects that reveal landscape dynamics [13] and set the stage for stakeholders to negotiate common concern entry points in future scenarios [14]. In addition, participatory mapping enables multi-sectoral collaborative action at the local level to address socio-ecological challenges in landscapes that would otherwise be difficult to achieve with a single-sector approach. However, development planners, conservationists, policymakers, and land users increasingly acknowledge the importance of engaging various stakeholders in managing landscapes to secure a sustainable future [15]. Despite the acknowledgement, landscape planning processes are constrained by a lack of insights into the views of stakeholders with competing interests [16]. Therefore, one of the critical steps in strengthening landscape governance in multiple land-use settings is to uncover stakeholders’ nuanced perspectives about their landscape, what they think is changing, and why [12,16].
In this context, integrated landscape governance, which invites multiple stakeholders to negotiate their claims during the planning process, supports an equitable dialogue while aiming to reconcile competing land uses through adaptive management systems. [17,18]. In practice, this is often not easy to achieve. This paper seeks to contribute to this knowledge-implementation gap by focusing on the roles of spatial tools as boundary objects for negotiated governance in community-based landscape planning in the Kalomo District of Southern Zambia. The paper aims to contribute to an emerging scholarship that explores how spatial tools (remote sensing and participatory mapping) can help to negotiate land uses and if and how they can contribute to inclusive landscape governance. We analysed two multistakeholder platform (MSP) case studies in which groups of local actors negotiated their desired future landscapes. Considering that our analysis has significance for rural land use planning policy and practice, the study design included MSPs in a communal land and protected area. This paper addresses three research questions: (i) How has land cover changed over time in the Kalomo District? (ii) How do land users with varying and often conflicting interests construct drivers of landscape changes? (iii) How do spatial tools help negotiate the land-use trade-offs and contribute towards mapping a desired future landscape?

2. Conceptual Framework: Spatial Tools as Boundary Objects for Inclusive Landscape Governance

Star and Griesemer [19] were the first to introduce the boundary object concept to denote objects or entities with a common identity but different meanings in “intersecting social worlds” [20]. Opdam et al. [20] (p. 1441) associate ‘boundary objects’ with local landscapes that communicate meaning “among disciplines and between science and local communities”. Thus, boundary objects are framed as negotiation or management tools to help uncover participants’ diverse thinking about landscape dynamics while searching for common concerns [13,19]. In doing so, we recognise participants’ individuality, competing interests, perceptions, and preferences on issues of mutual importance. In this study, we conceptualise remote sensing maps generated independently of community members’ preconceived opinions as crucial aids to elicit community views about the future of their landscapes. The outputs (maps) would constitute part of the material for negotiating Local Area Plans (LAPs), which include several other villages. Furthermore, the participatory maps might be used to negotiate desirable future scenarios with other land users, decision-makers and district-level planners when formulating Integrated Development Plans (IDPs) at the district level.
Governance is defined broadly as the process of collective decision-making that involves the determination and implementation of policy actions through collective engagements involving state and non-state actors in allocating resources, accepting responsibility, exercising powers, and sharing the benefits of potential outcomes [21,22]. From a landscape governance theory perspective [17], this scope can be summarised into two governance strands relevant to scenario building in spatial planning [23,24]. First, a normative perspective describes inclusive governance as an ideal model with ‘good governance concepts’ including stakeholder inclusion, equitable participation, legitimacy and accountability, effectiveness, consistency, proportionality, and subsidiarity [8,9,25,26,27,28]. Another strand views inclusive governance as a specific process outcome rooted in deliberative governance [9,17,29,30]. This strand has recently been influenced by social-ecological system science that seeks to improve the understanding of the relationships between human-to-human interactions, institutions, and nature [31].
In theories related to integrated landscape approaches, inclusive landscape governance is elaborated as both a normative and a process concept in specific contexts aiming to challenge the status quo of conflicting goals and interests by promoting negotiation of sustainable future landscapes in a ‘win-more-lose-less’ situation [32]. In this vein, this study aims to illustrate the benefit of using spatial tools in landscape approaches to negotiating context-specific trade-offs at the landscape scale, such as development, food security, and conservation [14].

3. Materials and Methods

3.1. Study Area and Context

This research was conducted in Kalomo District, southern Zambia, in Chief Chikanta’s Chiefdom, which is approximately 1754 km2 in size (Figure 1). The chiefdom is part of the area where the COLANDS initiative1 seeks to operationalise integrated landscape approaches. The study site is one of the most important livestock and food-producing regions in southern Zambia [33] and is in the proximity of significant biodiversity hotspots, such as the Sichifulo Game Management Area and Nazhila Water Catchment. The area hosts a large part of the biggest forest reserve in Southern Province, the Kalomo Hills Forest Reserve No. P-13 (KHF13) [34]. However, since the 1980s, land-use conflicts have progressively escalated, especially between food production systems, development and conservation in customary land and informal settlements in KFR13. Claims to the conservation area are based on customary land ownership and user rights, power struggles between the traditional system and the state, and entitlements based on historical or ancestral land ownership [35]. As the area’s population increases, settlements are expanding, and demand for fertile land has put significant pressure on the forest reserve.
In this regard, several stakeholders have proposed various land governance models that facilitate the harmonisation of various interests, including integrated landscape approaches [36]. National and local stakeholder meetings involving civil society, the state, traditional leaders, land users and researchers have been convened several times to try and remodel land-use governance in Kalomo District. For example, in August 2021, the Centre for International Forest Research (CIFOR) and the Zambian Forestry Department jointly organised a virtual national stakeholder dialogue attended by 39 participants from 24 organisations, including traditional leaders. In common with earlier participatory meetings, this high-level discussion concluded that there is a need to adopt inclusive governance approaches to restore landscape functions, improve livelihoods, and provide incentives and benefit-sharing mechanisms, a departure from the top-down approaches.
Against this background, village-level MSPs engaged in the landscape planning process, including a comprehensive analysis of landscape issues and identifying homegrown strategies to resolve land-use conflicts. Part of the planning process involved negotiating desired and sustainable future landscapes. The spatial tool employed in this study enhanced the negotiation processes in two local communities, Habulile (Village 1) and Siankwembo (Village 3) villages (Figure 1)2.

3.2. Selection of Participants

In the COLANDS project, the communities of Habulile, Mudenda, Mubombo Ulilinyama, and Siankwembo, four MSPs known as Village Productivity Committees (VPCs), were purposely sampled. The VPCs are legal village-level MSPs recognised by the state under the Village Registration Act of 1994 [37]. MSPs were selected based on their land-use mix, demographic balance, period of existence, and frequency of meetings to deliberate on landscape issues. Ultimately, two MSPs were selected from Habulile and Siankwembo villages, respectively. The first MSP, multistakeholder platform Village 1 (further abbreviated as MSP1), is in Habulile village, near the chief’s palace, which is considered the centre of decision-making power. The second MSP is in Siankwembo village, the oldest village on state land in a forest reserve. Despite being located on state land where statutory laws apply, the village manages local affairs via customary governance rules, demonstrating a typical space of governance contestations.
The village heads, locally known as Sibbuku (literally translated as ‘bookkeeper’), coordinated the identification of eligible participants. The Sibbuku is the leader of the VPCs. The composition of VPCs includes electable village representatives and traditional leaders. In most cases, other participants outside the villages are invited, such as government officials, civil society organisations and the private sector [35]. Participation in the participatory mapping exercise was voluntary. However, a list of selected participants was cross-checked with those who had previously attended other village meetings. Suitable participants were assumed to have extensive knowledge about the landscape, having lived in the area for at least two years.
The age range for youth in Zambia is undefined and varies depending on activities. In the villages where the studies were conducted, a male or female under 21 is considered a youth. This socially accepted definition guided this study. MSP1 had 34 informants, including women, men, and youths, and 45 in the multistakeholder platform in Village 2 (further abbreviated as MSP2), with a similar composition (Table 1). Farmers’ associations, women’s groups, youth groups, community-based organisations, elderly people, civic leaders, local entrepreneurs, and ordinary village locals were all represented.

3.3. Data Collection and Materials

This section presents the methods and data types used in this study. Two sets of data were used: (i) we produced land-cover maps based on satellite images that were utilised as tools for MSP negotiations on drivers of deforestation and landscape degradation (Figure 2), and (ii) we analysed the participatory mapping processes to gain insights into negotiations for inclusive landscape governance in Kalomo District. Negotiation processes were analysed through participant observations and transcribing the proceedings (Section 3.3.3).

3.3.1. Satellite Data Preparation and Analysis

Dataset

Two Landsat satellite images, the 1984 Landsat 5 Thematic Mapper (TM) and 2020 Landsat 8 Operational Land Imager and Thermal Infrared Sensor (OLI and TIRS), were used to assess land-cover change (see Appendix A Table A1). The two years were chosen for two reasons. First, the early 1980s coincided with land-use conflicts around Forest Reserves involving community members and state institutions, resulting in massive intra-village migrations that have influenced landscape dynamics. The second reason was the availability of cloud-free satellite images in both years [38].

Land-Cover Classes and Reference Data

The cloud-based Google Earth Engine was used to analyse the satellite images through Machine Learning. Following Asubonteng et al. [10], the classification scheme used was based on descriptions provided by key informants and ground-truthing (Table 2). The main land-cover types were discussed and agreed upon with key informants familiar with the landscape and followed the national classification [39]. This was important to ensure stakeholders could relate to their perceived landscape composition and configurations [10]. The land-cover types included forest, cropland, rangeland, waterbodies, and built-up/bare area.
Studies indicate that reference datasets should represent approximately 0.25% of the study area [40]. We used Google Earth Engine and JavaScript to process Landsat images and produce land-cover maps. Google Earth Engine is increasingly used in land-cover studies (e.g., [41,42]). In this study, we visually inspected high-resolution satellite imagery and historical data to extract training and validation samples. Guided by the classification scheme (Table 2), land-cover reference data for each land category in the current image (2020), cluster sampling was applied. Random sampling was undertaken in each cluster of given land-cover classes using high-resolution images on the online Google Earth Engine platform [43]. The allocation of sample points for each class was performed by estimating the average area of each land-cover class of the cluster [43,44] with sufficient samples across the different land types of interests to overcome the effects of sampling imbalances [45]. In the forest class, 139 points were sampled, 119 for cropland, 127 for rangeland, 120 for waterbodies, and 122 for built-up areas. For the 1984 map, 438 reference points were sampled from archived historical maps produced by the Forest Department and the District Council’s physical planning department (between 80–90 points in each class). A total of 1065 land-cover sample points in various land-cover types in the study area were collected for 1984 and 2020. In geospatial data training and validation, the common practice is allocating more samples to training than validation [45]. For each of the images, the respective samples were divided into training (70%) and validation (30%) subsets [46].

Image Classification

Landsat images covering the entire area for 1984 and 2020 were accessed and processed in the Google Earth Engine environment using JavaScript processing chains to extract spectral–temporal metrics as predictors for land-cover classification. Google Earth Engine is a powerful cloud computing platform that provides advanced processing and visualisation tools while addressing time constraints for processing and data storage capacity issues [44] and hosts an extensive catalogue of datasets (see [44]). As a first phase, all images with less than 30% cloud cover were filtered using the mask function (FMASK) to have cloud and cloud shadow-free image collections as far as possible [47]. The results were visually evaluated and redefined throughout the masking process until the best result was reached [48]. The seasonal composites technique was used to extract spectral–temporal data, with the median reduction to generate cloud-free seasonal composites [49]. Southern Zambia’s climate, which is composed of three seasons, namely a rainy-hot season (December–March), a cold-dry season (April–July) and a hot-dry season (August–October), guided the process of filtering satellite images. Images from the rainy and cold seasons were discarded because of the high amounts of clouds. For both 1984 and 2020, images between September and October were used in this study.
Using the above land-cover samples, the Random Forest Classifier in Google Earth Engine was used to train the model on the 1984 and 2020 Landsat images and produce land-cover maps. This study used 746 representative samples to train the Supervised Random Forest classifier to generate the land-cover maps for both years.

Accuracy Assessment and Change Detection

Assessing the accuracy of the land-cover map produced from the remotely sensed product is a widely accepted practice [44]. Accuracy assessment provides information about the reliability of the maps or any spatial information for use in decision-making processes. Classification accuracies of the 1984 and 2020 maps were evaluated using 319 reference data in Google Earth Engine.
Three error matrixes were computed based on the classification results. The accuracy assessments of the 1984 and 2020 land-cover maps were evaluated using the validation samples (30%) obtained from the visual assessment of raw images in Google Earth Engine. Classification accuracy for each map was obtained by matching the validation samples with thematic maps using a confusion matrix, as described by [43]. These comprised the producer accuracy (PA), which shows the likelihood that a pixel was properly classified in a particular class, and the Kappa coefficient (K), which is a measure of agreement between observed and expected values. The classified maps were exported later into QGIS 3.28.0 for change detection and analysis of land-cover transitions using the Semi-Automatic Classification Plugin [48].

3.3.2. Participatory Mapping Protocol

The participatory protocol presented in this section was used in all MSPs (Table 3). A two-day MSP meeting, segmented into three sessions, was convened, and the process lasted approximately 9–12 h. The first session introduced the research aims, deliberated on the remote sensing maps, and discussed the drivers of landscape change. During this session, the research team familiarised the participants (men, women, and youths) with the land-cover classification proposed by key informants, i.e., forest, cropland, rangeland, waterbodies, and built-up areas. Next, participants compared the land-cover map derived from the 2020 satellite image with their own knowledge of the area to discuss land-use issues and drivers of landscape change. These discussions formed a basis to reflect on and identify priorities for the future consistent with the local context, the problems perceived, land-use trends in the area, and envisaged resource demands. Finally, they broke up into focus groups of men, women, and youths to engage in participatory mapping of desired future landscapes—working in groups to create illustrative maps that identify the landscape features they hope to realise in the future. Taking 2020 as a base year in which the research project started, future landscapes were projected until 2040. Other studies [10,12] suggest a forecasting range between 10–30 years. However, community members assumed that in 20 years (2040), the current generations would still be ‘available’ to implement land-use strategies proposed in the project. The variables determining the projected future landscape were based on the participants’ desired mix of land-cover types to accommodate their main agricultural activities (small-scale subsistence and cash-crop farming, livestock rearing, conservation farming based on intercropping trees and crops, and home gardening), water needs, settlement needs, and cultural assets. Variables underpinning the choice of a 20-year projection period included expected population growth and migration and settlement patterns, changing food systems, and climate change impacts. On the second day, participants reconvened to negotiate common concerns illustrated in respective participatory maps and integrate them into a single common map.
To avoid unintentional misinterpretations, several concepts such as ‘negotiations’, ‘land cover’, ‘future landscape’, and ‘governance’ were defined in the Tonga language (spoken by most participants, including the first author) at the outset of the meeting [49]. The participants were presented with two sets of maps for discussion. The first was a 1968 topographic sheet map acquired from the Forest Department’s provincial office (reference number FDSP11/04/2018, scale 1:200,000). The topographic map helped participants to evaluate important biophysical features and appreciate the dynamics in the area of interest. After that, remote sensing maps (Section 3.3.1) illustrating landscape statuses in 1984 and 2020 were presented. These were utilised to initiate a discussion on drivers of landscape change and negotiate a common future landscape scenario. After lengthy discussions, the participants negotiated what they perceived to be the drivers of landscape change.
The three focus groups in the respective MSPs comprised 9–15 participants segregated by gender and age. Focus group discussions have a long tradition of being used as a data-gathering method in conservation and social science research [50]. Compared to interviews, focus groups provide more flexibility for data collection through interactions and co-production of meaning to uncover in-depth aspects that would be obscured in traditional interviews [51]. Given that the study was conducted in a gendered society with distinct roles for men and women [52], gender and age-segregated focus groups were necessary to ensure equitable participation. Focus group participants were encouraged to discuss and contribute to the list of landscape change drivers as they deemed suitable. They later sketched maps of imagined future landscapes. Grids were developed since the participatory maps were not drawn to scale, and the envisioned land-use classes were intuitively assigned ratios (converted into percentages) against the total land-cover area [10]. Participants in the main meeting analysed maps designed in the focus groups. All participants were involved in examining each map, and finally, collaboratively adjusted the focus group maps and reintegrated the negotiated maps into a new collective map expressing collective views.

3.3.3. Data Analysis

The proximate and underlying drivers of land-cover change, alongside the transcribed data of negotiation processes from all sessions, were qualitatively analysed using ATLAS.ti 22 using concept analysis and coding to determine the key variables and how they interacted to produce change.

4. Results

The results are presented in four parts: the first is associated with land-cover dynamics in Chief Chikanta’s area using remote sensing to help participants visualise the context of the landscape dynamics between 1984 and 2020 (Section 4.1). The second part presents the participants’ use of land-cover maps to identify drivers of change (Section 4.2) and relate those to village-level activities (Section 4.3). The last part presents the deliberations on the desired future landscapes (Section 4.4).

4.1. Land-Cover Dynamics in Chief Chikanta’s Area

4.1.1. Accuracy Assessments

The 1984 land-cover map had an overall accuracy of 88.8% and a Kappa value of 0.83, whereas the 2020 map had an overall accuracy of 90.8% and a Kappa coefficient of 0.9. For 1984, Producer Accuracy for the forest was 99.3%, cropland 88.9%, rangeland 93.4%, and waterbodies and the built-up area were 100%, respectively. For 2020, the Producer Accuracy for the forest was 88%, for cropland 100%, for rangeland 92.5%, for waterbodies 86%, and for built-up/bare land 79.1%. The accuracy assessments are indicative that the classification is reliable for both years.

4.1.2. Land Cover in Chief Chikanta’s Area in 1984 and 2020

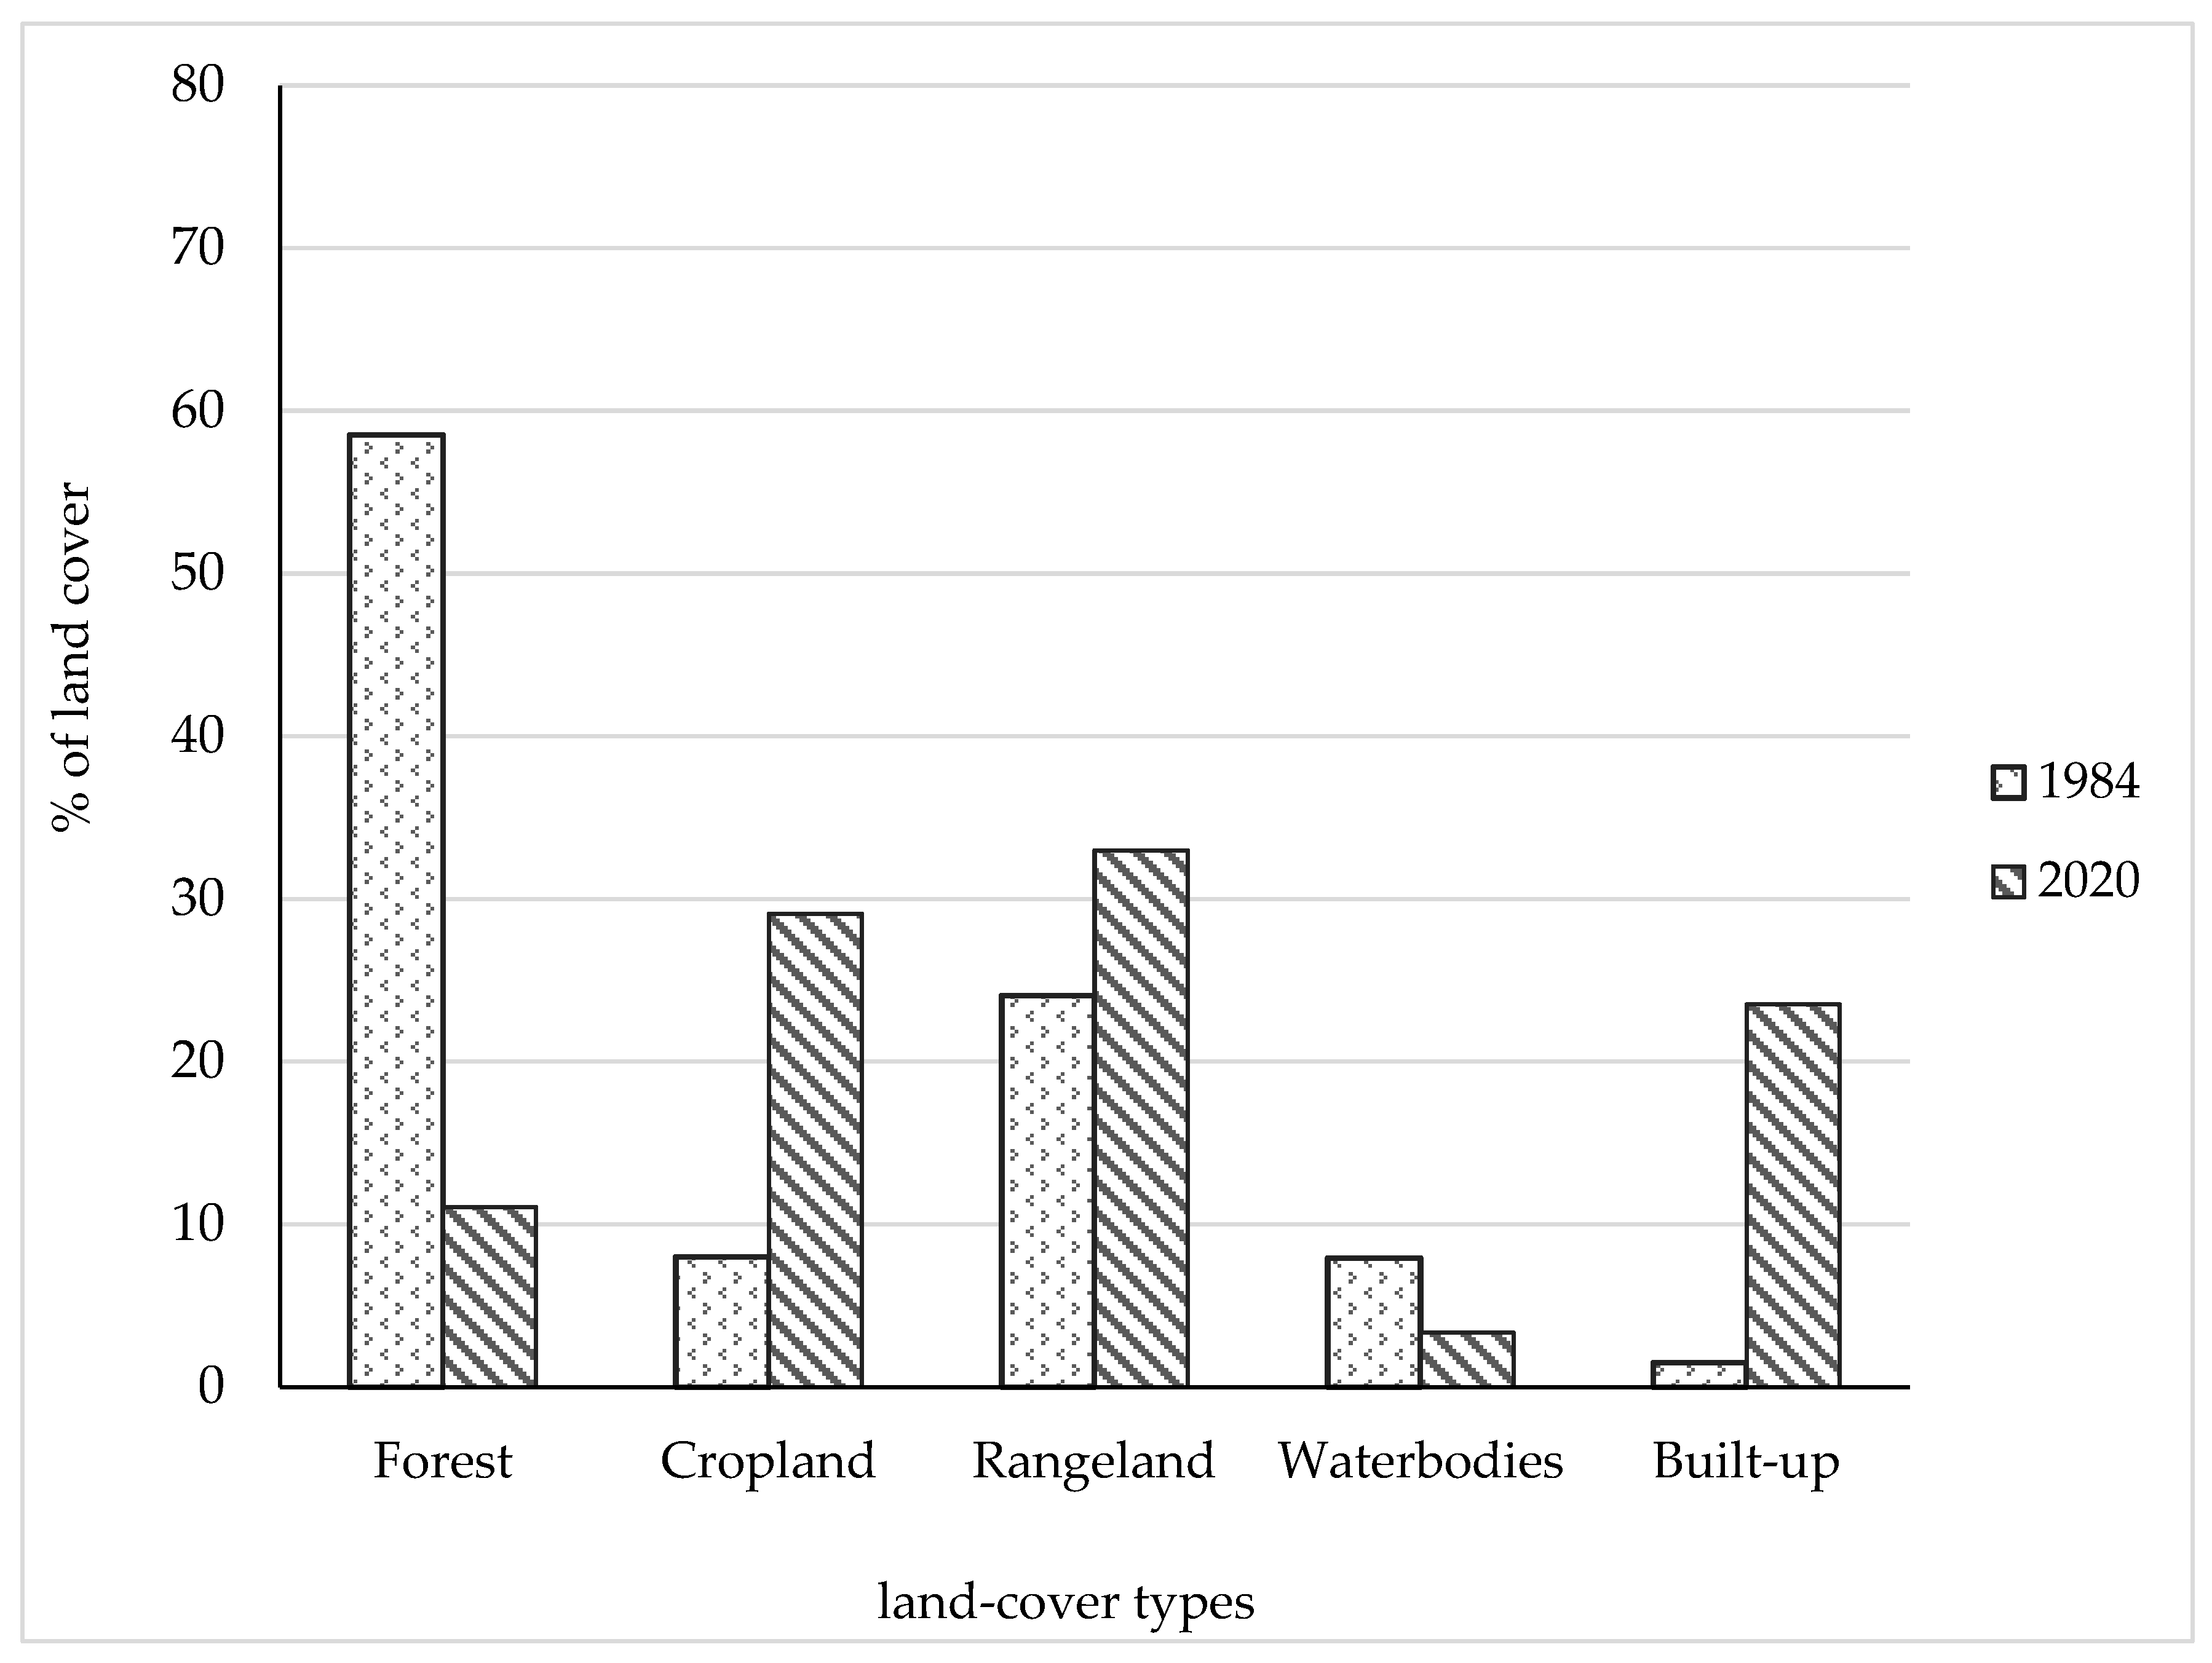
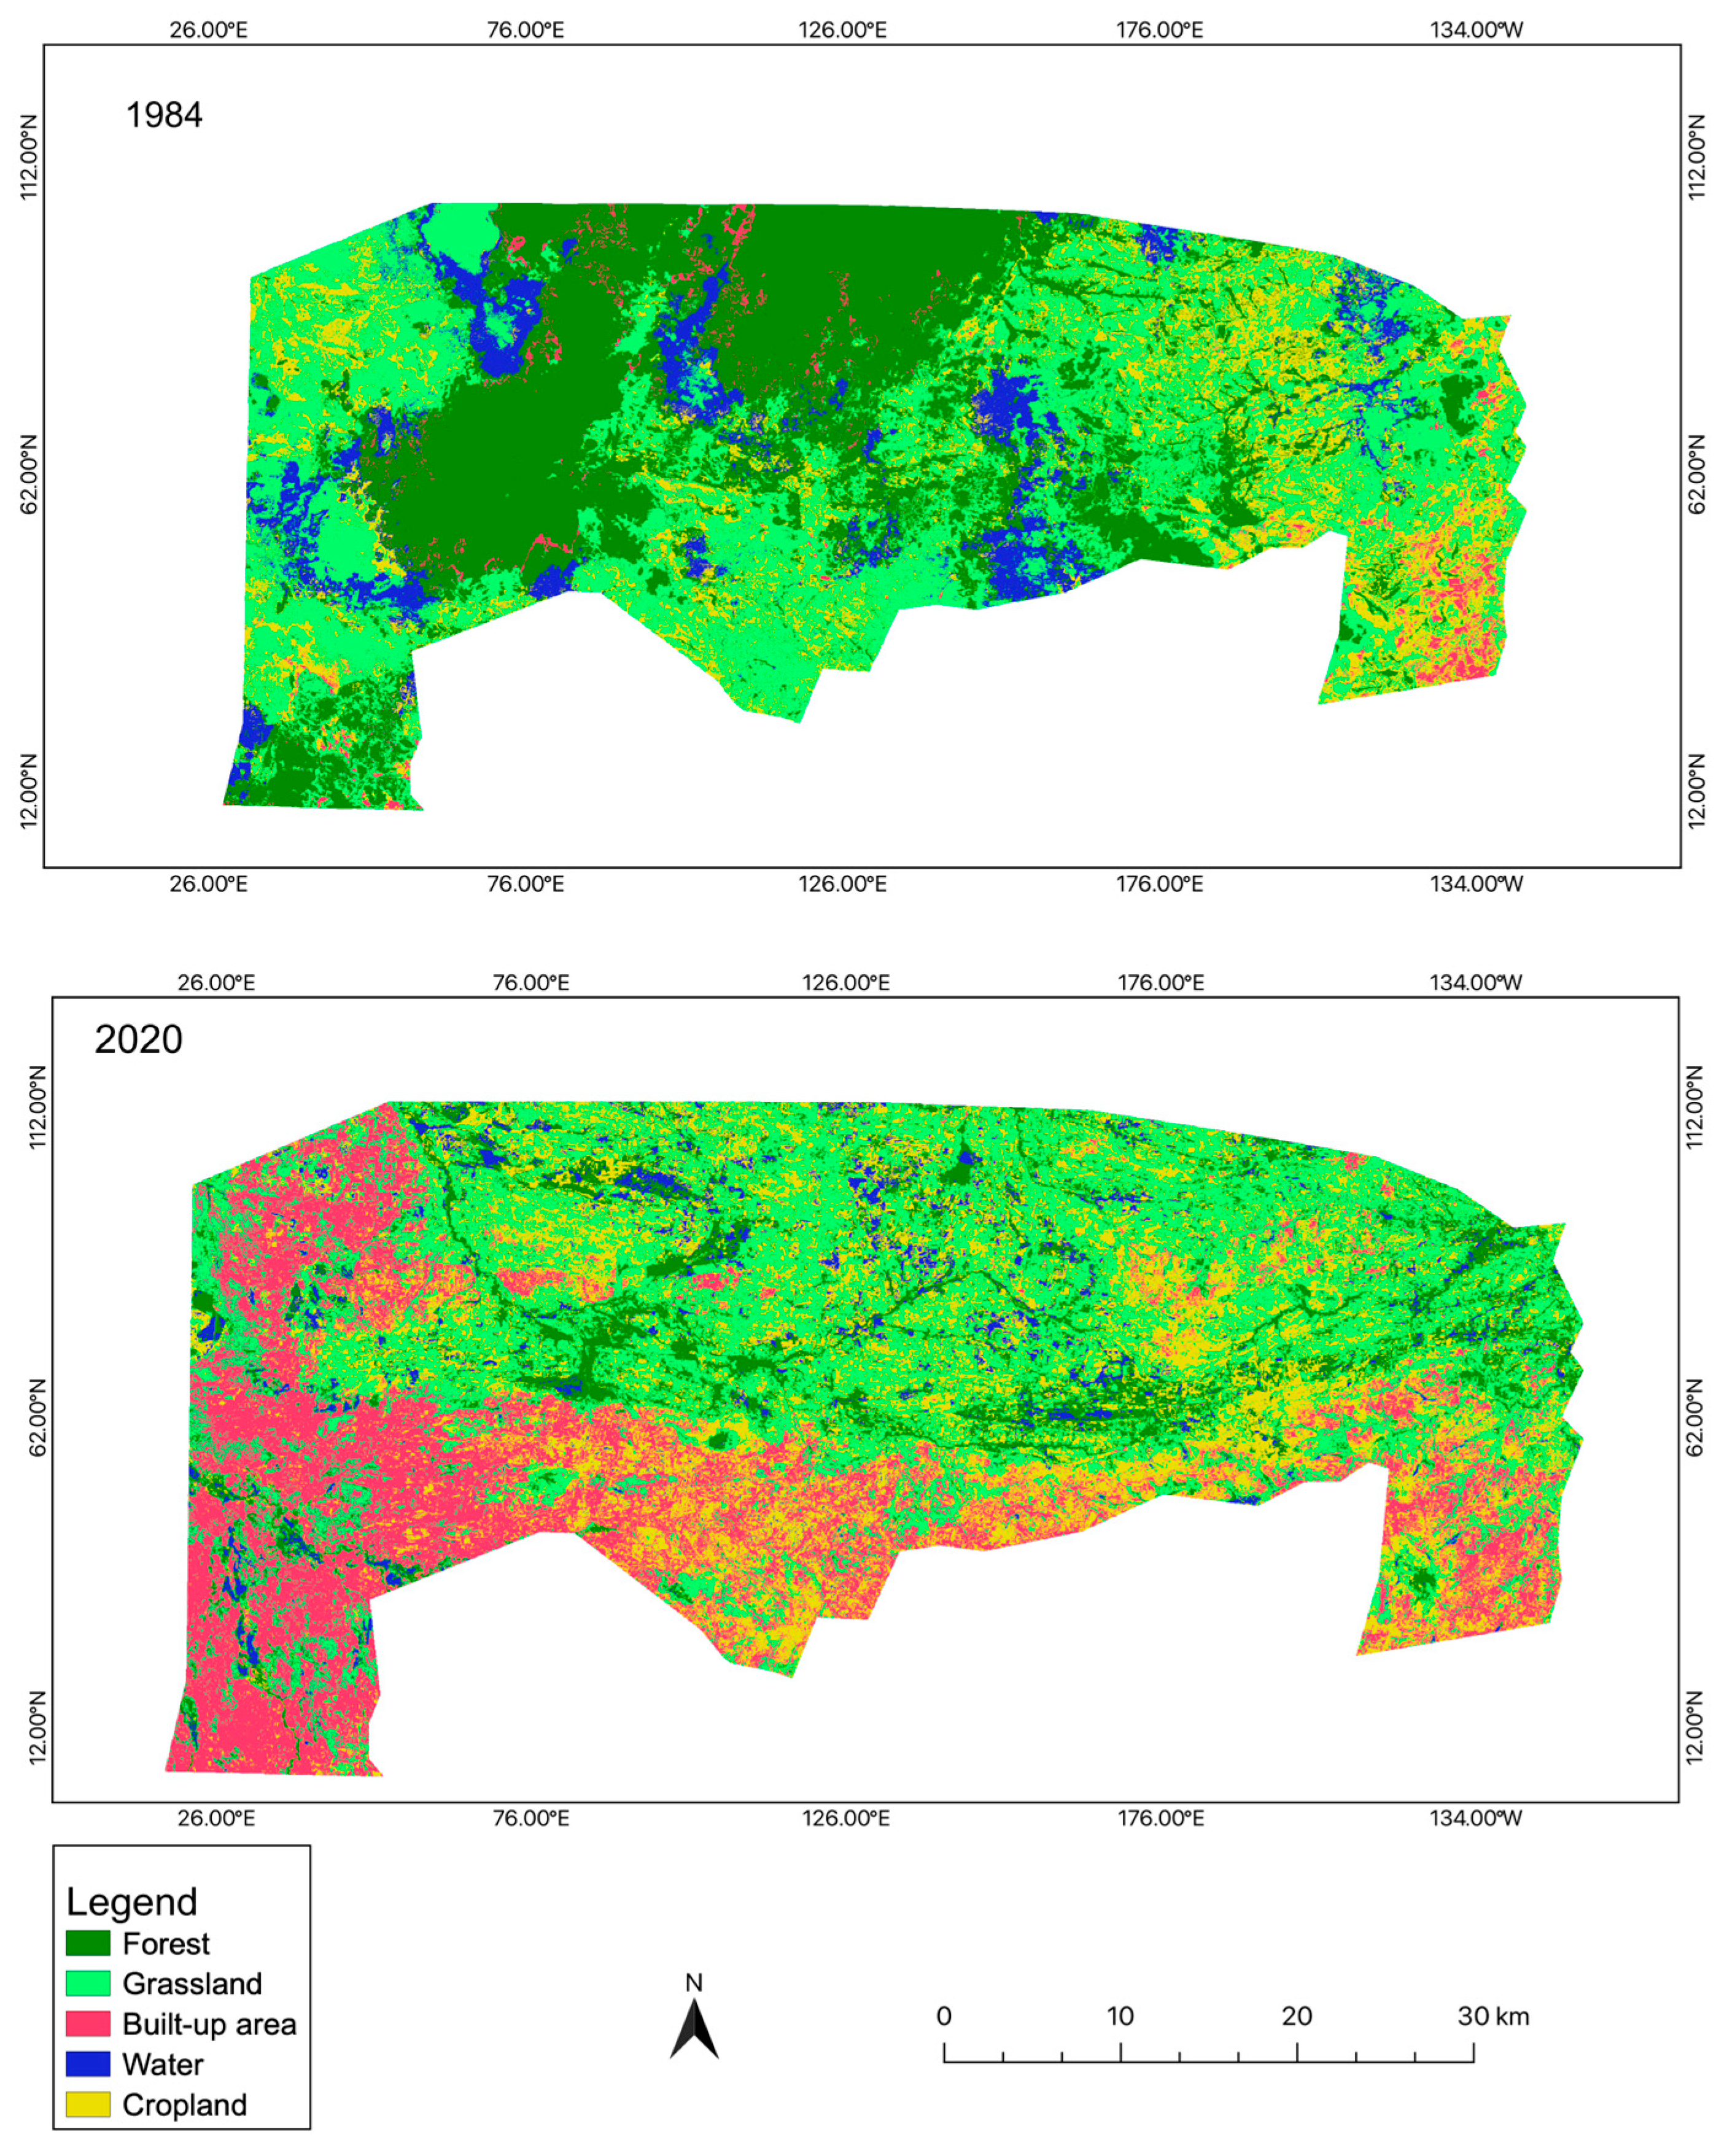
In 1984, the entire landscape in Chief Chikanta’s area comprised five predominant land-cover types of different proportions and spatial extent (Figure 3). The forest, which comprised Riparian, Miombo, Mopane, and Kalahari woodlands [39], had the highest proportion, covering 58.5% of the approximate 1754 km2 of total land cover. Forest patches were concentrated along the rivers in the central area extending from the Nanzhila Water Catchment in the Kalomo Hills Forest reserve (KHR-13) to the north, with some forest patches on the south of the chiefdom. Cropland accounted for 8% of the total land and was extensively spread out in the southern part of the chiefdom and some patches dotted around the forest reserve. Rangeland (including seasonal wetlands) accounted for 24.1%, which, until now, served as grazing areas for livestock farmers due to the ability of the rangeland to retain moisture during dry seasons. Although open surface waterbodies were difficult to detect, the inundating evergreen deciduous forests were indicative of the dense network of the Nanzhila water system. Waterbodies, including rivers, dambos (permanent wetlands), ponds, and dam lakes, covered 7.9%. The Kalomo Hills Forest Reserve was established partly to protect the Nazhila Water Sub-catchment, one of the largest in the lower Kafue Basin. The built-up area, which includes bare land, village settlements, a road network, and other infrastructures, accounted for 1.5%.

4.1.3. Land-Cover Change in Chief Chikanta’s Area

Between 1984 and 2020, the area’s spatial distribution and extent of land-cover types changed, mainly due to village-to-village migrations from the south, central and northern areas. Small-scale farming activities (crops and livestock) are concentrated in the south and east of the area. In 1984, the forest took the largest part with 58.5%; cropland covered 8.0% of the area, rangeland 24.1%, waterbodies (dambos, wetlands, open water) covered 7.9%, and the built-up area accounted for 1.5%. In 2020, the major land-cover categories were cropland (29.1%), rangeland (32.9%), and built-up areas (23.5%), while waterbodies (3.3%) and forest (11.1%) had significantly dropped. Figure 2 compares the land cover in Chief Chikanta’s area in 1984 with that in 2020, which will be further discussed below.
Table 4 lists the land-cover transitions in the Chikanta landscape between 1984 and 2020, accounting for 1428.8 km2 (81.5%). This implies that only 18.5% (325.2 km2) of the landscape—represented by the total of the bolded diagonal figures in Table 4—remained unchanged compared to the 1984 land-cover status. Net forest loss in this period amounted to 84.1%, predominantly due to conversion to rangeland (33.1%), cropland (28.5%), and built-up area (22.5%). Intermittent droughts led to some patches of farmland transitioning to other land uses (8.0%), as some farmers abandoned agriculture and opted for other activities such as charcoal production. Waterbodies decreased by 7.9%, which could be attributed to anthropogenic activities causing siltation, hence the marginal gains in forest cover (12.5%).
Between 1984 and 2020, built-up areas reached 412.5 km2, an additional 23.5% compared to 1984. These results corroborate the Kalomo District report [53], showing that rural infrastructure expansion has significantly increased due to expanding smallholder farming. In the same period, cropland increased by 29.1% to 510 km2. Similarly, rangeland gains from almost all other land uses increased by 33.0%, which could be attributed to various causes (Section 4.3), including livestock activities that convert forests to savannah rangeland. Both the expansion of agriculture and livestock resonate with the government’s policy to accelerate rural economic growth through food production [54], albeit at the expense of natural habitats and their biodiversity.

4.2. Drivers of Landscape Change: Participants’ Views

We elicited participants in each MSP to produce a list of drivers of landscape change that could explain the trends observed in the land-cover maps. Table 5 shows the resulting 25 drivers of landscape change, grouped into six categories, some exacerbating changes and others slowing them down. These include social and interpersonal, cultural, ecological, environmental, economic, climate change, and governance-related (organisation, policy, and legislation) variables.
The findings show differences in perceptions of drivers of land-use change by gender, age, or MSP. Participants explained the drivers based on their memories of lived experiences related to economic, environmental, and social events from the 1980s to 2020. A lack of trust, legitimacy, and accountability in leaders and corruption were the primary societal drivers of land-use change, undermining public trust in land administration institutions. Villagers’ perceived mistrust in the authorities and a lack of legitimacy in decision-making mechanisms contribute to inequities in access to land, especially for the marginalised. As a result, some people often disregard local rules governing usage and access to land. For example, they said cultivation or grazing in wetlands and riverbanks, sacred landscapes, and increased indiscriminate cutting of trees for charcoal production are forbidden. However, rule enforcement favours some and does not apply equally. The issue of migration as a driver of landscape change (between villages and from outside the chiefdom) was thorny, perhaps because most are migrants. However, the discussions hinted that migration instigates the demand for additional land for settlements and cropland. The group discussions also identified the effects of economic policies of the 1980s that routed considerable investment to support agriculture and boosted the demand for land.
Youths in all groups did not identify any cultural aspect, whereas men and women, especially in MSP2, rated cultural aspects as low. All groups concurred that in addition to economic factors such as the demand for food, which triggers a triple effect of overgrazing, demand for cropland, and biomass energy, ecological and environmental variables, including deforestation and climate change, are crucial in driving landscape change. Governance-related variables such as poor policy and institutional coordination in land management between agricultural officers and forest managers contribute to the failure to offer extension services to address unsustainable practices. Political interference by politicians was reported to influence the land distribution, thus escalating settlement disputes, for instance, with regard to the settlements in KHF13.

4.3. Deliberating Landscape Dynamics to Uncover Shared Challenges

4.3.1. MSP1: Habulile Village

In discussing various aspects of landscape transitions presented in the land-cover maps, participants related their experiences to some past and current social and environmental events. Initially, the discussions were amicable, with no disagreements emerging, even though males predominated the main meeting, as youths were conspicuously silent (probably for cultural reasons). Eventually, discussions became heated, especially in focus group discussions. Gender, age, knowledge of the area, and social status all influenced how the maps were interpreted.
The elderly participants (>50 years old) recounted the effects of some historical environmental events and the impacts on the landscape, notably the devastating three-year drought of 1992–1994. They attributed droughts to deforestation and lacking respect for sacred landscapes (locally called Malende, the rain gods). The environmental and socioeconomic impacts of droughts have reportedly put immense pressure on the forest reserve, rivers, and wetlands. For instance, due to low pasture availability and poor crop harvests, most households eventually resorted to harvesting non-timber forest products for food and charcoal production. Following such experiences, all participants identified pasture management as a common concern. Among some measures to help manage communal pastures, participants proposed strengthening local rules to regulate grazing regimes on communal pastureland.
Participants debated unplanned settlements and the need for a systematic land allocation approach. They also concurred with the youths’ proposal that the higher hierarchy officials in the customary administration should be engaged in holding local village leaders accountable for land allocation. This referred to large parcels of land allocated to the so-called ‘immigrants’ for cropland and settlement. They agreed that settlements had grown exponentially in the last three decades, particularly near the chief’s palace and towards the forest reserve. Similarly, between 1984 and 2020, participants echoed that the land resource had been under pressure, with cropland and pastureland increasing to almost their full carrying capacity. Accordingly, this was triggered by enhanced agricultural production methods (using animal draught power, tractors, and fertilisers). As a result, public and private institutions have gradually increased their investments in infrastructure development, such as schools, health facilities, telecommunications, energy transmission infrastructure, agricultural commodities storage facilities and road networks.
In discussing natural resource governance issues, female participants noted that previous efforts to negotiate land uses were characterised by insufficient stakeholder participation regarding land access and resource rights. Similarly, the male group voiced concerns that village stakeholders are rarely included in the formulation of local area plans (LAPs) that feed into integrated development plans (IDPs) at the district level [they referred to the IDP and chiefdom’s master plan of the 1970s]. Youth and women’s groups reiterated that while they had not come across any Local Area Plan, “a land-use map that includes our collective aspirations is essential” (MSP1, October 2021). In concluding the discussions, all groups identified the need for a community forest management plan to guide the sustainability of their future landscapes. However, men were quick to add that considering previous initiatives facilitated by conservation NGOs (e.g., the USAID Community-Based Natural Resources and Sustainable Agriculture (CONASA) project supporting local communities in resource governance in the 1990s), tree planting was a ‘failed project’ and preferred assisted natural regeneration (prescribed fallow period for abandoned crop fields). To restore wetland areas, participants reiterated imposing punitive measures to deter unsustainable grazing behaviour.

4.3.2. MSP2: Siankwembo Village

As in MSP1, the remote sensing maps were evaluated, and participants agreed that a realistic scenario of landscape transformations was presented. Protracted disagreements hampered the discussions (main meetings and focus groups) on practically every issue. This highlighted deep-seated class-based differences—poor vs. the rich, immigrants vs. locals, and politically connected vs. commoners. This was observed when discussing grazing land, boundary disputes, and land management issues. Participants engaged in counter-accusations concerning the reasons for landscape change, while others uncompromisingly highlighted the impacts of migrants on the social order in the village (mostly from outside the chiefdom). This referred to the people displaced because of the establishment of the Kariba Dam who migrated and settled in the area in the 1970s. This group of people is considered wealthy in terms of cattle husbandry. To enable successful engagements, the moderator (a local person selected at the beginning of the meeting) often intervened to mediate the debates on their perceived differences.
Nevertheless, all participants acknowledged that since 1984, large tracks of forest land had been converted into cropland and grazing land, viewed as the two most competing land uses in this village. The youths contended that the massive cropland expansion seen in the land-cover map for 2020 results from influential farmers who allocate and accumulate fertile land to themselves, e.g., by opening patches of small fields in various locations and claiming ownership. They also stated that settlements had expanded, especially along waterbodies, as moist grass in water areas is suitable for livestock rearing. In the main meeting, some participants (later identified as large livestock farmers) did not agree with the rest that livestock impact forest loss and siltation in wetlands. However, women argued that the so-called wealthy farmers monopolised access to grazing land by corruptly manipulating the poor to masquerade ownership of livestock to access communal grazing areas. Women and youths bemoaned that rangeland has replaced once-traditional water sources (wetlands and streams), and tributaries of Nanzhila River have changed flow courses downstream. The critical common concern in MSP2 regarded issues of clarifying access and rights to rangeland, waterbodies, and forest resources.

4.4. Participatory Mapping of Envisioned Landscapes in Focus Groups

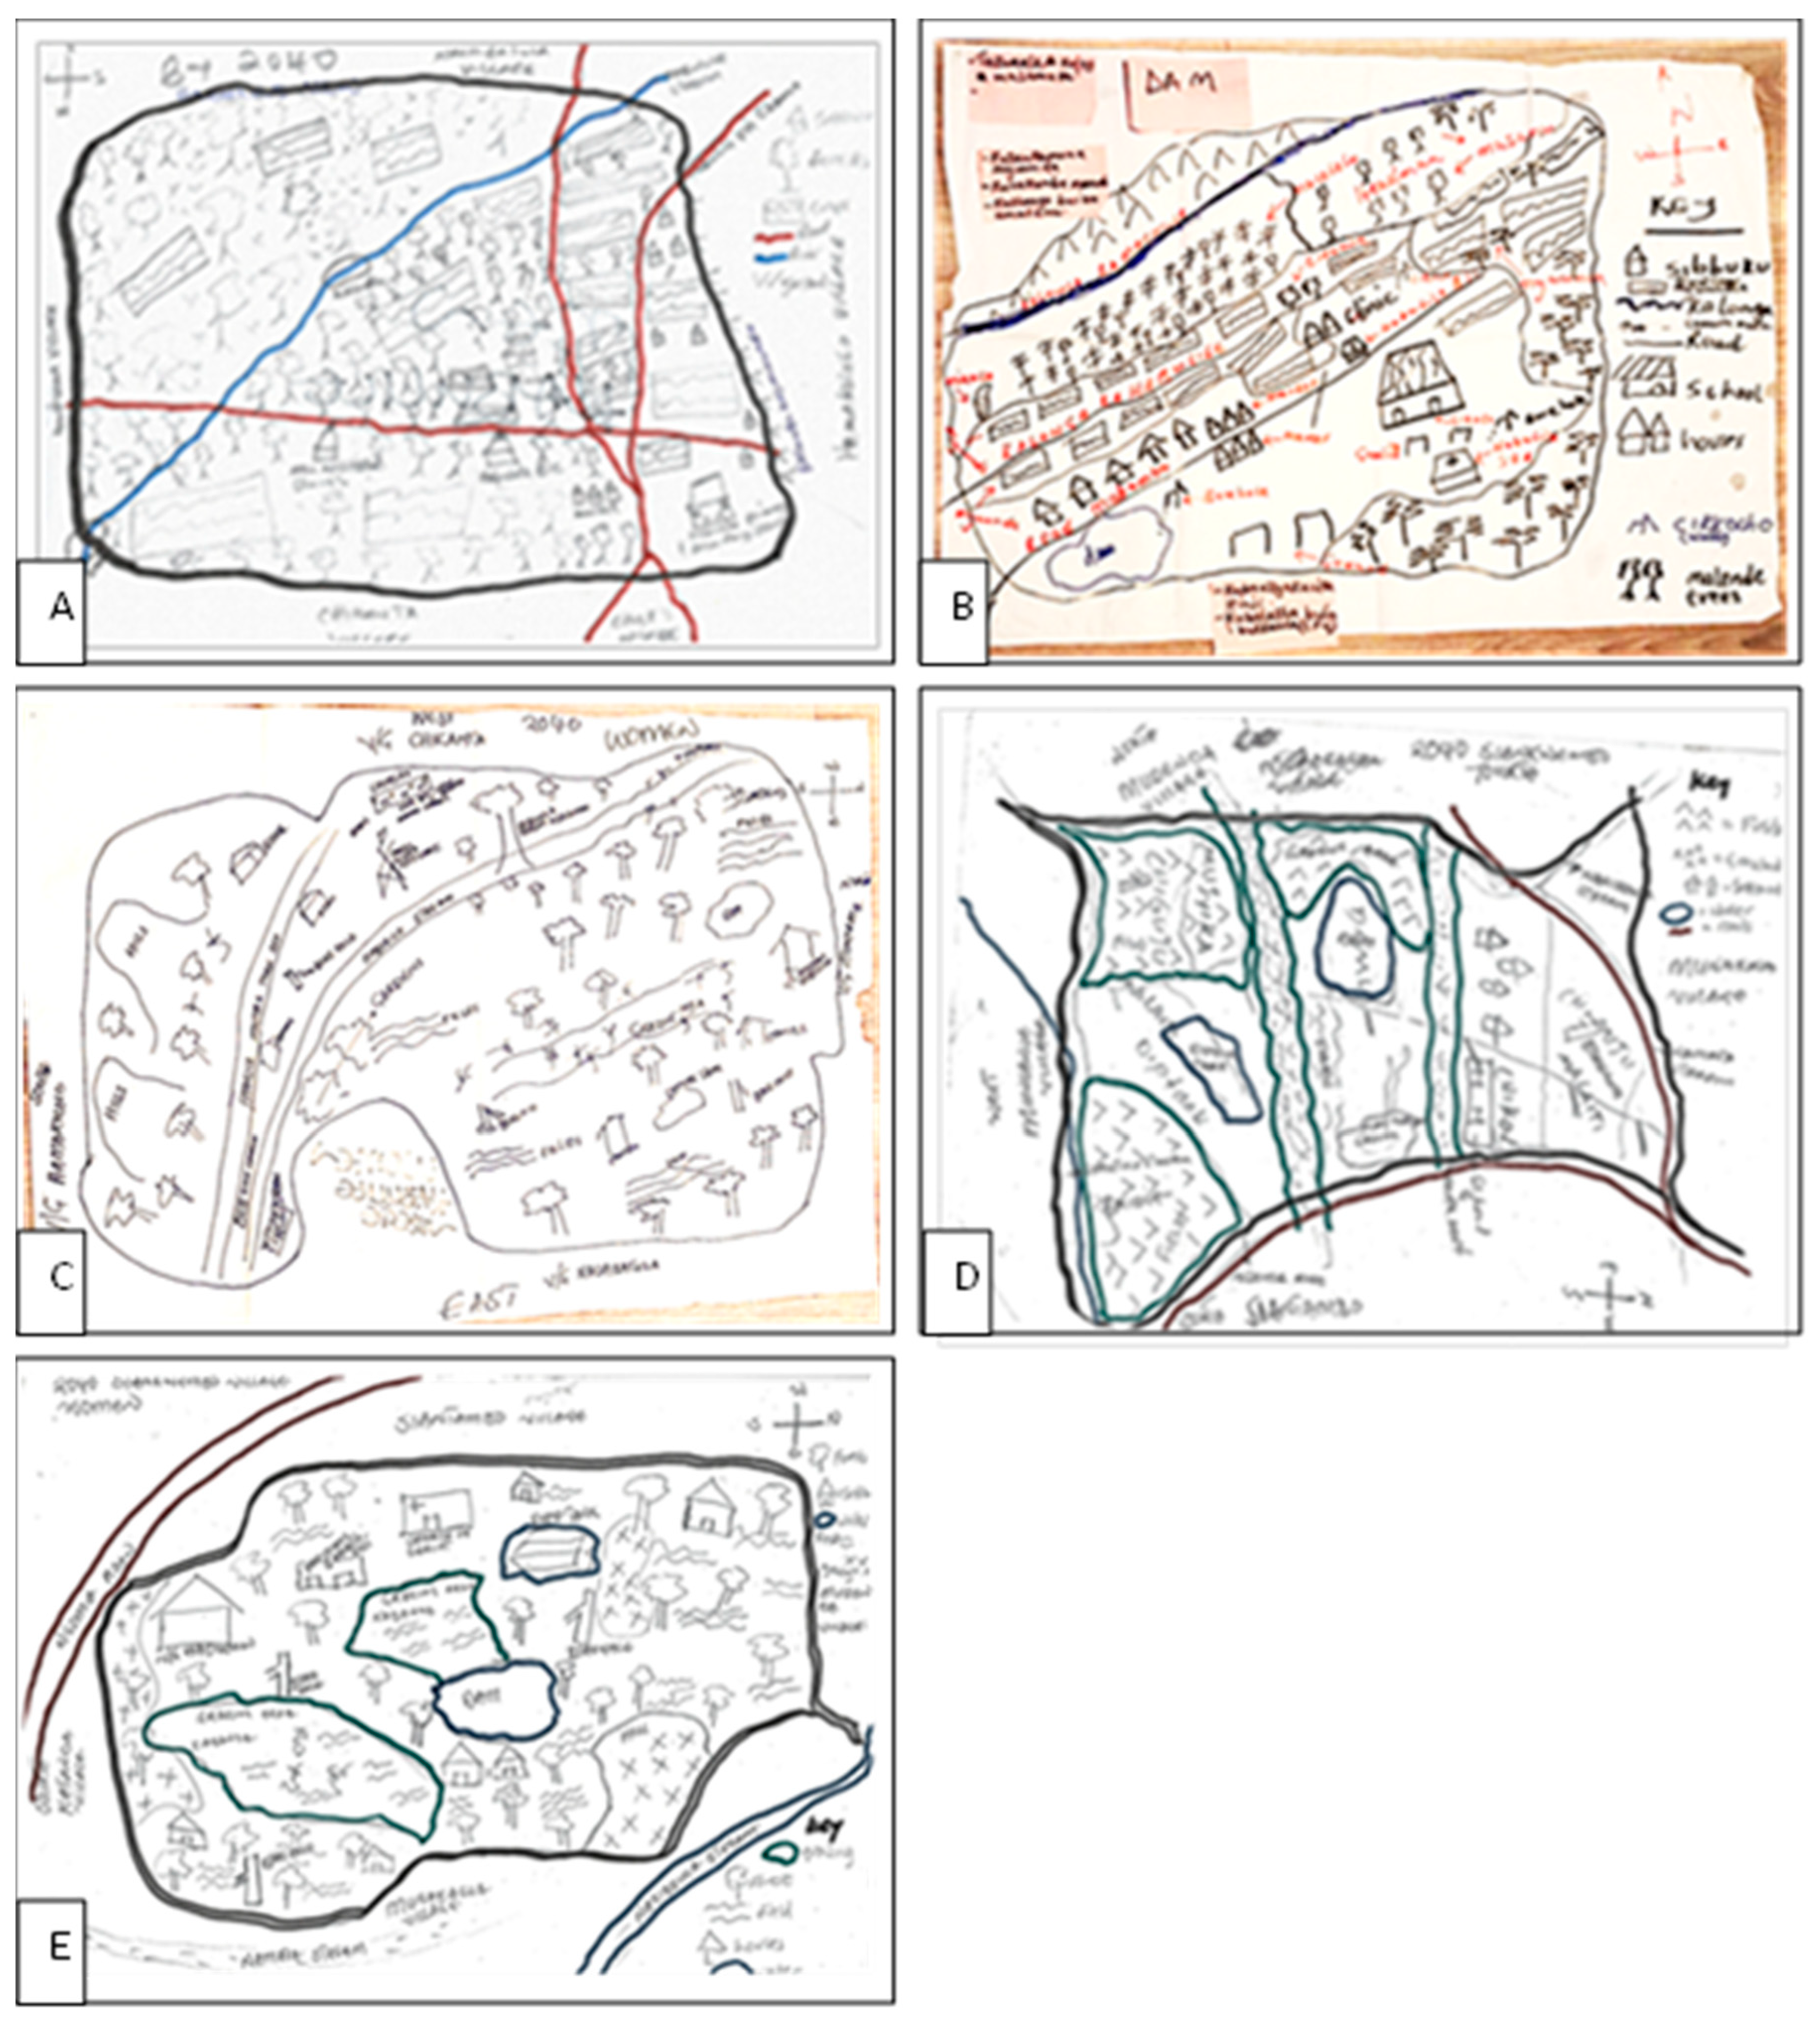
In the two MSPs, participatory mapping was carried out in various groups of men, women, and youths (Figure 4). These maps were eventually debated, and a unified map was created, aligning all groups’ concerns (Figure 5). The envisioned future was projected as 2040 based on a 20-year time frame. In both MSPs, participants debated on what constituted a ‘future’. They agreed that a two-decade forecast was feasible based on rural life expectancy, rural migration dynamics, and coverage of the area development plans. Three possible scenarios emerged from this process: agriculture-dominated, forest-dominated, or grassland-dominated, with preferences differing according to gender and age, as elaborated below.
Each group envisioned a land-use balance in the future landscape based on their preferences. In MSP1, men preferred a balance of forests and rangeland (grazing land) and desired to allocate cropland intercropped with trees (conservation farming). Infrastructure was envisioned to reduce by restricting ‘newcomers’. They proposed reassigning abandoned farms into forested spaces rather than maintaining built-up areas. However, their male counterparts in MSP2 failed to produce any map as they could not agree on most issues that required harmonising individual interests. For example, some men preferred a rangeland-dominated landscape to graze cattle, others favoured a forest-dominated landscape, and others considered cropland a preferred landscape.
Women’s preferences in MSP1 were motivated by a desire to improve their land rights and access. They desired an agriculture-dominated future landscape and forests with increased space for gardens (to produce vegetables to improve household incomes) and less rangeland. They environed a future landscape with restored water sources and preferred to maintain the 2020 status quo of the built-up area. Women in MSP2 aspired to a similar scenario, although they emphasised a future with sufficient water through activities to restore wetlands and water flows in streams so that they would not have to travel long distances to search for water, especially in the dry season.
Youths in MSP1 were concerned about the haphazard planned village layout. They desired a future that responds to the expected population growth by equitably allocating sufficient agricultural land to all households. Youths in both MSPs want a future with a grazing regime that limits the number of cattle that may be maintained based on the carrying capacity of an individual’s land, allowing some communal grazing area (rangeland) to be reclaimed for forest regrowth. They anticipated this would decrease cattle disease transmission, which has been an issue in the area for some time. MSP1 youths, like those in MSP2, envision a future with less rangeland and more forests by interplanting trees and crops in farmland. Both youth groups envision allotting land for a dam to harvest rainwater and serve as a water source to relieve the demand on the already overused natural water system.

Negotiated Mapping of Desired Future Landscapes

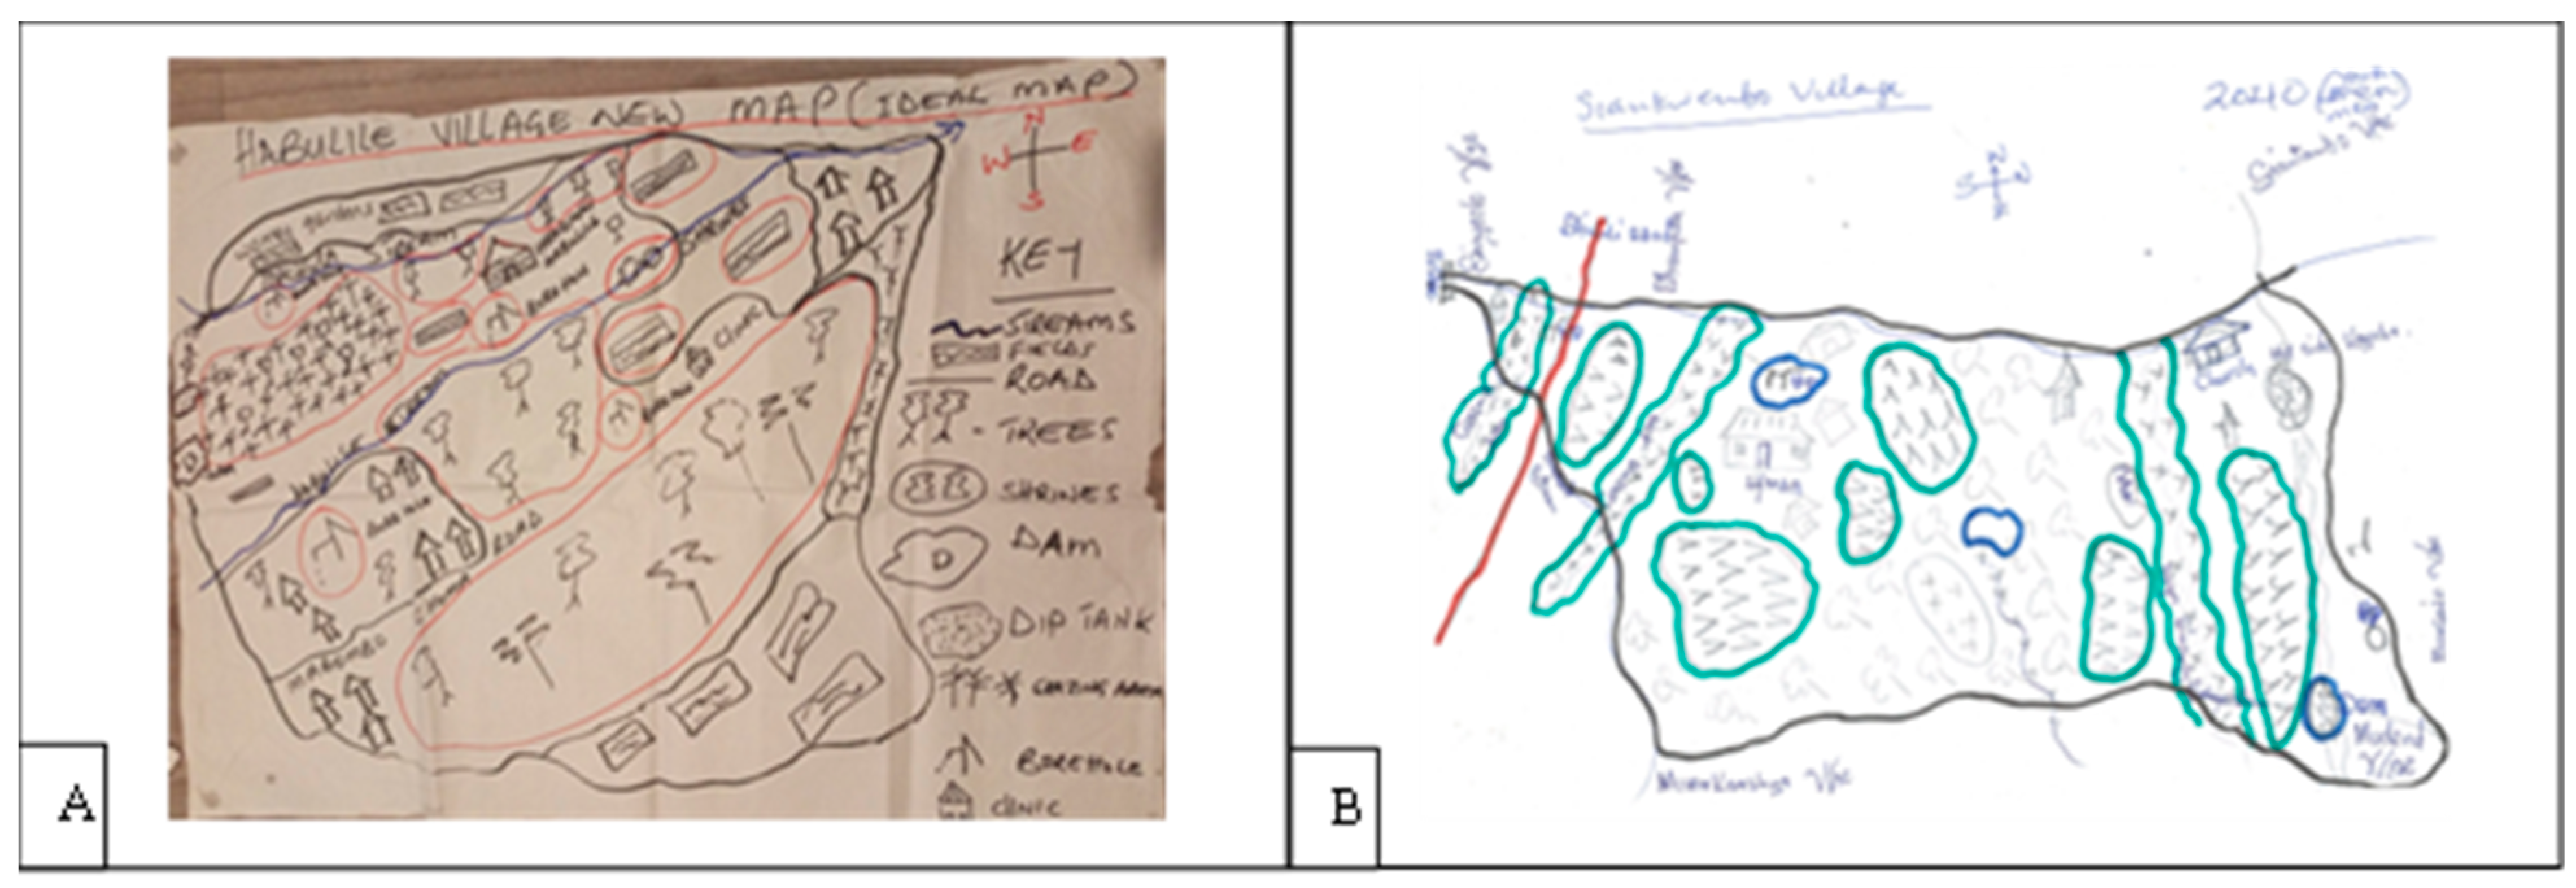
Figure 5 depicts the final collaborative, participatory maps to capture common concerns, including issues of grazing land, deforestation, and access to water. In MSP1 (Figure 5A), all participants projected a forest-dominated landscape by implementing conservation agriculture systems that intercrop trees on the same piece of land to optimise the forest-cropland ratio. They also anticipate a future with restored natural water systems by strengthening local land-use rules and restrictions. By 2040, MSP2 participants (Figure 5B) envisioned a landscape characterised by a balance of cropland and rangeland. This was a compromise between two main land users, mainly male groups. They all agreed, however, to work with other stakeholders, including the Forest Department, to redesign the forest reserve’s current land use to allow for a new model, such as a community-managed landscape, which would enable them to strengthen controls on any alleged illegalities. They claimed maintaining the landscape as a forest reserve is no longer attainable under the current circumstances as it perpetuates contestations between village stakeholders and state institutions (Forest Department).

5. Discussion

We explored the use of spatial tools as boundary objects in two MSPs in Zambia to identify common concerns in land-use negotiations. The study addressed three interrelated questions about how the landscape has changed between 1984 and 2020 and how diverse land users construct drivers of landscape change. Lastly, we sought to understand how stakeholders negotiate trade-offs that lead to mapping desired future landscape scenarios in the context of integrated landscape governance.
Participatory and remote sensing maps have a long history in spatial planning schemes in various contexts. The underlying assumptions are that spatial tools support inclusive landscape governance by inspiring transparent dialogue and addressing geodata needs in land-use planning processes [55]. With the renewed call for integrated landscape governance that focuses on multistakeholder processes [56], the question remains how to use these tools more inclusively by broadening the scope and representativity of stakeholders [23]. Further, inclusive governance paradigms must explore new technologies that make planning more accessible to illiterate, disabled, and marginalised people [11]. This study aimed to provide insights to address these concerns.
First, we demonstrated that allowing participants living in the landscape to interpret the remote sensing maps can enhance land managers’ understanding of the local-level variables contributing to landscape dynamics that would otherwise be difficult to perceive in remote sensing data. A similar study in Zambia’s rural context sought to understand the influence of socioeconomic factors on land-use change [57]. However, the present study adds empirical detail on the complexity of landscape dynamics, primarily related to broader socioeconomic issues occurring beyond the study area. The study’s findings are consistent with the broader regional social and economic developments, revealing several drivers influencing landscape dynamics since the 1980s [58]. These drivers are related to the demand for biomass energy, agro-pastoral expansion, infrastructure developments, and poor governance at the sub-district level. Similarly, the period between 1984 and 2020 corresponds with continued deforestation exacerbated by ecological and anthropogenic factors such as drought and climate change, although at a much slower rate due to compensations from regrowth in abandoned agricultural land and a gradual decline in agro-pastoral activities owing to animal diseases and depressing macroeconomic activities, as well as improved law enforcement.
Second, the study indicates that remote sensing tools provided a good basis for local participants to engage in discussions on drivers of landscape change and find common ground while providing a feedback loop for researchers, resource managers and politicians. Combining different spatial tools ensured that different knowledge systems co-produced evidence-based problems and solutions. For instance, although remote sensing maps are complex, requiring specialised computer software, participatory mapping brings out lived experiences and knowledge of landscapes. Thus, this study confirms that combining the two approaches helped strengthen dialogue in the MSPs and contributed to the empowerment of those who could have previously been excluded from landscape governance. For example, we noted during the discussions that participants had fewer arguments about the state of the landscape as depicted in the spatial maps. In similar ways, land managers and policymakers may not doubt the remote sensing maps, but the story is incomplete. Differences in the interpretations and eventual mapping of envisioned future landscapes are understandable, given that local people hardly have the same priorities, perceptions, or future desires because their attachment to landscape differs [59].
Third, the application of participatory mapping in the two MSPs helped analyse the elements of inclusive governance. MSP1 has a long-standing governance practice in negotiating various local issues. However, inclusiveness in terms of accommodating diverse perspectives, especially those of women and youths (by men), is still influenced by local cultures, resulting in decisions lacking legitimacy. We noted that separating groups based on gender and age helped overcome cultural constraints that Mccall and Dunn [9] call ‘participatory exclusion’, i.e., being present in the meeting yet not fully able to engage due to (sociocultural) limitations. In MSP2, social differences, including wealth, gender, and the historical ‘social divide’ based on the area one hails from (migration issues), hindered effective engagement in the planning process. Although men could not achieve consensus in creating a map, their participation in debating the desired future scenario implies that the process was open to inclusive dialogue, which is the objective of using negotiation tools. The response from men who could not initially agree to disagree or agree on common concerns is encouraging. However, we cannot assume arbitrarily that their desire to engage in a final meeting reflects inclusivity.
Fourth, negotiation during the mapping of future scenarios can sometimes invoke personal emotions due to differences in attachments to landscapes that reflect personal feelings and interests [59]. Effective moderation is critical to successfully negotiating desired future landscapes involving several stakeholders, especially when power imbalances exist. The most powerful stakeholders sometimes sideline the views of marginalised groups regarding their desired future. Nevertheless, effective moderation and using spatial tools allowed the marginalised group to readily communicate their viewpoints by referring to the boundary object (maps) as the subject rather than focusing on their perspectives.
Based on this study, we can deduce that using spatial tools also poses some potential risks. To begin with, policymakers may be sceptical about the validity of participatory spatial tools and may not take them seriously [11,60]. For instance, participatory spatial tools may obscure power imbalances and hide some actors’ ulterior objectives. This is because spatial tools are generally used in closed spaces of limited participants [11] whose selection process may deliberately exclude potential participants with divergent views. We also noted that sacred landscapes exist called Malende, but participatory mapping was challenged due to privacy and confidentially issues surrounding these sacred landscapes. This implies more attention is needed to the ethical considerations of how to deal with what is put on a map [61,62]. Finally, participatory spatial tools generally focus on local processes, keeping telecoupling effects out of sight, such as the ripple effects of global connectivity in the socioeconomic and environmental networks [63].
In the inclusive landscape governance literature, there is remarkable growth in the diversity of methods, tools, and applications of theories of spatial tools in land-use management (see [11]). These developments have methodological implications for this study. The most often used methods in land-use mapping literature are predicated on theories from sustainability science, collaborative planning, pragmatic planning and postmodern methods such as planning approaches that are “open to a diversity and plurality of styles and ideas” [64,65] (p. 474). Further, there is also a tendency to anchor spatial planning in geospatial and remote sensing technology to derive biophysical variables [66], while stakeholder perceptions in participatory mapping of desired future landscapes are at the margins of research [61,67]. Whereas this study has demonstrated the efficacy of combining the two approaches, further research is needed to address some limitations of this study. We focused on two small villages as case studies, implying that the findings should be interpreted in this specific context, but the methods can be applied more broadly. We recommend scaling up the combined use of remote sensing and participatory mapping to the district level to understand landscape dynamics and its governance implications beyond the village level and promote more inclusive landscape governance.

6. Conclusions

This paper provides insights into the question of how spatial tools can facilitate land-use negotiations and plan future sustainable landscapes in MSPs based on inclusive and equitable decision-making.
This paper shows that MSPs, as a form of negotiated governance, require practices that overcome inequalities and improve trust in participatory planning. We conclude that while remote sensing can provide a basis for discussing historical trends, participatory mapping of desired future scenarios potentially triggers a process to identify common concerns and co-produce actionable priorities. Prior to mapping, the process of identifying problems and agreeing on land-use priorities initiated a negotiation process of trade-offs and synergies involving pastureland, water, forestry, and agriculture. We showed that stakeholders in one MSP ultimately reached a compromise on a draft land-use map, which was widely regarded as a potential tool for further negotiations with the district land-use planners. Meanwhile, participants in the second MSP created a common map without consensus due to deep-seated social-cultural issues such as class-based differences of migration origin and land-use preferences. The disparity between the two illustrates that the potential of MSPs for negotiations must be understood in the context of the environmental histories of a place and within the constraints of place-based institutions rather than being generalised.
Finally, this paper illustrates two issues regarding spatial negotiations in MSPs: first, the same institutions designed to facilitate negotiations occasionally turn into spaces that engender resistance to successful negotiation outcomes from some participants, given differences in power positions and hidden agendas. This can be a source of illegitimacy and cause failures to implement the plans. Second, MSPs must be inclusive and foster legitimacy and a collaborative process.
The authors recommend that those steering MSPs stimulate them to evolve from “mere consultation forums” to “innovative, participatory platforms”, encouraging stakeholders to engage in genuine negotiation processes that enable alternative outcomes. We contend that such an approach, supported by spatial tools, is likely to contribute to the implementation of integrated landscape approaches. Policymakers and land users can use these spatial tools as boundary objects in user-focused strategies that engender inclusive stakeholder participation and ensure legitimate, acceptable, and sustainable outcomes.

Author Contributions

F.S.S.: Conceptualization, Methodology, Data curation, Formal analysis, Visualisation, Writing—original draft. M.A.F.R.-T.: Conceptualization, Writing—reviewing and editing, Methodology, Validation, Supervision. J.R.: Investigation, reviewing and editing, Supervision, Funding acquisition. E.R.C.B.: Reviewing and editing. T.S.: Reviewing and editing, Supervision, Validation, Funding acquisition. All authors have read and agreed to the published version of the manuscript.

Funding

This research was funded through a grant from the International Climate Initiative (IKI) of the German Federal Ministry for the Environment, Nature Conservation, Building and Nuclear Safety (BMUB) (grant 18_ IV_084) for the Collaborating to Operationalize Landscape Approaches for Nature, Development and Sustainability (COLANDS) initiative carried out by the Centre for International Forestry Research (CIFOR) in collaboration with the University of British Columbia, the University of Amsterdam, and local partners in the countries of implementation.

Data Availability Statement

The data will be available from the corresponding author upon reasonable request.

Acknowledgments

We acknowledge the tremendous technical support in preparing the land-cover maps by Keddy Mbindo of the Forestry Department and Chenje Mtonga and Christopher Silengwa from the National Remote Sensing Centre staff in Zambia. We also thank Kwabena Asubonteng of the University for Development Studies in Ghana for offering his GIS and remote sensing expertise to check the geospatial procedures, analysis, and outcomes in this manuscript.

Conflicts of Interest

The authors declare no conflict of interest.

Appendix A

Table A1. Specification of satellite data used for the Chikanta landscape.
YearFilter DatesImageSatelliteBand Combination
19841 September 1984–30 September 2020LT05/CO1/T1_8 DAY_NDVILandsat432
20201 September 2020–30 September 2020LC08/C01/T1_8 DAY_TOALandsat543

Notes

1
COLANDS (https://www.cifor-icraf.org/colands/, accessed on 16 October 2022) stands for Collaborating to Operationalise Landscape Approaches for Nature, Development and Sustainability and is an initiative led by the Centre for International Forestry Research (CIFOR) in cooperation with the University of British Columbia and the University of Amsterdam and local partners in Ghana, Zambia, and Indonesia (Reed et al. 2020).
2
Village 2 is part of the COLANDS initiative, of which this study is a part but was not included in this paper as it had no multistakeholder platform.

References

  1. Bartolini, N.; DeSilvey, C. Landscape futures: Decision-making in uncertain times, a literature review. Landsc. Res. 2021, 46, 8–24. [Google Scholar] [CrossRef]
  2. Reed, J.; Deakin, L.; Sunderland, T. What are “Integrated Landscape Approaches” and how effectively have they been implemented in the tropics: A systematic map protocol. Environ. Evid. 2015, 4, 2. [Google Scholar] [CrossRef] [Green Version]
  3. Pelletier, J.; Paquette, A.; Mbindo, K.; Zimba, N.; Siampale, A.; Chendauka, B.; Siangulube, F.; Roberts, J.W. Carbon sink despite large deforestation in African tropical dry forests (miombo woodlands). Environ. Res. Lett. 2018, 13, 094017. [Google Scholar] [CrossRef] [Green Version]
  4. Kusiima, S.K.; Egeru, A.; Namaalwa, J.; Byakagaba, P.; Mfitumukiza, D.; Mukwaya, P.; Mensah, S.; Asiimwe, R. Interconnectedness of ecosystem services potential with Land-Use/Land-Cover change dynamics in Western Uganda. Land 2022, 11, 2056. [Google Scholar] [CrossRef]
  5. Do, T.H.; Vu, T.P.; Catacutan, D.; Nguyen, V.T. Governing landscapes for ecosystem services: A participatory land-use scenario development in the Northwest Montane Region of Vietnam. Environ. Manag. 2021, 68, 665–682. [Google Scholar] [CrossRef]
  6. Lubida, A.; Veysipanah, M.; Pilesjo, P.; Mansourian, A. Land-use planning for sustainable urban development in Africa: A spatial and multi-objective optimization approach. Geod. Cartogr. 2019, 45, 1–15. [Google Scholar] [CrossRef] [Green Version]
  7. Solly, A. Land use challenges, sustainability and the spatial planning balancing act: Insights from Sweden and Switzerland. Eur. Plan. Stud. 2021, 29, 637–653. [Google Scholar] [CrossRef]
  8. McCall, M.K. Seeking good governance in participatory-GIS: A review of processes and governance dimensions in applying GIS to participatory spatial planning. Habitat Int. 2003, 27, 549–573. [Google Scholar] [CrossRef]
  9. Mccall, M.K.; Dunn, C.E. Geo-information tools for participatory spatial planning: Fulfilling the criteria for “good” governance? Geoforum 2012, 43, 81–94. [Google Scholar] [CrossRef]
  10. Asubonteng, K.O.; Ros-Tonen, M.A.F.; Baud, I.; Pfeffer, K. Envisioning the future of mosaic landscapes: Actor perceptions in a mixed cocoa/oil-palm area in Ghana. Environ. Manag. 2020, 68, 701–719. [Google Scholar] [CrossRef]
  11. Ros-Tonen, M.A.F.; Willemen, L. Editorial: Spatial tools for integrated and inclusive landscape governance. Environ. Manag. 2021, 68, 605–610. [Google Scholar] [CrossRef] [PubMed]
  12. Aggrey, J.J.; Ros-Tonen, M.A.F.; Asubonteng, K.O. Using participatory spatial tools to unravel community perceptions of land-use dynamics in a mine-expanding landscape in Ghana. Environ. Manag. 2021, 68, 720–737. [Google Scholar] [CrossRef] [PubMed]
  13. Baggio, J.A.; Brown, K.; Hellebrandt, D. Boundary object or bridging concept? A citation network analysis of resilience. Ecol. Soc. 2015, 20, 2. [Google Scholar] [CrossRef] [Green Version]
  14. Sayer, J.; Sunderland, T.; Ghazoul, J.; Pfund, J.-L.; Sheil, D.; Meijaard, E.; Venter, M.; Boedhihartono, A.K.; Day, M.; Garcia, C.; et al. Ten principles for a landscape approach to reconciling agriculture, conservation, and other competing land uses. Proc. Natl. Acad. Sci. USA 2013, 110, 8349–8356. [Google Scholar] [CrossRef] [Green Version]
  15. Milder, J.C.; Hart, A.K.; Dobie, P.; Minai, J.; Zaleski, C. Integrated landscape initiatives for African agriculture, development, and conservation: A Region-wide assessment. World Dev. 2014, 54, 68–80. [Google Scholar] [CrossRef]
  16. Beunen, R.; Opdam, P. When landscape planning becomes landscape governance, what happens to the science? Landsc. Urban Plan. 2011, 100, 324–326. [Google Scholar] [CrossRef]
  17. Görg, C. Landscape governance. The “politics of scale” and the “natural” conditions of places. Geoforum 2007, 38, 954–966. [Google Scholar] [CrossRef]
  18. Armitage, D.; Marschke, M.; Plummer, R. Adaptive co-management and the paradox of learning. Glob. Environ. Chang. 2008, 18, 86–98. [Google Scholar] [CrossRef]
  19. Star, S.L.; Griesemer, J.R. Institutional Ecology, “Translations” and boundary objects: Amateurs and professionals in Berkeley’s Museum of vertebrate zoology, 1907-39. Soc. Stud. Sci. 1989, 19, 387–420. [Google Scholar] [CrossRef]
  20. Opdam, P.; Nassauer, J.I.; Wang, Z.; Albert, C.; Bentrup, G.; Castella, J.-C.; McAlpine, C.; Liu, J.; Sheppard, S.; Swaffield, S. Science for action at the local landscape scale. Landsc. Ecol. 2013, 28, 1439–1445. [Google Scholar] [CrossRef]
  21. Ansell, C.; Gash, A. Collaborative governance in theory and practice. J. Public Adm. Res. Theory 2008, 18, 543–571. [Google Scholar] [CrossRef] [Green Version]
  22. Mansourian, S.; Sgard, A. Diverse interpretations of governance and their relevance to forest landscape restoration. Land Use Policy 2019, 104, 104011. [Google Scholar] [CrossRef]
  23. Ros-Tonen, M.A.F.; Willemen, L.; McCall, M.K. Spatial tools for integrated and inclusive landscape governance: Toward a new research agenda. Environ. Manag. 2021, 68, 611–618. [Google Scholar] [CrossRef] [PubMed]
  24. van Oosten, C.; Gunarso, P.; Koesoetjahjo, I.; Wiersum, F. Governing forest landscape restoration: Cases from Indonesia. Forests 2014, 5, 1143–1162. [Google Scholar] [CrossRef] [Green Version]
  25. Speer, J. Participatory Governance Reform: A good strategy for increasing government responsiveness and improving public services? World Dev. 2012, 40, 2379–2398. [Google Scholar] [CrossRef]
  26. Gupta, J.; Vegelin, C. Sustainable development goals and inclusive development. Int. Environ. Agreem. Politics Law Econ. 2016, 16, 433–448. [Google Scholar] [CrossRef] [Green Version]
  27. Pouw, N.; Gupta, J. Inclusive development: A multi-disciplinary approach. Curr. Opin. Environ. Sustain. 2017, 24, 104–108. [Google Scholar] [CrossRef]
  28. Arts, K. Inclusive sustainable development: A human rights perspective. Curr. Opin. Environ. Sustain. 2017, 24, 58–62. [Google Scholar] [CrossRef]
  29. Marcaletti, F.; Riniolo, V. A participatory governance model towards the inclusion of ethnic minorities. An action research experience in Italy. Interv. Écon. 2015, 53, 1–21. [Google Scholar] [CrossRef] [Green Version]
  30. Dryzek, J.S. Deliberative Global Politics: Discourse and Democracy in a Divided World; Polity: Cambridge, UK, 2006. [Google Scholar]
  31. Bäckstrand, K.; Khan, J.; Kronsell, A.; Lövbrand, E. (Eds.) The Promise of New Modes of Environmental Governance. In Environmental Politics and Deliberative Democracy: Examining the New Promise of New Modes of Governance; Edwards Elgar Publishing: Chelternham, UK, 2010; pp. 3–27. [Google Scholar] [CrossRef]
  32. Everard, M. Managing socio-ecological systems: Who, what and how much? The case of the Banas river, Rajasthan, India. Curr. Opin. Environ. Sustain. 2020, 44, 16–25. [Google Scholar] [CrossRef]
  33. Ros-Tonen, M.A.F.; Reed, J.; Sunderland, T. From Synergy to Complexity: The trend toward integrated value chain and landscape governance. Environ. Manag. 2018, 62, 1–14. [Google Scholar] [CrossRef] [Green Version]
  34. Upla, P.; Reed, J.; Moombe, K.B.; Kazule, B.J.; Mulenga, B.P.; Ros-Tonen, M.; Sunderland, T. Assessing the potential for private sector engagement in integrated landscape approaches: Insights from value-chain analyses in Southern Zambia. Land 2022, 11, 1549. [Google Scholar] [CrossRef]
  35. Moombe, K.B.; Siangulube, F.S.; Mwaanga, B.M.; Mfuni, T.; Yanou, M.P.; Gumbo, D.J.; Mwansa, R.C.; Juunza, G. Understanding landscape dynamics A case study from Kalomo District. In Operationalizing Integrated Landscape Approaches in the Tropics; Reed, J., Ros-Tonen, M.A.F., Sunderland, T., Eds.; CIFOR: Bogor, Indonesia, 2020; pp. 148–175. [Google Scholar]
  36. Siangulube, F.; Ros-Tonen, M.; Reed, J.; Djoud, H.; Gumbo, D.; Sunderland, T. Navigating power imbalances in landscape governance: A network and influence analysis in southern Zambia. Reg. Environ. Chang. 2022, 23, 41. [Google Scholar] [CrossRef]
  37. Reed, J.; Ros-Tonen, M.; Sunderland Terry, C.H. Operationalizing Integrated Landscape Approaches in the Tropics; CIFOR: Bogor, Indonesia, 2020. [Google Scholar] [CrossRef]
  38. Government of the Republic of Zambia. The Registration and Development of Villages Act, Chapter 289 of the Laws of Zambia; Government Printers: Lusaka, Zambia, 1994.
  39. Mbanga, T.M.; Mulenga, M.C.; Membele, G. Monitoring forest cover change in Kalomo Hills local forest using remote sensing and GIS: 1984–2018. J. Remote Sens. GIS 2021, 10, 1–7. [Google Scholar]
  40. Ministry of Lands and Natural Resources. Integrated Land Use Assessment Phase II—Report for Zambia; The Food and Agriculture Organization of the United Nations and the Forestry Department: Lusaka, Zambia, 2017. [Google Scholar]
  41. Nasiri, V.; Deljouei, A.; Moradi, F.; Sadeghi, S.M.M.; Borz, S.A. Land use and land cover mapping using Sentinel-2, Landsat-8 Satellite Images, and Google Earth Engine: A comparison of two composition methods. Remote Sens. 2022, 14, 1977. [Google Scholar] [CrossRef]
  42. Liu, L.; Xiao, X.; Qin, Y.; Wang, J.; Xu, X.; Hu, Y.; Qiao, Z. Mapping cropping intensity in China using time series Landsat and Sentinel-2 images and Google Earth Engine. Remote Sens. Environ. 2020, 239, 111624. [Google Scholar] [CrossRef]
  43. Gorelick, N.; Hancher, M.; Dixon, M.; Ilyushchenko, S.; Thau, D.; Moore, R. Google Earth Engine: Planetary-scale geospatial analysis for everyone. Remote Sens. Environ. 2017, 202, 18–27. [Google Scholar] [CrossRef]
  44. Phiri, D.; Morgenroth, J.; Xu, C. Four decades of land cover and forest connectivity study in Zambia—An object-based image analysis approach. Int. J. Appl. Earth Obs. Geoinf. 2019, 79, 97–109. [Google Scholar] [CrossRef]
  45. Olofsson, P.; Foody, G.M.; Herold, M.; Stehman, S.V.; Woodcock, C.E.; Wulder, M.A. Good practices for estimating area and assessing accuracy of land change. Remote Sens. Environ. 2014, 148, 42–57. [Google Scholar] [CrossRef]
  46. Naboureh, A.; Li, A.; Bian, J.; Lei, G.; Amani, M. A hybrid data balancing method for classification of imbalanced training data within google earth engine: Case studies from mountainous regions. Remote Sens. 2020, 12, 3301. [Google Scholar] [CrossRef]
  47. Feizizadeh, B.; Omarzadeh, D.; Kazemi Garajeh, M.; Lakes, T.; Blaschke, T. Machine learning data-driven approaches for land use/cover mapping and trend analysis using Google Earth Engine. J. Environ. Plan. Manag. 2023, 66, 665–697. [Google Scholar] [CrossRef]
  48. Congedo, L. Semi-Automatic Classification Plugin: A Python tool for the download and processing of remote sensing images in QGIS. J. Open Source Softw. 2021, 6, 3172. [Google Scholar] [CrossRef]
  49. Schober, M.F.; Conrad, F.G.; Fricker, S.S. Misunderstanding standardized language in research interviews. Appl. Cogn. Psychol. 2004, 18, 169–188. [Google Scholar] [CrossRef]
  50. Nyumba, O.T.; Wilson, K.; Derrick, C.J.; Mukherjee, N. The use of focus group discussion methodology: Insights from two decades of application in conservation. Methods Ecol. Evol. 2018, 9, 20–32. [Google Scholar] [CrossRef] [Green Version]
  51. Morgan, D.L. Focus groups and social interaction. In Interview Research the Complexity of the Craft, 2nd ed.; Gubrium, J.F., Holstein, J.A., Marvasti, A.B., McKinney, K.D., Eds.; SAGE Publications Inc.: New York, NY, USA, 2012; pp. 161–176. [Google Scholar]
  52. Chilala, C.; Jimaima, H. The Tonga art of Kulibanda: A literary and linguistic analysis. J. Law Soc. Sci. 2020, 3, 160–177. [Google Scholar] [CrossRef]
  53. German Technical Cooperation (GTZ). District Development Project-Southern: Strategic District Development Planning; German Technical Cooperation (GTZ): Kalomo, Zambia, 2019. [Google Scholar]
  54. Phiri, J.; Malec, K.; Majune, S.K.; Appiah-Kubi, S.N.K.; Gebeltová, Z.; Maitah, M.; Maitah, K.; Abdullahi, K.T. Agriculture as a determinant of Zambian economic sustainability. Sustainability 2020, 12, 4559. [Google Scholar] [CrossRef]
  55. McCall, M.K.; Minang, P.A. Assessing participatory GIS for community-based natural resource management: Claiming community forests in Cameroon. Geogr. J. 2005, 171, 340–356. [Google Scholar] [CrossRef]
  56. Kusters, K.; Buck, L.; de Graaf, M.; Minang, P.; van Oosten, C.; Zagt, R. Participatory planning, monitoring and evaluation of multi-stakeholder platforms in integrated landscape initiatives. Environ. Manag. 2018, 62, 170–181. [Google Scholar] [CrossRef] [Green Version]
  57. Handavu, F.; Chirwa, P.W.C.; Syampungani, S. Socioeconomic factors influencing land-use and land-cover changes in the miombo woodlands of the Copperbelt Province in Zambia. For. Policy Econ. 2019, 100, 75–94. [Google Scholar] [CrossRef] [Green Version]
  58. Mukwena, R. Zambia at Fifty Years: What Went Right, What Went Wrong and Wither to? A Treatise of the Country’s Socioeconomic and Political Developments since Independence; Partridge Africa: Johannesburg, South Africa, 2016. [Google Scholar]
  59. Ruggeri, D. The agency of place attachment in the contemporary co-production of community landscapes. In Place Attachment; Routledge: London, UK, 2020; pp. 243–260. [Google Scholar] [CrossRef]
  60. Shantiko, B.; Liswanti, N.; Bourgeois, R.; Laumonier, Y. Land-use decisions in complex commons: Engaging multiple stakeholders through foresight and scenario building in Indonesia. Environ. Manag. 2021, 68, 642–664. [Google Scholar] [CrossRef] [PubMed]
  61. McCall, M.K. Participatory Mapping and PGIS: Secerning facts and values, representation and representativity. Int. J. E-Plan. Res. 2021, 10, 105–123. [Google Scholar] [CrossRef]
  62. Chambers, R. Participatory mapping and geographic information systems: Whose map? Who is empowered and who disempowered? Who gains and who loses? Electron. J. Inf. Syst. Dev. Ctries 2006, 25, 1–11. [Google Scholar] [CrossRef] [Green Version]
  63. Friis, C.; Nielsen, J.Ø. On the system. Boundary choices, implications, and solutions in telecoupling land use change research. Sustainability 2017, 9, 974. [Google Scholar] [CrossRef] [Green Version]
  64. Lagopoulos, A. Clarifying theoretical and applied land-use planning concepts. Urban Sci. 2018, 2, 17. [Google Scholar] [CrossRef] [Green Version]
  65. Irving, A. The modern/postmodern divide and urban planning. Univ. Tor. Q. 1993, 62, 474–487. [Google Scholar] [CrossRef]
  66. Mulenga, C.; Ngoma, A.; Sakala, J. Rural land use planning—The integration of shared resources mapping for improved communal tenure security: Experiences from Zambia. In 2019 Annual World Bank Conference on Land and Poverty; World Bank: Washington, DC, USA, 2019; pp. 1–25. [Google Scholar]
  67. Brown, G.; Kyttä, M. Key issues and priorities in participatory mapping: Toward integration or increased specialization? Appl. Geogr. 2018, 95, 1–8. [Google Scholar] [CrossRef]
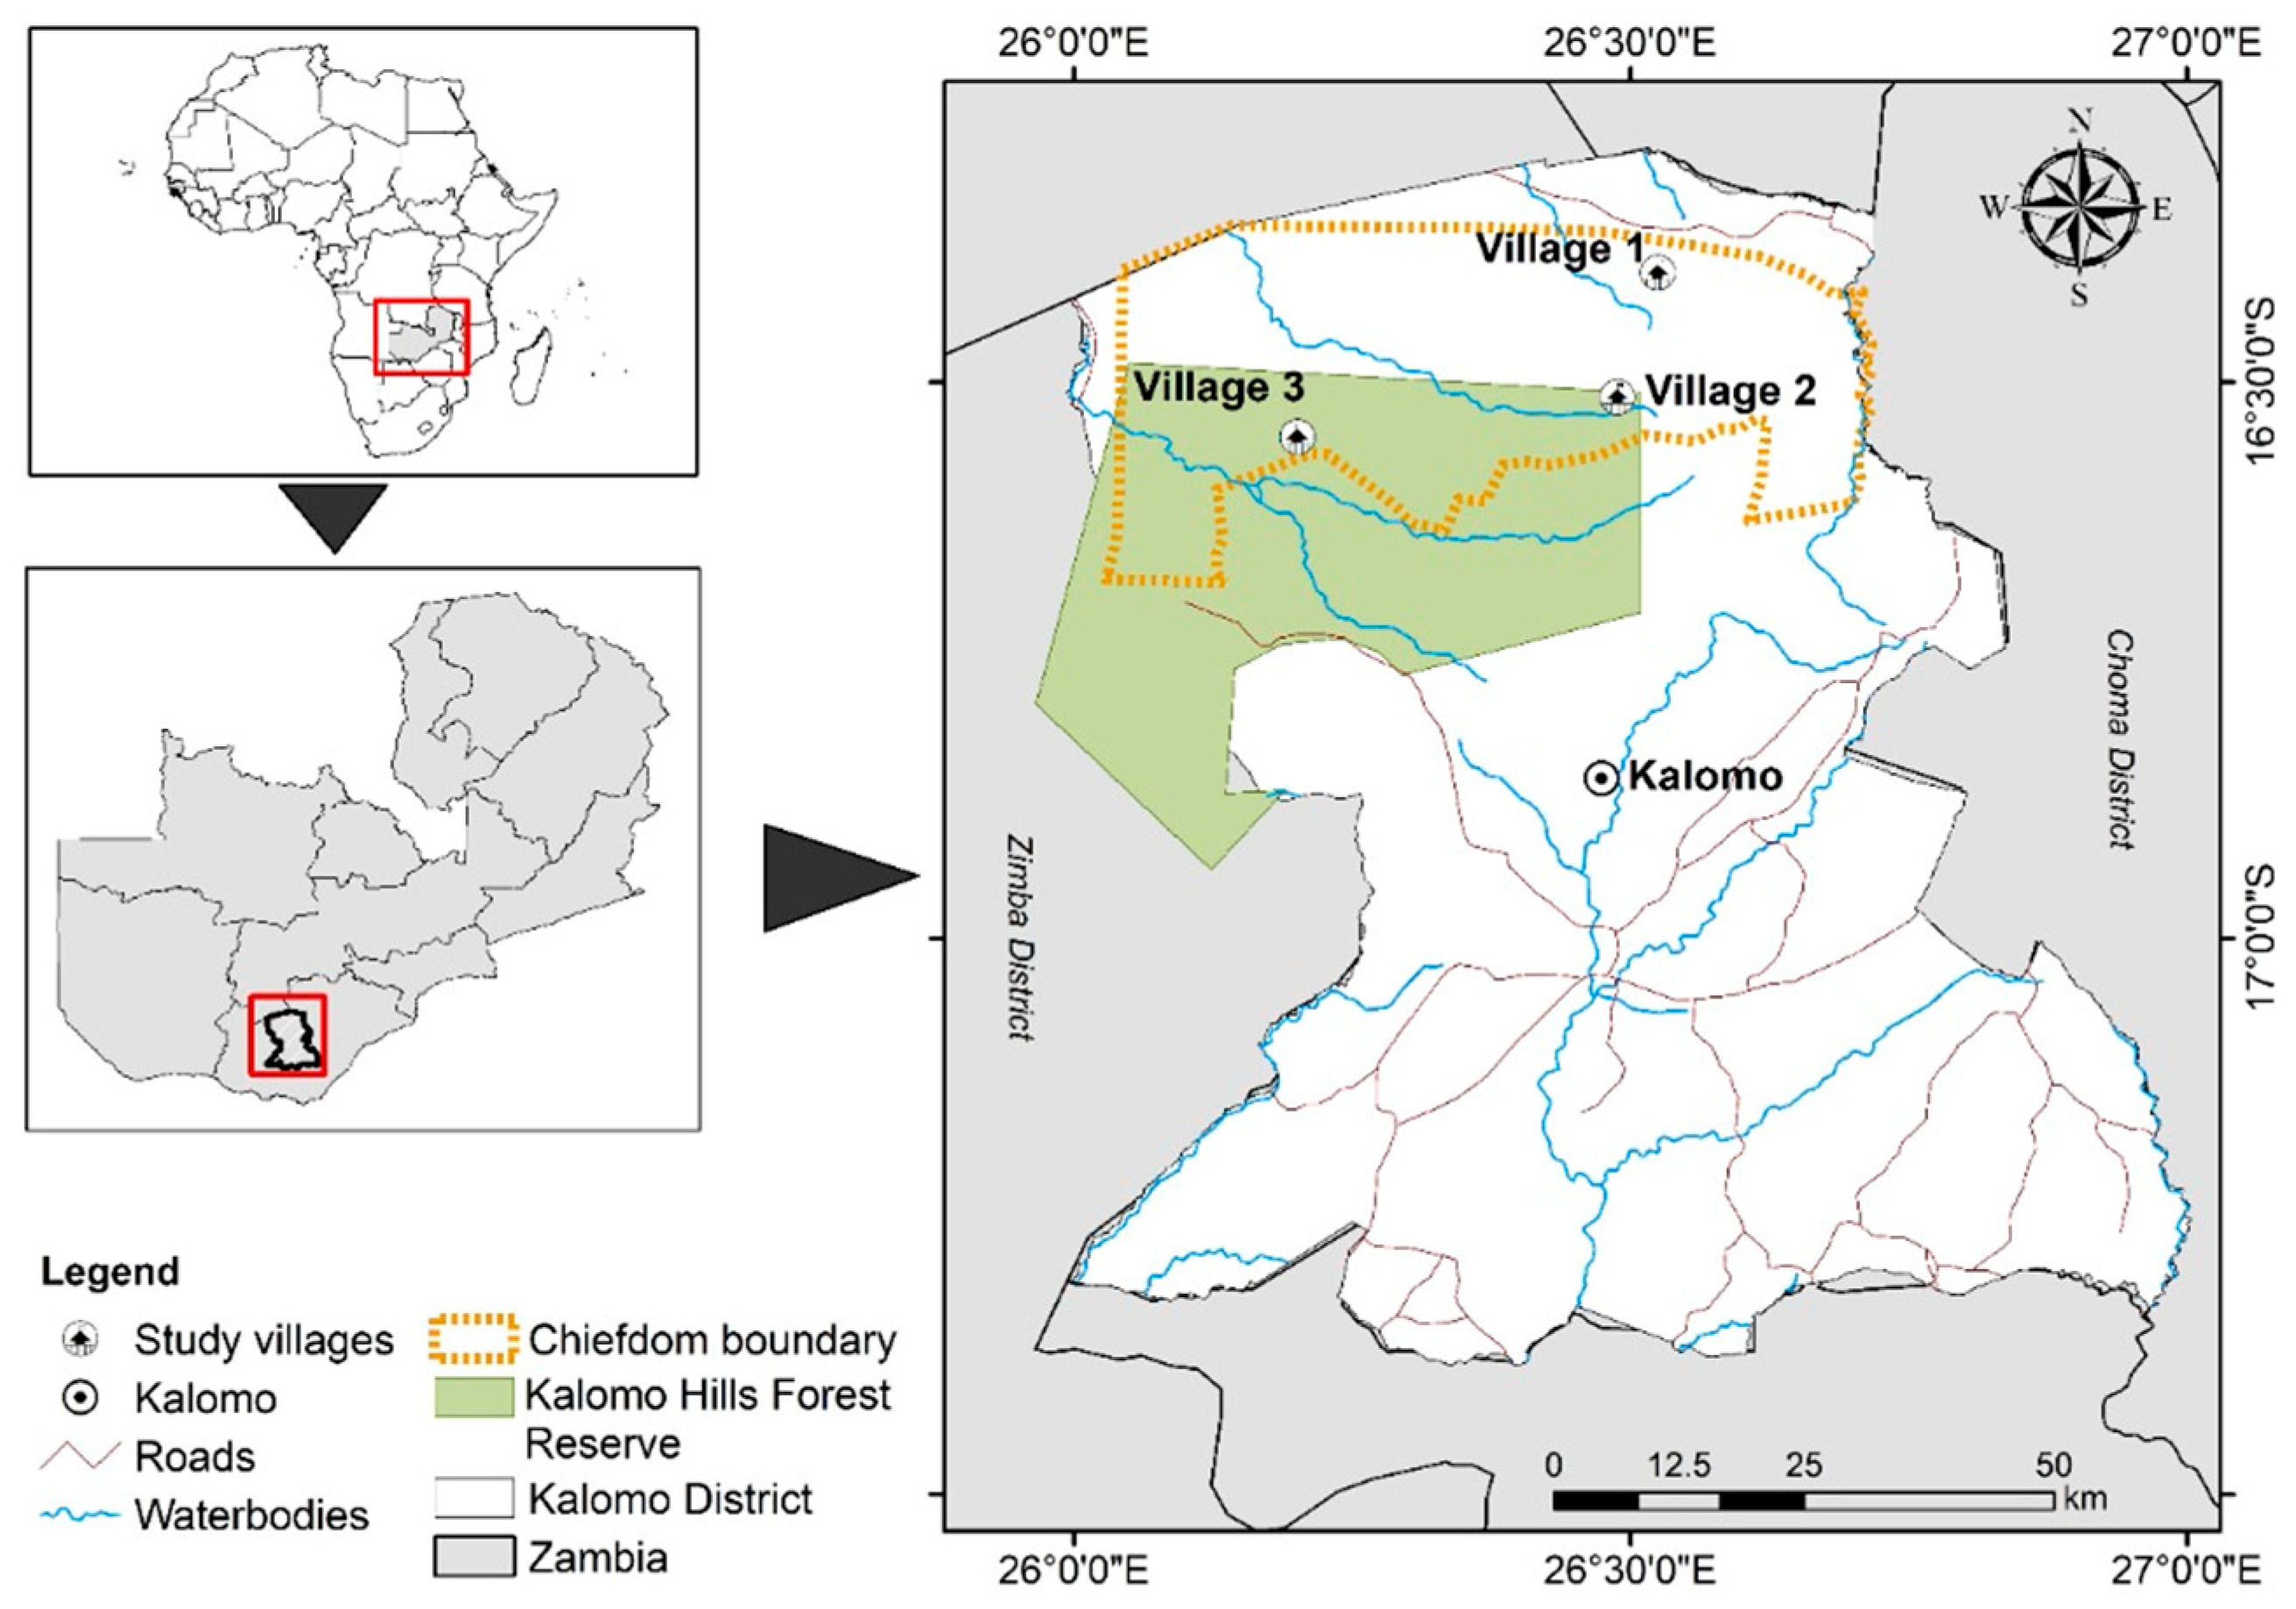
Figure 1. Location map showing Kalomo District, study villages 1 and 3 in the Chikanta Chiefdom (Source: modified from [36]).
Land 12 00804 g001
Figure 2. Land-cover types in 1984 and 2020 in the Chief Chikanta’s area where the two villages are located.
Land 12 00804 g002
Figure 3. Land-cover maps for 1984 and 2020 for Chief Chikanta’s area, Kalomo District, used to discuss drivers of landscape change in MSPs.
Land 12 00804 g003
Figure 4. Participatory maps drawn in the two MSP workshops. MSP1—(A) male group, (B) youth group, (C) female group. MSP2—(D) female group, (E) youth group.
Land 12 00804 g004
Figure 5. Combined participatory maps of the envisioned future landscapes in MSP1 (A) and MSP2 (B). (Note: different colours were used to delineate boundaries of various land-cover types).
Land 12 00804 g005
Table 1. Demographic details of participants in MSPs.
MSP1MSP2
Demography (no. of respondents)
Gender
Male adults1215
Female adults1315
Youths (mixed males and females)1015
Age in years
Mean39.540.3
Median3237
Level of education (%)
Primary6053
Secondary1319
Tertiary2212
None (no formal education)0516
Land tenure and access to land (%)
Land ownership
<2 ha1951
2–10 ha7045
>10 ha114
Wealth distribution (estimates of livestock)
No. of cattle (total)14,0868985
No. of goats22,9001450
Others (sheep, donkeys, pigs)321634
Source: Authors’ field data.
Table 2. Land-cover classes used in the study.
Land-Cover TypeDescription
ForestAreas with a spatial extent of at least 0.5 hectares, woody vegetation with a canopy cover of more than 10%, and a tree height of more than 5 m.
CroplandLand actively utilised to grow agricultural crops, such as annual and perennial crops that may be irrigated or rain-fed, for commercial, peasant, and small-scale farms.
RangelandLand comprising woodland, rangeland, grasslands, plains, shrubland and pans in river basins and water channels.
WaterbodiesWaterlogged areas formed naturally or artificially, including perennial and non-perennial streams and rivers, swamps, lakes, and dam lakes.
Built-up area/bare landCharacterised by low and high-intensity infrastructures, exposed soils, surface areas (roads), wastelands and rock outcrops, and all probable bare land.
Source: Based on the national land classification dataset [39] and stakeholder interviews.
Table 3. Participatory mapping process in the two MSPs.
Stages1. Preparatory Phase2. Diagnosis of Drivers of Land Use3. Participatory Land-Use Mapping in Focus Groups4. Collective Participatory Map
ActivitiesResearchers prepare remote sensing maps. This follows study area verifications with key stakeholders a and ground-truthing of GPS coordinates.Participants identify drivers of landscape change by interpreting land-cover maps produced in stage 1.Sketch mapping in various focus groups (men, women, and youths).Participatory sketching of desired future scenarios with inputs from all maps drafted in the focus groups.
ActorsResearch team, GIS expert, and village leaders from each MSP.MSP participantsGroups of men, women
and youths involved in stage 2.
Chief’s representative, village headmen and selected village participants, CBO reps, GIS expert, and Forestry Department
official.
ToolsTopo sheet from the Forestry Department and GPS.Topo sheet and land-cover maps, stationery for writing.Sketch mapping of current land cover; identify issues and causes.Participatory maps and discussion notes.
Measure of degree of inclusivityConsultations with local leaders and some villagers conversant with the area.Moderation during the meeting to allow equitable participation,
engagement and
transparency in the discussions.
Mediation to have equity and participation through participatory mapping in focus groups based on gender and age.Mediation in MSPs to ensure balanced participation.
a Key stakeholders include personnel from the Physical Planning department at the Ministry of Local Government and Rural Development, a member of the Council of Elders and two village head persons familiar with the area of interest. Key: CBO = Community-based organisation, GIS = Geographical information system, GPS = Geographical positioning system, MSP = Multistakeholder platform. Source: Author compilation based on field data.
Table 4. Landscape transition in km2 and percentage (%) of the total land-use cover.
Land-Cover TypesForestCroplandRangelandWater-BodiesBuilt-Up/BareTotal for 1984
Forest125.42292.41339.4637.74231.231026.26
12.2228.4933.083.6822.5358.51
Cropland6.9046.0442.962.0842.51140.48
4.910.3330.581.4830.268.01
Rangeland42.63133.89140.2913.0692.32422.20
10.1031.7133.233.0921.8724.07
Waterbodies17.3330.6147.655.2138.18138.99
12.4722.0234.293.7527.477.92
Built-up/bare1.737.358.274.718.2626.09
6.6428.1831.7218.0431.661.49
Total for 2020194.01510.30578.6458.56412.501754.01
11.0629.0932.993.3423.52100.0
Note: The first row indicates land proportions in km2 and italicised figures in percentages. Unchanged is the total of all diagonal figures (bold), which is 325 km2 (18.5%), and the total transition is the total for 1984 and 2020 minus the unchanged area (i.e., 1754.01 − 325.5 is 1428.51 km2).
Table 5. Drivers of land-cover/land-use change.
Aspects of Drivers of Land-Use Change (Direct and Proximate)Perception Scores in MSP1Perception Scores in MSP2
MenWomenYouthsMenWomenYouths
1. Social and interpersonal
Lack of trust and legitimacy++++++++++
Lack of accountability++++++++++++++++
Population increase+ ++ +++
Exclusive participation +++ +++
Gender equality ++++ +++++
Migration ++++++ +++
Corruption in land administration++++++++++++++++
2. Cultural aspects
Lack of respect for traditional rules and norms+++++ ++
Degradation of Malende (sacred forests)++
3. Ecological/environmental
Increased consumption of ecological services (water)+++++++ +++
Deforestation++++++++++++++++++
Animal diseases+++ +++++ +++
Climate change (associated with persistent droughts)+++++++++++++++++
Floods + ++
Cultivation in watersheds++++++ ++
Illegal logging +++++ +
4. Economic
Increase in food demand+++++++
Expanding infrastructure+++++++++++++++
Demand for charcoal (biomass energy)+++++ +++
Agriculture++++++++++++++++
Overgrazing+++++++++++++++++
Lack of off-farm employment+ +++++ +++
Demand for non-timber forest products +
5. Governance (Organisation, Policy, and Legislation)
Policy inconsistencies ++++++
Unrealistic demands by the leader +
Settlements disputes+++++++++++++++
Poor coordination among government departments ++++++
Partisan politics/interference++ ++ +
Key: Important driver—+++, Moderately important driver—++, less important driver—+ (empty cell—not mentioned).
Disclaimer/Publisher’s Note: The statements, opinions and data contained in all publications are solely those of the individual author(s) and contributor(s) and not of MDPI and/or the editor(s). MDPI and/or the editor(s) disclaim responsibility for any injury to people or property resulting from any ideas, methods, instructions or products referred to in the content.