Abstract
Urban land optimization in urban agglomerations plays an important role in promoting territorial spatial planning to achieve high-quality development, land ecological suitability (LES) is one of the important variables influencing its urbanization and needs to be considered in urban growth simulation and modeling. This research proposed a multi-objective urban land optimization (MULO) model based on the non-dominated sorting genetic algorithm II (NSGA-II) which integrates the LES assessment. MULO starts with LES analysis based on a fuzzy analytical hierarchy process (AHP) and a minimum cumulative resistance (MCR) model. Then, two-step linear regression is used to optimize the quantity structure of built-up land. Finally, suitability and compactness are assigned to NSGA-II as objectives to obtain optimal spatial patterns. Taking the example of the Guangdong–Hong Kong–Macao Greater Bay Area, we found that all the newly added built-up land in 2030 is distributed in peri-urban areas around the original settlements, with approximate clustering in the northern part of Guangzhou and the southern part of Foshan under a balanced development scenario. This study highlights the importance of LES in urban growth modeling, and MULO can provide effective support for the spatial planning of urban agglomerations.
1. Introduction
Accompanied by a dense population and the demand for urban construction land [1], the land use pattern in urban agglomerations (UAs) has changed significantly, and a large amount of ecological space has been encroached upon [2]. Urban expansion comes at the expense of limited land resources [3,4], which increases pressure on the ecological environment and leads to a range of ecological problems such as soil erosion, water pollution and air pollution [5]. Without proper regulation and control, UAs may sprawl in a disorderly manner [6], which will further lead to ecological degradation and the waste of land resources [7]. Thus, it is of great significance to optimize the spatial patterns of UAs for achieving urban growth with ecological priority. The results of the optimization can provide environmentally sustainable planning solutions for UAs development.
A reliable land use allocation model can provide a compelling reference for developing spatial patterns that promote sustainable urban development [8,9]. In recent decades, land use optimization has become an important research topic [10,11]; it is essentially about achieving the optimal distribution of urban expansion, which is divided into two main steps: quantity prediction and spatial arrangements [12]. Quantity prediction can be achieved by linear regression based on time series of land use changes and other statistical data [13]. However, how to make spatial arrangements to meet the goal of balanced, high-quality development is a complex, multi-objective trade-off problem [14,15]. The conflicting characteristic among objectives leads to a situation where one solution chosen by a decision maker may be not acceptable to another designer or in a changed environment [16]. Thus, in multi-objective optimization problems, it is useful to obtain alternative Pareto-optimal solutions. Advances in computing technologies over recent decades facilitated various optimization algorithms, and the non-dominated sorting genetic algorithm II (NSGA-II) is widely used due to its ability to obtain Pareto sets under multiple nonlinear objectives, which is widely known in the optimization field for its good robustness and global search capability [17,18,19]. Verma et al. (2021) pointed out that NSGA-II showed better performance for optimizing land use planning to accommodate sustainability [20]. Ramezanian et al. (2022), Maleki et al. (2021) and Pan et al. (2023) have implemented these models based on NSGA-II to find optimal patterns of urban land as well as rural settlements [17,21,22,23]. Considering the superiority of NSGA-II, this paper explores the optimal spatial allocation of UAs based on NSGA-II.
Due to the increasing ecological pressure caused by urban expansion, land ecological suitability (LES) has become an important objective for land use optimization [24,25,26], it provides science-based analysis to reconcile natural and social development according to ecological principles and methods [27,28]. The aim of LES assessment is to identify the most suitable land for future development in order to reduce the negative ecological impacts of human activities [29], which relies on multi-dimensional support for regional topography, ecology and socio-economic conditions [30,31]. The analytical hierarchy process (AHP) is one of the broadest techniques in the LES evaluation, and the fuzzy AHP, an AHP method developed with fuzzy logic theory, is often used to estimate the weights of the criterion [30,32,33,34]. To access landscape connectivity and construct an ecological security pattern, many scholars contributed to urban ecological planning by using a minimum cumulative resistance (MCR) model to delimit different urban functional zones suitable for urban development or ecological protection [35,36,37,38,39]. The advantage of MCR is that it considers both the influence of resistance factors and the distance to the source in the process of urban expansion. Although LES has been used to measure ecological conservation status in some optimization studies [40,41,42], most studies have generally been at the local scale and lack the consideration of landscape connectivity at the regional scale, which is important for the sustainable and high-quality development of UAs. Thus, in this paper, the MCR model was used to delimit the different functional zones suitable for ecological protection or construction development and then attempt to incorporate LES results in spatial optimization to minimize the ecological impacts.
The aim of this paper is to construct an LES-based multi-objective urban land optimization (MULO) model to provide a spatial optimization allocation scheme for the high-quality development of UAs. Considering that the Guangdong–Hong Kong–Macao Greater Bay Area (the GBA) is an essential part of the Chinese economy, its rapid urbanization has led to drastic land changes, resulting in a fragile ecological environment [4]. The GBA urgently needs development planning based on the principle of ecological priority, as a method to improve regional competitiveness and ecological security. Therefore, this paper takes the GBA as the study area. In the rest of the paper, the study area and data sources are first described, followed by a description of a MULO model based on NSGA-II (Figure 1). This is followed by an analysis of a case study of the GBA and, finally, by a discussion and conclusions.
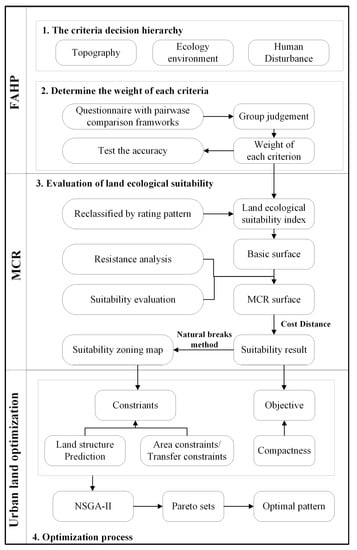
Figure 1.
Workflow procedure of the multi-objective urban land optimization (MULO) model, which includes FAHP, MCR model and NSGA-II.
2. Materials and Methods
2.1. Study Area
The Guangdong–Hong Kong–Macao Greater Bay Area (the GBA) is one of the main bay areas encompassing a world-class city cluster such as the New York metropolitan area, the San Francisco Bay Area and the Tokyo Bay Areas. This urban agglomeration is one of the most prosperous and urbanized regions in China, which includes nine mainland cities and two special administrative regions, namely, Guangzhou (GZ), Shenzhen (SZ), Zhuhai (ZH), Zhaoqin (ZQ), Huizhou (HZ), Jiangmen (JM), Dongguan (DG), Foshan (FS), Zhongshan (ZS), Hong Kong (HK) and Macao (MO), located in the south of China (Figure 2). As of 2020, the overall resident population of the GBA exceeds 86 million. With a total gross domestic product (GDP) of 11.4 × 10¹² Yuan in 2020, the GBA ranks among the top metropolitan areas in China in terms of economic strength, where the economic volume and population density are mainly concentrated in HK, SZ and GZ, and the regional economic level basically shows a gradient-decreasing trend from the bay area to the hinterland.
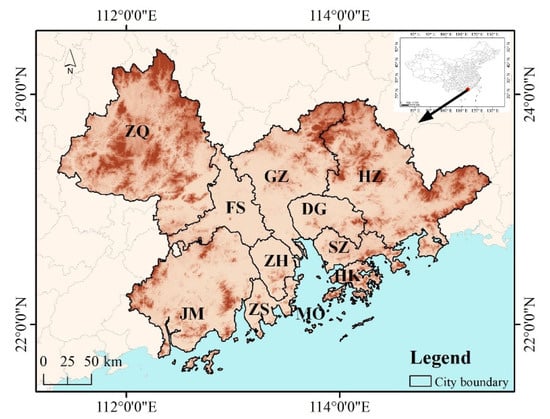
Figure 2.
Location map of the GBA, with nine mainland cities and two special administrative regions (JM—Jiangmen, GZ—Guangzhou, SZ—Shenzhen, ZH—Zhuhai, ZQ—Zhaoqin, HZ—Huizhou, DG—Dongguan, FS—Foshan, ZS—Zhongshan, HK—Hongkong, MC—Macao).
2.2. Data Collection
In this study, different sorts of data were collected (Table 1). The land use data are derived from the Resource and Environmental Science and Data Center, with a resolution of 1 × 1 km. The land use is classified into six categories: Cropland, Forest, Grassland, Built-up land, Unused land and Water. This is consistent with the general classification of land use optimization at the regional scale [3,12,17,43]. In addition, all raster data were resampled to a resolution of 1 × 1 km.

Table 1.
Details of data used in the study.
2.3. Multi-Objective Urban Land Optimization (MULO) Model
The multi-objective urban land optimization (MULO) model consists of two steps. The first step was to evaluate the LES in the study area by fuzzy AHP and the MCR method. The urban landscape dynamics is modeled as two processes: ecological land expansion and urban land expansion. An LES evaluation method based on the MCR difference between the two processes is established. Then, LES zoning was set as an objective in NSGA-II. The processes are described in the following sections.
2.3.1. Minimum Cumulative Resistance (MCR) Model
MCR refers to the cost spent in moving a species from the source to the destination [44]. It mainly includes three parts: the resistance planes, resistance coefficient and source. Equation (1) is used to calculate MCR.
Dij represents the distance of species A from source j to landscape unit i; Ri represents the resistance coefficient of landscape unit i to the movement of the species A in the horizontal plane.
In the MCR model, the first step is to establish the resistance plane. Combining the studies of many scholars [7,45,46], ten resistance factors were selected from three categories to build the resistance evaluation system, namely, topography, ecology environment and human disturbances.
Considering the different effects of different resistance factors on the expansion process, the fuzzy analytic hierarchy process (FAHP) was used to determine the weight of each resistance factor, which can provide researchers with a flexible decision-making process that considers both quantitative and qualitative aspects [6]. The opinions of individual experts were first surveyed, and then the experts were asked to score their preference values for each resistance factor and criterion using Sattty’s 1–9 ratio scale [47,48]; then, pair-wire comparisons were made, and the weights of each resistance factor were obtained by preparing comparison matrices and normalizing the matrix values.
The CR allows us to determine the number of errors generated when providing expert judgments. A small CR represents less inconsistency in the judgment matrix. Generally, if a CR value is below 0.1, it indicates that the weight is considered acceptable. In the final calculation, the CR of the three categories was below 0.1, which means that the resistance factors and their weights passed the consistency test. The grading spatial distribution of the various resistance factors and their corresponding weights are shown in Figure 3 and Table 2, respectively.
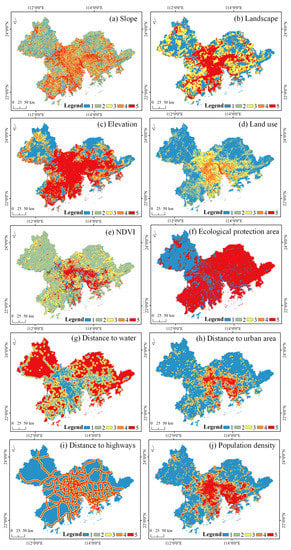
Figure 3.
Spatial distribution of resistance factors after grading.
Table 2.
The value of resistance assignment for built-up land and non-built-up land.
“Source” refers to the landscape type that promotes the ecological process. It represents the starting point for outward expansion. When studying the expansion process of built-up land, existing built-up land was used as a “source” whereas forest and water were set as the “source” for the ecological land expansion process.
The method of evaluating the LES is based on the MCR difference between the two processes, which can be expressed by the formula:
where MCRE represents the expansion resistance surface of non-construction land for ecological protection whereas MCRB represents the expansion resistance surface of construction land for economic development. MCR is the differential resistance surface between the two.
After obtaining the result of MCR, the natural break method of ArcGIS was used to reclassify the zoning results into four categories for LES: the ecological protection zone, the ecological buffer zone, the suitable construction zone and the prior construction zone.
2.3.2. Land Use Optimization Model
Objective
The ecological quality of each land unit plays an important role in selecting appropriate locations to find new urban land. Although ecosystem services value (ESV) is the main objective for ecological evaluation, it is based on land use structure without spatial analysis capability [3]. Unlike ESV, suitability is an objective with spatial properties that can be used to analyze the ecological status [12]. In addition, compactness is also a spatial objective for allocation to enhance urban intensification and social equality [49,50], which have been shown to be in conflict with suitability objectives [51]. To facilitate the optimization process, the whole region is rasterized into I rows and J columns, with a total of 509 × 417 = 212,253 cells, each with an area of 1 km2 in size. The eight-neighbor method was used to evaluate the compactness index, i.e., to calculate the number of grids corresponding to the same attribute around each grid [23]. The suitability objective is calculated by counting the corresponding suitability values of newly added built-up land.
The formula is as follows:
K represents the total number of cells in the region. Nk and are the numbers of cells with the same land use type in the k-cell’s eight neighborhoods in solution and initial pattern, respectively. Suitk represents the suitability value in the k-cell. Xk = 1 when cell i is newly added built-up land; otherwise, Xk = 0.
The Non-Dominated Sorting Genetic Algorithm II (NSGA-II)
NSGA-II includes five parts: initialization, non-dominated sorting, selection, crossover and mutation. In the NSGA-II, population represents the initial land use pattern set, chromosome represents one land use pattern, and gene refers to the cell in the land use pattern.
- After simulating the total built-up land in 2030, the population is created by assigning land use to other land uses randomly.
- Through the non-dominated sorting, crowding distance was used to determine the rank of chromosomes by calculating the average Euclidean distance of the chromosomes of each objective function [52]. Solutions in the same rank are considered equally important, and solutions in a smaller rank are better than those in a larger rank.
- A roulette is used to select chromosomes for subsequent steps. When the rank of an individual is higher, it has more chance to be selected.
- After determining the crossover probability, some of the genes at the same position in the two selected parents will be exchanged for their land use types, and then form two temp offspring.
- After determining the mutation probability, some of the genes in the temp offspring will be randomly changed to different land use types to form a new offspring (Figure 4).
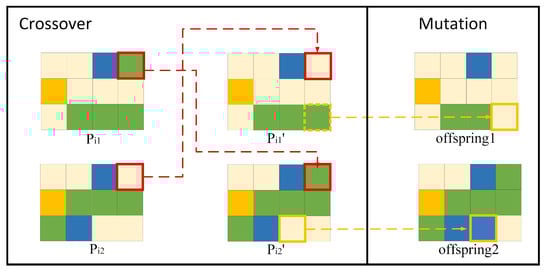 Figure 4. The process of crossover and mutation. Crossover is the interchange of land use types at selected cells in the two parents (Pi1 and Pi2). During the mutation, the selected units are randomly replaced with land use types. After the crossover and mutation, new offspring will be generated and continue to participate in the next iteration.
Constraints
This model places restrictions on the slope, the available land use types and the total area of basic farmland and future built-up land in 2030 to meet the requirements of land use planning. Lopez proposed that linear regression between urban and population growth offered more reliable predictions of urban growth in fast-growing regions [6,13]. For projecting growth tendencies in the GBA, population data and historical land use data from 1995–2020 were used as the basis to forecast the total area of built-up land of the GBA in 2030. This area was then used as a constraint when optimizing the expansion scale for the target year.
First, a two-step linear regression model for population size (y) over time (x) in the GBA was developed, as shown in Figure 5a; r2 = 0.967.
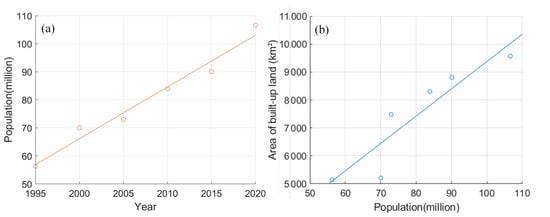
Figure 5.
Linear regression of the population over time in the GBA (a); linear regression of the area of built-up land over population (b).
Next, a linear regression model for the total area of built-up land (z) over population size (y) in 1995–2020 was developed, as shown in Figure 5b; r2 = 0.979.
Using the above methods, the total area of built-up land that GBA should have in 2030 was 11,472 km2.
3. Results
3.1. LES Zoning of the GBA
The result of the MCR resistance plane for construction and ecological land expansion processes are shown in Figure 6. The resistance to the expansion of ecological land is high in Guangzhou, Dongguan and Foshan, whereas Huizhou and Zhaoqin have relatively high resistance to construction land expansion. The spatial distribution of MCR surface differences is shown in Figure 7a. Low values represent regions with higher ecological suitability, whereas high values represent regions with higher construction suitability. The LES zoning is shown in Figure 7b. In the GBA, the highest percentage of the total area was occupied by the ecological buffer zone (43,689 km2, 69.7%), followed by the ecological protection zone, with a total area of 9002 km2 (14.4%). The prior construction zone has the smallest proportion with a total area of 2246 km2 (3.6%), whereas the suitable construction zone accounts for 12.4% (7766 km2).
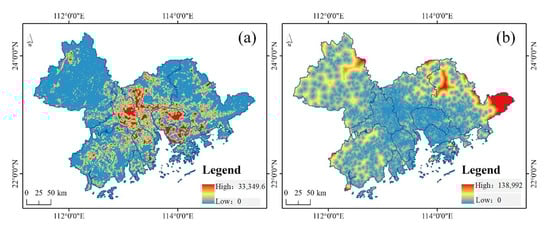
Figure 6.
Resistance surface of (a) construction and (b) non-construction land.
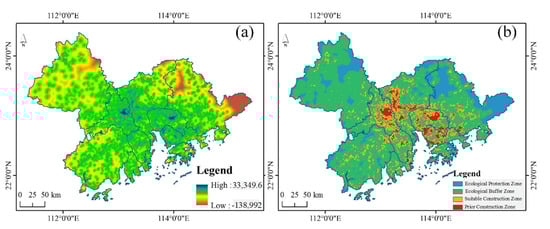
Figure 7.
The spatial distribution of MCR surface differences (a) and LES zoning of the GBA in 2020 (b).
In the GBA, ecological protection zones are mainly scattered in the mountainous areas of Huizhou, Zhaoqin and Jiangmen, including important nature reserves and contiguous basic farmland under strict state protection, of which, Huizhou has the highest percentage of ecological protection zones (Figure 8). Ecological buffer zones are mainly mountainous ecological barriers containing a large number of lakes, reservoirs, wetlands and other ecological control areas. Prior construction zones are distributed in the core-urban areas with high economic intensity and dense populations, mainly in Shenzhen, Guangzhou, Dongguan and Foshan. Suitable construction zones are adjacent to prior construction zones, distributed in the peri-urban areas and along the main roads, which are rich in resources, have good geological conditions, are suitable for economic and population gathering and are the key areas for future development. Huizhou has the highest proportion of ecological buffer zones, whereas Shenzhen has the highest proportion of prior construction zones.
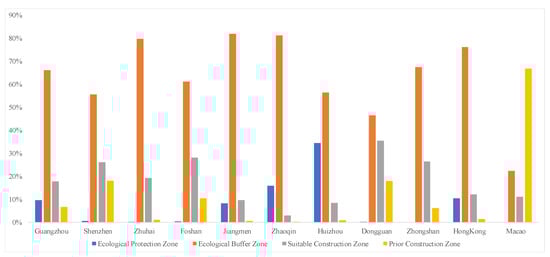
Figure 8.
The proportion of LES zoning in 11 cities of the GBA.
3.2. Land Use Optimization Results
3.2.1. Model Parameters and Constraints
The optimization objectives included the maximization of suitability and the minimization of compactness loss. The constraints in this case study were set based on the following restrictions: (1) cropland retention is 8299 km2; (2) a slope greater than 25 degrees cannot be used as built-up land (Figure 9a); (3) built-up land will increase to 11,412 km2 in 2030 based on two-step linear regression. Considering the stochastic characteristic of the model, a 2% up and down fluctuation in the built-up land increment is considered plausible; (4) the ecological control areas derived from the overall planning in each city cannot convert to built-up land (Figure 9b); (5) ecological protection zones derived from suitability zones cannot change in the process of the model; (6) water is not allowed to change in the model.
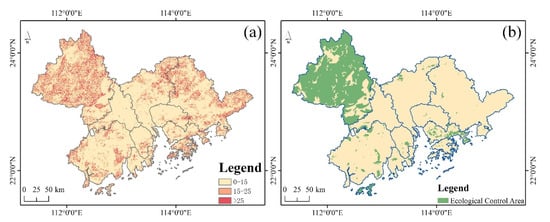
Figure 9.
The constraints in the model. (a) Slope constraints where a slope greater than 15 degrees cannot be built-up land and a slope greater than 25 degrees can only be forest. (b) Ecological control area derived from suitability zones which cannot change in the process of the model.
A total of 50 random patterns are initially set, and a maximum of 200 iterations are performed in the model. The probabilities of crossover and mutation are 0.1 and 0.06, respectively. To obtain the optimal pattern of balanced development in the GBA, the model chooses the optimal pattern when all the objective weights are 0.5.
3.2.2. Spatial Pattern of the GBA in 2030
Combining the optimal result in 2030 with the land use pattern in 2020, the occupation of land resources caused by urban expansion is shown in Table 3 and Figure 10. The newly added built-up land comes mainly from cropland, which accounts for 1612 km2 (86.2%), followed by forest (186 km2,10%) and grassland (71 km2, 3.8%). Analyzing its share in the suitability zoning, the newly added built-up land accounts for 73% in the suitable construction zone and 27% in the prior construction zone. In terms of the built-up land increment in each city (Table 4, Figure 11), Guangzhou and Huizhou accounted for the highest percentage (over 20%). Foshan and Jiangmen accounted for more than 15%, and the rest of the cities have less than a 10% built-up land increment.
Table 3.
The land use change of optimal spatial patterns in 2030.
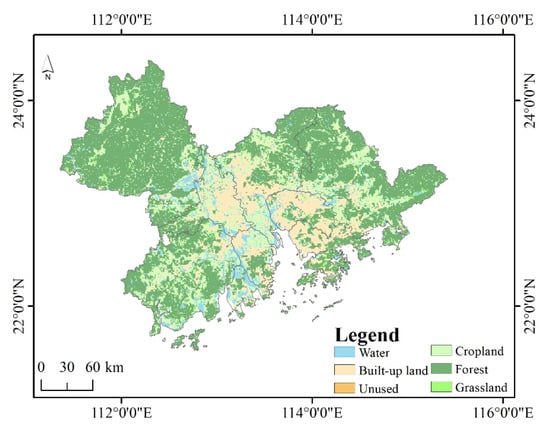
Figure 10.
The optimal spatial pattern in 2030.
Table 4.
Quantity structure of the GBA in 2030.
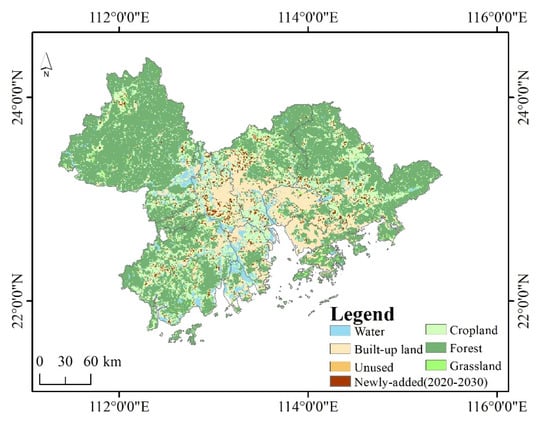
Figure 11.
The spatial distribution of newly added built-up land in 2030.
All the newly added built-up land is distributed in peri-urban areas around the original settlements and along main roads. The key development zone in the GBA mainly includes the northern part of Guangzhou and the southern part of Foshan, and contains clusters of new built-up land. In fact, the 14th Five-Year Plan of Guangzhou states that northern Guangzhou will promote the construction of an airport cluster as well as a new industrial area of the northern airside economy, which is consistent with the optimal results obtained by the model (approximate cluster of newly added built-up land in northern Guangzhou). In addition, the newly added built-up land in Huizhou and Jiangmen is scattered around the original construction area, especially in the south part. Dongguan’s newly added built-up land is concentrated in the junction with Shenzhen and Huizhou, whereas Zhaoqin is mainly distributed in the southern region near Foshan. In 2030, newly added built-up land will be scarce in Shenzhen, Macao and Hong Kong.
4. Discussion
The dramatic land changes caused by the rapid expansion of UA pose a serious threat to ecological security, and it is necessary to establish an optimal urban allocation model based on ecological impacts [6]. The aim of this study is to construct an effective model of optimizing urban allocation with protecting ecological land, which could provide a reliable reference for promoting the rational allocation of land resources and achieving high-quality development.
This model combined the LES with NSGA-II to optimize the expansion of urban land in UAs. The model’s ability to identify ecological protection areas and the direction in which to prioritize urban expansion led to better spatial allocation compared to the traditional land use optimization model. Compared with the research of Pan et al. (2022), this paper simulated future urban growth by two-step linear regression, which is better than the result based on one-step linear regression [3]. Moreover, land suitability zoning was used as a constraint and objective to improve its performance in the selection of spatial allocation for ecological security. Although Xu et al. (2018) have proposed LES for modeling urban expansion based on cellular automaton (CA), its model relied on historical data without spatial optimization capability [6]. Ma et al. (2022) optimized the quantity and spatial structure of the GBA through suitability and compactness objectives, but its constraint is hypothetical, and suitability results are based on spatial environment factors with only four indexes, ignoring the integration of ecological and construction processes [12]. Compared with these studies, the MULO model gave a more refined LES result for ecological protection and future urban growth and can obtain optimal spatial allocation as a reference for a decision maker.
In this study, the vertical and horizontal ecological processes were integrated to establish the LES zoning in the GBA, which provides the possibility to provide a dual analysis of the direction of regional ecological protection and construction expansion. Ideally, urban expansion is expected to be expanded in the prior construction zone and the suitable construction zone first, and ecological land should be avoided by city-building activities. As governments seek planning strategies for high-quality development, it is important to map potential future trends in land resources in order to better form appropriate development strategies. Additionally, this paper proposes to guide reasonable regional growth based on potential ecological impacts, providing a general theoretical basis for maintaining high-quality development.
However, urban growth is a complex process, although optimization study can select the optimal spatial distribution for regional growth, it ignores the role of historical changes in future urban development. It is necessary to analyze the regional historical development trend in combination with prediction models such as CA. At the same time, the government has carried out the policy of urban renewal due to the limited urban land resources in UAs [53]. The disadvantage of the optimization model is that it is mainly used to find the best allocation for urban expansion. Therefore, the construction of a spatial optimization model that can identify both urban renewal and regional expansion will have a significant impact on the actual regional planning.
5. Conclusions
The outward expansion of UAs for further socioeconomic development is necessary, but governments also need to limit disorderly urban sprawl to reduce adverse ecological impacts. With the support of geospatial data, social economic statistical data and remote sensing data, a framework for a land use optimization model guided by land ecological suitability was constructed. In this model, a multidimensional resistance factor system with a total of 10 indicators is established. FAHP and the MCR model were used to obtain the results of LES. Based on these results, two conflicting spatial objectives—suitability and compactness—were set, and the optimal Pareto set was obtained by NSGA-II.
The results show that the GBA is dominated by the ecological buffer zone (69.7%), only 16%, 10,012 km2, of land suitable for construction. The prior construction zone is concentrated in the core-urban areas, including Guangzhou, Shenzhen, Foshan and Dongguan. The suitable construction zone is adjacent to the prior construction zone, distributed in the peri-urban areas and along the main roads. The ecological protection zones are mainly scattered in the mountainous areas of Huizhou, Zhaoqin and Jiangmen. The optimal spatial pattern in 2030 shows that all the newly added built-up land is distributed in the peri-urban areas around the original settlements. The key development zone in the GBA in 2030 mainly clusters in the northern part of Guangzhou and the southern part of Foshan. In addition, the newly added built-up land in other cities is scattered around the original construction area, whereas newly added built-up land is scarce in Shenzhen, Macao and Hong Kong.
The MULO model identifies the optimal spatial allocation of future UAs after understanding land suitability and weighing its role with compactness in spatial allocation. It is generalizable at the regional scale, enabling the assessment of the development potential of different regions of UAs and incorporating the utility of development potential for optimal spatial allocation in the optimization process. The optimization results show that it can meet the needs of urban expansion and the conservation of ecological land while staying in line with the important strategic intent to address the problem of unbalanced development. In conclusion, the MULO model can be an effective approach for decision makers to optimize land management strategies to support regional sustainable development.
Author Contributions
All authors contributed to this manuscript. T.P. conceived the research and collected all the data; F.S. and T.P. designed the experiment and drafted the manuscript; Y.Z. and F.Y. provided help with the language and reviewed the manuscript. All authors have read and agreed to the published version of the manuscript.
Funding
This research was funded by the National Natural Science Foundation of China (Grant No.41890854), Key Project of Innovation LREIS (Grant No. KPI001), National key R&D plan (2022YFB3903604).
Institutional Review Board Statement
No applicable.
Informed Consent Statement
Not applicable.
Data Availability Statement
To access the data, please contact the authors.
Conflicts of Interest
The authors declare no conflict of interest.
References
- Kii, M. Projecting future populations of urban agglomerations around the world and through the 21st century. NPJ Urban Sustain. 2021, 1, 10. [Google Scholar]
- Guo, P.; Zhang, F.; Wang, H.; Qin, F. Suitability evaluation and layout optimization of the spatial distribution of rural residential areas. Sustainability 2020, 12, 2409. [Google Scholar] [CrossRef]
- Pan, T.; Yan, F.; Su, F.; Lyne, V.; Zhou, C. Land Use Optimization for Coastal Urban Agglomerations Based on Economic and Ecological Gravitational Linkages and Accessibility. Land 2022, 11, 1003. [Google Scholar] [CrossRef]
- Wang, X.; Yan, F.; Zeng, Y.; Chen, M.; Su, F.; Cui, Y. Changes in Ecosystems and Ecosystem Services in the Guangdong-Hong Kong-Macao Greater Bay Area since the Reform and Opening Up in China. Remote Sens. 2021, 13, 1611. [Google Scholar] [CrossRef]
- Huang, H.; Li, Q.; Zhang, Y. Urban residential land suitability analysis combining remote sensing and social sensing data: A case study in Beijing, China. Sustainability 2019, 11, 2255. [Google Scholar] [CrossRef]
- Xu, L.; Huang, Q.; Ding, D.; Mei, M.; Qin, H. Modelling urban expansion guided by land ecological suitability: A case study of Changzhou City, China. Habitat Int. 2018, 75, 12–24. [Google Scholar]
- Akbari, M.; Neamatollahi, E.; Neamatollahi, P. Evaluating land suitability for spatial planning in arid regions of eastern Iran using fuzzy logic and multi-criteria analysis. Ecol. Indic. 2019, 98, 587–598. [Google Scholar] [CrossRef]
- Kaim, A.; Cord, A.F.; Volk, M. A review of multi-criteria optimization techniques for agricultural land use allocation. Environ. Model. Softw. 2018, 105, 79–93. [Google Scholar] [CrossRef]
- Tajbakhsh, S.; Memarian, H.; Kheyrkhah, A. A GIS-based integrative approach for land use optimization in a semi-arid watershed. Glob. J. Environ. Sci. Manag. 2018, 4, 31–46. [Google Scholar]
- Strange, N.; Meilby, H.; Bogetoft, P. Land use optimization using self-organizing algorithms. Nat. Resour. Model. 2001, 14, 541–574. [Google Scholar] [CrossRef]
- Rahman, M.M.; Szabó, G. A Geospatial Approach to Measure Social Benefits in Urban Land Use Optimization Problem. Land 2021, 10, 1398. [Google Scholar] [CrossRef]
- Ma, S.; Cai, Y.; Xie, D.; Zhang, X.; Zhao, Y. Towards balanced development stage: Regulating the spatial pattern of agglomeration with collaborative optimal allocation of urban land. Cities 2022, 126, 103645. [Google Scholar] [CrossRef]
- López, E.; Bocco, G.; Mendoza, M.; Duhau, E. Predicting land-cover and land-use change in the urban fringe: A case in Morelia city, Mexico. Landsc. Urban Plan. 2001, 55, 271–285. [Google Scholar] [CrossRef]
- Maleki, J.; Masoumi, Z.; Hakimpour, F.; Coello, C.A.C. A spatial land-use planning support system based on game theory. Land Use Policy 2020, 99, 105013. [Google Scholar] [CrossRef]
- Sharmin, N.; Haque, A.; Islam, M.M. Generating Alternative Land-use Allocation for Mixed Use Areas: Multi-Objective Optimization Approach. Geogr. Anal. 2019, 51, 448–474. [Google Scholar] [CrossRef]
- Srinivas, N.; Deb, K. Muiltiobjective optimization using nondominated sorting in genetic algorithms. Evol. Comput. 1994, 2, 221–248. [Google Scholar] [CrossRef]
- Gao, P.; Wang, H.; Cushman, S.A.; Cheng, C.; Song, C.; Ye, S. Sustainable land-use optimization using NSGA-II: Theoretical and experimental comparisons of improved algorithms. Landsc. Ecol. 2021, 36, 1877–1892. [Google Scholar] [CrossRef]
- Pan, T.; Su, F.; Yan, F.; Lyne, V.; Wang, Z.; Xu, L. Optimization of multi-objective multi-functional landuse zoning using a vector-based genetic algorithm. Cities 2023, 137, 104256. [Google Scholar] [CrossRef]
- Rahman, M.M.; Szabó, G. Multi-objective urban land use optimization using spatial data: A systematic review. Sustain. Cities Soc. 2021, 74, 103214. [Google Scholar] [CrossRef]
- Verma, S.; Pant, M.; Snasel, V. A comprehensive review on NSGA-II for multi-objective combinatorial optimization problems. IEEE Access 2021, 9, 57757–57791. [Google Scholar] [CrossRef]
- Ramezanian, R.; Hajipour, M. Integrated framework of system dynamics and meta-heuristic for multi-objective land use planning problem. Landsc. Ecol. Eng. 2020, 16, 113–133. [Google Scholar] [CrossRef]
- Maleki, J.; Masoumi, Z.; Hakimpour, F.; Coello Coello, C.A. Many-objective land use planning using a hypercube-based NSGA-III algorithm. Trans. GIS 2022, 26, 609–644. [Google Scholar] [CrossRef]
- Pan, T.; Zhang, Y.; Su, F.; Lyne, V.; Cheng, F.; Xiao, H. Practical Efficient Regional Land-Use Planning Using Constrained Multi-Objective Genetic Algorithm Optimization. ISPRS Int. J. Geo-Inf. 2021, 10, 100. [Google Scholar] [CrossRef]
- Handayanto, R.T.; Tripathi, N.K.; Kim, S.M.; Guha, S. Achieving a sustainable urban form through land use optimisation: Insights from Bekasi City’s land-use plan (2010–2030). Sustainability 2017, 9, 221. [Google Scholar] [CrossRef]
- Li, X.; Parrott, L. An improved Genetic Algorithm for spatial optimization of multi-objective and multi-site land use allocation. Comput. Environ. Urban Syst. 2016, 59, 184–194. [Google Scholar] [CrossRef]
- Masoumi, Z.; Coello Coello, C.A.; Mansourian, A. Dynamic urban land-use change management using multi-objective evolutionary algorithms. Soft Comput. 2020, 24, 4165–4190. [Google Scholar] [CrossRef]
- Li, Q.; Wu, J.; Su, Y.; Zhang, C.; Wu, X.; Wen, X.; Huang, G.; Deng, Y.; Lafortezza, R.; Chen, X. Estimating ecological sustainability in the Guangdong-Hong Kong-Macao Greater Bay Area, China: Retrospective analysis and prospective trajectories. J. Environ. Manag. 2022, 303, 114167. [Google Scholar] [CrossRef]
- Mavrommati, G.; Richardson, C. Experts’ evaluation of concepts of Ecologically Sustainable Development applied to coastal ecosystems. Ocean Coast. Manag. 2012, 69, 27–34. [Google Scholar] [CrossRef]
- Franco, L.; Magalhães, M.R. Assessing the ecological suitability of land-use change. Lessons learned from a rural marginal area in southeast Portugal. Land Use Policy 2022, 122, 106381. [Google Scholar] [CrossRef]
- Bagheri, M.; Zaiton Ibrahim, Z.; Mansor, S.; Manaf, L.A.; Akhir, M.F.; Talaat, W.I.A.W.; Beiranvand Pour, A. Land-Use Suitability Assessment Using Delphi and Analytical Hierarchy Process (D-AHP) Hybrid Model for Coastal City Management: Kuala Terengganu, Peninsular Malaysia. ISPRS Int. J. Geo-Inf. 2021, 10, 621. [Google Scholar] [CrossRef]
- Wei, B.; Li, Y.; Suo, A.; Zhang, Z.; Xu, Y.; Chen, Y. Spatial suitability evaluation of coastal zone, and zoning optimisation in ningbo, China. Ocean Coast. Manag. 2021, 204, 105507. [Google Scholar] [CrossRef]
- Stanković, M.; Gladović, P.; Popović, V. Determining the importance of the criteria of traffic accessibility using fuzzy AHP and rough AHP method. Decis. Mak. Appl. Manag. Eng. 2019, 2, 86–104. [Google Scholar] [CrossRef]
- Zavadskas, E.K.; Pamučar, D.; Stević, Ž.; Mardani, A. Multi-Criteria Decision-Making Techniques for Improvement Sustainability Engineering Processes. Symmetry 2020, 12, 986. [Google Scholar] [CrossRef]
- Tashayo, B.; Honarbakhsh, A.; Azma, A.; Akbari, M. Combined fuzzy AHP–GIS for agricultural land suitability modeling for a watershed in southern Iran. Environ. Manag. 2020, 66, 364–376. [Google Scholar] [CrossRef] [PubMed]
- Dong, J.; Dai, W.; Shao, G.; Xu, J. Ecological network construction based on minimum cumulative resistance for the city of Nanjing, China. ISPRS Int. J. Geo-Inf. 2015, 4, 2045–2060. [Google Scholar] [CrossRef]
- Adriaensen, F.; Chardon, J.; De Blust, G.; Swinnen, E.; Villalba, S.; Gulinck, H.; Matthysen, E. The application of ‘least-cost’modelling as a functional landscape model. Landsc. Urban Plan. 2003, 64, 233–247. [Google Scholar] [CrossRef]
- Huang, R.; Nie, Y.; Duo, L.; Zhang, X.; Wu, Z.; Xiong, J. Construction land suitability assessment in rapid urbanizing cities for promoting the implementation of United Nations sustainable development goals: A case study of Nanchang, China. Environ. Sci. Pollut. Res. 2021, 28, 25650–25663. [Google Scholar] [CrossRef] [PubMed]
- Yan, Y.; Zhou, R.; Ye, X.; Zhang, H.; Wang, X. Suitability evaluation of urban construction land based on an approach of vertical-horizontal processes. ISPRS Int. J. Geo-Inf. 2018, 7, 198. [Google Scholar] [CrossRef]
- Zhang, W.; Li, B. Research on an analytical framework for urban spatial structural and functional optimisation: A case study of Beijing city, China. Land 2021, 10, 86. [Google Scholar] [CrossRef]
- Li, F.; Gong, Y.; Cai, L.; Sun, C.; Chen, Y.; Liu, Y.; Jiang, P. Sustainable land-use allocation: A multiobjective particle swarm optimization model and application in Changzhou, China. J. Urban Plan. Dev. 2018, 144, 04018010. [Google Scholar] [CrossRef]
- Zheng, W.; Ke, X.; Xiao, B.; Zhou, T. Optimising land use allocation to balance ecosystem services and economic benefits-A case study in Wuhan, China. J. Environ. Manag. 2019, 248, 109306. [Google Scholar] [CrossRef]
- Liu, Y.; Tang, W.; He, J.; Liu, Y.; Ai, T.; Liu, D. A land-use spatial optimization model based on genetic optimization and game theory. Comput. Environ. Urban Syst. 2015, 49, 1–14. [Google Scholar] [CrossRef]
- Cao, K.; Zhang, W.; Wang, T. Spatio-temporal land use multi-objective optimization: A case study in Central China. Trans. GIS 2019, 23, 726–744. [Google Scholar] [CrossRef]
- Knaapen, J.P.; Scheffer, M.; Harms, B. Estimating habitat isolation in landscape planning. Landsc. Urban Plan. 1992, 23, 1–16. [Google Scholar] [CrossRef]
- Akpoti, K.; Kabo-bah, A.T.; Zwart, S.J. Agricultural land suitability analysis: State-of-the-art and outlooks for integration of climate change analysis. Agric. Syst. 2019, 173, 172–208. [Google Scholar] [CrossRef]
- Pilevar, A.R.; Matinfar, H.R.; Sohrabi, A.; Sarmadian, F. Integrated fuzzy, AHP and GIS techniques for land suitability assessment in semi-arid regions for wheat and maize farming. Ecol. Indic. 2020, 110, 105887. [Google Scholar] [CrossRef]
- Saaty, T.L. How to make a decision: The analytic hierarchy process. Eur. J. Oper. Res. 1990, 48, 9–26. [Google Scholar] [CrossRef]
- Ullah, K.M.; Mansourian, A. Evaluation of land suitability for urban land-use planning: Case study D haka City. Trans. GIS 2016, 20, 20–37. [Google Scholar] [CrossRef]
- Holzkämper, A.; Seppelt, R. A generic tool for optimising land-use patterns and landscape structures. Environ. Model. Softw. 2007, 22, 1801–1804. [Google Scholar] [CrossRef]
- Yang, L.; Sun, X.; Peng, L.; Shao, J.; Chi, T. An improved artificial bee colony algorithm for optimal land-use allocation. Int. J. Geogr. Inf. Sci. 2015, 29, 1470–1489. [Google Scholar] [CrossRef]
- Uyan, M.; Tongur, V.; Ertunc, E. Comparison of different optimization based land reallocation models. Comput. Electron. Agric. 2020, 173, 105449. [Google Scholar] [CrossRef]
- Wang, R. An improved nondominated sorting genetic algorithm for multiobjective problem. Math. Probl. Eng. 2016, 2016, 1519542. [Google Scholar] [CrossRef]
- Chen, X.; Duan, J. What they talk about when they talk about urban regeneration: Understanding the concept ‘urban regeneration’in PRD, China. Cities 2022, 130, 103880. [Google Scholar] [CrossRef]


Disclaimer/Publisher’s Note: The statements, opinions and data contained in all publications are solely those of the individual author(s) and contributor(s) and not of MDPI and/or the editor(s). MDPI and/or the editor(s) disclaim responsibility for any injury to people or property resulting from any ideas, methods, instructions or products referred to in the content. |
© 2023 by the authors. Licensee MDPI, Basel, Switzerland. This article is an open access article distributed under the terms and conditions of the Creative Commons Attribution (CC BY) license (https://creativecommons.org/licenses/by/4.0/).