Article

Multiscenario Simulation of Land-Use Change in Hubei Province, China Based on the Markov-FLUS Model

1
Faculty of Resources and Environmental Science, Hubei University, Wuhan 430062, China
2
National School of Business and Management of Tangier, Abdelmalek Essaâdi University, Tangier 90000, Morocco
3
Department of Regional Science, Faculty of Science, Eötvös Loránd University, 1117 Budapest, Hungary
4
Doctoral School of Economic and Regional Sciences, Hungarian University of Agriculture and Life Sciences, 2100 Godollo, Hungary
5
Faculty of Urban and Regional Planning, Cairo University, Giza 12613, Egypt
6
Faculty of Economics and Business, University of Debrecen, 4031 Debrecen, Hungary
7
Faculty of Economics and Business, John von Neumann University, 6000 Kecskemet, Hungary
8
Institute of Rural Development and Sustainable Economy, Hungarian University of Agriculture and Life Sciences, 2100 Godollo, Hungary
*
Authors to whom correspondence should be addressed.
Land 2023, 12(4), 744; https://doi.org/10.3390/land12040744
Submission received: 20 February 2023 / Revised: 22 March 2023 / Accepted: 24 March 2023 / Published: 25 March 2023
(This article belongs to the Special Issue Spatial Planning and Land-Use Management)

Abstract

:
A goal of land change modelers should be to communicate scenarios of future change that show the variety of possible future landscapes based on the consequences of management decisions. This study employs the Markov-FLUS model to simulate land-use changes in Hubei Province in multiple scenarios that consider social, economic, and ecological policies using 18 driving factors, including point-of-interest data. First, the Markov-FLUS model was developed and validated with historical data from 2000 to 2020. The model was then used to simulate land-use changes from 2020 to 2035 in four scenarios: natural development, economic priority, ecological protection, and cultivated land protection. The results show that the Markov-FLUS model effectively simulates the land-use change pattern in Hubei Province, with an overall accuracy of 0.93 for land use simulation in 2020. The Kappa coefficient and FOM index also achieved 0.86 and 0.139, respectively. In all four scenarios, cultivated land remained the primary land use type in Hubei Province from 2020 to 2035, while construction land showed an increasing trend. However, there were large differences in the simulated land use patterns in different scenarios. Construction land expanded most rapidly in the economic priority scenario, while it expanded more slowly in the cultivated land protection scenario. We designed the protection scenario to restrict the rapid expansion of construction land. In the natural development and economic priority scenarios, construction land expanded and encroached on cultivated land and forests. In contrast, in the ecological protection scenario, forests and water areas were well-preserved, and the decrease in cultivated land and the increase in construction land were effectively suppressed, resulting in a large improvement in land use sustainability. Finally, in the cultivated land protection scenario, the cultivated land showed an increasing trend. The spread and expansion of construction land were effectively curbed. In conclusion, the Markov-FLUS model applied in this study to simulate land use in multiple scenarios has substantial implications for the effective utilization of land resources and the protection of the ecological environment in Hubei Province.

1. Introduction

Urbanization is a natural outcome of social and economic progress, enhancing the quality of human life but also transforming the land’s surface environment [1]. However, some unsustainable land use practices in the rapid urbanization process have resulted in severe ecological damage, including soil erosion, grassland degradation, and wetland shrinkage, posing a threat to ecological security. The rapid expansion of urban land use has encroached upon a substantial amount of ecological space, further exacerbating ecological issues [2]. Therefore, promoting sustainable land use patterns that balance economic growth with environmental protection is critical.
Land use is a cornerstone of resource, environmental, and ecological research, as well as scientific management. It provides crucial data for land resource planning and ecological environment monitoring [3]. Land-use change is a complex process influenced by various social, economic, and environmental factors that operate over time and space [4]. Land-use change models play a vital role in examining the driving forces, evolutionary processes, impacts, and prospects of land-use change [5]. Therefore, simulating land-use change at different spatiotemporal scales is essential for understanding the impact of human activities on regional ecological environments and supporting decision-making processes [6]. By modeling and simulating land-use change, we can gain a better understanding of the processes and trends of land-use change and formulate appropriate land policies [7,8].
In recent years, a considerable amount of scholarly effort has been devoted to the design and implementation of models for land-use change, resulting in the development of a variety of models [9,10,11,12]. The commonly utilized land-use change simulation models can be classified into two main types. The first type is quantity simulation models, which primarily focus on quantifying land demand. These models analyze changes in the areas of different land cover types, as well as their rates of change, but do not consider spatial distribution. Examples of such models include Markov models [13], gray system models [14], regression analysis models [15], and system dynamics (SD) models [16]. The second type is spatial simulation models, which are mainly used to simulate the spatial distribution and pattern characteristics of land use and to analyze the spatial differences in land-use change driven by natural and human factors. Examples of such models include cellular automata (CA) [17], multiagent systems [18], and CLUE/CLUE-S models [19]. Based on the causal relationship between past land-use change and related driving force factors, researchers have computed land use demand and distribution probability to simulate future spatiotemporal land use patterns in targeted scenarios.
The present mathematical models used for simulating changes in land use quantity can reasonably predict future land use quantity based on past and current land cover data [10]. However, due to their lack of capability to simulate changes in land use spatial patterns, these models are unable to meet the needs of national land use planning and management [20]. In contrast, land use spatial change simulation models exhibit outstanding advantages in simulating the spatiotemporal dynamics of complex land use systems. Currently, the CA model has been successfully applied to simulate land-use changes and urban expansion processes [21]. Nevertheless, conventional CAs usually assume that each cell has only one land use type at each time step, ignoring the mixed land use structures that are often found in land units [22,23]. On the other hand, the SLEUTH model can adjust constraint conditions by configuring different parameters to control the type of urban growth and simulate the process of urbanization through cellular allocation [24]. Nonetheless, this model is mainly suitable for simulating urban expansion and does not consider the impact of macro land supply and demand and relevant land policies on land-use changes [25]. The multiagent model can simulate land-use changes based on the decision-making interactions of multiple agents and the influence of the external environment. However, characterizing the rules for different land-use change decision-making processes is complex, and collecting sufficient data at the individual level to verify the model is difficult. The CLUE/CLUE-S model is an empirical statistical model that can simultaneously simulate changes in multiple land use types due to its application of a system theory approach to address the competitive relationships between different land use types [26,27]. However, during the land cover allocation process, this model only assigns the dominant land use type with the maximum joint probability to the grid cell, neglecting the possibility of other nondominant land use types transitioning, thus lacking the ability to simulate sudden and dramatic land-use changes [28,29,30].
Coupled simulation models that balance land use demand quantification and spatial allocation simulation have become the mainstream choice [31,32]. The Markov-FLUS model is a new type of land-use change simulation model that overcomes the aforementioned limitations [15,33]. It integrates a “top-down” SD model and a “bottom-up” CA model to simultaneously simulate changes in multiple land use types [34]. Its land cover selection mechanism, based on roulette wheel selection, allows nondominant land use types to be allocated to grid cells, reflecting the uncertainty of actual land-use changes and enabling the model to simulate sudden and dramatic changes in land use. In contrast, most current models, such as CLUE-S, assign the land use type of a specific grid cell to the primary cell with the highest conversion probability, controlled by predefined thresholds that only consider dominant land use types, neglecting competition with other types and reducing opportunities for nondominant types [35,36]. Although the dominant land use type with the highest combined probability is prioritized in grid cell allocation, other types with relatively lower probabilities still have a chance of being allocated [37,38,39]. The roulette wheel selection mechanism allocates land use types in proportion to their combined probabilities, increasing the likelihood of being selected for land use occupation with higher combined probabilities, while lower combined probabilities still offer allocation opportunities. This stochastic mechanism reflects real-world land-use change uncertainty, making it suitable for leapfrogging land use simulations.
The Markov-FLUS model is widely used in land use research and is a powerful analytical tool for land use planning and management. This study employs the Markov-FLUS model and applies it to Hubei Province, China. The contributions of this paper are as follows:
  • Historical land use data from 2000 to 2015 and 18 driving factors, including 10 points-of-interest data, were used to simulate future land use patterns in Hubei Province, China.
  • The improved model simulated and analyzed four different future land use scenarios, providing valuable insights for decision making on sustainable land use and planning management in Hubei Province, China.

2. Materials and Methodology
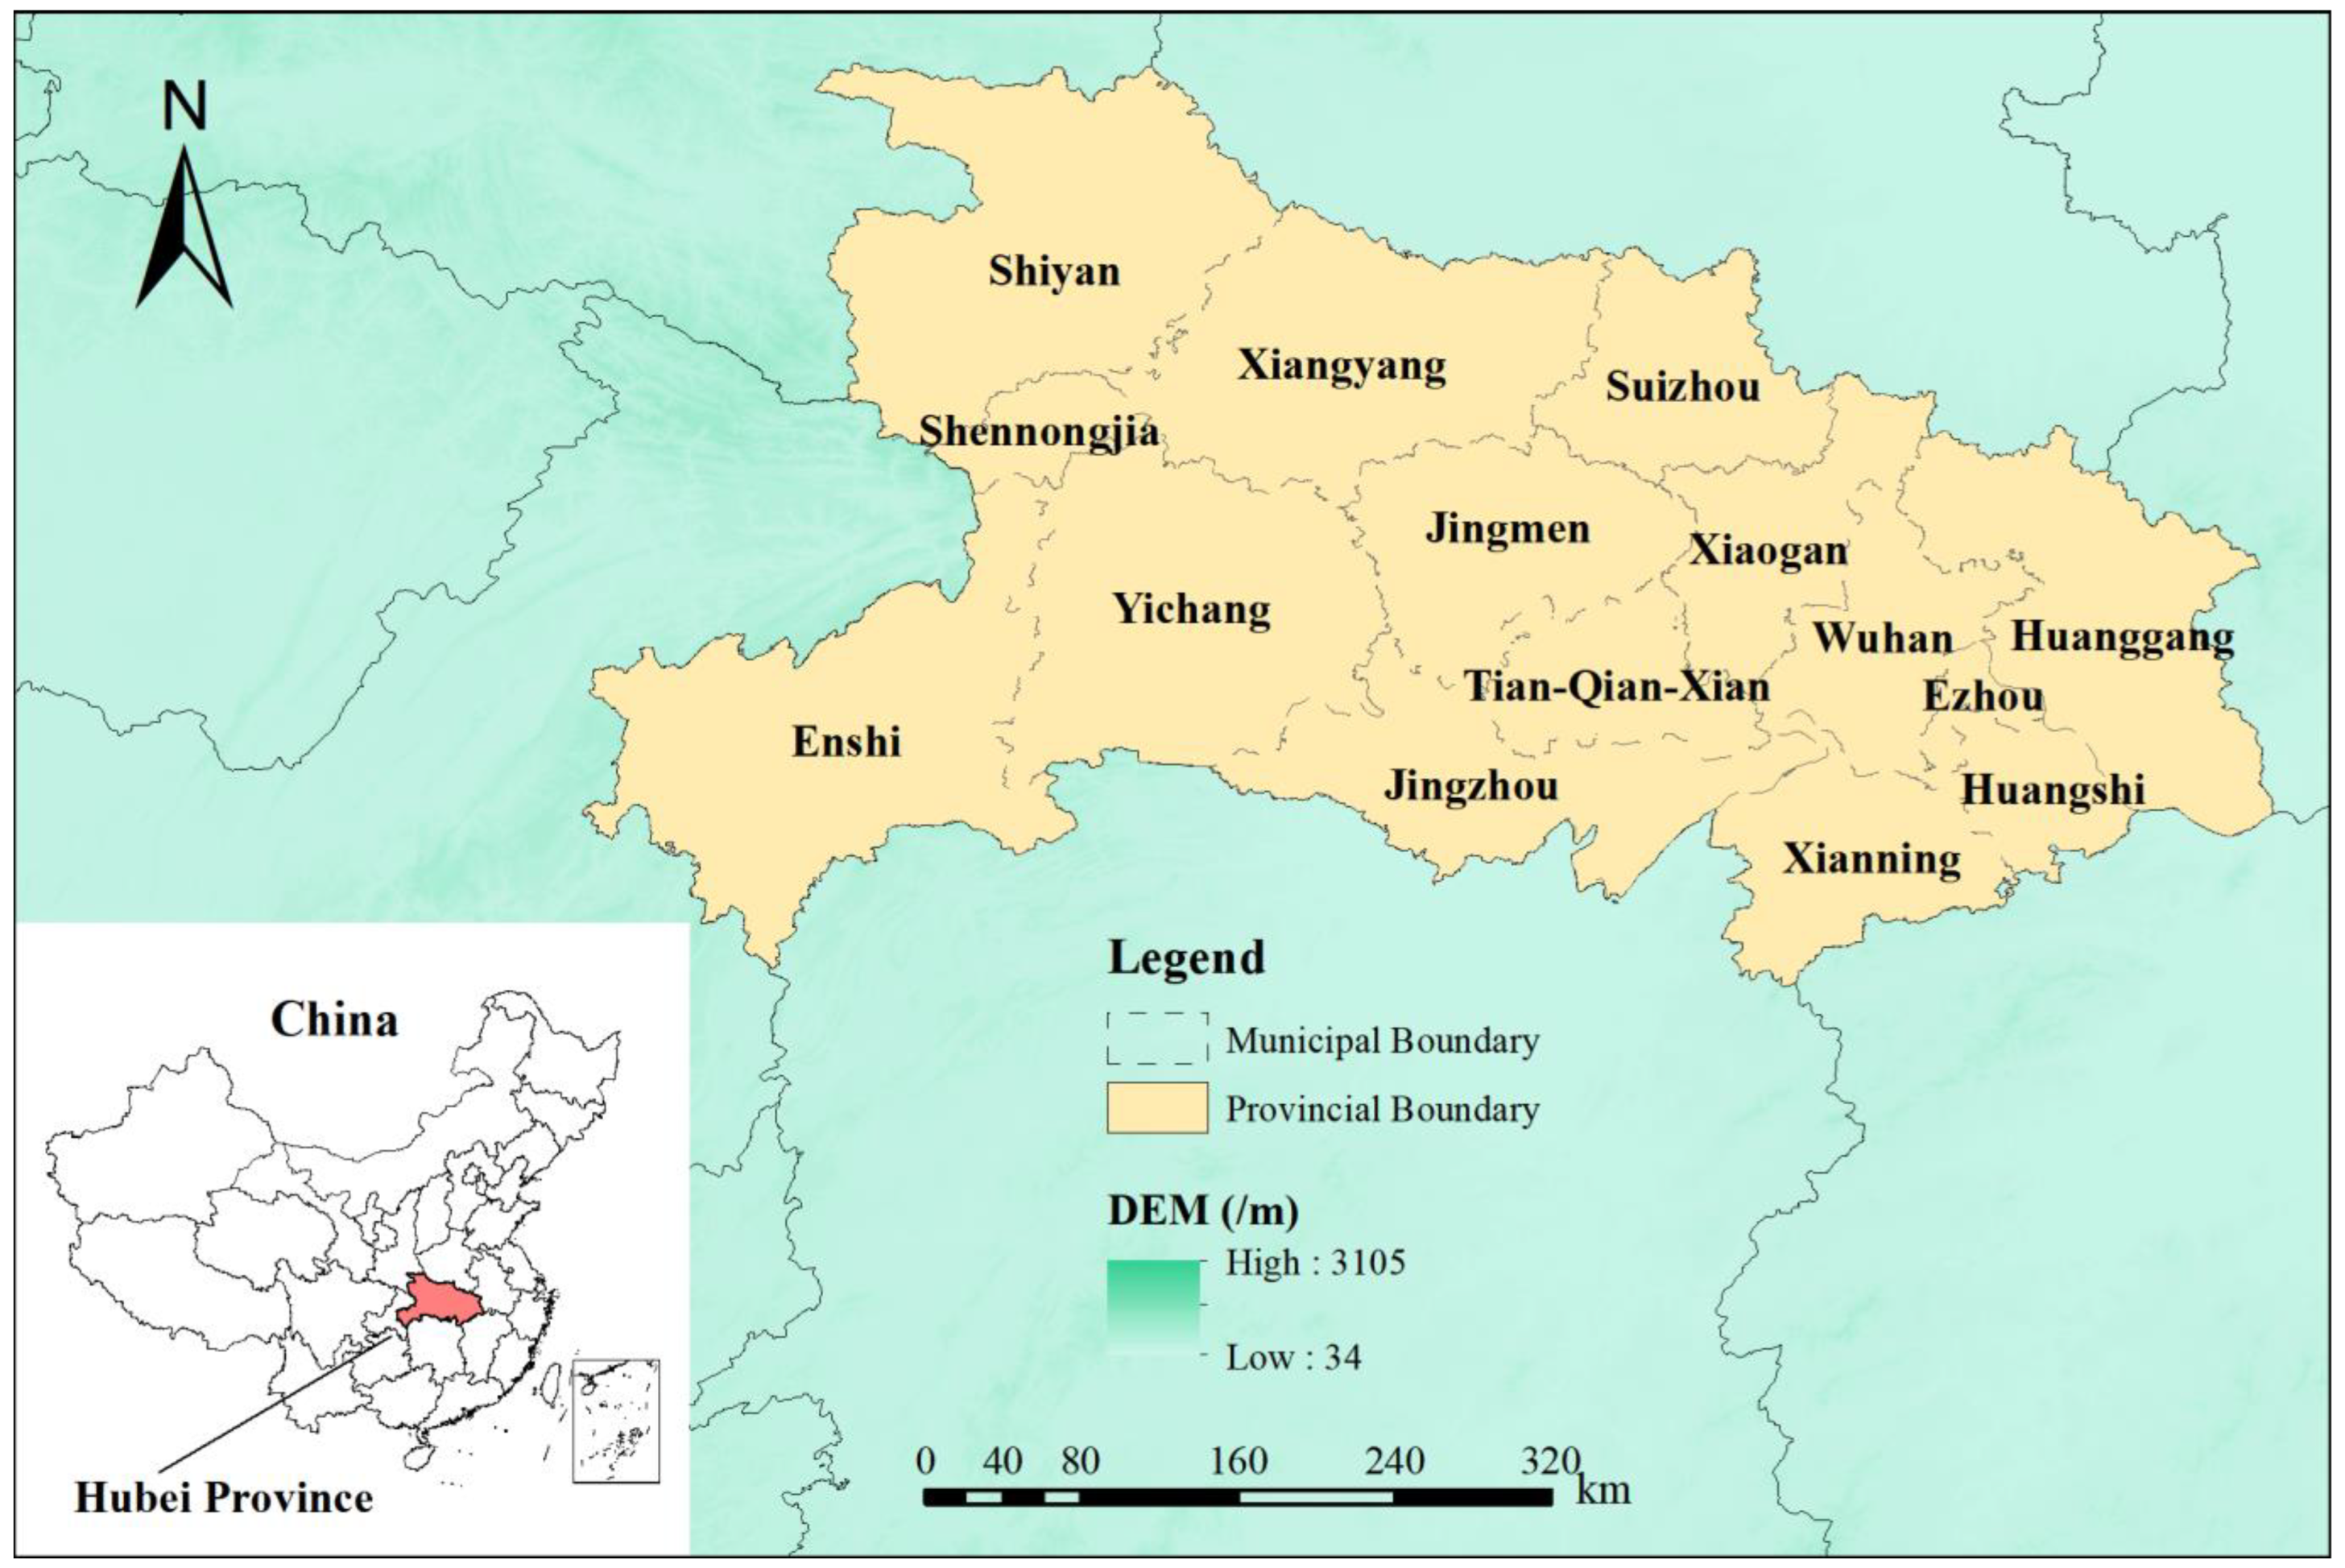
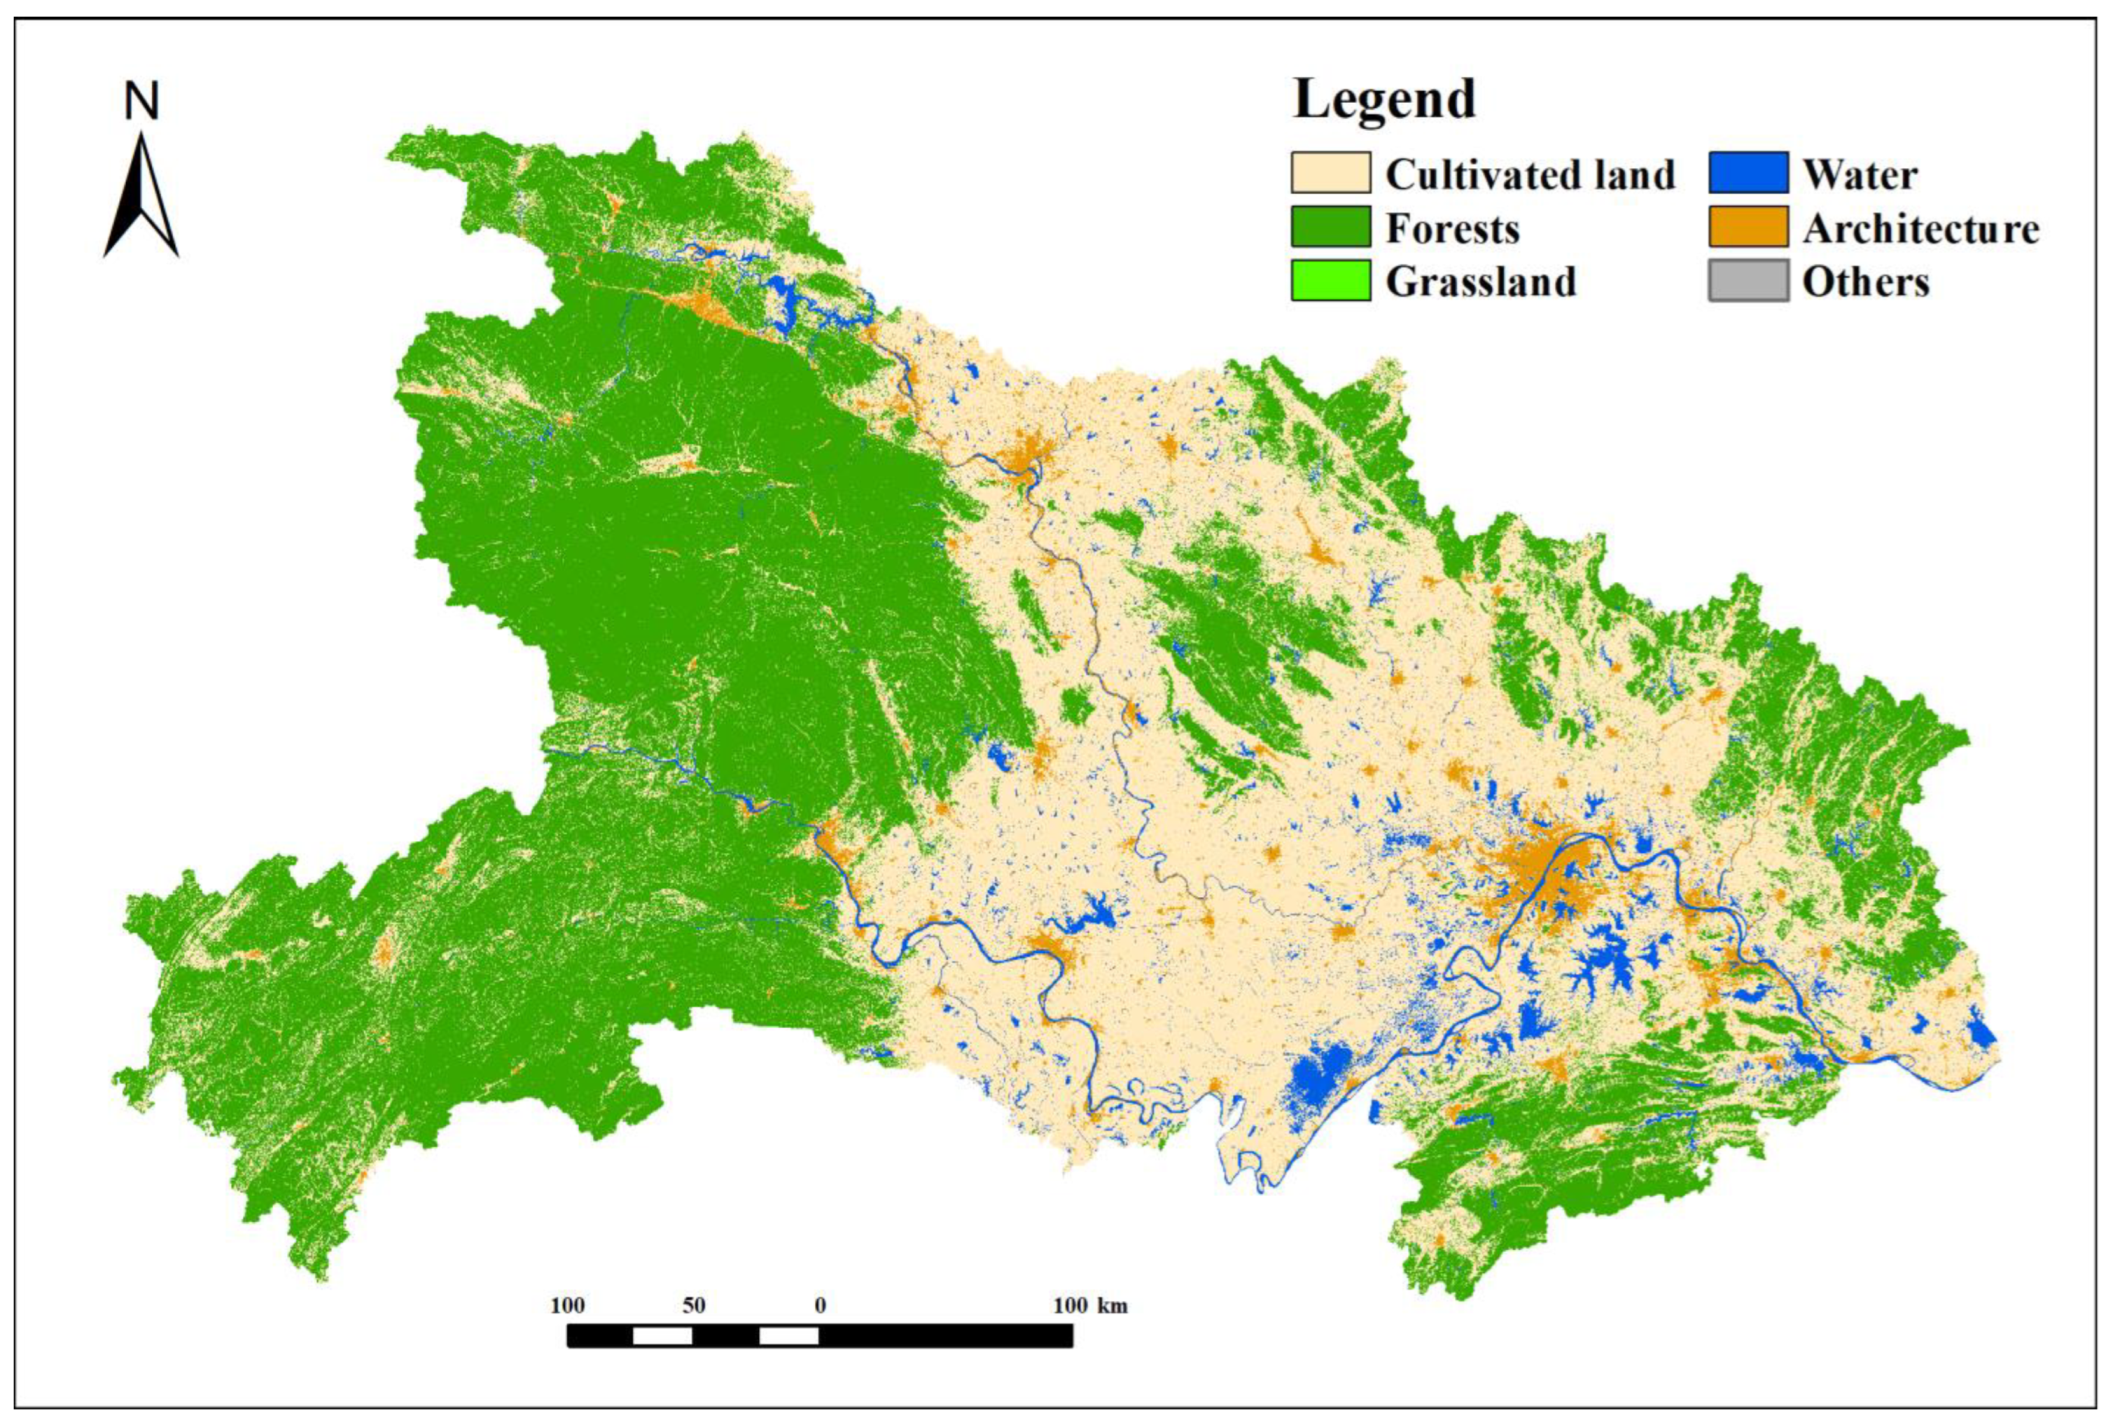
2.1. Case Overview

Hubei Province, located in Central China, boasts a unique geographic location, diverse terrain, and a mild and humid climate, which have endowed it with abundant natural resources and unique natural environments [40]. Geographically, Hubei Province is situated in the middle reaches of the Yangtze River and features a mountainous landscape, making it one of the most prominent water and electricity supply and industrial bases in China [41,42]. The Three Gorges Dam, which is one of the world’s largest hydraulic projects, has made important contributions to the power supply in southern China. The Dabie and Wudang mountain areas are also noteworthy natural landscapes in Hubei Province, and these topographical features have had a profound impact on the province’s economic and cultural development. Furthermore, Hubei Province accords great importance to the preservation and development of its cultural heritage, such as the Chu culture, Jingchu culture, and Han culture in the Han River Basin, which has had a profound influence [43]. Figure 1 shows the geographical location of Hubei Province [44,45].
Hubei Province is the largest province in Central China and has various unique characteristics. From the perspective of the natural environment, Hubei Province has a rich and diverse ecological environment, and the protection and utilization of natural resources are of paramount importance for the province’s sustainable development. For instance, the natural beauty of the Dabie Mountains, the Enshi Grand Canyon, and other locations in Hubei Province has attracted a large number of tourists. It has diverse land use types, a vast mountainous region in the northwest, and the largest interbasin water transfer project in China [46]. Moreover, it is known as the “Province of Thousand Lakes” and is home to Wuhan, one of China’s most developed cities, and the provincial capital. However, its urban development is notably uneven, which makes it an intriguing area of research. The Hubei Provincial Government has outlined a future planning goal of achieving “one main lead, two wing drives, and coordinated development across the region” by 2035. This study is expected to provide valuable support toward realizing this objective.
In summary, the plentiful natural resources and unique natural environment of Hubei Province provide strong support for its economic, cultural, and social development, making it a crucial field for academic research. Therefore, enhancing research on land-use change simulation under different scenarios in Hubei Province and investigating ways to balance natural resource protection with economic and social development have great academic and practical significance.

2.2. Research Design

This study utilizes a Markov-FLUS model to develop four future scenarios and simulate future spatial patterns in response to a given land use demand determined by the model. First, we use ANN to estimate the probability of each land use type occurring in a specific grid cell. Second, we incorporate complex adaptive inertia and competition mechanisms to account for the competition and interactions between different land use types. During the CA iteration, we estimate the dominant land use type by combining the probabilities of all land use types at each grid image element and assign it using a roulette selection process. The proposed method captures the complex land use dynamics in the simulation of future land-use changes. Figure 2 illustrates the research design of this study.

2.3. Data and Preprocessing

This study employs land use status data (annual China Land Cover Dataset, CLCD) from 2000, 2005, 2010, 2015, and 2020, obtained from the dataset published by Yang et al. The CLCD consists of 6 level-1 classes (cropland, forest, grassland, water, built-up area, and barren) and 25 level-2 classes [47,48]. The producers of the dataset assessed its overall accuracy through field surveys and achieved an accuracy rate of over 94.3% for the level-1 classes and 91.2% for the level-2 classes. Although the CLCD is updated every five years, its consistent regions can serve as potential training samples for long-term data analysis [47,49]. A further assessment based on 5131 third-party test samples showed that the overall accuracy of the CLCD outperformed that of MCD12Q1, ESACCI_LC, FROM_GLC, and GlobeLand30 [47,50]. The data have a spatial resolution of 30 m. Based on the land-use classification system and the characteristics of land use in Hubei Province, we chose to use the 6 level-1 classes of the CLCD produced by Wuhan University and renamed them as cultivated land, forests, grassland, water, architecture, and others (unused land). Social and economic data were procured from the Chinese Academy of Sciences Data Center (https://www.resdc.cn/, accessed on 21 November 2022) and the Hubei Statistical Yearbook, while the sources for other natural, transportation, and social economic data are listed in Table 1. The data were processed using ArcGIS software to ensure conformity with the requirements of the Markov-FLUS model [37,51,52] by converting, projecting, and resampling the data into the same projection coordinate system with a spatial resolution of 100 m.

2.4. Methodology

2.4.1. Principles of the Markov-FLUS Model

The Markov-FLUS model is constructed based on the system dynamics model and the cellular automata model. It integrates the artificial neural network (ANN) algorithm and the roulette wheel selection mechanism to enhance the accuracy of land-use change simulation [53,54]. This mechanism effectively handles the interplay of various driving factors, including natural, social, and economic factors, as well as the complexity and uncertainty associated with the interconversion among various land use types [55]. The FLUS model has been widely applied to solve geographical process simulations and complex spatial optimization problems, such as large-scale land-use change, urban expansion, zoning of nature reserves, and facility location selection [56,57].
The Markov-FLUS model employs a multilayer feedforward neural network algorithm (BP-ANN) to integrate various land use types and select multiple driving factors, such as natural, social, and economic factors, from the initial land use data [58]. By associating different land use types with various driving factors, this model generates a probability distribution map of land suitability for each type [59]. However, traditional CA models have some limitations in regard to simulating real-world changes in land use [60]. This is because traditional CA models often assume that the processes that drive land change are static and do not take into account the dynamic processes that can lead to changes in land use over time, such as urbanization and development [59].
To address these issues and improve the accuracy of the simulation, the Markov-FLUS model incorporates an adaptive inertia competition mechanism based on roulette wheel selection into the traditional CA model [61]. This enables better handling of the complexity and uncertainty of land use type conversions under the influence of natural and human activities [62,63].
This study couples the CA module and the Markov model in FLUS to dynamically simulate and predict the future land use distribution in Hubei Province. The CA module has the ability to handle the spatial interactions of land use [64,65], while the Markov model can predict changes in the sizes of land use types over time [66]. The model utilizes transition probabilities between distinct land use types to predict the likelihood of a parcel undergoing a change in land use type at a future time [67]. Through the application of these probabilities to the current distribution of land use types, the model can forecast alterations in the distribution over time [68].
The advantage of this approach lies in integrating the ability of the CA module to handle the spatial distribution of land use and the characteristics of the Markov model to predict the number of land use types [69]. This results in an exploration of dynamic information on land use types in terms of both space and quantity. In the coupling process, the simulation results of each stage are used as input for the next stage, along with the driving forces and demands of the next stage, thereby ensuring mutual feedback between the two models during the simulation process.
By modifying the input parameters of the FLUS model, this study estimated the land type area under four scenarios of Hubei Province in 2035.

2.4.2. Drivers of Land-Use Change

Land-use change is the result of the interplay between the intrinsic physical and chemical conditions of various land types and external factors such as natural, social, and economic factors. Under the influence of natural factors, land-use change is relatively stable, as the transformation of land use types occurs under strict natural limitations. However, the rapid development of urbanization has made the situation of land-use change more complex, with the combined effects of various factors, including social, economic, and policy factors [28,28,70].
This study conducted a comprehensive review of the previous literature and identified four distinct categories of driving factors: geographical, climatic, socioeconomic, and locational factors [71]. These four categories represent the primary factors that influence land-use change. To enhance the comprehensiveness of our study, we incorporated some point-of-interest (POI) data into the socioeconomic and location factor categories, which had previously been overlooked in the literature. We employed various combinations of the driving factors in the Markov-FLUS model and evaluated their performance based on neural network model training and probability calculation. The combination consisting of 18 driving factors exhibited the lowest RMSE and high measurement accuracy. Table 1 presents the types and sources of all driving factors, with a spatial resolution of 100 m and a completely unified spatial range, mathematical basis, and format.
Figure 3 shows the raster images of all driving factors. Geographic and climatic conditions, as natural factors, determine the direction, mode, and trend of land-use changes. Therefore, DEM, slope, and aspect, which constitute the most critical terrain conditions, were selected as the driving factors to characterize geographic factors. Average precipitation and temperature, which constitute the most critical climatic conditions, were selected as the driving factors to characterize climatic factors. Accessibility, as an important location factor, affects the convenience and cost of land development and has a large impact on regional land-use change. This study mainly selected the distances of various land use types to water bodies, highways, primary roads, railways, town centers, city centers, and bus stops as driving factors to characterize location factors. Additionally, this study also selected driving factors to characterize economic factors, such as GDP, population density, restaurant density, hotel density, and supermarket density [72,73].
This study incorporated 10 POI data as part of our driving factor analysis, encompassing geographic information from various establishments such as hotels, restaurants, supermarkets, and bus stations. The utilization of these data points has not been extensively explored in previous studies. By incorporating these data points, we gained a more comprehensive understanding of land-use changes.

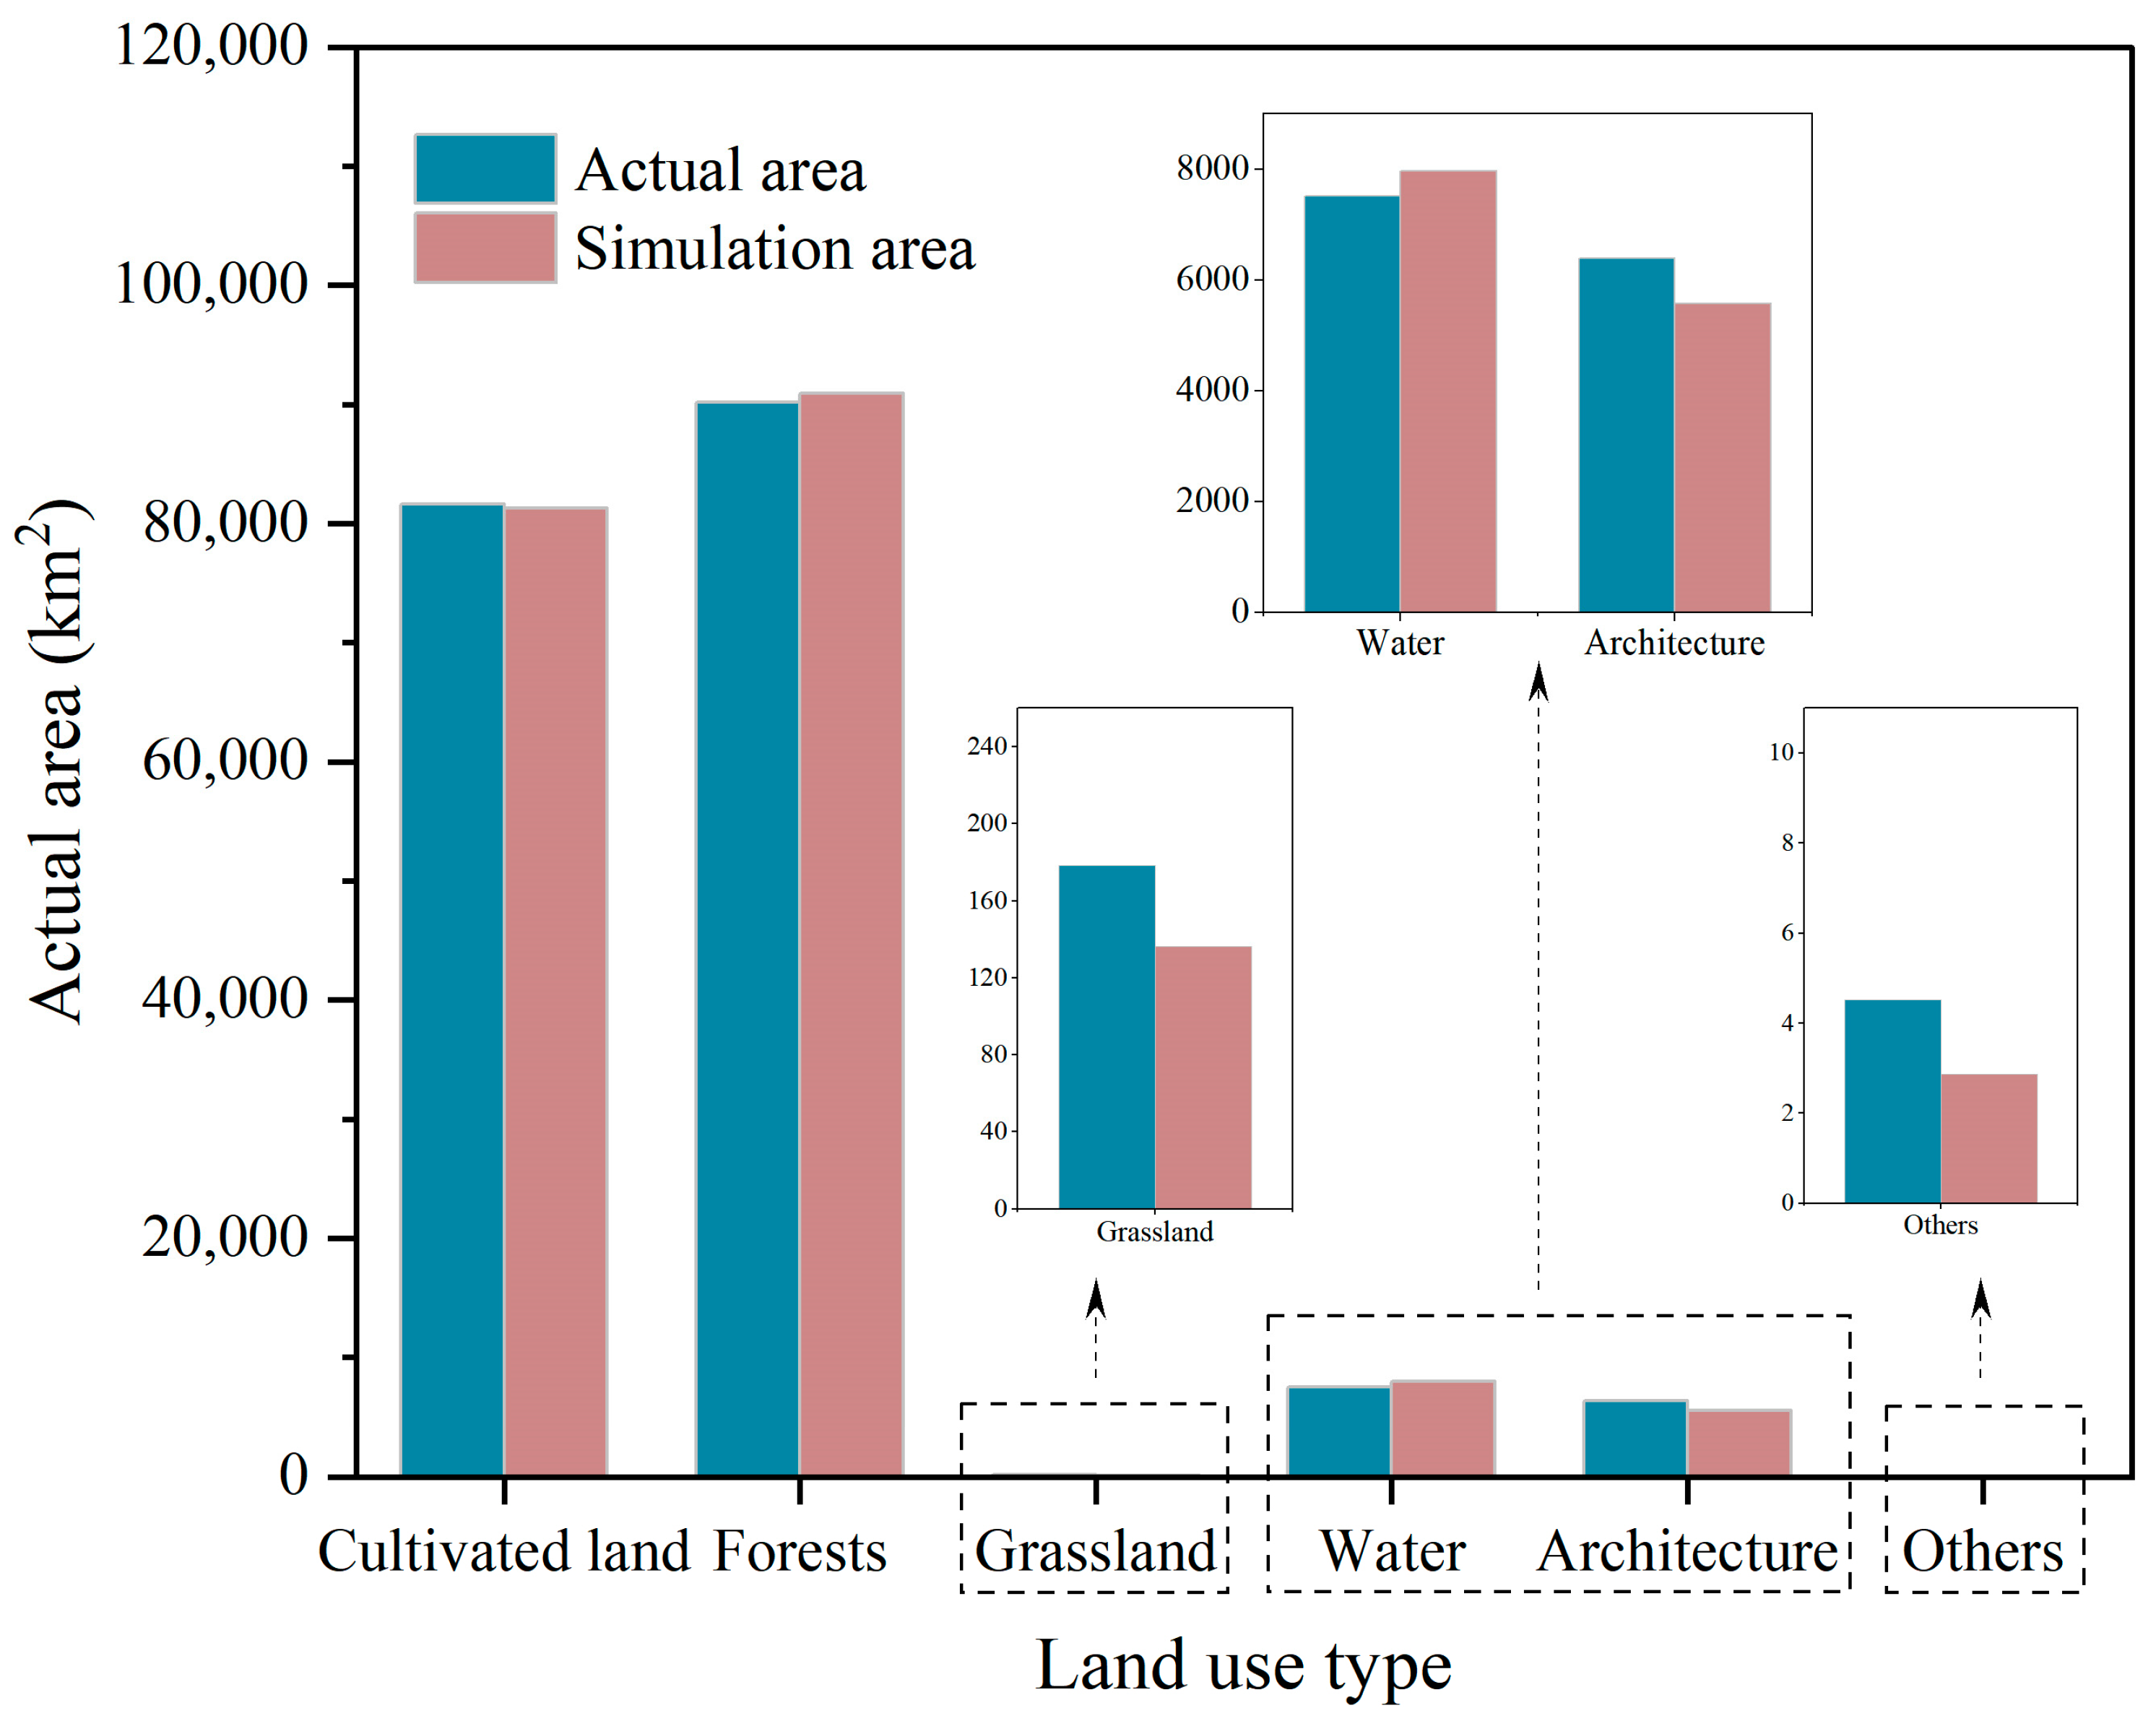
2.4.3. Model Accuracy Verification

Uncertainty in simulations is inevitable and emerges from various sources, such as the accuracy of the initial land use data used for simulation, the accuracy of driving factors, and simulation performance. Therefore, to acknowledge the uncertainty of simulations, we used historical land use data from 2010 and 2015 to predict land use demand for 2020. Data were imported regarding suitability probabilities and limiting factors for each individual land use type, and the Markov model was employed to predict land-use change in Hubei Province from 2015 to 2020. Figure 4 presents a comparison between the predicted outcomes and actual 2020 land use patterns, while Figure 5 shows a comparison of predicted versus actual land use type areas. The subtle differences observed between the predicted and actual datasets are because of a small amount of change during the validation time interval.
Table 2 displays the overall accuracy, Kappa coefficient, and FOM index. The effectiveness of the model was validated through the application of overall accuracy (OA), the FOM index, and the Kappa coefficient. The values of OA and Kappa are typically between 0 and 1, with a higher value indicating a higher level of accuracy in the model simulation. When the Kappa coefficient is greater than 0.8, it indicates that the model simulation accuracy has reached a satisfactory level of statistical significance [29,74]. Additionally, this study employed the FOM coefficient to assess the accuracy of the model, which is a measure of the efficiency, sensitivity, or precision of a system. A larger FOM value indicates better simulation results and higher accuracy. The accuracy coefficient is the best test for the rationality of the driving factors, suitability probability maps, and other parameter settings used in the model, which jointly affect the simulation results. To further test the adaptability of the model in Hubei Province, we adopted a 20% random sampling strategy for comparison, and the calibration results are shown in Table 3. Based on the results of the three accuracy coefficients and random sampling, the FLUS model demonstrated good applicability in this study.

2.5. Multiple Scenario Simulations

2.5.1. Design of Multiple Scenario Simulations

The development of the socio-economic and natural environment is characterized by uncertainty. Scenario analysis provides a valuable tool for exploring and comparing the outcomes of different scenarios based on various assumptions that represent development goals. This approach enables the development of strategies that are best suited for future development. Based on the previous literature and considering the current development situation and future socioeconomic development plan of Hubei Province [35,37,75,76], this study used the Markov model to design four scenarios:
  • The natural development scenario, also known as the recent trends scenario, is constructed based on the trajectory of past and current development in Hubei Province. The current trends for economic and population development and technological innovation are assumed to remain continually consistent. In this scenario, there is no human interference or restrictions on land use development, and it follows the natural changes in land use based on historical characteristics of land-use change and natural socioeconomic development factors, with transition probabilities maintaining the level between 2000 and 2020. In other words, the recent trends scenario assumes a continuation of historical patterns of land change.
  • The economic priority scenario, which aims to maximize socioeconomic benefits, assumes that cities become attractive destinations due to rapid regional economic growth and technological innovation. The continuous rapid growth of the population and economy comes at the expense of natural resources (with a growth rate of approximately 0.9% to 8%), leading to drastic land-use changes. In this scenario, economic development is prioritized and requires the rapid expansion of built-up land such as cities and roads, which are important signs of economic development. In this model, we increase the cost of conversion from built-up land to other land and reduce the probability of transfer from living space to ecological space.
  • The ecological protection scenario focuses on protecting ecological land, with a cultivated land area of no less than that of the planned cultivated land retention and medium- to high-yield cultivated land area in 2020. The forest area is no less than the planned area in 2020. The area of urban land, rural residential areas, and other construction land does not exceed the planned area in 2020. The ecological protection red-line area is the restricted development zone. In other words, the ecological protection scenario refers to strengthening forests, grassland, water, and other ecological lands while weakening the expansion capacity of the other land types.
  • The cultivated land protection scenario, which aims to simulate the impact and environmental effects of cultivated land protection policies and land reclamation activities, takes the key cultivated land protection areas (basic farmland protection areas) as the restricted development area, with a cultivated land area of no less than that of the planned cultivated land retention and medium- to high-yield cultivated land area in 2020. The area of urban land, rural residential areas, and other construction land does not exceed the planned area in 2020. The probability of cultivated land being converted to urban land, rural residential areas, and other construction land is reduced, while the probability of grassland, urban land, rural residential areas, and unused land being converted to cultivated land is increased.

2.5.2. Neighborhood Factors

Neighborhood factors can reflect the intensity of expansion of different land types, particularly the expansion potential of various land uses under external influences [77,78]. Parameters similar to neighborhood factors have been utilized in several large-scale land use simulation models, such as CLUE-S, FORE-SCE, and CLUMondo [35]. These models employ a static set of empirically derived parameters to represent the degree of difficulty associated with land-use conversion in specific regions.
These neighborhood factors range from 0 to 1, with higher values indicating a stronger expansion ability of the land use type. Neighborhood factors are estimated by analyzing historical land use data in the study area and incorporating expert opinions. These factors reflect the inherent properties of land use and are not influenced by changes such as technological advancements or human activities. In this study, after reviewing the previous literature and conducting multiple tests and adjustments, the parameters for neighborhood influence factors for each land type were finally determined and are presented in Table 4.

2.5.3. Conversion Costs and Restricted Change Area Settings

Conversion cost is used to represent the degree of difficulty in converting from the current land use type to the desired type and is another factor shaping land use dynamics [79]. In this study, four different conversion costs were designed based on the four scenarios established, as shown in Table 5. In the table, a value of one represents that two land use types can be converted to each other, while zero indicates that they cannot be converted.
The setting of restricted areas means that according to the actual situation of the study area, some areas are selected as exclusion zones and land-use conversion is prohibited [33]. This study presents four different constrained conversion areas designed based on four specific scenarios. In the natural development scenario, all land-use changes are permitted. In the economic priority scenario, the conversion of architectural land into other types is prohibited. In the ecological protection scenario, the conversion of cultivated land, forest, grasslands, and water areas into architectural land is forbidden. Moreover, conversion is also prohibited within ecological nature reserves and ecological protection red-line areas. In the cultivated land protection scenario, the conversion of cultivated land into other types is prohibited. Additionally, conversion is also prohibited within basic farmland protection areas.

3. Results and Discussion

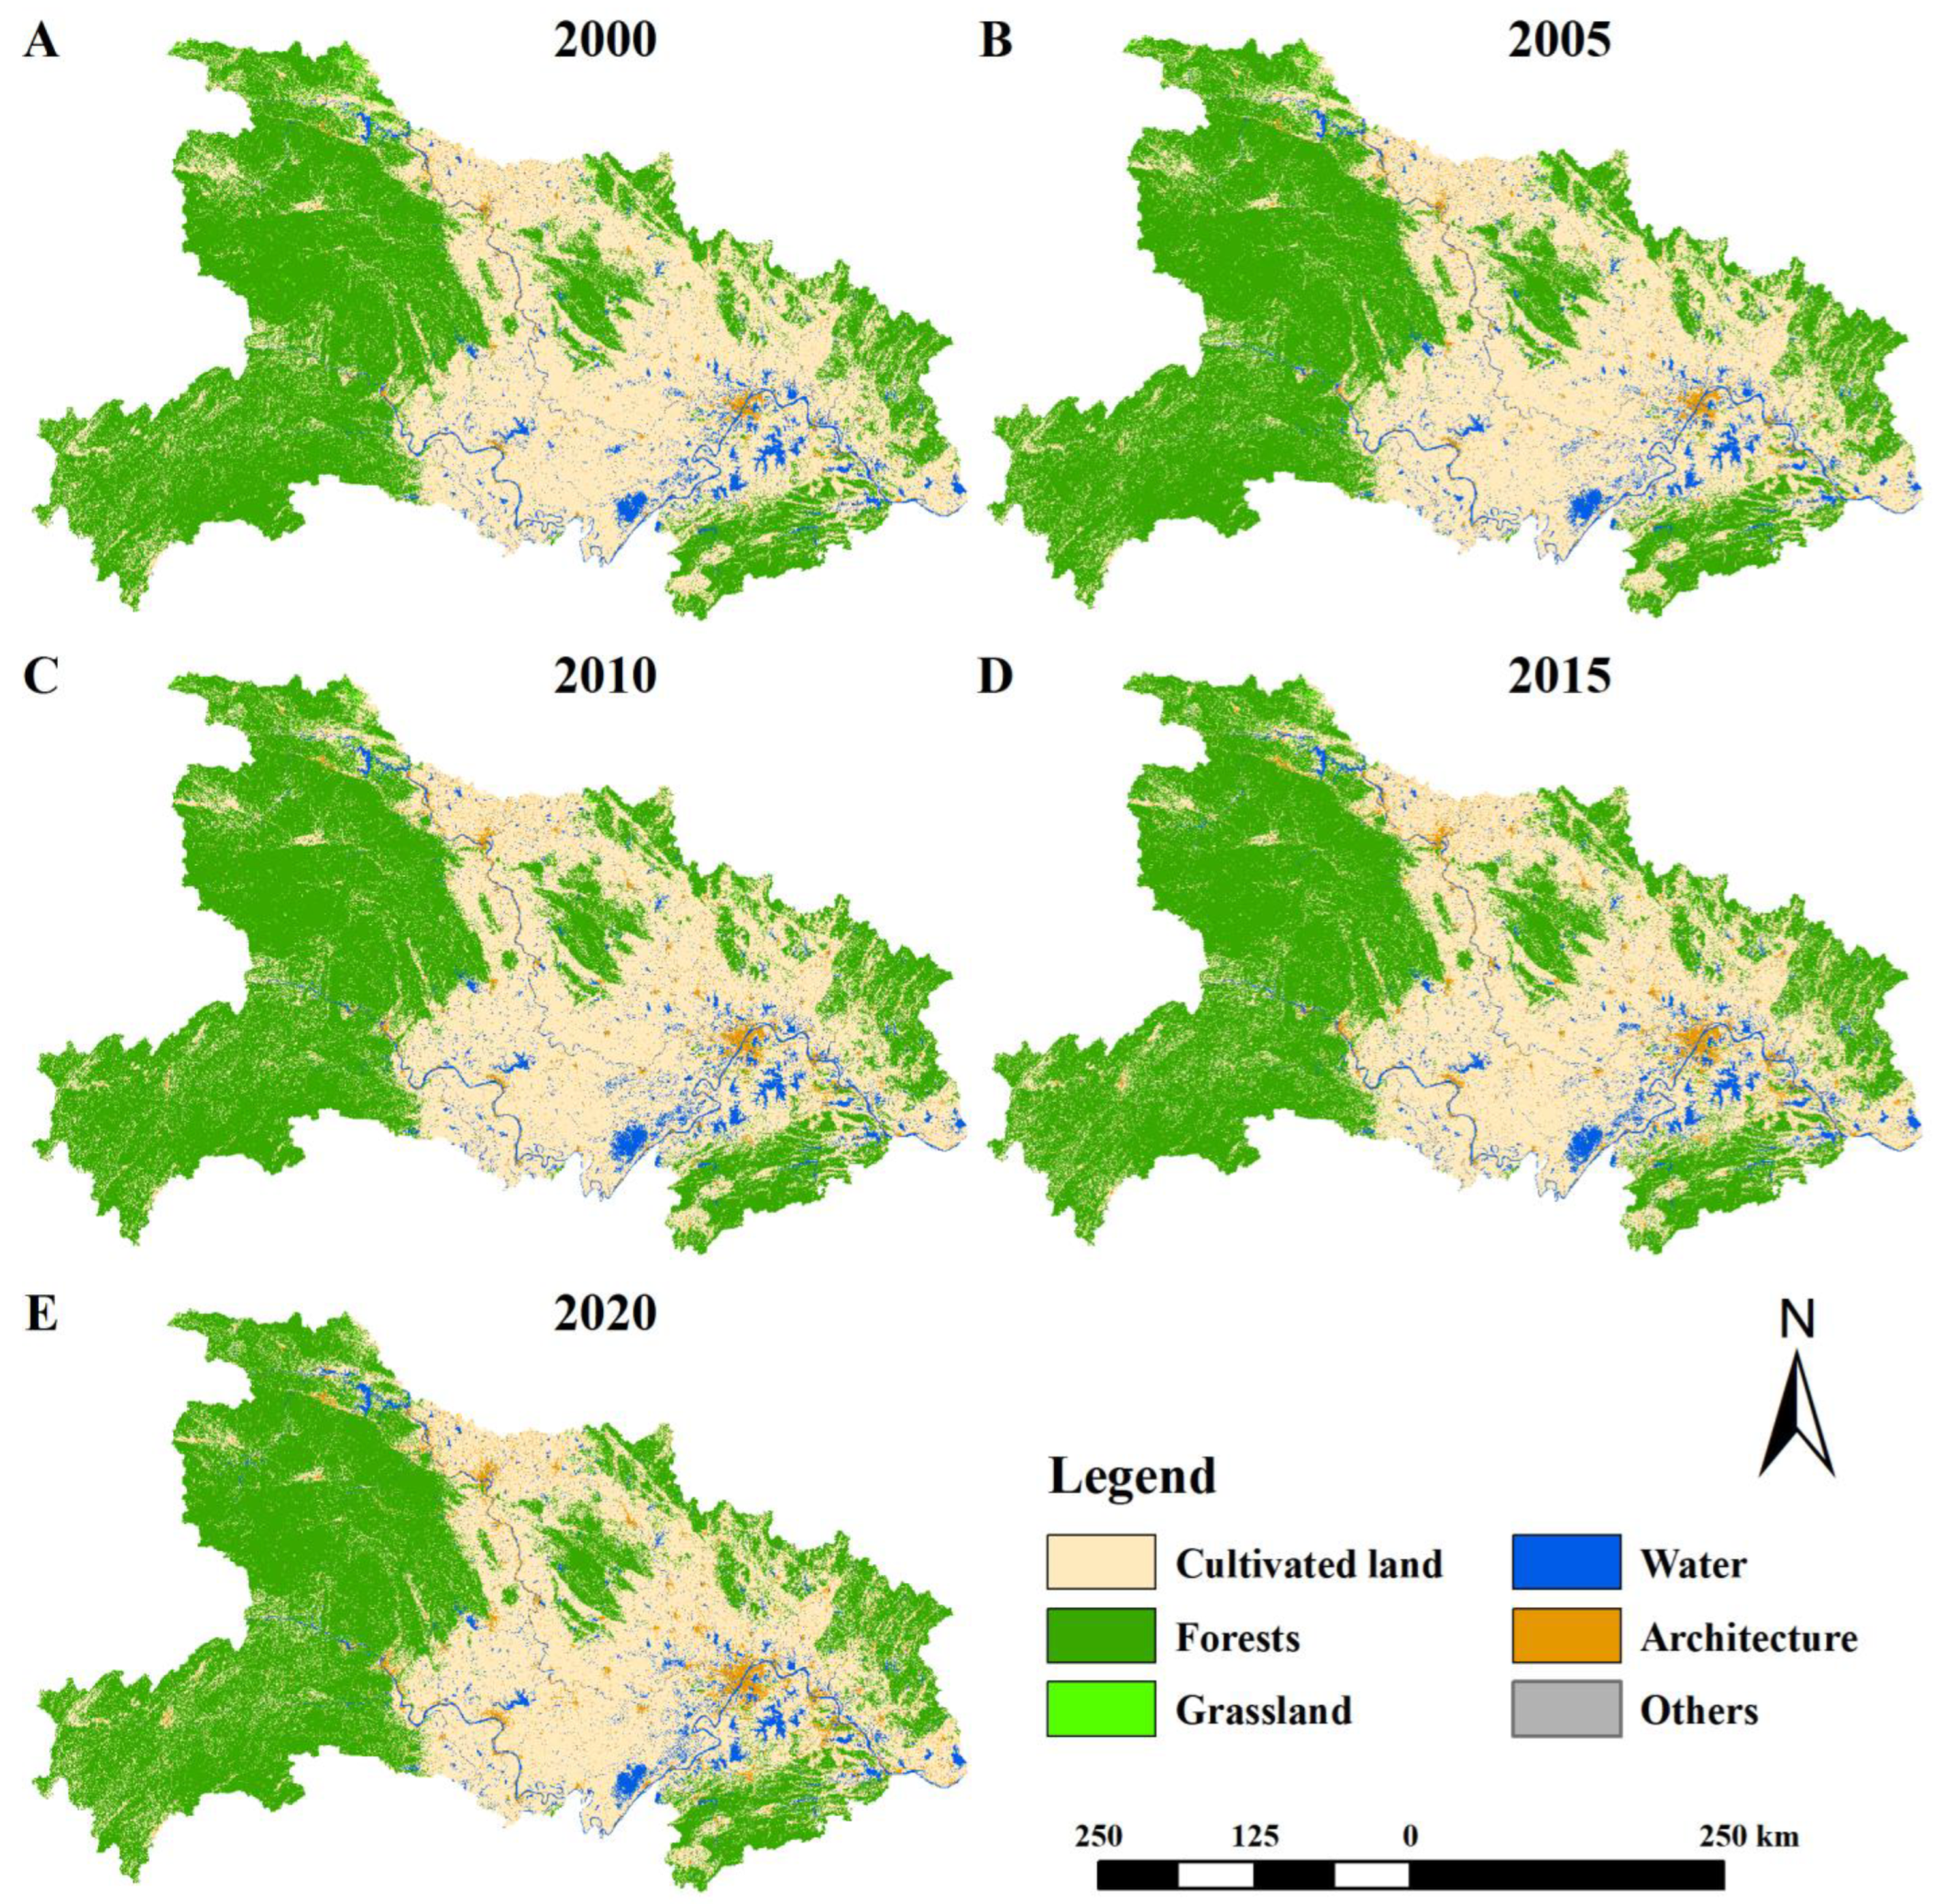
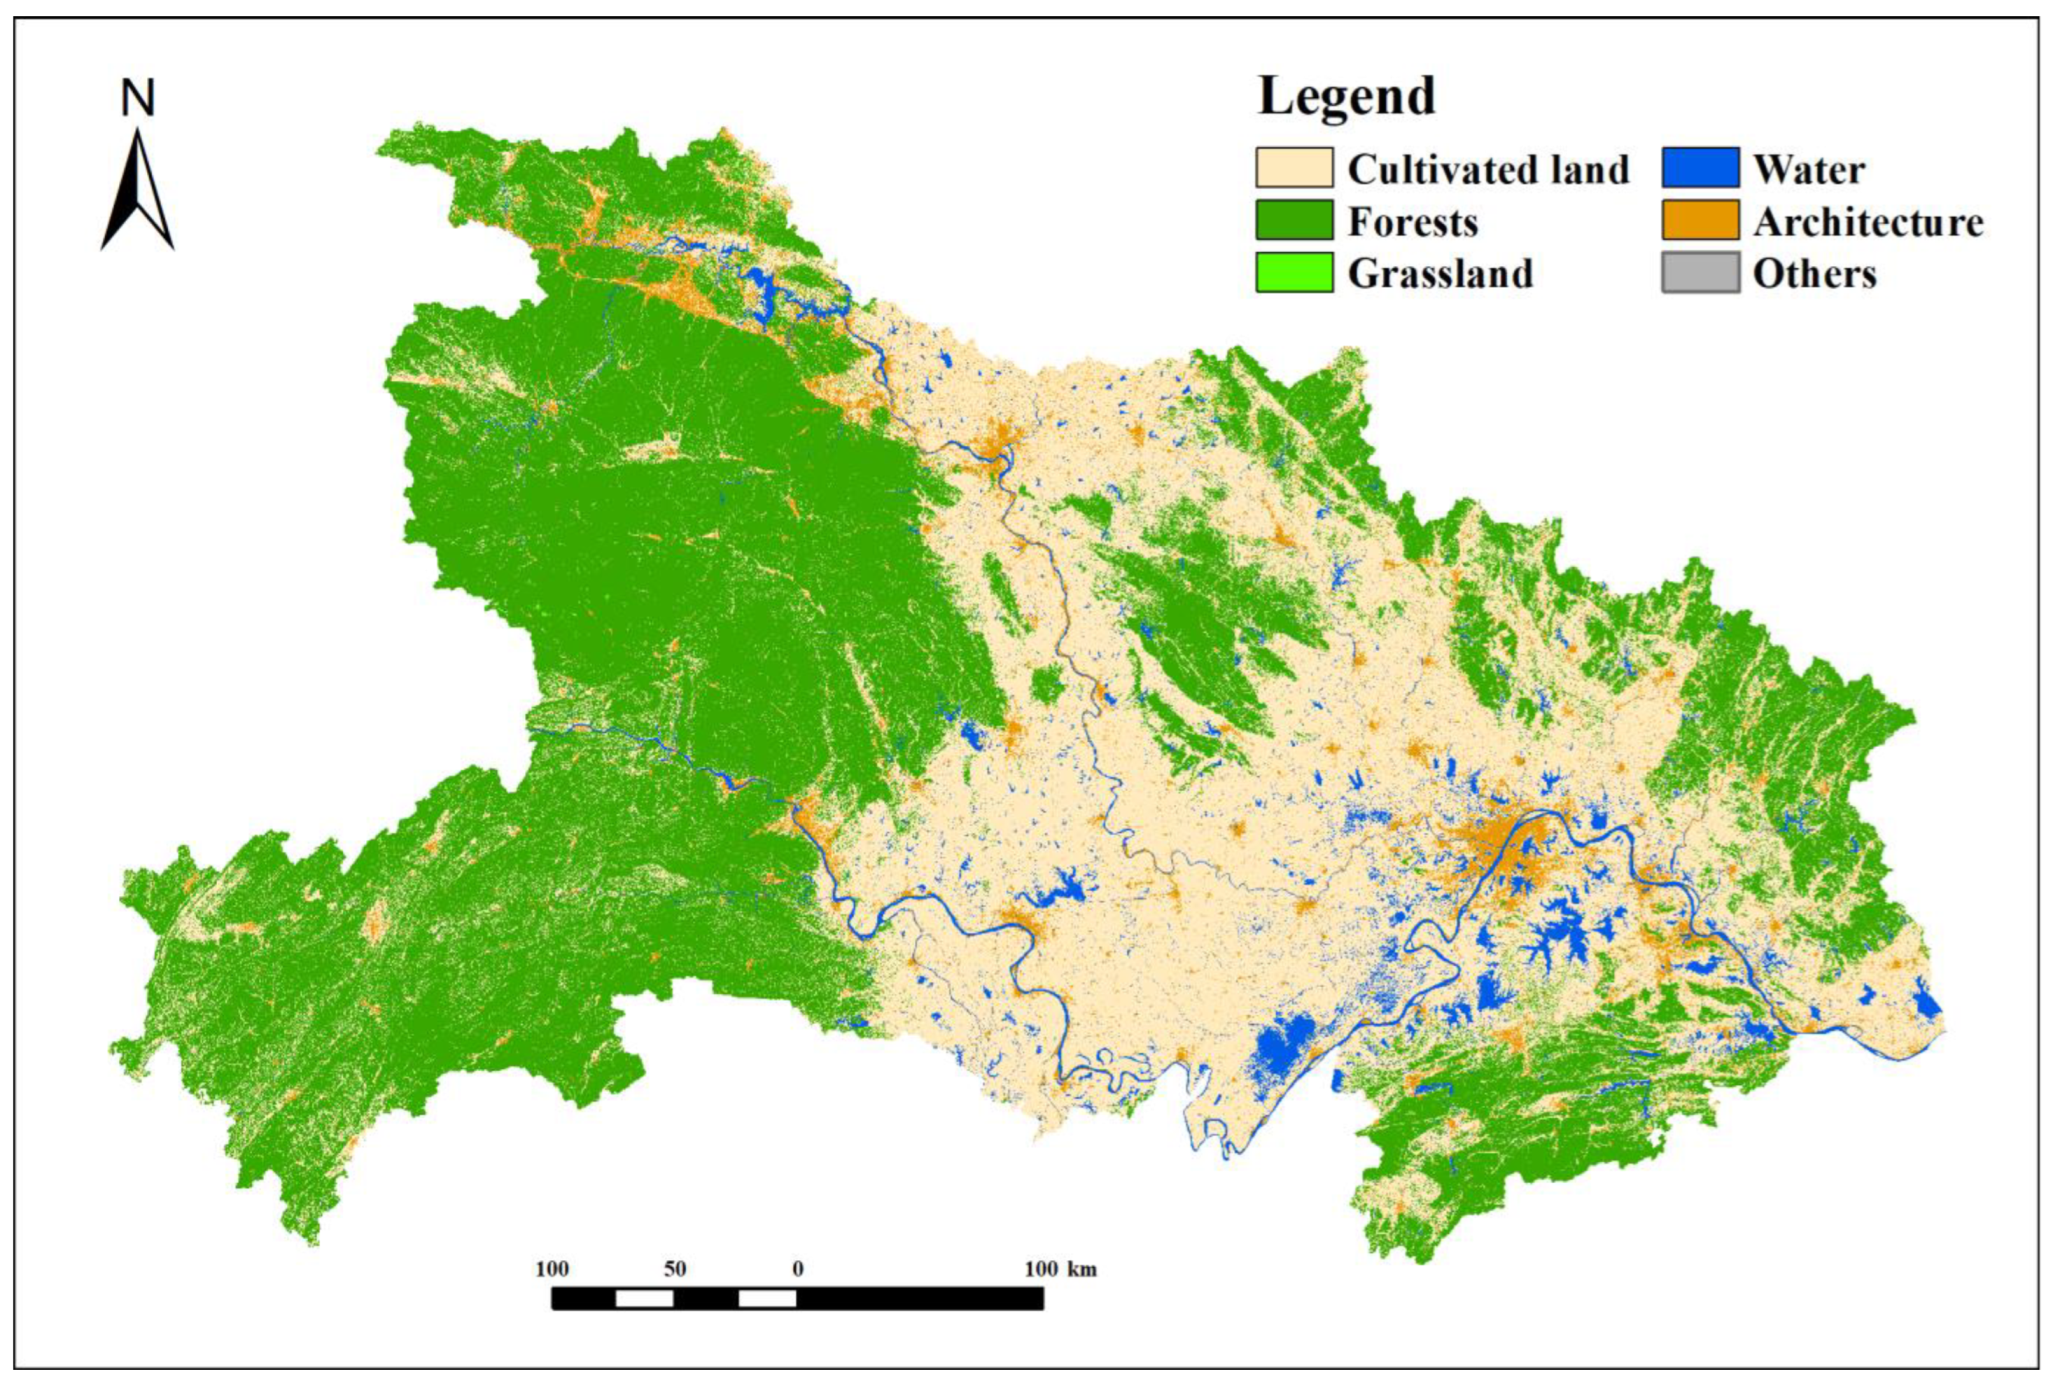
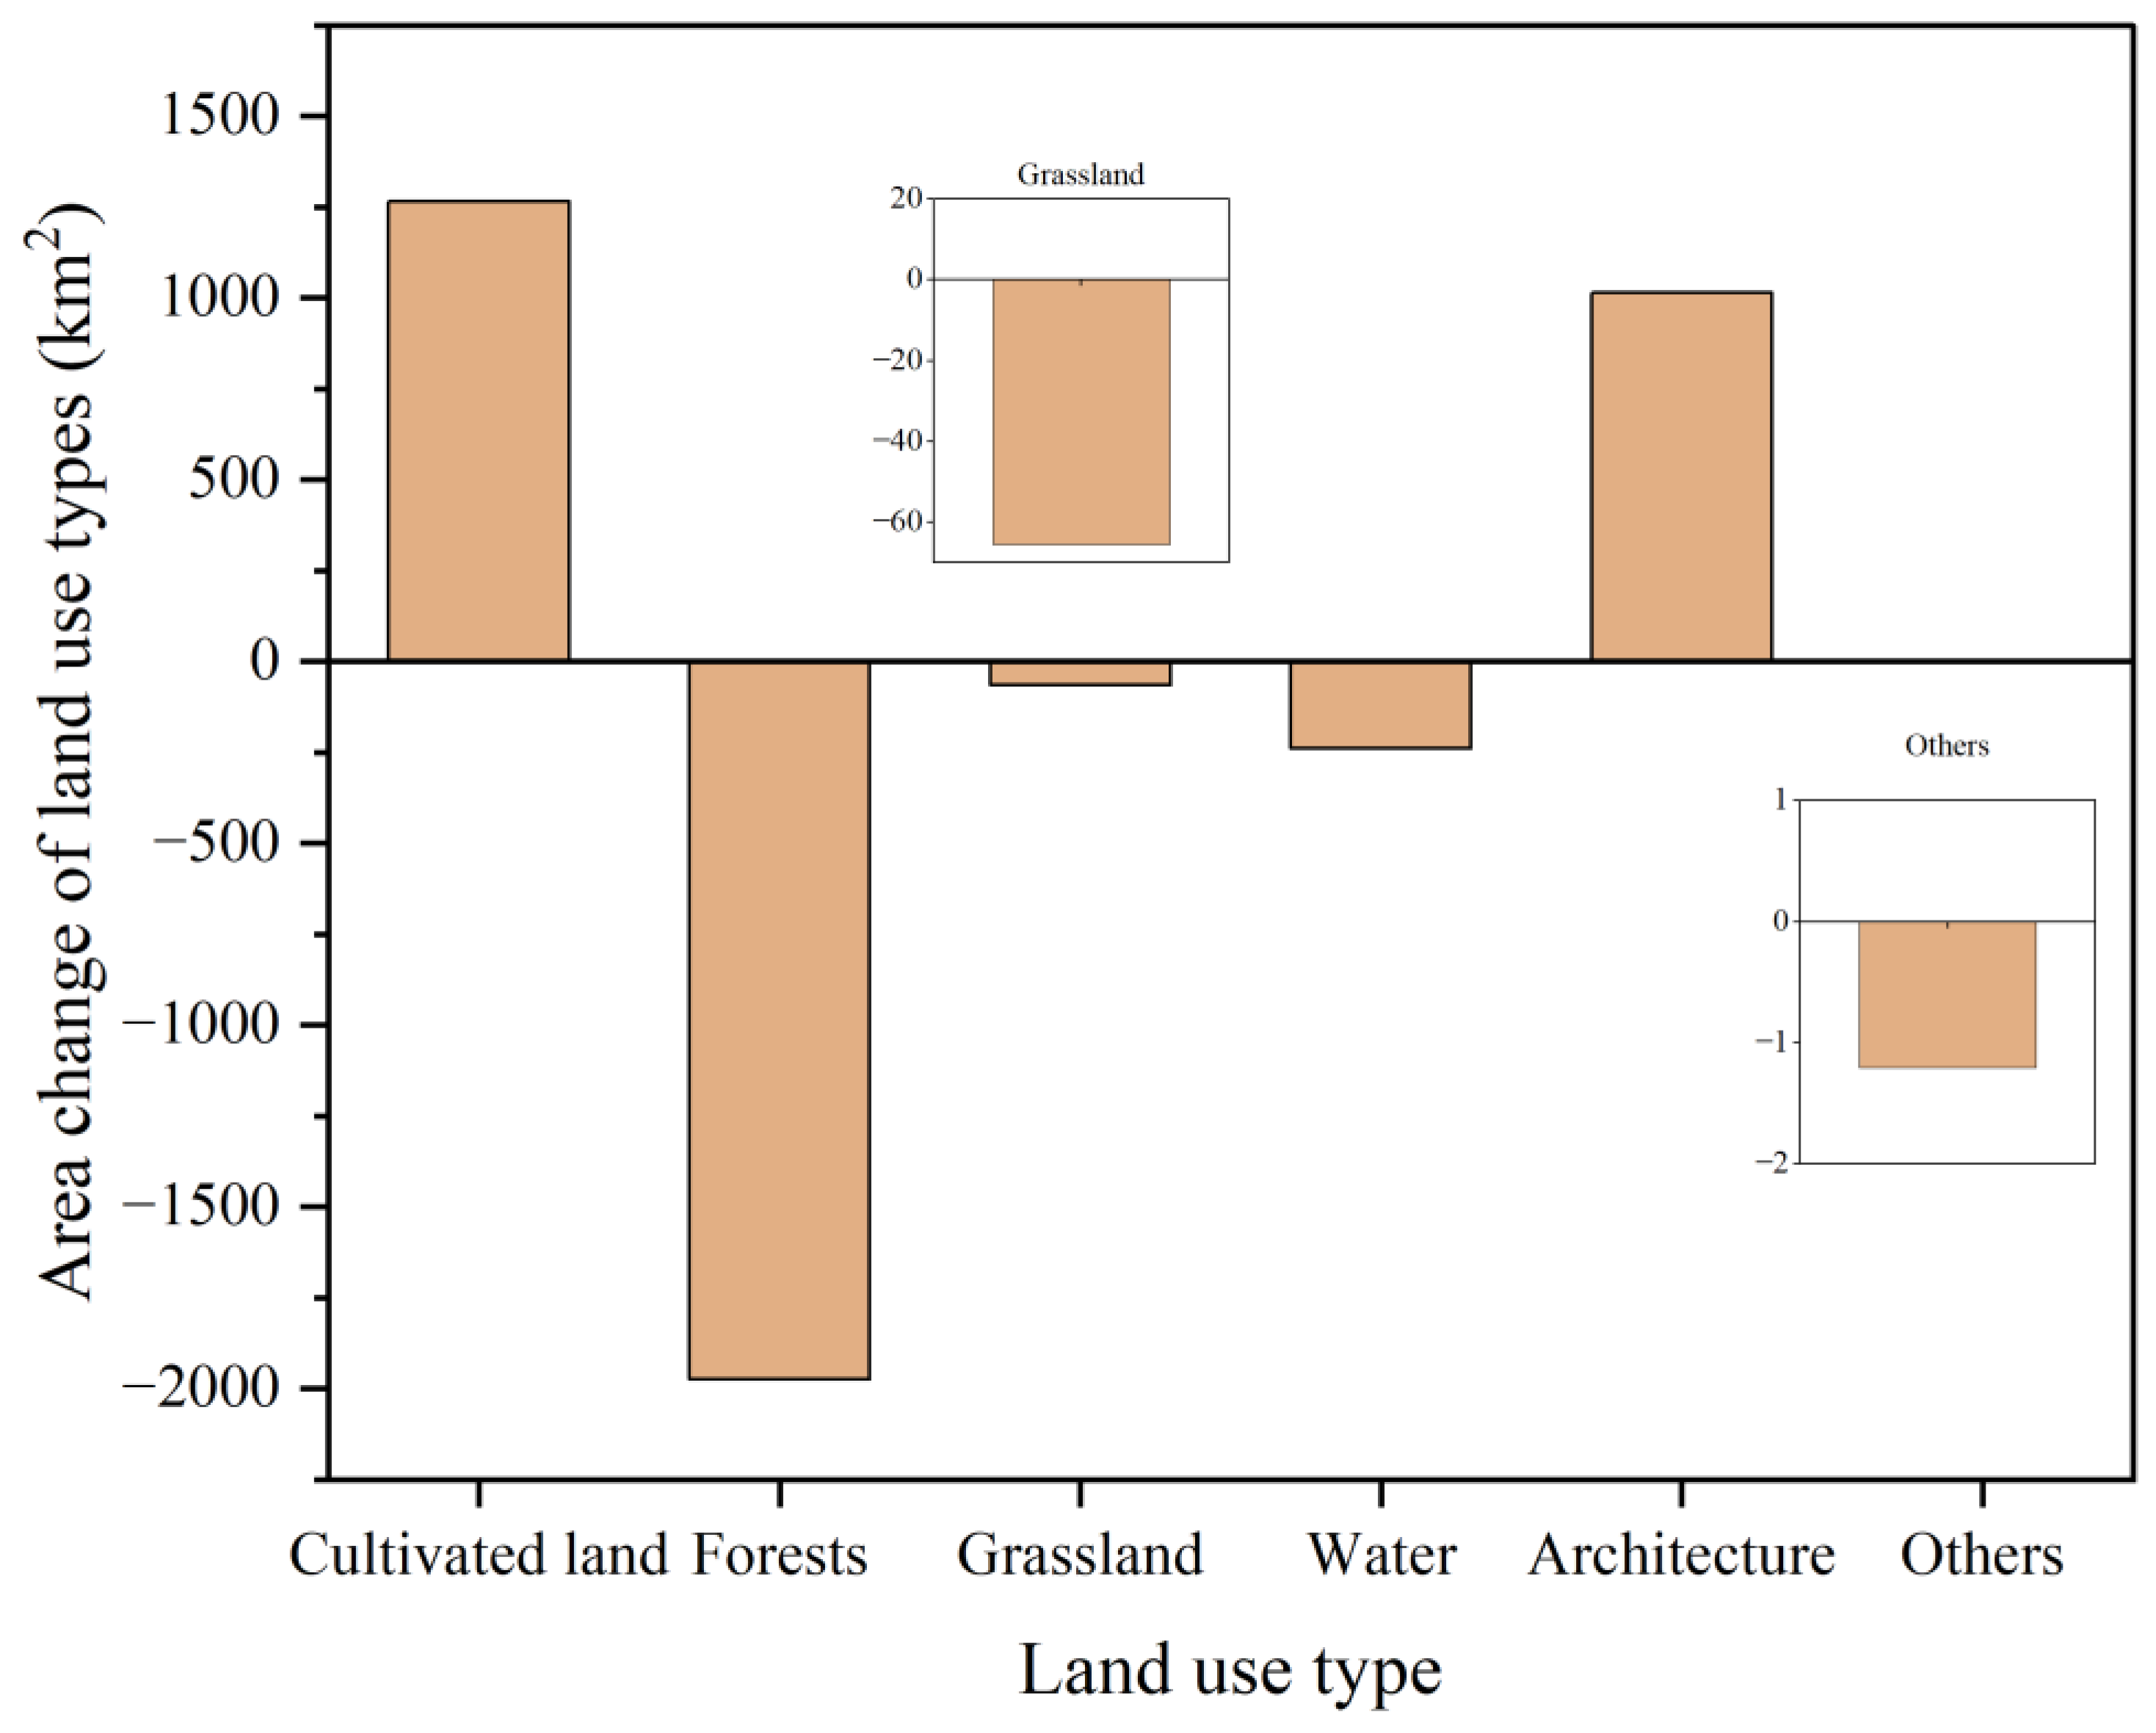
3.1. Land-Use Changes from 2000 to 2020

Figure 6 illustrates the land use dynamics in Hubei Province from 2000 to 2020. The most substantial changes in land use occurred between 2000 and 2005, with an average change rate of 17.04% for the 6 land use categories. The observed trend was a general decline in cultivated land, grassland, and other land types, accompanied by an increase in forests, water areas, and construction land areas. Other land and grassland experienced the most dramatic reduction, declining by 43.23% and 39.42%, respectively, while the construction area exhibited the most notable increase, by 12.62%. The period from 2000 to 2005 marked a window of urbanization in Hubei Province, with a rapid increase in urban development and population density and a gradual expansion of construction land. As a result, farmland at the edges of urban areas decreased. To mitigate large-scale human activities, such as deforestation and lake reclamation, Hubei Province implemented ecological restoration projects, such as the “Grain for Green” and “Lake for Land” programs, to recover some ecological land areas, such as forests and water bodies. However, these actions also led to a rapid decrease in the cultivated land area.
Figure 7 shows the area changes of different land use types in Hubei Province over various time periods. Among the land use categories, forestland has the largest area in Hubei Province. It is primarily situated in the elevated regions of western Hubei Province, with the proportion of forestland accounting for 47.32% in 2000 and 48.52% in 2020, exhibiting a slightly increasing trend. Farmland, the second-largest land use category, is mainly distributed in the level terrains of the Jianghan Plain. The proportion of farmland area in Hubei Province decreased from 46.31% in 2000 to 43.90% in 2020, indicating a declining trend. Grassland and other land use types occupy smaller areas, yet their changes are more substantial. Specifically, the grassland area in 2020 decreased by 80.83% in comparison with that in 2000, and other land use types decreased by 76.63%. Meanwhile, the construction land use type displayed the most considerable growth rate, with a 91.60% increase.
The reason for this trend is the presence of the Yangtze and Hanjiang Rivers that flow through Hubei Province, endowing the region with unique advantages for water, land, and air transportation that have facilitated its economic development. The urbanization process that has taken place along the river in Hubei Province has rapidly developed, leading to an increased population density and an expanded urban area, resulting in a substantial increase in the area of construction land. However, the expansion of construction land has encroached upon some farmland, which has been partially compensated for by using grassland and other land use types. Consequently, the reduction in the area of cultivated land has been relatively small, while the decrease in grassland and other land use types has been more substantial. While compensating for the loss of cultivated land with grassland may offset the total area loss of arable land, it fails to consider the quality of farmland and the unit yield, which are crucial for ensuring food security.
Overall, from 2000 to 2020, the area of construction land in Hubei Province continuously increased, investment in public infrastructure construction consistently grew, and urban construction was successful. Nonetheless, the area of ecological land, such as cultivated land, grassland, and water, has continuously decreased, and ecological environmental protection is critical.

3.2. Scenario 1: Natural Development

The natural development scenario refers to unconstrained land-use changes, wherein land-use changes are primarily influenced by the natural environment and social and economic development of the study area, without any constraints from land development policies. Figure 8 shows the simulation results of land use in 2035 in the natural development scenario. Figure 9 illustrates the changes in land use type areas from 2020 to 2035 in this scenario. Compared with 2020, the areas of cultivated land, forestland, grassland, and other land use types decrease to varying degrees in 2035, with declines of −1.54%, −0.96%, −31.05%, and −21.16%, respectively. The scale of water and construction land expands, with the latter showing a relatively large increase, reaching 8529.64 km2, which represents an increase of 33.51%. In other words, in the natural development scenario, construction land grows rapidly due to human activities to meet the needs of social and economic development, while cultivated land, forestland, grassland, and other land use types become the primary sources of land-use conversion.
In terms of spatial distribution, the expansion of construction land is based on the original distribution status and continues to extend along the riverbanks, mainly occurring in the northern (Shiyan), southern (Xiangyang), and central (Wuhan) regions, with a relatively concentrated distribution. The main reason for the expansion of urban areas is the continuous and rapid pace of overall urbanization. The results of this scenario indicate that the rapid development of social and economic conditions in Hubei Province in the future is expected to lead to the further expansion of construction land due to urbanization. However, in sharp contrast with this trend, there will be a substantial reduction in the areas of cultivated land and forestland. The phenomenon of urban development occupying arable land resources is severe, and the reduction in forestland and other ecological spaces due to urban expansion has exerted substantial pressure on regional ecological health.
In summary, in the scenario of inertia development, unconstrained development will cause a rapid expansion of regional construction land and a marked reduction in production and ecological lands such as cultivated land, forestland, and grassland. This will result in an inability to maintain the coordinated development of the regional ecology, society, and economy. If this trend is not restricted, food and ecological security will be at risk.

3.3. Scenario 2: Economic Priority

The economic priority scenario is primarily based on the natural development scenario and incorporates the actual situation in Hubei Province, which is undergoing a phase of rapid economic development, as well as regional land use development plans. In this scenario, the urban construction area is designated as a restricted conversion area, and the transfer probability of construction land to cultivated land, forestland, grassland, water bodies, and other land use types is reduced based on the land use transfer probability from 2000 to 2020. Figure 10 shows the simulation results of land use in 2035 in the economic priority scenario, while Figure 11 illustrates the changes in land use type areas from 2020 to 2035 in this scenario.
The trends and spatial differences in the changes in different land use types are generally similar to those in the natural development scenario. Cultivated land, forestland, grassland, water bodies, and other land use types decrease in area, while the area of construction land increases dramatically. However, the growth rate of construction land in the economic priority scenario is clearly higher than that in the natural development scenario, increasing from 6388.62 km2 in 2020 to 9164.25 km2 in 2035, with the growth rate increasing from 33.51% (in the natural development scenario) to 43.45%. Correspondingly, the trend of decreasing cultivated land is even more severe, decreasing from 81,610.09 km2 in 2020 to 79,825.25 km2 in 2035. In addition, all ecological land use types, including water bodies, show a decreasing trend, indicating that under the economic priority scenario, the expansion of urban areas leads to a reduction in the size of ecological land use types, resulting in a decline in regional ecological sustainability.

3.4. Scenario 3: Ecological Protection

In response to the Chinese government’s “no large-scale development, joint protection” strategy [80], this study establishes an ecological conservation scenario. To maintain regional ecological security, areas that have an important impact on the ecological environment, such as forests, grasslands, and water bodies, must be strictly protected, and large-scale development and utilization should be prohibited, as outlined in Hubei Province’s land development policy. Accordingly, the ecological conservation area is designated as a restricted conversion zone in this scenario. Figure 12 shows the simulated results for land use in 2035 in the ecological conservation scenario, and Figure 13 illustrates the changes in land use types from 2020 to 2035 in this scenario.
Compared with 2020, the forest and water areas in 2035 show a slight increase, with growth rates of 0.05% and 1.22%, respectively. However, the changes in land use types in this scenario still primarily focus on cultivated land and construction land. Cultivated land continues to decrease, with its area further compressed by −1.52% to only 80,367.79 km2. The expansion of construction land is evident, but its expansion rate is effectively controlled, decreasing from 33.51% in the natural development scenario and 43.45% in the economic priority scenario to 18.19%. This development satisfies the needs for urban economic and social growth to some extent. Nonetheless, given Hubei Province’s current land use efficiency, the total amount of construction land is insufficient, which is not conducive to economic development. Consequently, in the future, there will be higher requirements for intensive and efficient land use in Hubei Province.
Overall, to ensure ecological land use and meet the needs of socioeconomic activities, the primary direction of cultivated land conversion remains toward construction land. In other words, in the ecological conservation scenario, ecological land such as forests and water bodies exhibit a growth trend, prompting cultivated land to become the primary type of land conversion. The reduction in construction land encroachment on ecological land contributes to maintaining regional ecological security.

3.5. Scenario 4: Cultivated Land Protection

Cultivated land protection is essential for the effective conservation of farmland resources. To achieve this, a basic cultivated land protection zone has been established, and the cost of cultivated land conversion has been increased to restrict the transfer and change of cultivated land to other land types. Additionally, the occupation of cultivated land resources by economic and social development has been strictly controlled. The simulation results for land use in 2035 in the cultivated land protection scenario are shown in Figure 14, while Figure 15 shows the changes in land use types from 2020 to 2035 in this scenario.
According to this scenario, the cultivated land area is 82,876.46 km2, which makes it the largest and only scenario with a growth trend among the 4 scenarios, with an increase of 1.55% compared with 2020. The increased area of cultivated land is mainly concentrated in the central Jianghan Plain area, where the terrain is flat and the water system is developed. This trend is in line with the planning projects for high-standard farmland construction in central Hubei cities such as Xiangyang, Xiantao, and Ezhou. The results indicate that the strict implementation of basic cultivated land protection policies and the prohibition of construction land occupying basic cultivated land can effectively protect farmland and ensure food security.
The areas of forestland, grassland, and water have shown varying degrees of reduction, with forestland experiencing the most dramatic downward trend among the four scenarios, decreasing by 1974.86 km2 (2.19%). It is worth noting that the expansion rate of construction land clearly slows compared with the other scenarios. Its expansion direction is similar to the natural development scenario, mainly concentrated in the central region, but it still increased by 15.87% compared with 2020. This indicates that the speed of urban expansion will be somewhat controlled when implementing cultivated land protection.
In summary, this scenario has effectively slowed the rate of cultivated land conversion by implementing limiting factors in the basic cultivated land protection zone and increasing the conversion cost. This has ensured the quantity of cultivated land and implemented protection policies. However, despite these measures, the rapid economic development of various cities will inevitably lead to the expansion of construction land, which, coupled with the compression of forestland, grassland, and water, poses a threat to cultivated land protection and food security.

4. Limitations and Future Work

Despite the progress made in this study, it is essential to acknowledge its limitations. One of the main limitations of this study is the exclusive use of the classic FLUS model, as opposed to more advanced landscape-driven patch-based cellular automaton (LP-CA) and land use scenario dynamics (LUSD) models in recent years. These updated models incorporate more complex spatial and temporal dynamics and are known to produce more accurate and precise results in capturing the complexities of land-use changes in a given area [81,82,83,84]. Therefore, our study may have missed some crucial dynamics of the study area, resulting in less accurate results.
To address this limitation, we suggest that future research could incorporate the LP-CA and LUSD models to improve the accuracy of the findings. These models can capture the heterogeneity of the landscape and the interactions between land-use changes and driving factors, such as urban expansion and population growth [85,86,87]. Furthermore, these models allow for the integration of multiple factors, such as land use policies and economic development, into the simulation process [66,88]. By incorporating these models, future studies can provide more comprehensive and accurate insights into land-use change dynamics.
Another limitation of this study is the subjective nature of the scenario-setting methods. While different scenarios can indicate the likelihood of associated land-use changes, they do not necessarily reflect the actual future land-use patterns. To overcome this limitation, we plan to select additional driving factors and employ multiple scenario-setting methods to conduct multifactorial and multiscenario land-use change simulations. This approach will provide a more comprehensive understanding of the potential land-use changes in different scenarios and help decision-makers to formulate more effective land-use policies.
Overall, this study has significant contributions to the field of land-use change modeling. However, acknowledging and addressing its limitations is crucial to ensure the accuracy and reliability of the findings. By incorporating advanced models and employing multiple scenario-setting methods, future studies can provide more comprehensive and accurate insights into land-use change dynamics and help to facilitate sustainable land-use planning and management.

5. Conclusions

The Markov-FLUS model predicts future land-use quantity changes using system dynamics, relying on past land-use quantity changes [61,68]. This study employed the Markov-FLUS model to simulate potential land-use changes in Hubei Province in various scenarios for 2035. This study aimed to explore the potential outcomes in different scenarios rather than evaluating the effectiveness of existing policies. The simulation results indicate large variations in land-use patterns across the different scenarios tested.
The findings suggest that cultivated land is the predominant land use type in Hubei Province, occupying 43.90% of the total area. Nevertheless, cultivated land decreased by 1260.50 km2 (−1.54%), 1784.83 km2 (−2.19%), and 1242.30 km2 (−1.52%) in the natural development, economic priority, and ecological protection scenarios, respectively, while it increased by 1266.37 km2 (1.55%) in the cultivated land protection scenario. In the ecological protection scenario, forestland was effectively safeguarded, increasing by 44.17 km2 (0.05%), while it decreased in the other 3 scenarios. Grassland and other land uses showed a decreasing trend across all four scenarios. The expansion of construction land was the most dramatic, exhibiting outward and infill expansion. The area of construction land increased in all scenarios, but the cultivated land protection (15.87%) and ecological protection (18.19%) scenarios had much smaller increases than the natural development (33.51%) and economic priority (43.45%) scenarios.

Author Contributions

Conceptualization, K.Z. and Y.C.; methodology, K.Z. and Y.C.; software, K.Z. and Y.C.; validation, K.Z., Y.C., W.Z. and Q.Z.; formal analysis, K.Z., Y.E.A., H.M., M.K., K.C. and L.D.D.; investigation, K.Z., Y.C., W.Z., Q.Z., Y.E.A., H.M., M.K., K.C. and L.D.D.; resources, K.Z. and L.D.D.; data curation, K.Z. and Y.C.; writing—original draft preparation, K.Z.; writing—review and editing, K.Z., Y.C. and L.D.D.; visualization, K.Z., Y.C., W.Z., Q.Z., Y.E.A., H.M., M.K., K.C. and L.D.D.; supervision, K.Z. and L.D.D.; project administration, K.Z. and L.D.D.; funding acquisition, K.Z. and L.D.D. All authors have read and agreed to the published version of the manuscript.

Funding

This research received no external funding.

Data Availability Statement

The data developed in this study will be made available on request to the corresponding authors.

Acknowledgments

This research was supported by the Hungarian University of Agriculture and Life Sciences and the Doctoral School of Economic and Regional Sciences (MATE), Hungary.

Conflicts of Interest

The authors declare no conflict of interest. The funders had no role in the design of this study; in the collection, analysis, or interpretation of the data; in the writing of the manuscript; or in the decision to publish the results.

References

  1. Lin, J.; He, P.; Yang, L.; He, X.; Lu, S.; Liu, D. Predicting Future Urban Waterlogging-Prone Areas by Coupling the Maximum Entropy and FLUS Model. Sustain. Cities Soc. 2022, 80, 103812. [Google Scholar] [CrossRef]
  2. Yang, K.; Hou, H.; Li, Y.; Chen, Y.; Wang, L.; Wang, P.; Hu, T. Future Urban Waterlogging Simulation Based on LULC Forecast Model: A Case Study in Haining City, China. Sustain. Cities Soc. 2022, 87, 104167. [Google Scholar] [CrossRef]
  3. Turner, B.L.; Skole, D.; Sanderson, S.; Fischer, G.; Fresco, L.; Leemans, R. Land-Use and Land-Cover Change: Science/Research Plan. Scanning Electron Microsc. 1995. Available online: https://asu.pure.elsevier.com/en/publications/land-use-and-land-cover-change-scienceresearch-plan-2 (accessed on 21 November 2022).
  4. Verburg, P.H.; Alexander, P.; Evans, T.; Magliocca, N.R.; Malek, Z.; Rounsevell, M.D.; van Vliet, J. Beyond Land Cover Change: Towards a New Generation of Land Use Models. Curr. Opin. Environ. Sustain. 2019, 38, 77–85. [Google Scholar] [CrossRef]
  5. Wang, J.; Bretz, M.; Dewan, M.A.A.; Delavar, M.A. Machine Learning in Modelling Land-Use and Land Cover-Change (LULCC): Current Status, Challenges and Prospects. Sci. Total Environ. 2022, 822, 153559. [Google Scholar] [CrossRef] [PubMed]
  6. Long, H.; Qu, Y. Land Use Transitions and Land Management: A Mutual Feedback Perspective. Land Use Policy 2018, 74, 111–120. [Google Scholar] [CrossRef]
  7. Wang, J.; Lin, Y.; Glendinning, A.; Xu, Y. Land-Use Changes and Land Policies Evolution in China’s Urbanization Processes. Land Use Policy 2018, 75, 375–387. [Google Scholar] [CrossRef]
  8. Carranza-García, M.; García-Gutiérrez, J.; Riquelme, J.C. A Framework for Evaluating Land Use and Land Cover Classification Using Convolutional Neural Networks. Remote Sens. 2019, 11, 274. [Google Scholar] [CrossRef] [Green Version]
  9. Veldkamp, A.; Lambin, E.F. Predicting Land-Use Change. Agric. Ecosyst. Environ. 2001, 85, 1–6. [Google Scholar] [CrossRef]
  10. Noszczyk, T. A Review of Approaches to Land Use Changes Modeling. Hum. Ecol. Risk Assess. Int. J. 2019, 25, 1377–1405. [Google Scholar] [CrossRef]
  11. Chang, Y.; Hou, K.; Li, X.; Zhang, Y.; Chen, P. Review of Land Use and Land Cover Change Research Progress. IOP Conf. Ser. Earth Environ. Sci. 2018, 113, 012087. [Google Scholar] [CrossRef]
  12. Ren, Y.; Lü, Y.; Comber, A.; Fu, B.; Harris, P.; Wu, L. Spatially Explicit Simulation of Land Use/Land Cover Changes: Current Coverage and Future Prospects. Earth-Sci. Rev. 2019, 190, 398–415. [Google Scholar] [CrossRef]
  13. Mor, B.; Garhwal, S.; Kumar, A. A Systematic Review of Hidden Markov Models and Their Applications. Arch. Computat. Methods Eng. 2021, 28, 1429–1448. [Google Scholar] [CrossRef]
  14. Yang, T.; Liu, J.; Chen, Q. Assessment of Plain River Ecosystem Function Based on Improved Gray System Model and Analytic Hierarchy Process for the Fuyang River, Haihe River Basin, China. Ecol. Model. 2013, 268, 37–47. [Google Scholar] [CrossRef]
  15. Chen, Z.; Huang, M.; Zhu, D.; Altan, O. Integrating Remote Sensing and a Markov-FLUS Model to Simulate Future Land Use Changes in Hokkaido, Japan. Remote Sens. 2021, 13, 2621. [Google Scholar] [CrossRef]
  16. Sedarati, P.; Santos, S.; Pintassilgo, P. System Dynamics in Tourism Planning and Development. Tour. Plan. Dev. 2019, 16, 256–280. [Google Scholar] [CrossRef]
  17. Gilpin, W. Cellular Automata as Convolutional Neural Networks. Phys. Rev. E 2019, 100, 032402. [Google Scholar] [CrossRef] [PubMed] [Green Version]
  18. Dorri, A.; Kanhere, S.S.; Jurdak, R. Multi-Agent Systems: A Survey. IEEE Access 2018, 6, 28573–28593. [Google Scholar] [CrossRef]
  19. Gao, Z.; Gao, W.; Jie, Z. The Study of Urban Sprawl and Simulation Based on Remote Sensing and CLUS Model. In Proceedings of the Remote Sensing and Modeling of Ecosystems for Sustainability IV, San Diego, CA, USA, 22 October 2007; SPIE: Bellingham, DC, USA; Volume 6679, pp. 398–403. [Google Scholar]
  20. Meyfroidt, P.; Lambin, E.F.; Erb, K.-H.; Hertel, T.W. Globalization of Land Use: Distant Drivers of Land Change and Geographic Displacement of Land Use. Curr. Opin. Environ. Sustain. 2013, 5, 438–444. [Google Scholar] [CrossRef]
  21. Yeh, A.G.-O.; Li, X. A Constrained CA Model for the Simulation and Planning of Sustainable Urban Forms by Using GIS. Environ. Plan. B Plan. Des. 2001, 28, 733–753. [Google Scholar] [CrossRef] [Green Version]
  22. Sang, L.; Zhang, C.; Yang, J.; Zhu, D.; Yun, W. Simulation of Land Use Spatial Pattern of Towns and Villages Based on CA–Markov Model. Math. Comput. Model. 2011, 54, 938–943. [Google Scholar] [CrossRef]
  23. Liang, X.; Liu, X.; Li, X.; Chen, Y.; Tian, H.; Yao, Y. Delineating Multi-Scenario Urban Growth Boundaries with a CA-Based FLUS Model and Morphological Method. Landsc. Urban Plan. 2018, 177, 47–63. [Google Scholar] [CrossRef]
  24. Clarke, K.C. Mapping and Modelling Land Use Change: An Application of the SLEUTH Model. In Landscape Analysis and Visualisation: Spatial Models for Natural Resource Management and Planning; Pettit, C., Cartwright, W., Bishop, I., Lowell, K., Pullar, D., Duncan, D., Eds.; Lecture Notes in Geoinformation and Cartography; Springer: Berlin/Heidelberg, Germany, 2008; pp. 353–366. ISBN 978-3-540-69168-6. [Google Scholar]
  25. Feng, H.-H.; Liu, H.-P.; Lü, Y. Scenario Prediction and Analysis of Urban Growth Using SLEUTH Model. Pedosphere 2012, 22, 206–216. [Google Scholar] [CrossRef]
  26. Aydın, A.; Eker, R. Future Land Use/Land Cover Scenarios Considering Natural Hazards Using Dyna-CLUE in Uzungöl Nature Conservation Area (Trabzon-NE Türkiye). Nat. Hazards 2022, 114, 2683–2707. [Google Scholar] [CrossRef]
  27. Gaur, S.; Singh, R. A Comprehensive Review on Land Use/Land Cover (LULC) Change Modeling for Urban Development: Current Status and Future Prospects. Sustainability 2023, 15, 903. [Google Scholar] [CrossRef]
  28. Gomes, E.; Inácio, M.; Bogdzevič, K.; Kalinauskas, M.; Karnauskaitė, D.; Pereira, P. Future Land-Use Changes and Its Impacts on Terrestrial Ecosystem Services: A Review. Sci. Total Environ. 2021, 781, 146716. [Google Scholar] [CrossRef]
  29. Rahnama, M.R. Forecasting Land-Use Changes in Mashhad Metropolitan Area Using Cellular Automata and Markov Chain Model for 2016–2030. Sustain. Cities Soc. 2021, 64, 102548. [Google Scholar] [CrossRef]
  30. Khwarahm, N.R.; Qader, S.; Ararat, K.; Fadhil Al-Quraishi, A.M. Predicting and Mapping Land Cover/Land Use Changes in Erbil /Iraq Using CA-Markov Synergy Model. Earth Sci. Inform. 2021, 14, 393–406. [Google Scholar] [CrossRef]
  31. Cai, Y.; Zhang, F.; Duan, P.; Yung Jim, C.; Weng Chan, N.; Shi, J.; Liu, C.; Wang, J.; Bahtebay, J.; Ma, X. Vegetation Cover Changes in China Induced by Ecological Restoration-Protection Projects and Land-Use Changes from 2000 to 2020. CATENA 2022, 217, 106530. [Google Scholar] [CrossRef]
  32. Peng, K.; Jiang, W.; Ling, Z.; Hou, P.; Deng, Y. Evaluating the Potential Impacts of Land Use Changes on Ecosystem Service Value under Multiple Scenarios in Support of SDG Reporting: A Case Study of the Wuhan Urban Agglomeration. J. Clean. Prod. 2021, 307, 127321. [Google Scholar] [CrossRef]
  33. Xu, Q.; Guo, P.; Jin, M.; Qi, J. Multi-Scenario Landscape Ecological Risk Assessment Based on Markov–FLUS Composite Model. Geomat. Nat. Hazards Risk 2021, 12, 1449–1466. [Google Scholar] [CrossRef]
  34. Lin, Z.; Peng, S. Comparison of Multimodel Simulations of Land Use and Land Cover Change Considering Integrated Constraints—A Case Study of the Fuxian Lake Basin. Ecol. Indic. 2022, 142, 109254. [Google Scholar] [CrossRef]
  35. Liu, X.; Liang, X.; Li, X.; Xu, X.; Ou, J.; Chen, Y.; Li, S.; Wang, S.; Pei, F. A Future Land Use Simulation Model (FLUS) for Simulating Multiple Land Use Scenarios by Coupling Human and Natural Effects. Landsc. Urban Plan. 2017, 168, 94–116. [Google Scholar] [CrossRef]
  36. VERBURG, P.H.; SOEPBOER, W.; VELDKAMP, A.; LIMPIADA, R.; ESPALDON, V.; MASTURA, S.S.A. Modeling the Spatial Dynamics of Regional Land Use: The CLUE-S Model. Environ. Manag. 2002, 30, 391–405. [Google Scholar] [CrossRef]
  37. Ma, B.; Wang, X. What Is the Future of Ecological Space in Wuhan Metropolitan Area? A Multi-Scenario Simulation Based on Markov-FLUS. Ecol. Indic. 2022, 141, 109124. [Google Scholar] [CrossRef]
  38. Şenik, B.; Kaya, H.S. Landscape Sensitivity-Based Scenario Analysis Using Flus Model: A Case of Asarsuyu Watershed. Landscape Ecol. Eng. 2022, 18, 139–156. [Google Scholar] [CrossRef]
  39. Shao, Y.; Xiao, Y.; Sang, W. Land Use Trade-Offs and Synergies Based on Temporal and Spatial Patterns of Ecosystem Services in South China. Ecol. Indic. 2022, 143, 109335. [Google Scholar] [CrossRef]
  40. Cheng, L.; Brown, G.; Liu, Y.; Searle, G. An Evaluation of Contemporary China’s Land Use Policy–The Link Policy: A Case Study from Ezhou, Hubei Province. Land Use Policy 2020, 91, 104423. [Google Scholar] [CrossRef]
  41. Zhu, K.; Zhang, Y.; Wang, M.; Liu, H. The Ecological Compensation Mechanism in a cross-Regional Water Diversion Project Using Evolutionary Game Theory: The Case of the Hanjiang River Basin, China. Water 2022, 14, 1151. [Google Scholar] [CrossRef]
  42. Wang, Y.; Zhu, K.; Xiong, X.; Yin, J.; Yan, H.; Zhang, Y.; Liu, H. Assessment of the Ecological Compensation Standards for cross-Basin Water Diversion Projects from the Perspective of Main Headwater and Receiver Areas. Int. J. Environ. Res. Public Health 2023, 20, 717. [Google Scholar] [CrossRef] [PubMed]
  43. Zhou, Q.; Zhu, K.; Kang, L.; Dávid, L.D. Tea Culture Tourism Perception: A Study on the Harmony of Importance and Performance. Sustainability 2023, 15, 2838. [Google Scholar] [CrossRef]
  44. Jin, G.; Chen, K.; Liao, T.; Zhang, L.; Najmuddin, O. Measuring Ecosystem Services Based on Government Intentions for Future Land Use in Hubei Province: Implications for Sustainable Landscape Management. Landscape Ecol. 2021, 36, 2025–2042. [Google Scholar] [CrossRef]
  45. Zhu, K.; Liu, Q.; Xiong, X.; Zhang, Y.; Wang, M.; Liu, H. Carbon Footprint and Embodied Carbon Emission Transfer Network Obtained Using the Multi–Regional Input–Output Model and Social Network Analysis Method: A Case of the Hanjiang River Basin, China. Front. Ecol. Evol. 2022, 10, 733. [Google Scholar] [CrossRef]
  46. Zhu, K.; Zhou, Q.; Cheng, Y.; Zhang, Y.; Li, T.; Yan, X.; Alimov, A.; Farmanov, E.; Dávid, L.D. Regional Sustainability: Pressures and Responses of Tourism Economy and Ecological Environment in the Yangtze River Basin, China. Front. Ecol. Evol. 2023, 11, 168. [Google Scholar] [CrossRef]
  47. Yang, J.; Huang, X. The 30 m Annual Land Cover Dataset and Its Dynamics in China from 1990 to 2019. Earth Syst. Sci. Data 2021, 13, 3907–3925. [Google Scholar] [CrossRef]
  48. Huang, X.; Yang, J.; Wang, W.; Liu, Z. Mapping 10 m Global Impervious Surface Area (GISA-10m) Using Multi-Source Geospatial Data. Earth Syst. Sci. Data 2022, 14, 3649–3672. [Google Scholar] [CrossRef]
  49. Xu, Y.; Hu, X.; Gong, J.; Huang, X.; Li, J. Deep Learning Training with Unbalance Sample Distribution for Remote Sensing Image Segmentation. In Proceedings of the International Archives of the Photogrammetry, Remote Sensing and Spatial Information Sciences, Gottingen, Germany, 30 May 2022; Copernicus GmbH: Gottingen, Germany; Volume XLIII-B3-2022, pp. 223–228. [Google Scholar]
  50. Zhang, C.; Dong, J.; Ge, Q. Quantifying the Accuracies of Six 30-m Cropland Datasets over China: A Comparison and Evaluation Analysis. Comput. Electron. Agric. 2022, 197, 106946. [Google Scholar] [CrossRef]
  51. Zhao, Z.; Guan, D.; Du, C. Urban Growth Boundaries Delineation Coupling Ecological Constraints with a Growth-Driven Model for the Main Urban Area of Chongqing, China. GeoJournal 2020, 85, 1115–1131. [Google Scholar] [CrossRef]
  52. Xiang, S.; Wang, Y.; Deng, H.; Yang, C.; Wang, Z.; Gao, M. Response and Multi-Scenario Prediction of Carbon Storage to Land Use/Cover Change in the Main Urban Area of Chongqing, China. Ecol. Indic. 2022, 142, 109205. [Google Scholar] [CrossRef]
  53. Lin, W.; Sun, Y.; Nijhuis, S.; Wang, Z. Scenario-Based Flood Risk Assessment for Urbanizing Deltas Using Future Land-Use Simulation (FLUS): Guangzhou Metropolitan Area as a Case Study. Sci. Total Environ. 2020, 739, 139899. [Google Scholar] [CrossRef]
  54. Wang, Q.; Guan, Q.; Lin, J.; Luo, H.; Tan, Z.; Ma, Y. Simulating Land Use/Land Cover Change in an Arid Region with the Coupling Models. Ecol. Indic. 2021, 122, 107231. [Google Scholar] [CrossRef]
  55. Wang, R.; Murayama, Y.; Morimoto, T. Scenario Simulation Studies of Urban Development Using Remote Sensing and GIS: Review. Remote Sens. Appl. Soc. Environ. 2021, 22, 100474. [Google Scholar] [CrossRef]
  56. Tan, Z.; Guan, Q.; Lin, J.; Yang, L.; Luo, H.; Ma, Y.; Tian, J.; Wang, Q.; Wang, N. The Response and Simulation of Ecosystem Services Value to Land Use/Land Cover in an Oasis, Northwest China. Ecol. Indic. 2020, 118, 106711. [Google Scholar] [CrossRef]
  57. Zhao, J.; Shao, Z.; Xia, C.; Fang, K.; Chen, R.; Zhou, J. Ecosystem Services Assessment Based on Land Use Simulation: A Case Study in the Heihe River Basin, China. Ecol. Indic. 2022, 143, 109402. [Google Scholar] [CrossRef]
  58. Jiang, X.; Zhai, S.; Liu, H.; Chen, J.; Zhu, Y.; Wang, Z. Multi-Scenario Simulation of Production-Living-Ecological Space and Ecological Effects Based on Shared Socioeconomic Pathways in Zhengzhou, China. Ecol. Indic. 2022, 137, 108750. [Google Scholar] [CrossRef]
  59. Chen, B.; Xu, B.; Gong, P. Mapping Essential Urban Land Use Categories (EULUC) Using Geospatial Big Data: Progress, Challenges, and Opportunities. Big Earth Data 2021, 5, 410–441. [Google Scholar] [CrossRef]
  60. McClintock, B.T.; Langrock, R.; Gimenez, O.; Cam, E.; Borchers, D.L.; Glennie, R.; Patterson, T.A. Uncovering Ecological State Dynamics with Hidden Markov Models. Ecol. Lett. 2020, 23, 1878–1903. [Google Scholar] [CrossRef]
  61. Liu, C.; Deng, C.; Li, Z.; Liu, Y.; Wang, S. Optimization of Spatial Pattern of Land Use: Progress, Frontiers, and Prospects. Int. J. Environ. Res. Public Health 2022, 19, 5805. [Google Scholar] [CrossRef] [PubMed]
  62. Zhang, Z.; Hu, B.; Jiang, W.; Qiu, H. Identification and Scenario Prediction of Degree of Wetland Damage in Guangxi Based on the CA-Markov Model. Ecol. Indic. 2021, 127, 107764. [Google Scholar] [CrossRef]
  63. Busemeyer, J.R.; Kvam, P.D.; Pleskac, T.J. Comparison of Markov versus Quantum Dynamical Models of Human Decision Making. WIREs Cogn. Sci. 2020, 11, e1526. [Google Scholar] [CrossRef] [Green Version]
  64. Biao, Z.; Yunting, S.; Shuang, W. A Review on the Driving Mechanisms of Ecosystem Services Change. J. Resour. Ecol. 2022, 13, 68–79. [Google Scholar] [CrossRef]
  65. Wang, K.; Zhang, C.; Chen, H.; Yue, Y.; Zhang, W.; Zhang, M.; Qi, X.; Fu, Z. Karst Landscapes of China: Patterns, Ecosystem Processes and Services. Landscape Ecol. 2019, 34, 2743–2763. [Google Scholar] [CrossRef] [Green Version]
  66. Liu, L.; Wu, J. Scenario Analysis in Urban Ecosystem Services Research: Progress, Prospects, and Implications for Urban Planning and Management. Landsc. Urban Plan. 2022, 224, 104433. [Google Scholar] [CrossRef]
  67. Glennie, R.; Adam, T.; Leos-Barajas, V.; Michelot, T.; Photopoulou, T.; McClintock, B.T. Hidden Markov Models: Pitfalls and Opportunities in Ecology. Methods Ecol. Evol. 2023, 14, 43–56. [Google Scholar] [CrossRef]
  68. Khan, A.; Aslam, S.; Aurangzeb, K.; Alhussein, M.; Javaid, N. Multiscale Modeling in Smart Cities: A Survey on Applications, Current Trends, and Challenges. Sustain. Cities Soc. 2022, 78, 103517. [Google Scholar] [CrossRef]
  69. Yang, Q.; Liu, G.; Casazza, M.; Dumontet, S.; Yang, Z. Ecosystem Restoration Programs Challenges under Climate and Land Use Change. Sci. Total Environ. 2022, 807, 150527. [Google Scholar] [CrossRef] [PubMed]
  70. Aburas, M.M.; Ahamad, M.S.S.; Omar, N.Q. Spatio-Temporal Simulation and Prediction of Land-Use Change Using Conventional and Machine Learning Models: A Review. Environ. Monit. Assess. 2019, 191, 205. [Google Scholar] [CrossRef] [PubMed]
  71. Chughtai, A.H.; Abbasi, H.; Karas, I.R. A Review on Change Detection Method and Accuracy Assessment for Land Use Land Cover. Remote Sens. Appl. Soc. Environ. 2021, 22, 100482. [Google Scholar] [CrossRef]
  72. Froese, R.; Schilling, J. The Nexus of Climate Change, Land Use, and Conflicts. Curr. Clim. Change Rep. 2019, 5, 24–35. [Google Scholar] [CrossRef] [Green Version]
  73. Pătru-Stupariu, I.; Hossu, C.A.; Grădinaru, S.R.; Nita, A.; Stupariu, M.-S.; Huzui-Stoiculescu, A.; Gavrilidis, A.-A. A Review of Changes in Mountain Land Use and Ecosystem Services: From Theory to Practice. Land 2020, 9, 336. [Google Scholar] [CrossRef]
  74. Talukdar, S.; Singha, P.; Mahato, S.; Shahfahad; Pal, S.; Liou, Y.-A.; Rahman, A. Land-Use Land-Cover Classification by Machine Learning Classifiers for Satellite Observations—A Review. Remote Sens. 2020, 12, 1135. [Google Scholar] [CrossRef] [Green Version]
  75. Yang, H.; Hou, X.; Cao, J. Identifying the Driving Impact Factors on Water Yield Service in Mountainous Areas of the Beijing-Tianjin-Hebei Region in China. Remote Sens. 2023, 15, 727. [Google Scholar] [CrossRef]
  76. Zheng, J.; Wang, H.; Liu, B. Impact of the Long-Term Precipitation and Land Use Changes on Runoff Variations in a Humid Subtropical River Basin of China. J. Hydrol. Reg. Stud. 2022, 42, 101136. [Google Scholar] [CrossRef]
  77. Beillouin, D.; Cardinael, R.; Berre, D.; Boyer, A.; Corbeels, M.; Fallot, A.; Feder, F.; Demenois, J. A Global Overview of Studies about Land Management, Land-Use Change, and Climate Change Effects on Soil Organic Carbon. Glob. Change Biol. 2022, 28, 1690–1702. [Google Scholar] [CrossRef]
  78. Zhang, C.; Zhao, L.; Zhang, H.; Chen, M.; Fang, R.; Yao, Y.; Zhang, Q.; Wang, Q. Spatial-Temporal Characteristics of Carbon Emissions from Land Use Change in Yellow River Delta Region, China. Ecol. Indic. 2022, 136, 108623. [Google Scholar] [CrossRef]
  79. Allan, A.; Soltani, A.; Abdi, M.H.; Zarei, M. Driving Forces behind Land Use and Land Cover Change: A Systematic and Bibliometric Review. Land 2022, 11, 1222. [Google Scholar] [CrossRef]
  80. Yin, S.; Yi, Y.; Liu, Q.; Luo, Q.; Chen, K. A Review on Effects of Human Activities on Aquatic Organisms in the Yangtze River Basin since the 1950s. River 2022, 1, 104–119. [Google Scholar] [CrossRef]
  81. Zhao, L.; Peng, Z.-R. LandSys: An Agent-Based Cellular Automata Model of Land Use Change Developed for Transportation Analysis. J. Transp. Geogr. 2012, 25, 35–49. [Google Scholar] [CrossRef]
  82. Lin, J.; Li, X.; Wen, Y.; He, P. Modeling Urban Land-Use Changes Using a Landscape-Driven Patch-Based Cellular Automaton (LP-CA). Cities 2023, 132, 103906. [Google Scholar] [CrossRef]
  83. Molinero-Parejo, R.; Aguilera-Benavente, F.; Gómez-Delgado, M.; Shurupov, N. Combining a Land Parcel Cellular Automata (LP-CA) Model with Participatory Approaches in the Simulation of Disruptive Future Scenarios of Urban Land Use Change. Comput. Environ. Urban Syst. 2023, 99, 101895. [Google Scholar] [CrossRef]
  84. Chen, Y.; Liu, X.; Li, X. Calibrating a Land Parcel Cellular Automaton (LP-CA) for Urban Growth Simulation Based on Ensemble Learning. Int. J. Geogr. Inf. Sci. 2017, 31, 2480–2504. [Google Scholar] [CrossRef]
  85. Song, S.; Liu, Z.; He, C.; Lu, W. Evaluating the Effects of Urban Expansion on Natural Habitat Quality by Coupling Localized Shared Socioeconomic Pathways and the Land Use Scenario Dynamics-Urban Model. Ecol. Indic. 2020, 112, 106071. [Google Scholar] [CrossRef]
  86. Yang, Y.; Zhang, D.; Nan, Y.; Liu, Z.; Zheng, W. Modeling Urban Expansion in the Transnational Area of Changbai Mountain: A Scenario Analysis Based on the Zoned Land Use Scenario Dynamics-Urban Model. Sustain. Cities Soc. 2019, 50, 101622. [Google Scholar] [CrossRef]
  87. He, C.; Li, J.; Zhang, X.; Liu, Z.; Zhang, D. Will Rapid Urban Expansion in the Drylands of Northern China Continue: A Scenario Analysis Based on the Land Use Scenario Dynamics-Urban Model and the Shared Socioeconomic Pathways. J. Clean. Prod. 2017, 165, 57–69. [Google Scholar] [CrossRef]
  88. Hanoon, S.K.; Abdullah, D.A.F.; Shafri, D.H.Z.M.; Wayayok, D.A. Using Scenario Modelling for Adapting to Urbanization and Water Scarcity: Towards a Sustainable City in Semi-Arid Areas. Period. Eng. Nat. Sci. 2022, 10, 518–532. [Google Scholar] [CrossRef]
Figure 1. The location of the target study area.
Land 12 00744 g001
Figure 2. Research design for this study.
Land 12 00744 g002
Figure 3. Drivers of land-use change. (A) DEM, (B) slope, (C) aspect, (D) NDVI, (E) temperatures, (F) precipitation, (G) GDP, (H) population, (I) restaurants, (J) hotels, (K) supermarkets, (L) waters, (M) expressways, (N) primary roads, (O) railroads, (P) town centers, (Q) city centers, (R) bus stops.
Land 12 00744 g003
Figure 4. Comparison of reality and simulation details of land use in 2020. (A) Reality; (B) simulation.
Land 12 00744 g004
Figure 5. Comparison of reality and simulation of land use area in 2020.
Land 12 00744 g005
Figure 6. Land use in Hubei Province from 2000 to 2020. (A) 2000, (B) 2005, (C) 2010, (D) 2015, and (E) 2020.
Land 12 00744 g006
Figure 7. The (A) land-use change and (B) transitions between different land use types in Hubei Province from 2000 to 2020, the areas where land use has changed during different time periods: (C) period 2000–2005, (D) period 2005–2010, (E) period 2010–2015, and (F) period 2015–2020.
Land 12 00744 g007
Figure 8. Simulation results for land use in 2035 in the natural development scenario.
Land 12 00744 g008
Figure 9. Area changes in land use types in the natural development scenario from 2020 to 2035.
Land 12 00744 g009
Figure 10. Simulation results for land use in 2035 in the economic priority scenario.
Land 12 00744 g010
Figure 11. Area changes in land use types in the economic priority scenario from 2020 to 2035.
Land 12 00744 g011
Figure 12. Simulation results for land use in 2035 in the ecological protection scenario.
Land 12 00744 g012
Figure 13. Area changes in land use types in the ecological protection scenario from 2020 to 2035.
Land 12 00744 g013
Figure 14. Simulation results for land use in 2035 in the cultivated land protection scenario.
Land 12 00744 g014
Figure 15. Area changes in land use types in the cultivated land protection scenario from 2020 to 2035.
Land 12 00744 g015
Table 1. List of drivers selected for this study.
TypesDriving FactorsData Sources
Geographical factorsDEMGeospatial Data Cloud
(https://www.gscloud.cn/)
SlopeGeospatial Data Cloud
ArcMap slope
AspectGeospatial Data Cloud
ArcMap aspect
NDVIGeospatial Data Cloud
Climatic factorsAverage temperatureThe National Tibetan Plateau Data Center
(https://data.tpdc.ac.cn/)
Average precipitationThe National Tibetan Plateau Data Center
Socioeconomic factorsPopulation densityResource and Environment Science and Data Center
(https://www.resdc.cn/)
GDPChina National Bureau of Statistics
(http://www.stats.gov.cn/)
Restaurant distribution densityResource and Environment Science and Data Center
ArcMap Kernel Density
Hotel distribution densityResource and Environment Science and Data Center
ArcMap Kernel Density
Supermarket distribution densityResource and Environment Science and Data Center
ArcMap Kernel Density
Location factorsDistance to watersOpenStreetMap
(https://www.openstreetmap.org)
ArcMap European distance tool
Distance to expresswayOpenStreetMap
ArcMap European distance tool
Distance to primary roadsOpenStreetMap
ArcMap European distance tool
Distance to railroadOpenStreetMap
ArcMap European distance tool
Distance to town centerOpenStreetMap
ArcMap European distance tool
Distance to city centerOpenStreetMap
ArcMap European distance tool
Distance to bus stopsOpenStreetMap
ArcMap European distance tool
Note: The driving factors used for accuracy validation in this study (climate, socioeconomic, and locational factors) were from 2015, while those used in the scenario simulation processes were from 2020. The access date is 21 November 2022 in this table.
Table 2. FLUS model validation results.
InspectionOAKappaFOM
Results0.930.850.139
Table 3. Validation results of random samples.
Land Use TypeCommission ErrorOmission ErrorProducer’s AccuracyUser’s Accuracy
Cultivated land0.07506080.07859030.921410.924939
Forest0.05116760.04340080.9565990.948832
Grassland0.6813150.7564840.2435160.318685
Water0.173620.1265220.8734780.82638
Architecture0.1400580.2488980.7511020.859942
Others0.6833330.7888890.2111110.316667
Table 4. Neighborhood factor parameters.
ScenariosCultivated LandForestGrasslandWaterArchitectureOthers
Natural development0.50.70.30.410.01
Economic priority0.20.30.20.310.01
Ecological protection0.310.70.50.80.01
Cultivated land protection0.80.50.30.50.80.01
Table 5. Conversion cost coefficients between land use types.
ScenariosLand Use TypeCultivated LandForestGrasslandWaterArchitectureOthers
Natural developmentCultivated land111111
Forest111111
Grassland111111
Water111111
Architecture111111
Others111111
Economic priorityCultivated land111101
Forest111101
Grassland111101
Water111101
Architecture111111
Others111111
Ecological protectionCultivated land100011
Forest111111
Grassland111111
Water111111
Architecture000010
Others000011
Cultivated land
protection
Cultivated land111111
Forest011111
Grassland011111
Water011111
Architecture011111
Others111111
Disclaimer/Publisher’s Note: The statements, opinions and data contained in all publications are solely those of the individual author(s) and contributor(s) and not of MDPI and/or the editor(s). MDPI and/or the editor(s) disclaim responsibility for any injury to people or property resulting from any ideas, methods, instructions or products referred to in the content.

