
Allocation of U.S. Biomass Production to Food, Feed, Fiber, Fuel and Exports
Abstract
:1. Introduction
1.1. U.S. Biomass Production in the Context of Agricultural Sustainability and Food Security
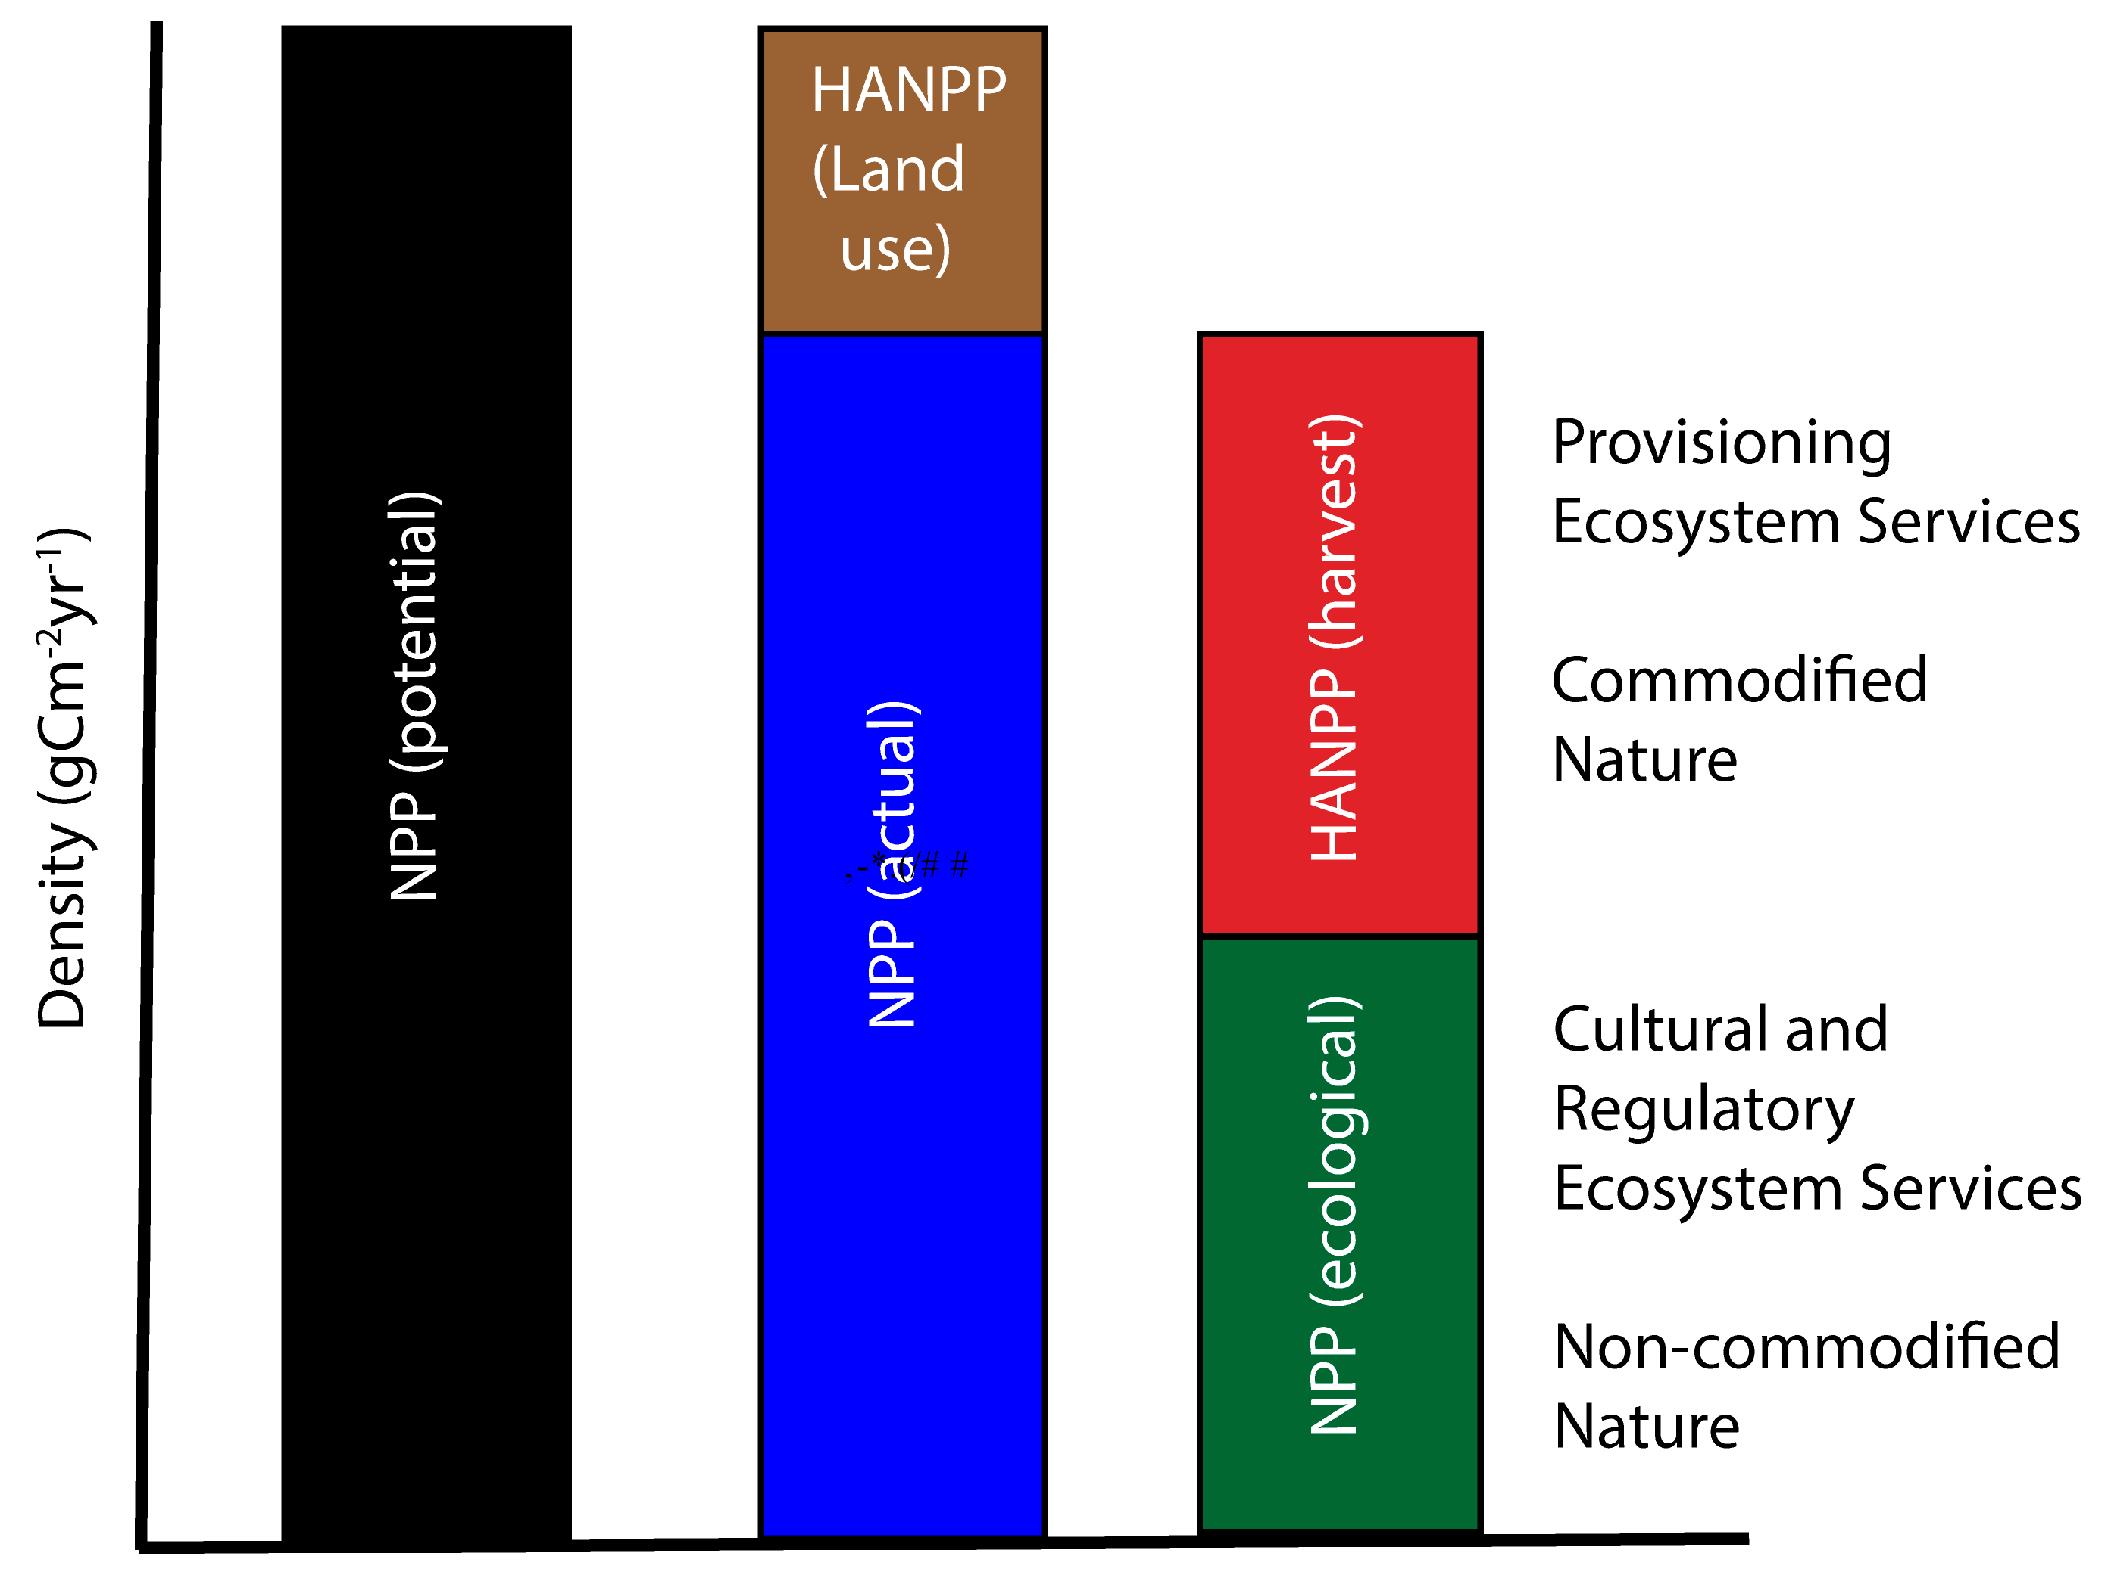
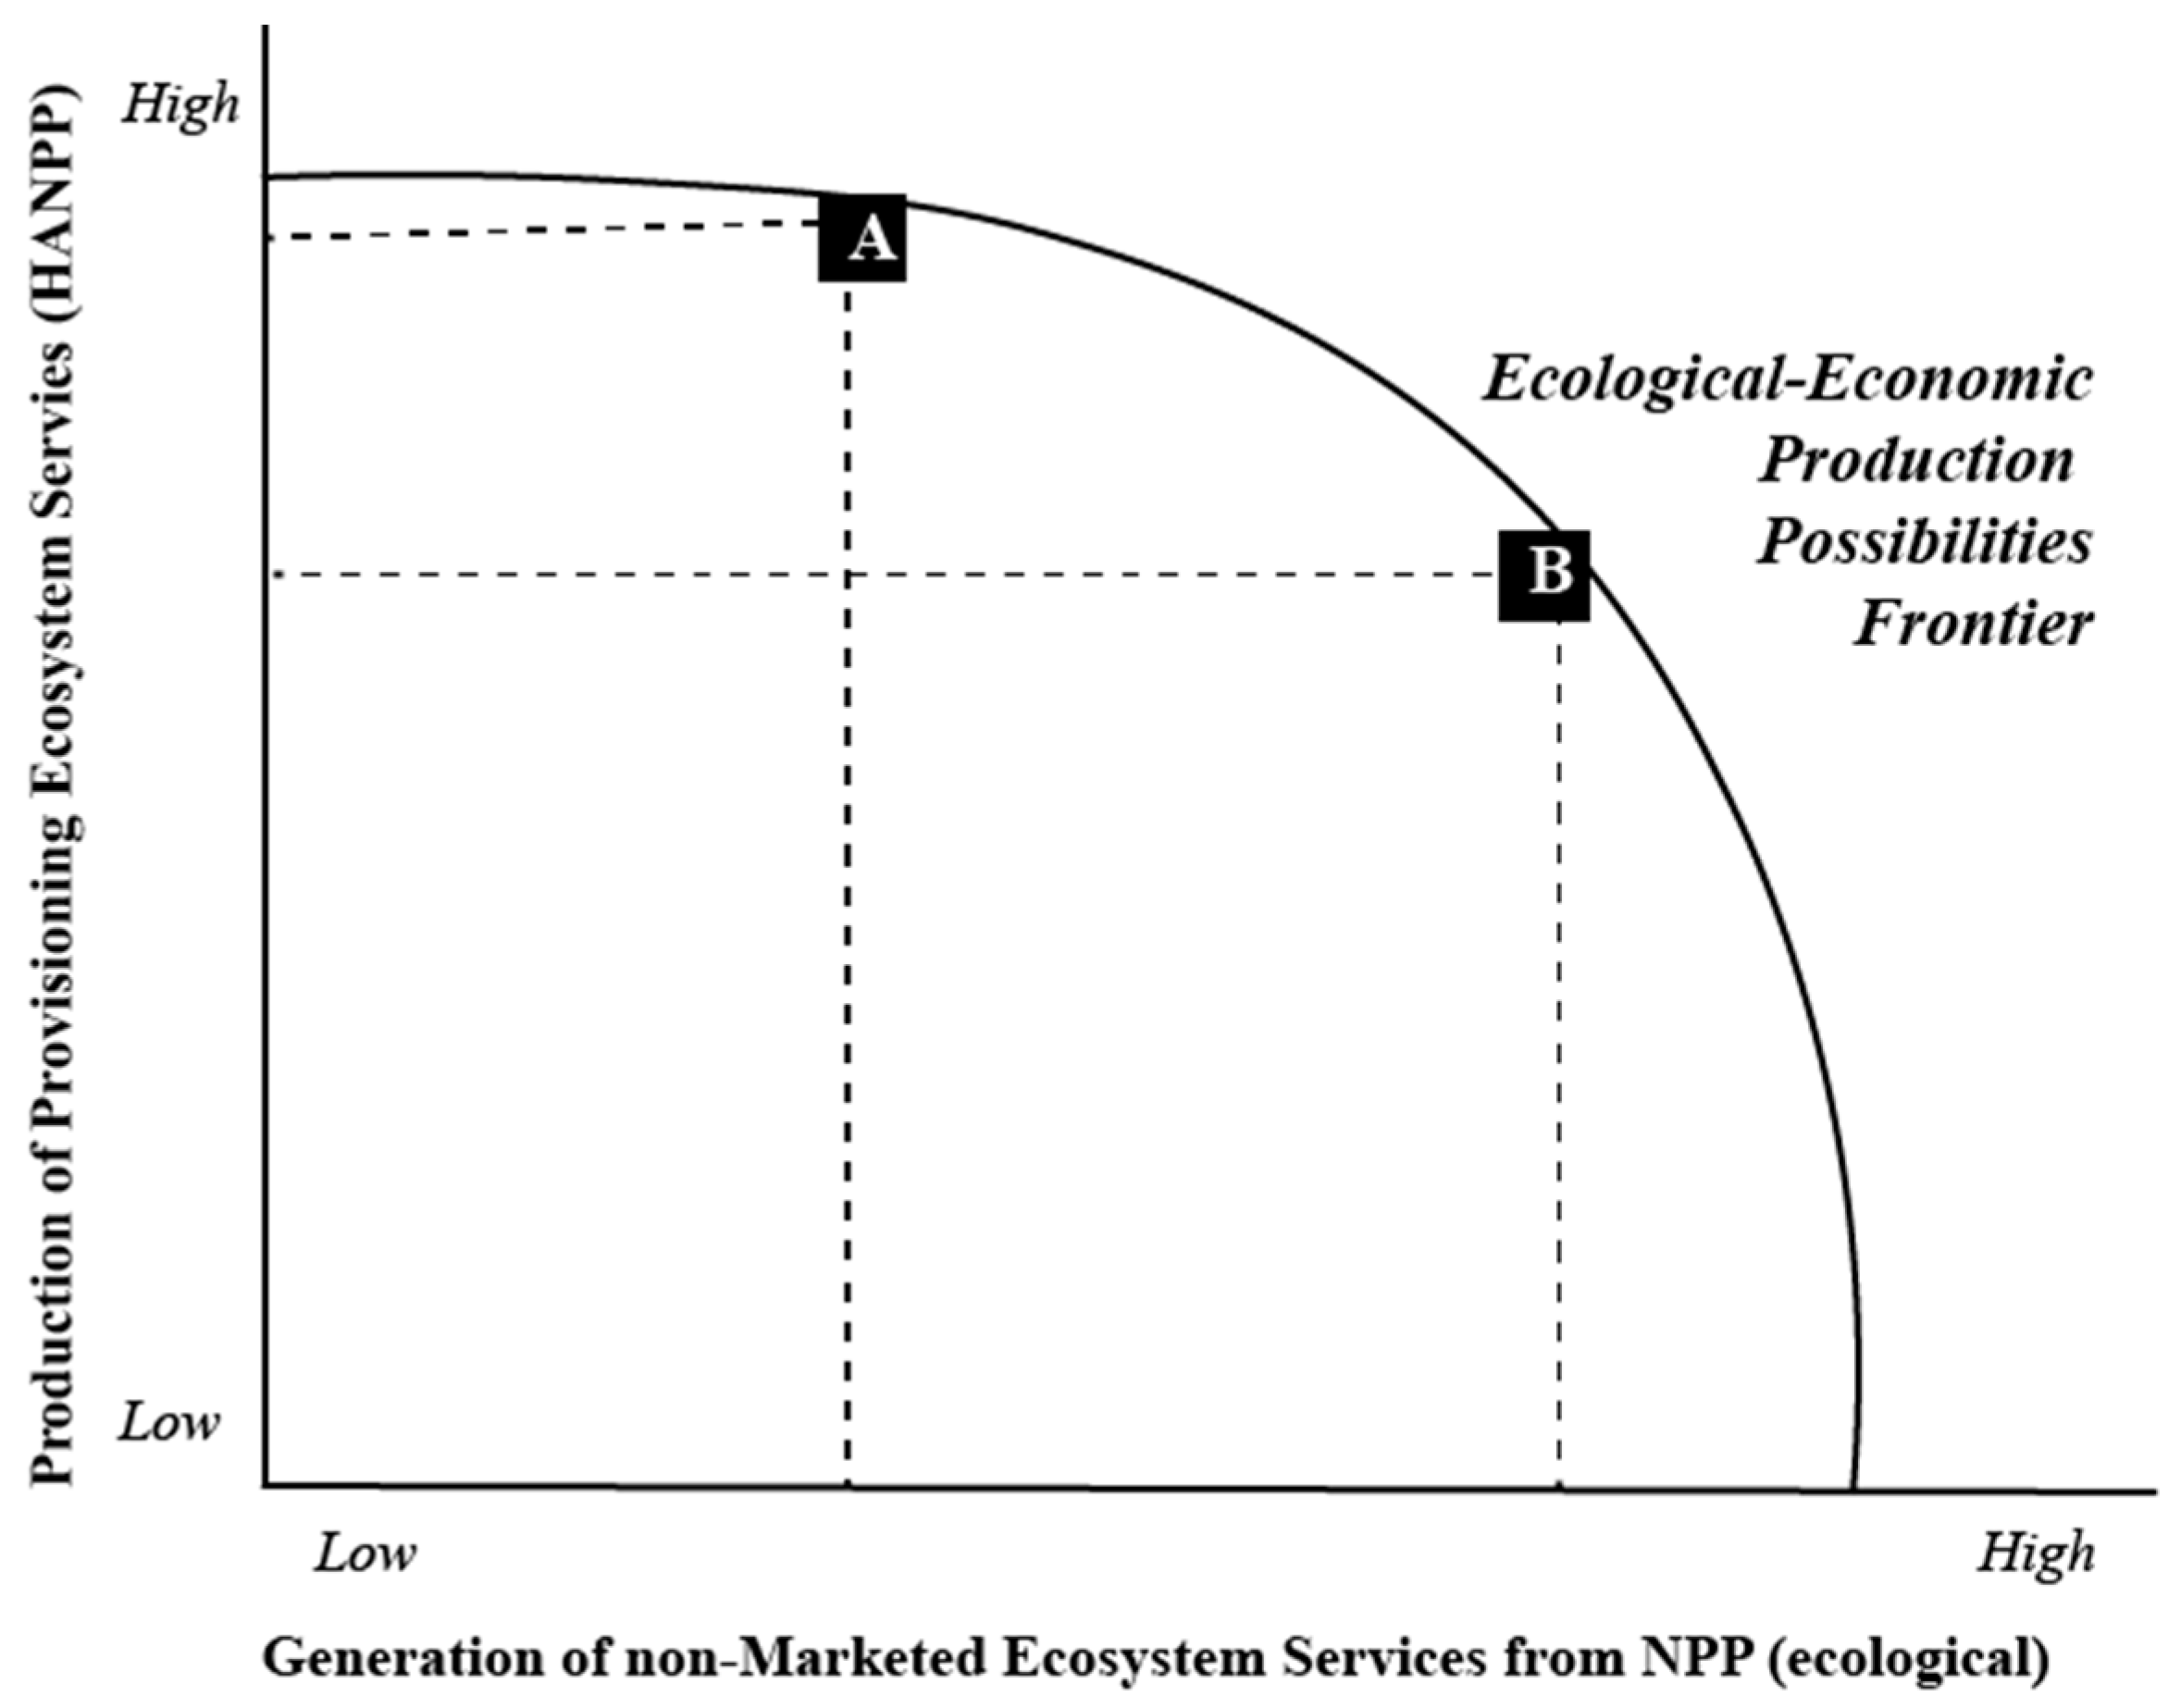
1.2. HANPP and the Tragedy of Ecosystem Services
1.3. HANPP and the Commodification of Nature
1.4. Research Questions and Objectives
2. Materials and Methods
2.1. Sources of HANPP
2.2. Allocation of HANPP
3. Results
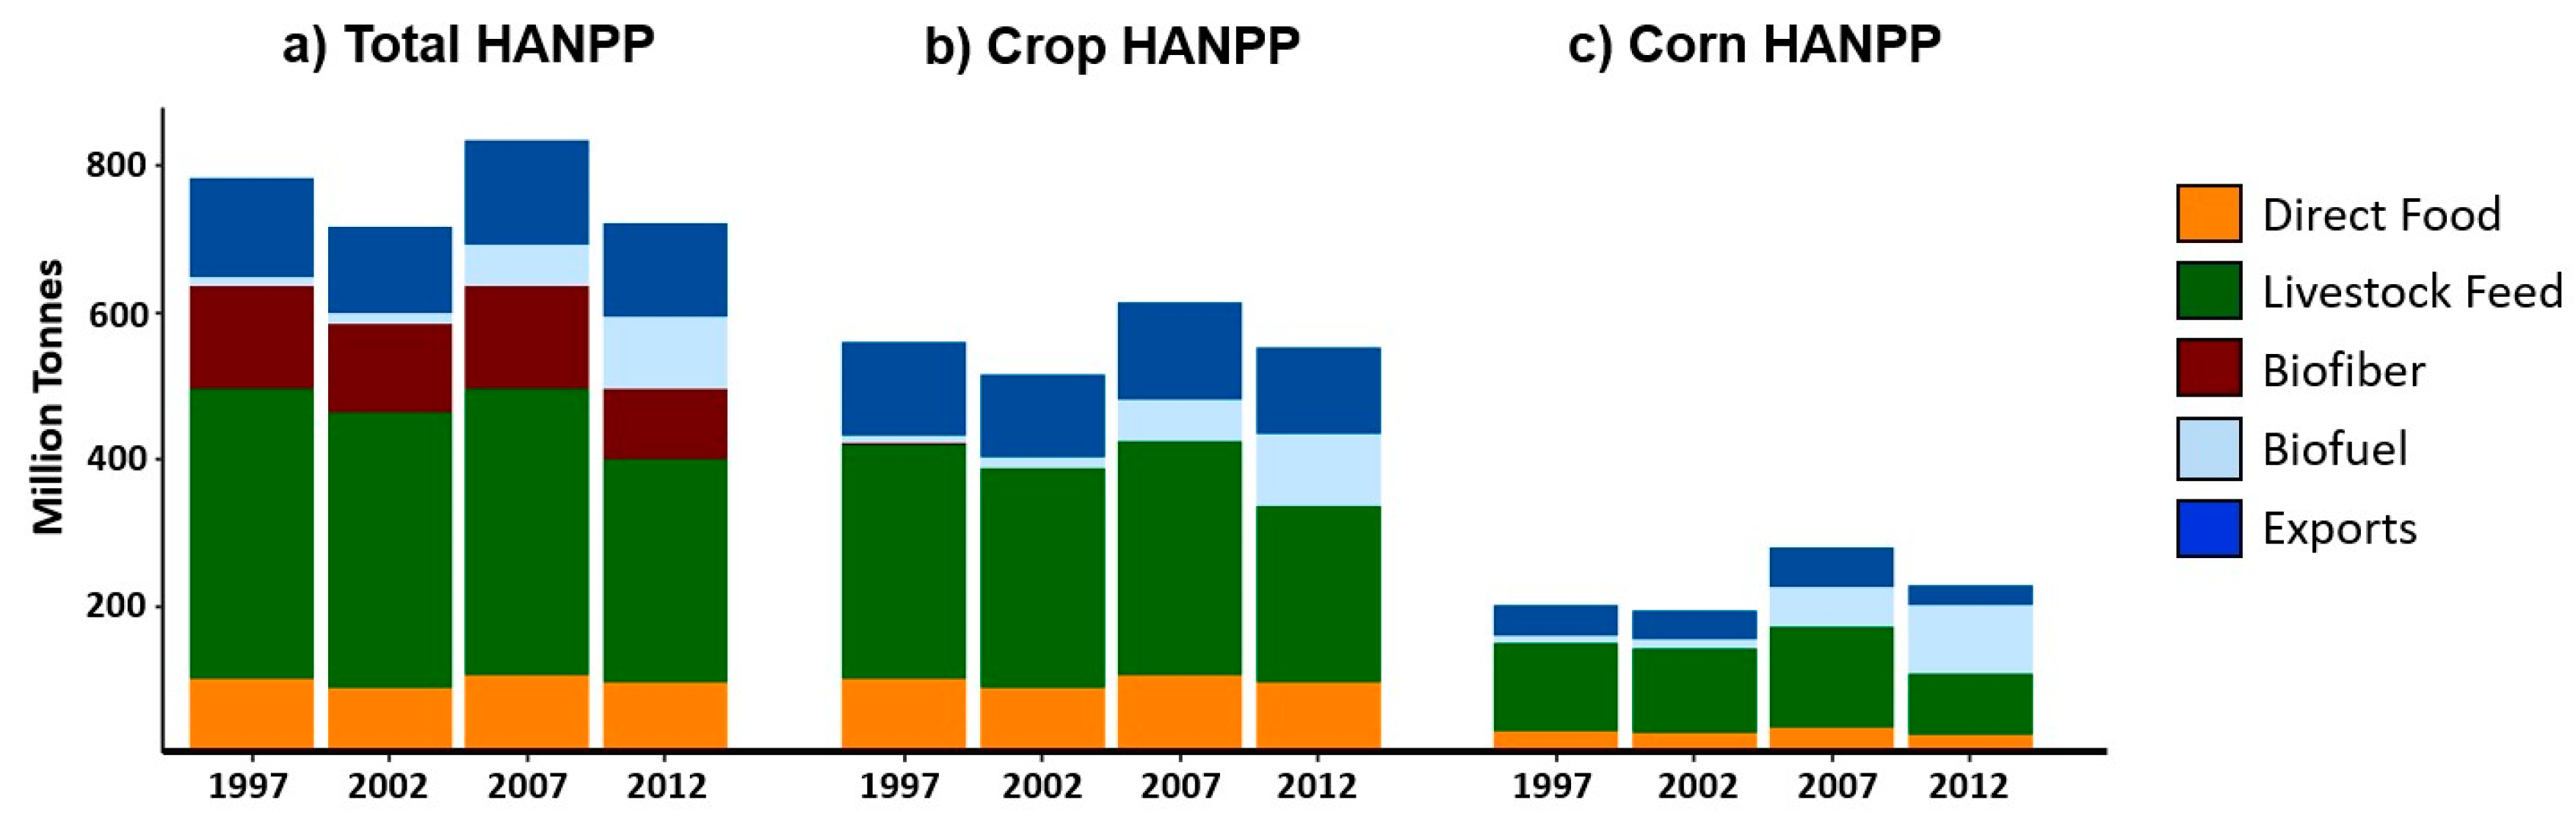
3.1. National Trends in Allocation of Biomass Products
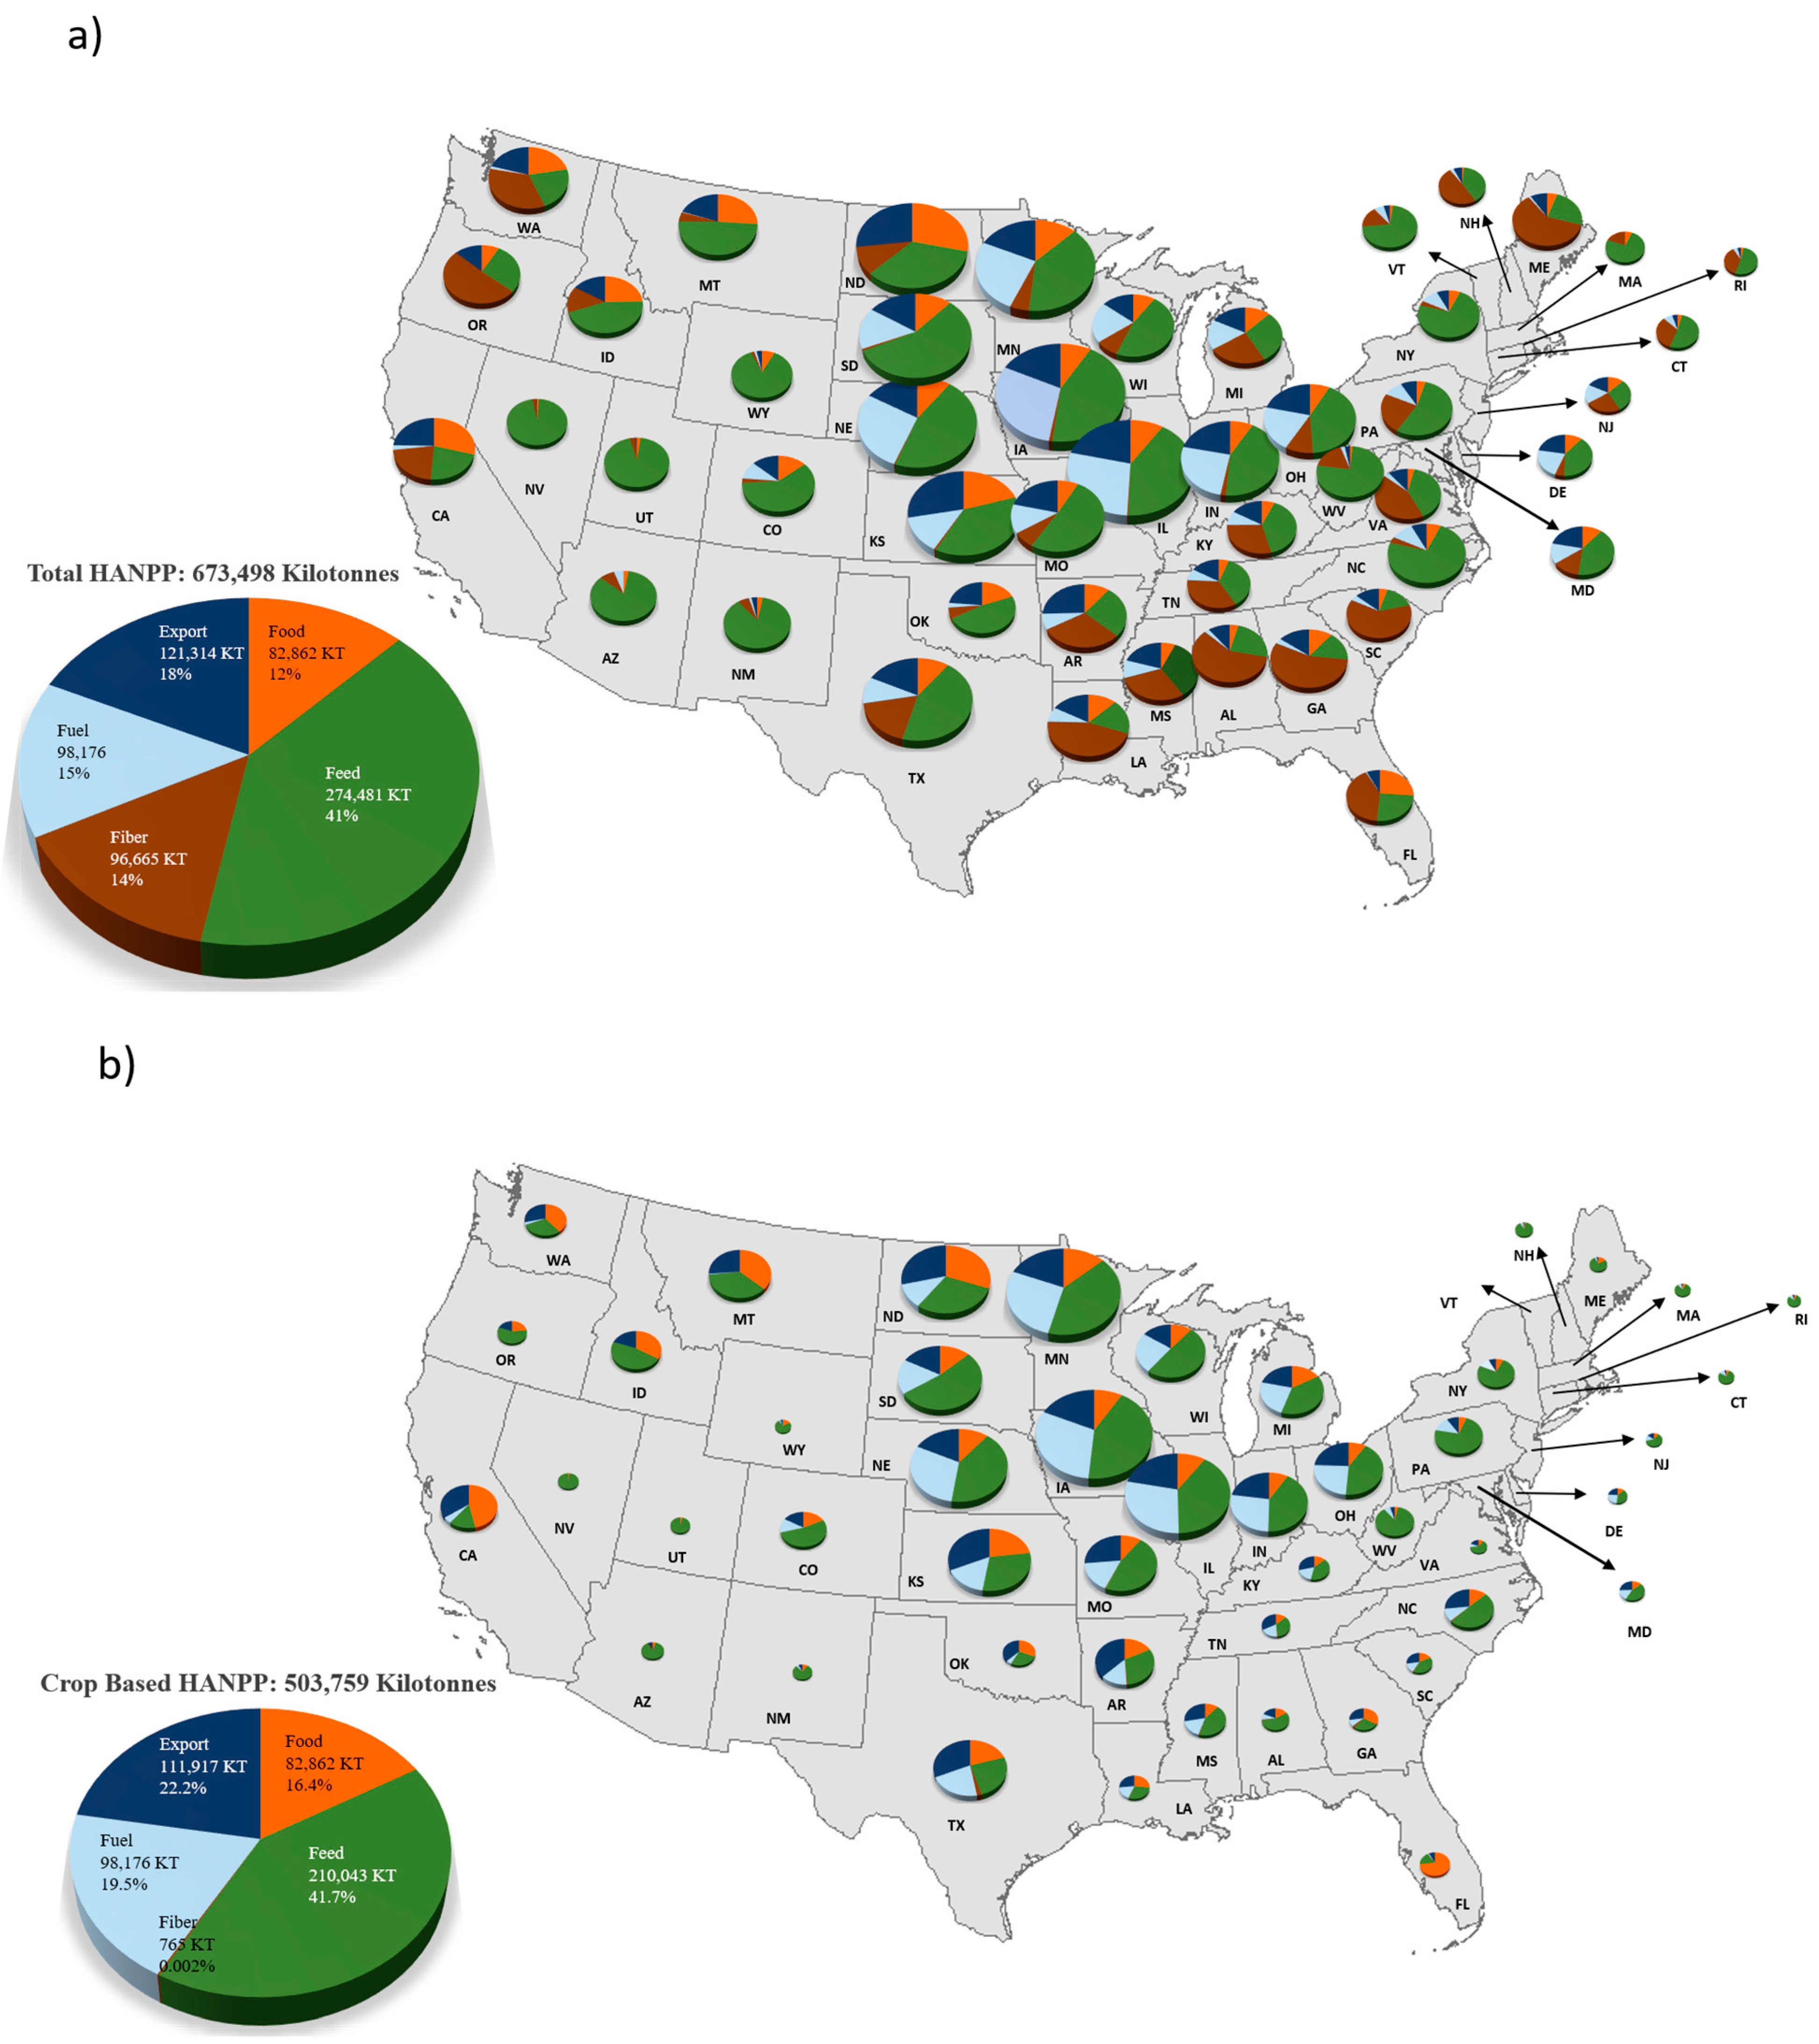
3.2. Geographic Patterns among U.S. States
4. Discussion
5. Conclusions
Supplementary Materials
Author Contributions
Funding
Data Availability Statement
Conflicts of Interest
Appendix A

| State | Grazing | Soft Wood | Hard Wood | Corn Grain | Corn Silage | Soybean | Winter Wheat | Spring Wheat | Alfalfa Hay | Cotton | Sorghum | Minor Crops | Total |
|---|---|---|---|---|---|---|---|---|---|---|---|---|---|
| Arizona | 1 | 0.3 | 0 | 0 | 0 | 0 | 0 | 0 | 1.7 | 0.1 | 0 | 1.6 | 4.7 |
| Arkansas | 1 | 3.2 | 2.1 | 2.6 | 0 | 3.6 | 0.7 | 0 | 0 | 0.2 | 0.3 | 2.9 | 16.9 |
| California | 2 | 3.4 | 0 | 0.7 | 2 | 0 | 0.7 | 0 | 0 | 0.1 | 0 | 11.6 | 20.7 |
| Colorado | 2 | 0 | 0.1 | 2.8 | 0 | 0 | 1.9 | 0 | 1.8 | 0 | 0.1 | 6 | 14.9 |
| Connecticut | 0 | 0 | 0.1 | 0.1 | 0 | 0 | 0 | 0 | 0 | 0 | 0 | 0.2 | 0.5 |
| Delaware | 0 | 0 | 0 | 0.5 | 0 | 0.2 | 0 | 0 | 0 | 0 | 0 | 0.1 | 0.9 |
| Florida | 2 | 3.3 | 1.2 | 0.1 | 0 | 0 | 0 | 0 | 0 | 0 | 0 | 4.3 | 10.8 |
| Georgia | 1 | 7 | 2.9 | 1.2 | 0 | 0.2 | 0.3 | 0 | 0 | 0.7 | 0 | 4.2 | 17.8 |
| Idaho | 1 | 2.1 | 0 | 0 | 0 | 0 | 1.7 | 1.1 | 3.3 | 0 | 0 | 3.6 | 13.1 |
| Illinois | 1 | 0 | 0.1 | 27.6 | 0 | 10.2 | 1.1 | 0 | 0.7 | 0 | 0 | 0.1 | 40.8 |
| Indiana | 1 | 0 | 0.3 | 12.8 | 0 | 5.9 | 0.5 | 0 | 0.5 | 0 | 0 | 0.2 | 21.1 |
| Iowa | 1 | 0 | 0.5 | 40.2 | 0.9 | 11.2 | 0 | 0 | 1.7 | 0 | 0 | 1.6 | 57 |
| Kansas | 3 | 0 | 0.2 | 8 | 0 | 2.3 | 10.8 | 0 | 1.3 | 0 | 1.9 | 5.7 | 33.7 |
| Kentucky | 2 | 0.1 | 3.3 | 2.2 | 0 | 1.5 | 0.8 | 0 | 0.4 | 0 | 0 | 0 | 10.5 |
| Louisiana | 1 | 3.8 | 2.2 | 2 | 0 | 1.4 | 0 | 0 | 0 | 0.1 | 0.3 | 3.4 | 13.6 |
| Maine | 0 | 1.9 | 0 | 0.1 | 0 | 0 | 0 | 0 | 0 | 0 | 0 | 0.9 | 2.9 |
| Maryland | 0.2 | 0.1 | 0.4 | 1 | 0 | 0.5 | 0.3 | 0 | 0 | 0 | 0 | 0.7 | 3.2 |
| Massachusetts | 0 | 0.1 | 0 | 0.1 | 0 | 0 | 0 | 0 | 0 | 0 | 0 | 0.4 | 0.5 |
| Michigan | 0 | 0.8 | 3.2 | 6.7 | 0 | 2.3 | 1.2 | 0 | 0 | 0 | 0 | 2.2 | 16.7 |
| Minnesota | 0 | 0.6 | 1.8 | 29.4 | 1.2 | 8.1 | 0 | 2.1 | 2 | 0 | 0 | 3.3 | 48.8 |
| Mississippi | 1 | 3.7 | 0.3 | 2.8 | 0 | 2.3 | 0.5 | 0 | 0 | 0.2 | 0.1 | 1.8 | 12.9 |
| Missouri | 3 | 0.1 | 1.2 | 5.3 | 0 | 4.2 | 1.1 | 0 | 0.1 | 0.2 | 0.1 | 2.3 | 17.2 |
| Montana | 4 | 0.9 | 0 | 0.1 | 0.2 | 0 | 2.4 | 2.7 | 2.4 | 0 | 0 | 8.5 | 21.4 |
| Nebraska | 3 | 0 | 0.1 | 27.7 | 0 | 5.5 | 1.5 | 0 | 1.9 | 0 | 0.1 | 2.4 | 42.1 |
| Nevada | 1 | 0 | 0 | 0 | 0 | 0 | 0 | 0 | 0.8 | 0 | 0 | 0.2 | 1.9 |
| New Hampshire | 0 | 0.3 | 0.1 | 0 | 0 | 0 | 0 | 0 | 0 | 0 | 0 | 0.3 | 0.7 |
| New Jersey | 0 | 0 | 0.1 | 0.2 | 0 | 0.1 | 0 | 0 | 0 | 0 | 0 | 0.4 | 1 |
| New Mexico | 2 | 0.3 | 0 | 0.1 | 0.3 | 0 | 0 | 0 | 0.8 | 0 | 0 | 1.3 | 5.3 |
| New York | 0 | 0.3 | 0 | 2 | 1.5 | 0.4 | 0.1 | 0 | 0.7 | 0 | 0 | 4.7 | 9.9 |
| North Carolina | 0.5 | 4 | 0.2 | 2.1 | 0 | 1.7 | 1.2 | 0 | 0 | 0.3 | 0 | 3.9 | 13.4 |
| North Dakota | 2.4 | 0 | 0 | 9.1 | 0.4 | 4.3 | 1.2 | 7.3 | 1.5 | 0 | 0 | 10.3 | 37.4 |
| Ohio | 1.1 | 0.1 | 1.8 | 9.4 | 0 | 5.5 | 0.9 | 0 | 0.4 | 0 | 0 | 0.3 | 19.4 |
| Oklahoma | 3.5 | 0.4 | 0.5 | 0.7 | 0 | 0.1 | 4.4 | 0 | 0.4 | 0 | 0.1 | 1.9 | 11.9 |
| Oregon | 1 | 6.5 | 0.4 | 0 | 0 | 0 | 1.5 | 0.1 | 1.3 | 0 | 0 | 3.6 | 14.5 |
| Pennsylvania | 0.1 | 0.2 | 2.8 | 2.8 | 1.5 | 0.7 | 0.2 | 0 | 0.8 | 0 | 0 | 5.1 | 14.2 |
| Rhode Island | 0 | 0 | 0 | 0 | 0 | 0 | 0 | 0 | 0 | 0 | 0 | 0 | 0.1 |
| South Carolina | 0.6 | 4 | 2.3 | 0.8 | 0 | 0.3 | 0.3 | 0 | 0 | 0.1 | 0 | 1.3 | 9.8 |
| South Dakota | 2.6 | 0.2 | 0 | 11.5 | 0 | 3.8 | 1.6 | 1.2 | 1.8 | 0 | 0.1 | 8 | 30.8 |
| Tennessee | 2.1 | 0.7 | 2.9 | 1.7 | 0 | 1.2 | 0.6 | 0 | 0 | 0.2 | 0 | 0.1 | 9.5 |
| Texas | 7.8 | 3 | 1.6 | 4.1 | 0 | 0.1 | 2.7 | 0 | 0 | 1.1 | 2.6 | 5.8 | 28.6 |
| Utah | 1.2 | 0.1 | 0 | 0 | 0 | 0 | 0 | 0 | 1.6 | 0 | 0 | 0.7 | 3.7 |
| Vermont | 0 | 0.3 | 0 | 0 | 0 | 0 | 0 | 0 | 0 | 0 | 0 | 1 | 1.5 |
| Virginia | 1.9 | 2.1 | 2.9 | 0.7 | 0 | 0.5 | 0.4 | 0 | 0.1 | 0 | 0 | 1.8 | 10.4 |
| Washington | 0.8 | 5.3 | 0.4 | 0.5 | 0 | 0 | 3.3 | 0.8 | 1.5 | 0 | 0 | 4.8 | 17.4 |
| West Virginia | 0.8 | 0.1 | 0.3 | 0.1 | 0 | 0 | 0 | 0 | 0 | 0 | 0 | 0.6 | 1.8 |
| Wisconsin | 0.6 | 0.6 | 0.9 | 8.5 | 2.8 | 1.9 | 1.5 | 0 | 2.2 | 0 | 0 | 1.3 | 19.3 |
| Wyoming | 2.1 | 0.1 | 0 | 0.1 | 0 | 0 | 0.1 | 0 | 1.1 | 0 | 0 | 0.7 | 4.1 |
| Total | 64.4 | 64.5 | 40.8 | 229.3 | 10.7 | 80.5 | 44.7 | 15.3 | 32.9 | 3.6 | 5.5 | 128.2 | 722.2 |
Appendix B
| Minor Crop | Area (km2) | Food | Feed | Fiber | Fuel | Exports | Reference |
|---|---|---|---|---|---|---|---|
| Non-alfalfa hay | 96,646 | 0 | 1 | 0 | 0 | 0 | Same as alfalfa |
| W.Wheat-Soybeans | 21,493 | 0.210 | 0.310 | 0 | 0.024 | 0.456 | Mean of two crops |
| Barley | 11,543 | 0.650 | 0.200 | 0 | 0 | 0.150 | [49] |
| Rice | 10,812 | 0.500 | 0 | 0 | 0 | 0.500 | [50] |
| Dry Beans | 7055 | 0.667 | 0 | 0 | 0 | 0.333 | [51] |
| Canola | 6883 | 0.40 | 0 | 0 | 0 | 0.600 | [39] |
| Peanuts | 6708 | 0.830 | 0 | 0 | 0 | 0.170 | [39] |
| Sunflower | 6455 | 0.860 | 0 | 0 | 0 | 0.140 | [39] |
| Oats | 5201 | 0.316 | 0.670 | 0 | 0 | 0.014 | [52] |
| Sugar beets | 5011 | 1 | 0 | 0 | 0 | 0 | [49] |
| Almonds | 4676 | 0.300 | 0 | 0 | 0 | 0.700 | [53] |
| Grapes | 4600 | 0.975 | 0 | 0 | 0 | 0.025 | [54] |
| Potatoes | 4385 | 0.850 | 0 | 0 | 0 | 0.150 | [55] |
| Sugarcane | 4155 | 1 | 0 | 0 | 0 | 0 | [54] |
| Oranges | 4125 | 0.924 | 0 | 0 | 0 | 0.076 | [56] |
| Peas | 3133 | 1 | 0 | 0 | 0 | 0 | [57] |
| Millet | 1852 | 0 | 0.874 | 0 | 0 | 0.126 | [54] |
| Rye | 1835 | 0 | 1 | 0 | 0 | 0 | [58] |
| Apples | 1798 | 0.700 | 0 | 0 | 0 | 0.300 | [59] |
| W.Wheat-Corn | 1625 | 0.268 | 0.235 | 0 | 0.2 | 0.297 | Mean of two crops |
| Pecans | 1613 | 0.700 | 0 | 0 | 0 | 0.300 | [60] |
| Lentils | 1572 | 0.380 | 0 | 0 | 0 | 0.620 | [57] |
| W.Wheat-Sorghum | 1562 | 0.235 | 213 | 0 | 0.172 | 0.380 | Mean of two crops |
| Tomatoes | 1431 | 0.840 | 0 | 0 | 0 | 0.160 | [61] |
| Walnuts | 1382 | 0.300 | 0 | 0 | 0 | 0.700 | [62] |
| W.Wheat-Cotton | 1312 | 0.210 | 0.055 | 0.095 | 0 | 0.640 | Mean of two crops |
| Sweet Corn | 1220 | 0.960 | 0 | 0 | 0 | 0.04 | [54] |
| Flaxseed | 1150 | 0 | 0.766 | 0 | 0 | 0.234 | [39] |
| Total | 221,233 | 0.318 | 0.516 | 0.001 | 0.005 | 0.161 |
References
- Cassidy, E.S.; West, P.C.; Gerber, J.S.; Foley, J.A. Redefining agricultural yields: From tonnes to people nourished per hectare. Environ. Res. Lett. 2013, 8, 034015. [Google Scholar] [CrossRef]
- Gibbs, H.K.; Ruesch, A.S.; Achard, F.; Clayton, M.K.; Holmgren, P.; Ramankutty, N.; Foley, J.A. Tropical forests were the primary sources of new agricultural land in the 1980s and 1990s. Proc. Natl. Acad. Sci. USA 2010, 107, 16732–16737. [Google Scholar] [CrossRef] [Green Version]
- Fargione, J.; Hill, J.; Tilman, D.; Polasky, S.; Hawthorne, P. Land clearing and the biofuel carbon debt. Science 2008, 319, 1235–1238. [Google Scholar] [CrossRef] [PubMed] [Green Version]
- Searchinger, T.; Heimlich, R.; Houghton, R.A.; Dong, F.; Elobeid, A.; Fabiosa, J.; Tokgoz, S.; Hayes, D.; Yu, T.-H. Use of U.S. croplands for biofuels increases greenhouse gases through emissions from land-use change. Science 2008, 319, 1238–1240. [Google Scholar] [CrossRef]
- Ramankutty, N.; Mehrabi, Z.; Waha, K.; Jarvis, L.; Kremen, C.; Herrero, M.; Rieseberg, L.H. Trends in global agricultural land use: Implications for environmental health and food security. Annu. Rev. Plant Biol. 2018, 69, 789–815. [Google Scholar] [CrossRef] [Green Version]
- Phalan, B.; Onial, M.; Balmford, A.; Green, R.E. Reconciling food production and biodiversity conservation: Land sharing and land sparing compared. Science 2011, 333, 1289–1291. [Google Scholar] [CrossRef] [PubMed]
- Lobell, D.B.; Schlenker, W.; Costa-Roberts, J. Climate trends and global crop production since 1980. Science 2011, 333, 613–616. [Google Scholar] [CrossRef] [Green Version]
- Challinor, A.; Watson, J.; Lobell, D.; Howden, S.; Smith, D.; Chhetri, N. A meta-analysis of crop yield under climate change and adaptation. Nat. Clim. Chang. 2014, 4, 287–291. [Google Scholar] [CrossRef] [Green Version]
- Schauberger, B.; Archontoulis, S.; Arneth, A.; Balkovic, J.; Ciais, P.; Deryng, D.; Elliott, J.; Folberth, C.; Khabarov, N.; Müller, C.; et al. Consistent negative response of US crops to high temperatures in observations and crop models. Nat. Commun. 2017, 8, 13931. [Google Scholar] [CrossRef] [Green Version]
- Bailey, R.; Wellesley, L. Chokepoints and Vulnerabilities in Global Food Trade; Chatham House Report: London, UK, 2017. [Google Scholar]
- Springmann, M.; Clark, M.; Mason-D’Croz, D.; Wiebe, K.; Bodirsky, B.L.; Lassaletta, L.; de Vries, W.; Vermeulen, S.J.; Herrero, M.; Carlson, K.M.; et al. Options for keeping the food system within environmental limits. Nature 2018, 562, 519–525. [Google Scholar] [CrossRef]
- Eshel, G.; Shepon, A.; Makov, T.; Milo, R. Land, irrigation water, greenhouse gas, and reactive nitrogen burdens of meat, eggs, and dairy production in the United States. Proc. Natl. Acad. Sci. USA 2014, 111, 11996–12001. [Google Scholar] [CrossRef] [Green Version]
- West, P.C.; Gerber, J.S.; Engstrom, P.M.; Mueller, N.D.; Brauman, K.A.; Carlson, K.M.; Cassidy, E.S.; Johnston, M.; MacDonald, G.K.; Ray, D.K.; et al. Leverage points for improving global food security and the environment. Science 2014, 345, 325–328. [Google Scholar] [CrossRef] [Green Version]
- Dietz, T.; York, R. Environmentally efficient well-being: Rethinking sustainability as the relationship between human well-being and environmental impacts. Hum. Ecol. Rev. 2009, 16, 114–123. [Google Scholar]
- Lant, C.L.; Ruhl, J.B.; Kraft, S.E. The tragedy of ecosystem services. Bioscience 2008, 58, 969–974. [Google Scholar] [CrossRef] [Green Version]
- Ruhl, J.B.; Kraft, S.E.; Lant, C.L. The Law and Policy of Ecosystem Services; Island Press: Covelo, CA, USA, 2007; 345p. [Google Scholar]
- Castree, N. Commodifying what nature? Prog. Hum. Geogr. 2003, 27, 273–279. [Google Scholar] [CrossRef]
- Running, S.W. A measurable planetary boundary for the biosphere. Science 2012, 337, 1458–1459. [Google Scholar] [CrossRef] [PubMed] [Green Version]
- Rockström, J.; Steffen, W.; Noone, K.; Persson, Å.; Chapin, F.S., III; Lambin, E.F.; Lenton, T.M.; Scheffer, M.; Folke, C.; Schellnhuber, H.J.; et al. A safe operating space for humanity. Nature 2009, 461, 472–475. [Google Scholar] [CrossRef]
- Vitousek, P.M.; Ehrlich, P.R.; Ehrlich, A.H.; Matson, P.A. Human appropriation of the products of photosynthesis. Bioscience 1986, 36, 368–373. [Google Scholar] [CrossRef]
- Haberl, H.; Erb, K.-H.; Krausmann, F. Human appropriation of net primary production: Patterns, trends and planetary boundaries. Annu. Rev. Environ. Resour. 2014, 39, 363–391. [Google Scholar] [CrossRef]
- Haberl, H.; Fischer-Kowalski, M.; Winiwarter, V. (Eds.) Social Ecology: Society-Nature Relations across Time and Space; Springer: Berlin/Heidelberg, Germany, 2016. [Google Scholar]
- Diaz, A.; Settele, J.; Brondizio, E.S.; Ngo, H.T.; Agard, J.; Arneth, A.; Balvanero, P.; Brauman, K.A.; Butchart, S.H.M.; Chan, K.M.A.; et al. Review Summary: Global Conservation: Pervasive human-driven decline of life on Earth points to the need for transformative change. Science 2019, 366, eaax3100. [Google Scholar] [CrossRef] [Green Version]
- Haberl, H.; Schulz, N.B.; Plutzar, C.; Erb, K.H.; Krausmann, F.; Loibl, W.; Moser, D.; Sauberer, N.; Weisz, H.; Zechmeister, H.G.; et al. Human appropriation of net primary production and species diversity in agricultural landscapes. Agric. Ecosyst. Environ. 2004, 102, 213–218. [Google Scholar] [CrossRef]
- Marques, A.; Martins, I.S.; Kastner, T.; Plutzar, C.; Theurl, M.C.; Eisenmenger, N.; Huijbregts, M.A.J.; Wood, R.; Stadler, K.; Bruckner, M.; et al. Increasing impacts of land use on biodiversity and carbon sequestration driven by population and economic growth. Nat. Ecol. Evol. 2019, 3, 628–637. [Google Scholar] [CrossRef] [PubMed]
- Millennium Ecosystem Assessment. Ecosystems and Human Well-Being: Synthesis; Island Press: Washington, DC, USA, 2005. [Google Scholar]
- Bommarco, R.; Kleijn, D.; Potts, S. Ecological intensification: Harnessing ecosystem services for food security. Trends Ecol. Evol. 2012, 28, 230–238. [Google Scholar] [CrossRef]
- Bekele, E.; Lant, L.; Soman, S.; Misgna, G. The evolution and empirical estimation of ecological-economic production possibilities frontiers. Ecol. Econ. 2013, 90, 1–9. [Google Scholar] [CrossRef]
- Smessaert, J.; Missemer, A.; Levrel, H. The commodification of nature, a review in social sciences. Ecol. Econ. 2020, 40, 106624. [Google Scholar] [CrossRef]
- Longo, S.B.; Clausen, R.; Clark, B. The Tragedy of the Commodity: Oceans, Fisheries, and Aquaculture; Rutgers University Press: New Brunswick, NJ, USA, 2015. [Google Scholar]
- Harvey, D. Spaces of Global Capitalism; Verso: Brooklyn, NY, USA, 2006. [Google Scholar]
- Polanyi, K. The Great Transformation; Beacon Press: Boston, MA, USA, 1944. [Google Scholar]
- Ciplet, D. Transition coalitions: Toward a theory of transformative just transitions. Environ. Sociol. 2022, 8, 315–330. [Google Scholar] [CrossRef]
- Krausmann, F.; Erb, K.H.; Ginfrich, S.; Haberl, H.; Bondeau, A.; Gaube, V.; Lauk, C.; Plutzar, C.; Searchinger, T.D. Global human appropriation of net primary production doubled in the 20th century. Proc. Natl. Acad. Sci. USA 2013, 110, 10324–10329. [Google Scholar] [CrossRef] [Green Version]
- Erb, K.-H.; Fetzel, T.; Plutzar, C.; Kastner, T.; Lauk, C.; Mayer, A.; Niedertscheider, M.; Korner, C.; Haberl, H. Biomass turnover time in terrestrial ecosystems halved by land use. Nat. Geosci. 2016, 9, 674–678. [Google Scholar] [CrossRef]
- Kastner, T.; Matej, S.; Forrest, M.; Gingrich, S.; Haberl, H.; Hickler, T.; Krausmann, F.; Lasslop, G.; Niedertscheider, M.; Plutzar, C.; et al. Land use intensification increasingly drives the spatiotemporal patterns of the global human appropriation of net primary production in the last century. Glob. Chang. Biol. 2022, 28, 307–322. [Google Scholar] [CrossRef]
- Paudel, S. Human appropriation of net primary production in the U.S., 1997−2012. Ph.D. Dissertation, Utah State University, Logan, UT, USA, 2022. [Google Scholar]
- USDA Economic Research Service. Feed Grains Data: Yearbook Tables. Available online: https://www.ers.usda.gov/data-products/feed-grains-database/feed-grains-yearbook-tables (accessed on 1 June 2022).
- USDA Economic Research Service. Oil Crops Yearbook. Available online: https://www.ers.usda.gov/data-products/oil-crops-yearbook.aspx (accessed on 1 June 2022).
- USDA Economic Research Service. U.S. BioEnergy Statistics. Available online: https://www.ers.usda.gov/data-products/u-s-bioenergy-statistics/ (accessed on 1 June 2022).
- Statista. Total United States Industrial Roundwood Imports and Exports from 2006 to 2018 (in Million Cubic Feet)*. 2022b. Available online: https://www.statista.com/statistics/252705/total-us-industrial-roundwood-imports-and-exports-since-2001/ (accessed on 1 June 2022).
- Statista. U.S. Cotton Exports 1990–2019. 2022c. Available online: https://www.statista.com/statistics/259415/us-cotton-exports-worldwide-since-1990/ (accessed on 1 June 2022).
- Richter, B.D.; Bartak, D.; Caldwell, P.; Davis, K.F.; Debaere, P.; Hoekstra, A.Y.; Li, T.; Marston, L.; McManamay, R.; Mekonnen, M.M.; et al. Water scarcity and fish imperilment driven by beef production. Nat. Sustain. 2020, 3, 319–328. [Google Scholar] [CrossRef]
- Kessler, J.; Sperling, D. Tracking U.S. biofuel innovation through patents. Energy Policy 2016, 98, 97–107. [Google Scholar] [CrossRef]
- Borras, S.M.; McMichael, P.; Scoones, I. The politics of biofuels and agrarian change: Editor’s introduction. J. Peasant Stud. 2010, 37, 575–592. [Google Scholar] [CrossRef] [PubMed] [Green Version]
- USDA. The Conservation Reserve Program: A 35-Year History. Available online: https://www.fsa.usda.gov/Assets/USDA-FSA-Public/usdafiles/Conservation/PDF/35_YEARS_CRP_B.pdf (accessed on 1 October 2022).
- Hornburg, A. Zero-Sum World: Challenges in conceptualizing environmental load displacement and ecologically unequal exchange in the world-system. Int. J. Comp. Sociol. 2009, 50, 237–262. [Google Scholar] [CrossRef]
- Givens, J.E.; Huang, X.; Jorgenson, A.K. Ecologically unequal exchange: A theory of global environmental injustice. Sociol. Compass 2019, 13, e12693. [Google Scholar] [CrossRef]
- Agricultural Marketing Resource Center (AgMRC). Available online: https://www.agmrc.org/commodities-products/grains-oilseeds/barley-profile (accessed on 1 June 2022).
- USA Rice. Exporting U.S. Rice. Available online: https://www.usarice.com/discover-us-rice/find-a-supplier/exporting-u.s.-rice (accessed on 1 June 2022).
- U.S. Sustainability. Fact Sheets: U.S. Dry Beans—A Global Leader in Sustainability. Available online: https://thesustainabilityalliance.us/u-s-dry-beans-fact-sheet (accessed on 1 June 2022).
- Index Mundi. 2022. Available online: https://www.indexmundi.com/agriculture/?country=us&commodity=oats&graph=feed-domestic-consumption (accessed on 1 June 2022).
- Agricultural Economic Insights (AEI). U.S. Almond Production and Consumption Trends. Available online: https://aei.ag/2021/05/17/united-states-almond-production-consumption-trends/ (accessed on 1 June 2022).
- Selina Wamucii. Available online: https://www.selinawamucii.com/insights/market/united-states-of-america (accessed on 1 June 2022).
- USDA. Potatoes 2019 Summary. Available online: https://www.nass.usda.gov/Publications/Todays_Reports/reports/pots0920.pdf (accessed on 1 June 2022).
- Statista, 2022a. U.S. Orange Imports and Domestic Exports from 1999 to 2018. Available online: https://www.statista.com/statistics/193870/us-total-orange-imports-and-exports-since-1999/ (accessed on 1 June 2022).
- USDA-NASS. Lentils: Production by Year, US and Major States. Available online: https://www.nass.usda.gov/Charts_and_Maps/Dry_Beans,_Dry_Peas,_and_Lentils/ltprod.php (accessed on 1 June 2022).
- Oelke, E.A.; Oplinger, E.S.; Bahri, H.; Durgan, B.R.; Putnam, D.H.; Doll, J.D.; Kelling, K.A. Alternative Field Crops Manual. University of Wisconsin-Extension and University of Minnesota Extension Service. Available online: https://hort.purdue.edu/newcrop/afcm/rye.html (accessed on 1 June 2022).
- US Apple. International Trade. Available online: https://usapple.org/policy-priority/international-trade (accessed on 1 June 2022).
- USDA. Pecan Industry Cracks Foreign Markets. Available online: https://www.usda.gov/media/blog/2012/02/02/pecan-industry-cracks-foreign-markets (accessed on 1 June 2022).
- Guan, Z.; Biswas, T.; Wu, F. The US Tomato Industry: An Overview of Production and Trade. University of Florida Extension. Available online: https://edis.ifas.ufl.edu/publication/FE1027 (accessed on 1 June 2022).
- Robobank. Five-Year Walnut Market Outlook. Available online: https://agfstorage.blob.core.windows.net/misc/FP_com/2021/02/17/Rab.pdf (accessed on 1 June 2022).
| Product | 1997 | 2002 | 2007 | 2012 | ||||
|---|---|---|---|---|---|---|---|---|
| MT | % | MT | % | MT | % | MT | % | |
| Grazing | 76 | 0.097 | 76 | 0.106 | 72 | 0.086 | 64 | 0.089 |
| Timber | ||||||||
| Softwood | 79 | 0.101 | 72 | 0.101 | 73 | 0.088 | 41 | 0.057 |
| Hardwood | 69 | 0.088 | 55 | 0.077 | 76 | 0.091 | 64 | 0.089 |
| Crops | ||||||||
| Corn Grain | 201 | 0.257 | 192 | 0.268 | 279 | 0.355 | 229 | 0.317 |
| Corn Silage | 16 | 0.020 | 17 | 0.024 | 18 | 0.022 | 11 | 0.015 |
| Winter Wheat | 53 | 0.068 | 32 | 0.045 | 42 | 0.05 | 45 | 0.062 |
| Spring Wheat | 18 | 0.023 | 13 | 0.018 | 15 | 0.018 | 17 | 0.024 |
| Soybeans | 73 | 0.093 | 73 | 0.102 | 71 | 0.085 | 80 | 0.111 |
| Alfalfa Hay | 50 | 0.064 | 45 | 0.063 | 45 | 0.054 | 33 | 0.046 |
| Cotton | 4 | 0.005 | 4 | 0.006 | 4 | 0.005 | 4 | 0.006 |
| Sorghum | 12 | 0.015 | 8 | 0.011 | 11 | 0.013 | 6 | 0.008 |
| Minor Crops | 128 | 0.164 | 128 | 0.179 | 128 | 0.153 | 128 | 0.177 |
| Total | 781 | 716 | 834 | 722 | ||||
| Allocation | Food | Feed | Fiber | Fuel | Exports | Food | Feed | Fiber | Fuel | Exports |
|---|---|---|---|---|---|---|---|---|---|---|
| Source | 1997 | 2002 | ||||||||
| Grazing | 0 | 1 | 0 | 0 | 0 | 0 | 1 | 0 | 0 | 0 |
| Timber | ||||||||||
| Softwood | 0 | 0 | 0.904 | 0 | 0.096 | 0 | 0 | 0.941 | 0 | 0.059 |
| Hardwood | 0 | 0 | 0.965 | 0 | 0.035 | 0 | 0 | 0.954 | 0 | 0.046 |
| Crops | ||||||||||
| Corn grain | 0 | 0.600 | 0 | 0.049 | 0.204 | 0.138 | 0.596 | 0 | 0.072 | 0.194 |
| Corn silage | 0 | 1 | 0 | 0 | 0 | 0 | 1 | 0 | 0 | 0 |
| Soybeans | 0 | 0.629 | 0 | 0.001 | 0.182 | 0.186 | 0.629 | 0 | 0.001 | 0.185 |
| Winter wheat | 0 | 0.051 | 0 | 0 | 0.430 | 0.432 | 0.106 | 0 | 0 | 0.462 |
| Spring wheat | 0 | 0.051 | 0 | 0 | 0.481 | 0.530 | 0.050 | 0 | 0 | 0.42 |
| Alfalfa hay | 0 | 1 | 0 | 0 | 0 | 0 | 1 | 0 | 0 | 0 |
| Cotton | 0 | 0 | 0.552 | 0 | 0.448 | 0 | 0 | 0.395 | 0 | 0.605 |
| Sorghum | 0 | 0.674 | 0 | 0 | 0.268 | 0.047 | 0.465 | 0 | 0 | 0.489 |
| Minor crops 1 | 0 | 0.516 | 0.001 | 0.005 | 0.161 | 0.318 | 0.516 | 0.001 | 0.005 | 0.161 |
| 2007 | 2012 | |||||||||
| Grazing | 0 | 1 | 0 | 0 | 0 | 0 | 1 | 0 | 0 | 0 |
| Timber | ||||||||||
| Softwood | 0 | 0 | 0.935 | 0 | 0.065 | 0 | 0 | 0.889 | 0 | 0.111 |
| Hardwood | 0 | 0 | 0.952 | 0 | 0.048 | 0 | 0 | 0.945 | 0 | 0.055 |
| Crops | ||||||||||
| Corn grain | 0 | 0.494 | 0 | 0.189 | 0.190 | 0.115 | 0.361 | 0 | 0.401 | 0.123 |
| Corn silage | 0 | 1 | 0 | 0 | 0 | 0 | 1 | 0 | 0 | 0 |
| Soybeans | 0 | 0.624 | 0 | 0.026 | 0.182 | 0.150 | 0.598 | 0 | 0.048 | 0.205 |
| Winter wheat | 0 | 0.097 | 0 | 0 | 0.433 | 0.420 | 0.109 | 0 | 0 | 0.471 |
| Spring wheat | 1 | 0 | 0 | 0 | 0.493 | 0.500 | 0 | 0 | 0 | 0.5 |
| Alfalfa hay | 0 | 1 | 0 | 0 | 0 | 0 | 1 | 0 | 0 | 0 |
| Cotton | 0 | 0 | 0.194 | 0 | 0.806 | 0 | 0 | 0.190 | 0 | 0.810 |
| Sorghum | 0 | 0.363 | 0 | 0.095 | 0.492 | 0.050 | 0.317 | 0 | 0.344 | 0.289 |
| Minor crops 1 | 0.318 | 1 | 0.001 | 0.005 | 0.161 | 0.318 | 0.516 | 0.001 | 0.005 | 0.161 |
Disclaimer/Publisher’s Note: The statements, opinions and data contained in all publications are solely those of the individual author(s) and contributor(s) and not of MDPI and/or the editor(s). MDPI and/or the editor(s) disclaim responsibility for any injury to people or property resulting from any ideas, methods, instructions or products referred to in the content. |
© 2023 by the authors. Licensee MDPI, Basel, Switzerland. This article is an open access article distributed under the terms and conditions of the Creative Commons Attribution (CC BY) license (https://creativecommons.org/licenses/by/4.0/).
Share and Cite
Lant, C.; Paudel, S.; Mueller, K.; Larson, G.; Ovando-Montejo, G.A.; Givens, J. Allocation of U.S. Biomass Production to Food, Feed, Fiber, Fuel and Exports. Land 2023, 12, 695. https://doi.org/10.3390/land12030695
Lant C, Paudel S, Mueller K, Larson G, Ovando-Montejo GA, Givens J. Allocation of U.S. Biomass Production to Food, Feed, Fiber, Fuel and Exports. Land. 2023; 12(3):695. https://doi.org/10.3390/land12030695
Chicago/Turabian StyleLant, Christopher, Suman Paudel, Kaeli Mueller, Grace Larson, Gustavo A. Ovando-Montejo, and Jennifer Givens. 2023. "Allocation of U.S. Biomass Production to Food, Feed, Fiber, Fuel and Exports" Land 12, no. 3: 695. https://doi.org/10.3390/land12030695
APA StyleLant, C., Paudel, S., Mueller, K., Larson, G., Ovando-Montejo, G. A., & Givens, J. (2023). Allocation of U.S. Biomass Production to Food, Feed, Fiber, Fuel and Exports. Land, 12(3), 695. https://doi.org/10.3390/land12030695