Abstract
Urbanization not only affects a region’s economic development but also impacts its land use structure. As the largest inland river basin in China, the Tarim River Basin has experienced rapid economic growth and urbanization in recent years, posing a serious threat to its soil and water resources and ecological sustainability. In this study, four remote sensing data products from 1990–2020 are selected to explore the distribution of land use types and their land structure changes in the basin in the context of rapid urbanization. The results show that the built-up land area increased by 2855.74 km2 during 1990–2020, mainly from the transfer of grassland and barren land. Furthermore, the migration of the center of gravity of built-up land moved from the desert to oasis areas, indicating that the urbanization process intensified during the study period. The overall trend is toward a continuous increase in arable and built-up land area and a continuous decrease in barren land. Future trends in the Tarim River Basin predict that arable land will decrease and that built-up land will continue to increase. However, the increase in built-up land will level off, mainly due to the transfer of arable land and grassland, which accounts for 37.94% and 20.40%, respectively. The migration characteristics of the center of gravity of each land type in the basin varied widely during 1990–2020, but the land structure will tend toward a gradual balance in the future. Therefore, in the context of increasing urbanization, focusing on the sustainable development of regional soil and water resources and ecology is crucial for the coordinated development of regional resources and economy.
1. Introduction
Lately, urbanization has received widespread attention, especially in relation to its impact on land use changes [1,2]. Urbanization mainly concerns the process of converting different types of agricultural land into urban built-up land, while, macroscopically, it refers to the process of expanding the scale of urban areas [3]. Urban land use change is the most direct expression of urban spatial expansion and is gradually becoming a hot topic in urban development [4]. Though contributing to higher levels of development and living standards, urbanization has also triggered the spatial expansion of densely populated built-up areas and their socio-economic activities [5]. Furthermore, rapid urbanization has caused a significant reduction in agricultural land, which, in turn, has caused irreversible changes in regional land use patterns and structures [6,7].
Several scholars have explored the impact of urbanization on sustainable land use and land use efficiency [8]. Studies investigating the relationship between urbanization and land use have focused on the sustainability of land use and sustainable urban development at different scales, including cities, urban agglomerations, and regions [9,10]. Urbanization not only reflects the development of the regional economy but also influences the land use structure of a region, causing significant changes in land use patterns [11,12]. Tian showed that urbanization often leads to a trade-off between soil conservation and net primary productivity (NPP) [13]. Wang used a combined CLUES-Markov-InVEST model to simulate the impacts of rapid urbanization on ecosystem services under different future scenarios [14]. Due to its substantial influence on sustainability and sustainability goals, rapid urbanization and development need to be studied in the context of regional land use pattern and land structure changes in order to optimize these trends.
The rapid development of society cannot be achieved without adequate land resources, as such resources provide space for humans to live and area suitable for agriculture, animal husbandry, industry, and transportation infrastructure [15]. Land is the main carrier of social production and life, and it reflects different economic development patterns and land management strategies. These processes are closely linked to climate change, human-land relations, and ecological construction [16]. Land use/cover change has become a popular way to study the relationship between humans and nature. It is also the most intuitive way to express the interaction between human production, life, and ecosystems [17]. Urbanization has accelerated in recent years, and the ecological effects in the context of urbanization can be analyzed through LUCC and land type transformations across different periods [18]. Du found that the ecological effects of LUCC due to increasing urbanization are more significant [19]. The current land use prediction simulation models used for future LUCC mainly include the CA-Markov model, the PLUS model, the gray prediction model, CLUE-S, and the artificial neural network model [20,21,22,23]. Although the relevant research shows that all these prediction models have achieved fruitful results, the CA-Markov models are most often used in land use simulations because of their advantages in spatio-temporal representation and simulation accuracy [24,25]. Driven by increasing urbanization, the study of LUCC has a positive effect on the trend of regional land structure and pattern evolution, and helps to alleviate the conflict between human and land relations [26].
Any increase in resource exploitation affects regional land use patterns, types, and structures to varying degrees [27,28]. Since the start of the 21st century, land use activities have intensified globally, with large-scale land development in particular leading to increasing demand for land [29]. Land use change is closely related to the interconversion between different land types in time and space, with the two processes interacting with each other [30]. Moreover, with the booming global economy over the past few decades, urbanization has intensified and land resources have been continuously developed, leading to deepening conflicts between people and land and causing regional ecological degradation [31,32]. Despite being the largest inland river basin in China, the Tarim River Basin is also ecologically fragile. Ecological security is related to people’s well-being, sustainable economic and social development, and long-term peace and security. It is also an indispensable and important part of national security [33,34]. The process of desertification in the basin is disrupting the harmonious development of the human-land relationship, leading to immense challenges. These need to be overcome, as ecological protection and ecological civilization construction are crucial to the economic development and social stability of the region [35].
The continuous economic growth, rapid urbanization, and exploitation of regional resources in the Tarim River Basin have resulted in the uncontrolled development of land resources and the over use of groundwater. This has led to a series of ecological problems, such as the degradation of regional grasslands and ecological function of local rivers and lakes, unstable land structure, uncoordinated soil and water resources, and decline in biodiversity [36,37,38]. This paper combines the China Land Cover Dataset (CLCD) remote sensing data products from 1990–2020 to carry out research and analysis on the distribution of land use types and changes in their land structure in the Tarim River Basin in the context of increasing urbanization. Exploring the distribution of land use types and changes in their land structure in the Tarim River Basin for both the current and future periods is important for promoting the coordinated and rational development of regional land resources, without which sustainable growth in the region is impossible.
2. Materials and Methods
2.1. Study Area
The Tarim River Basin is located at the southern foot of the Tianshan Mountains, in the mid-latitude Eurasian hinterland between the Tianshan Mountains and the Kunlun Mountains (73°10′–94°05′ E, 34°55′–43°08′ N) (Figure 1). It covers about 102 × 104 km2, accounting for 61.4% of the total area of Xinjiang. The Tarim River Basin is also the largest inland river basin in China and includes 114 rivers in 9 major water systems [39,40]. The watershed covers a rich geographical landscape of high mountains, river valleys, grasslands, etc. The main soil types are wind sand soil, oasis tide soil, meadow soil, salt soil, etc., of which wind sand soil has the most extensive area. The vegetation type is desert and bare desert zones and the distribution of mountain vegetation shows a vertical differentiation pattern, mainly Populus euphratica and Tamarix chinensis [41]. The basin is situated far from the ocean and has a continental arid climate that features general aridity and large temperature differences. The average annual precipitation is about 51.2 mm, the evaporation potential is as high as 2000–3000 mm, and the surface runoff is about 398 × 108 m3, classifying the Tarim River Basin as a water shortage area [42,43].
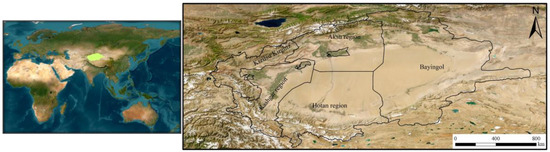
Figure 1.
Sketch map of the Tarim River Basin (GS (2019) 1652) (http://www.resdc.cn (accessed on 6 March 2023)).
2.2. Data Source
The land use/cover data were obtained from China Land Cover Dataset (CLCD). Four phases of data with a spatial resolution of 30 m × 30 m were selected for 1990, 2000, 2010, and 2020. The CLCD data were based on 5463 visually interpreted samples with an overall accuracy of 79.31%. Further testing and evaluation based on a large number of samples showed that the overall accuracy of CLCD was better than that of MCD12Q1, ESACCI_LC, FROM_GLC, or GlobaLand30 [44]. The CLCD dataset presented in this paper is freely available at the following website (http://doi.org/10.5281/zenodo.4417810, accessed on 20 February 2023). The attribute data were obtained from the Xinjiang Splendid 50 Years and Xinjiang Statistical Yearbook (1990–2020).
2.3. Data Validation
In this study, the confusion matrix and Kappa coefficient methods are used to evaluate the accuracy and precision of using remote sensing interpretation [45]. The classification accuracy of each land type in the study area is shown in Table 1.
where is the proportion of correctly simulated rasters, is the desired proportion of correctly simulated rasters, is the proportion of correctly simulated rasters under ideal classification, n is the total number of rasters, is the number of correctly simulated rasters, and n is the number of land use types (n = 6 in this study).

Table 1.
Image classification accuracy table.
2.4. Land Use Dynamic Attitude Model
This model can quantitatively describe the rate of quantitative change of a certain land use type within a certain timeframe in the study area [46].
where K is the degree of dynamic change of a land type during the study period, Ua and Ub denote the area of that land use type at the beginning and end of the study period, respectively, and T is the length of the study time.
2.5. Land Use Transfer Matrix
The land use transfer matrix reflects the dynamic process of area shifts between each land use type in the study area at the beginning and end of the study period [47].
where S denotes the area; i, j (i, j = 1, 2...; n) indicate the land use types before and after transfer; describes the area of LUCC from type i to j; and n represents the number of land use types before and after transfer.
2.6. Land Use Center of Gravity Model
The center of gravity of the land use is characterized using the center of gravity model. Assuming that a region consists of n sub-level regions [48,49], the expression for the coordinates of the center of gravity is:
where Xti and Yti denote the latitude and longitude coordinates of the center of gravity of a land resource in year t, respectively; St denotes the area of the land resource in the i small area; and Xi and Yi denote the latitude and longitude coordinates of the geometric center of the i area, respectively.
The center of gravity shift distance of the adjacent years will then be:
2.7. Information Entropy and Equilibrium Degree of Land Use Structure
The information entropy (H) and the land use structure equilibrium degree (E) are introduced to measure the equilibrium of the land use structure together [50,51].
In the above two equations, m and Pi denote the number of land use types and the proportion of the area of the category i land use type, respectively.
2.8. CA-Markov Model
The Markov model is a method for predicting the probability of time occurrence based on the Markov chain process theory [52,53].
where S(t+1) is the system state in period t + 1, and Pij is the state transfer probability matrix.
3. Results
3.1. Evolution of Land Use Patterns
3.1.1. Land Use/Cover Change
During 1990–2020, significant changes in land use occurred in the Tarim River Basin (Figure 2). The main manifestations are the continuous increase in the area of arable land and built-up land and the continuous decrease in the area of barren land. The new arable land during the period covered an expanse of 18,730.16 km2, with a growth rate as high as 57.41%. The increased area was mainly located in the middle and upper reaches of the Tarim River Basin, mostly concentrated in the lower reaches of the Kashgar River, the lower reaches of the Aksu and Weigan-Kuqu Rivers, and the middle and lower reaches of the Kaidu-Kongque River, with a small portion concentrated in the Hotan, Kriya, and Qarqan rivers. The area of barren land decreased by 20,154.80 km2, with the most obvious decrease occurring in the middle reaches of the basin.
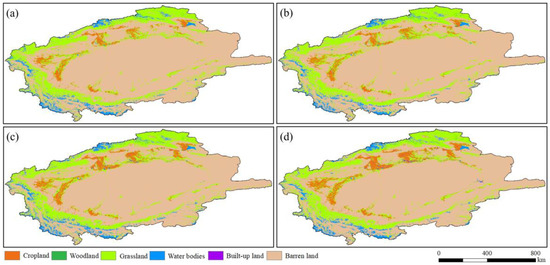
Figure 2.
Land uses in the Tarim River Basin from 1990 to 2020. (a): 1990, (b): 2000, (c): 2010, and (d): 2020.
The overall change in water bodies was not significant. However, the area of land for construction significantly increased, with a total increase of 2855.74 km2. Woodland experienced the second largest change, which mostly occurred in the upper and middle reaches of the Tarim River Basin. Meanwhile, the area of grassland showed a slight decline. Since 1990, the ranking of different land use/cover types in the study area has remained constant, except for the area of woodland that was larger than that of built-up land before 2010, showing barren land > grassland > cropland > water bodies > built-up land > woodland.
3.1.2. Land Use Dynamic Attitude Change
The land use dynamics of the Tarim River Basin by type significantly changed at different times during the study period (Table 2). Among them, the built-up land use dynamics in the basin were as high as 40.48% between 1990 and 2000, which is mainly due to the small initial area of built-up land. It also reflects the significant expansion of urban land and the increasing urbanization that occurred during the period. The dramatic change in woodland dynamics is similar to that of the built-up land, at 9.54%. Furthermore, the land use dynamics of cropland were 0.80%, indicating the same trend of the expansion of cropland during the period. In contrast, there was little change in grassland. The dynamic attitudes of land use in the water bodies and barren land were only −0.35% and −0.03%, respectively, which are smaller than other land types. The area of barren land was decreasing.
Table 2.
Land use dynamic attitude in the Tarim River Basin, 1990–2020 (%).
During the period 2000–2010, the built-up land dynamic attitude was still the highest (27.64%), although it decreased compared to the previous period. However, the new area of built-up land during the period was still much larger than the previous period, indicating that the change in the built-up land area was very dramatic and that the urbanization expansion was significant. This is followed by arable land, with a dynamic attitude of 2.36%. There was an increasing trend in arable land expansion compared to the previous period, with 2000–2010 being the most significant period of arable land expansion. The water body motility was 1.66%, indicating an increasing trend in water bodies across the Tarim River Basin. This increase was likely due to the accelerated melting of the alpine snowpack. Meanwhile, the expansion trend of the woodland area was weak (0.92%), the change in grassland was not obvious, and barren land continued its decreasing trend.
From 2010 to 2020, all land types showed a decreasing trend, except for the built-up land, woodland, and arable land, which continued to increase in area. Among these latter three, the highest land use motive attitude was 7.99% for built-up land, indicating significant urbanization expansion as the urbanization continued to advance. The kinetic attitude of woodland and cropland was 2.28% and 1.79%, respectively, which also represents an increasing trend for these two land types. In contrast, the area of grassland and barren land still shows a decreasing trend, with the decrease in the grassland area intensifying. However, the decreasing trend in the area of barren land was slowing down, resulting in kinetic attitude decreases of −0.04%. The main features of LUCC in the Tarim River Basin throughout the study period include a significant increase in land for construction, a continuous expansion of arable land, a steady increase in the area of woodland, and a significant reduction in barren land.
3.1.3. The Relationship between Built-Up Land and Social Economy
Since 1990, the trends in the built-up land and GDP within the Tarim River Basin have been positively correlated (Figure 3a). Among them, the new built-up land area was 2856 km2 and the GDP rose by a total of RMB 404.6 billion, indicating that, with the increasing urbanization process, it has a positive effect on the rapid development of the social economy. In particular, the city has a basically similar rising trend between 1990 and 2010. At the same time, we further illustrate the impact of changes in built-up land on regional economic development based on the spatial variation in the built-up land within the watershed during the study period. According to the spatial pattern of built-up land in each period in Figure 2, we found that the built-up land increased significantly from 1990 to 2000 mainly in the main streams of the Weigan-Kuqu and Tarim rivers, while the regions corresponding to the change in GDP in time rose more in the Aksu region and Bayingol. From 2000 to 2010, the rise in the built-up land area was concentrated in locations near the Aksu and Kaidu-Kongque river basins, and, similar to the previous period, it was still the Aksu region and Bayingol that experienced the greater increase in GDP. During the period 2010–2020, in addition to the significant GDP growth in the Aksu region and Bayingol, there is also the Kashgar region, so the basins where built-up land is spatially evident are the Qarqan river, Tarim river, and Yarkand river basin, respectively. The relationship between the built-up land area and GDP is strong, both temporally and spatially, and the changes in the built-up land within the watershed have a positive impact on the regional economy.
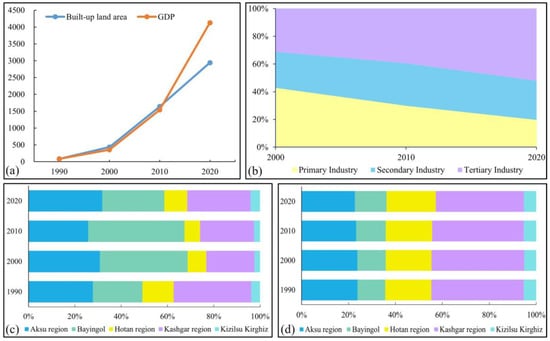
Figure 3.
Changes in built-up land area and GDP in the Tarim River Basin from 1990 to 2020. (a): Trends in built-up land and GDP, (b): Industrial structure of the basin in each period, (c): Percentage of GDP in each region, and (d): Percentage of population in each region.
In addition, we analyzed the socio-economic aspects using the industrial structure and population (age structure and education). The industrial structure shows an overall decreasing trend in the share of primary and secondary sectors, with a significant decrease in the primary sector and a clear increase in the tertiary sector, with a total increase of 20.84%. With the rapid socio-economic development, the trend of population expansion has intensified, including the trend of population aging (age over 65 years old) increasing and the trend of culture and education also significantly increasing.
3.2. Analysis of Land Use Structure Change
3.2.1. Land Use Type Transfer
As shown by the land type transfer matrix of the Tarim River Basin from 1990 to 2020, the area conversion between land types was frequent. The analysis of the interconversion between land types for the whole period can be seen in Table 3. As presented in the table, the conversion between arable land, grassland, and barren land is very prominent, with the increase in the arable land area occurring mainly from the conversion of grassland and barren land. The conversion of grassland to arable land represents 57.82% of the increase in arable land area during the period. This increase is concentrated in the lower reaches of the Weigan-Kuqu and Yarkand rivers and near the middle and lower reaches of the Aksu River. The conversion of barren land to arable land, which accounts for 45.07%, is more significant in the middle and lower reaches of the Weigan-Kuqu and Kaidu-Kongque rivers. The expanding area of built-up land in the basin is mainly converted from arable land, grassland, and barren land, with the converted area accounting for 18.07%, 48.01%, and 30.68%, respectively, of the new area of built-up land. The converted land is mainly concentrated near the lower reaches of the Aksu, Weigan-Kuqu, and Qarqan rivers. In contrast, the increase in woodland was the result of grassland conversion, with a conversion share of 54.14%.
Table 3.
Land Type Transfer Matrix 1990–2020 (km2).
Overall, the area of grassland and barren land significantly decreased in the Tarim River Basin throughout the study period and was transformed into other land types. The main transformations were grassland into cropland, built-up land, and woodland, and barren land into cropland, grassland, and built-up land.
3.2.2. Land Use Type Gravity Shift
The spatial migration characteristics of the center of gravity for each land use type in the Wood River watershed varied considerably during 1990–2020 (Figure 4). The center of gravity of the cropland shifted from east to southwest, moving a total distance of 5.33 km. The shift occurred in two stages: the first was an east-to-southwest movement during 2000–2010, and the second was a southeast movement during 2010–2020. This shift in cropland is mainly due to the rise in population in the study area, which increased the demand for arable land and the need to reclaim more land for human livelihood. The center of gravity of woodland mainly migrated from northeast to southwest, moving the greatest distance (5.89 km) during 2010–2020, while grassland’s center of gravity migrated from southeast to northwest, then southwest, and finally northeast after 2010, shifting 6.59 km in total. The center of gravity of water bodies migrated 5.73 km over the 30-year period, generally in a southwest-to-northeast direction.
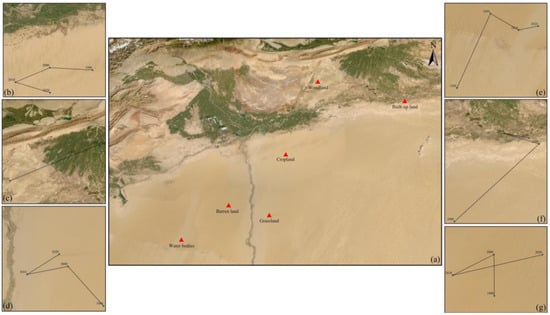
Figure 4.
Migration of center of gravity of different land types in the Tarim River Basin from 1990 to 2020 (Figure (a) shows the center of gravity of each land type in 2020, and Figures (b–g) show the migration trajectories of the center of gravity of cropland, forest land, grassland, water bodies, built-up land, and unused land, respectively).
The center of gravity of built-up land moved the most (10.05 km) during 1990–2000. However, the direction of migration shifted twice—once to the northwest and once to the southeast—with the overall movement trending from the desert to the oasis areas. For barren land, the overall center of gravity moved from south to northeast, for a total migration distance of 6.74 km.
3.2.3. Regional Land Structure Change
By calculating and analyzing the entropy and equilibrium of land use information for the Tarim River Basin in 1990, 2000, 2010, and 2020, we found that both the entropy and equilibrium showed an increasing trend (Figure 5). The entropy of land use increased rapidly during 2000–2010, indicating that the disorderly land use system drastically changed in this period. The trend then slowed during 2010–2020, with changes in the area of arable land and grassland playing an important role in this process. Similar to entropy, the equilibrium of the land use trend saw an increase in value, rising from 0.55 in 1990 to 0.59 in 2010, and then jumping substantially after 2010. The overall results show that the land use structure of the Tarim River Basin gradually tends to be balanced after 2010, and the balance of the distribution of various land structures tended to improve by 2020.
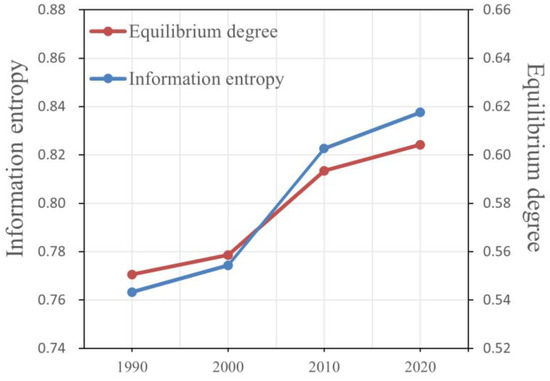
Figure 5.
Change of land use information entropy and equilibrium degree.
3.3. Future Land Structure Changes under Increasing Urbanization
3.3.1. Future Changes by Land Type
We selected the CA-Markov model to simulate the land use pattern changes predicted from 2020 to 2030 in the Tarim River Basin at both temporal and spatial scales. Figure 6 and Table 4 show an increase in the area of grassland, woodland, water bodies, and built-up land as well as a decrease in the area of barren land and arable land. As can be seen, the area of land for construction is anticipated to continue to increase, but the degree of change will gradually slow, with a dynamic attitude of 0.94%. The area of woodland, on the other hand, will significantly increase, with a dynamic attitude of 11.04% indicating a very drastic change. Grasslands and water bodies are also expected to increase. The area of grassland will expand by 8.37%, mostly in the lower reaches of the Kashgar and Weigan-Kuqu rivers and the Kriya and Qarqan river basins. Additionally, water bodies will expand by 1.22%, primarily in the upper reaches of the Tarim River Basin and in the middle and lower reaches of the Tarim River itself. During the same period, the arable land area is anticipated to decrease by 6968.70 km2, with a dynamic attitude of −1.36%. This decrease is mainly concentrated in the Kashgar river and the lower reaches of the Weigan-Kuqu, Aksu, and Yarkand rivers. Additionally, the utilized land will decrease by 15,933.22 km2, or 2.16%, mainly in the middle and lower reaches of the Tarim River Basin. Since 1990, the built-up land area in the basin has increased by 3133.67 km2, with a dynamic attitude of 91%. This indicates that the urbanization process in the region has intensified throughout the period and the growth rate has increased rapidly. The area of arable land and grassland is also on the rise, while the area of barren land has decreased by 4.75%.
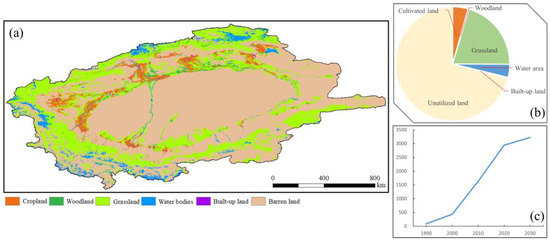
Figure 6.
Land use changes in the Tarim River Basin in future periods. Figure (a) shows the land use changes in the watershed in 2030. Figure (b) shows the percentage of land types in the watershed in the future period. Figure (c) shows change in built-up land area during the period.
Table 4.
Land use dynamic attitude in the Tarim River Basin, 1990–2020 (%).
3.3.2. Basin Land Use Type Transfer Characteristics
The intensification of regional urbanization causes changes in local land use patterns, which, in turn, has a significant impact on the regional land use structure as urbanization progresses. By selecting land use data from 2010 and 2020 for the simulation projection in 2030, we analyzed the evolution pattern of land use structure change in the Tarim River Basin with the current intensification of urbanization and the process of interconversion of different land use types. Our aim was to explore the relationship between urban development and land structure in the basin in the near future.
By analyzing the transformation between different land types during the chosen period, we found that the transformation between land types occurred quite frequently (Figure 7). The main feature was the mutual transformation between arable land, grassland, built-up land, and barren land. During 2020–2030, the area of built-up land is anticipated to mainly change with the transfer of arable land, grassland, and barren land, as well as other land types. The conversion of arable land and grassland to built-up land will be the main reason for the expansion of built-up land, accounting for 37.94% and 20.40% of the built-up land area, respectively. In addition to the conversion to built-up land, most of the arable land will convert to woodland, grassland, and barren land, especially in the lower reaches of the Kaidu-Kongque, Weigan-Kuqu, Kashgar, and Yarkand rivers. A significant reduction in the grassland area will mainly occur in the lower reaches of the Kaidu-Kongque River and the middle and lower reaches of the Qarqan River, mostly converting to barren land, with a conversion ratio of 20.24%. A small portion of grassland will also convert to woodland and water bodies.
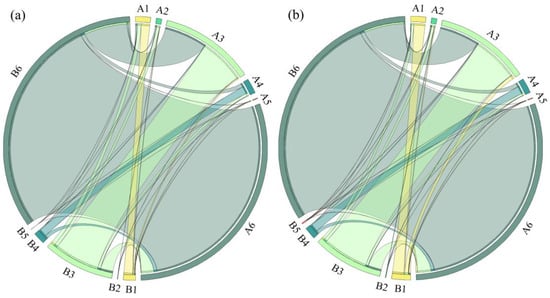
Figure 7.
Map of future land use shifts in the Tarim River Basin. (a): 2020–2030 and (b): 1992–2030. From A1 to A6 are the land types in the starting years, while B1–B6 are land types in the end years. (A1/B1: Cropland, A2/B2: Grassland, A3/B3: Woodland, A4/B4: Built-up land, A5/B5: Water bodies, and A6/B6: Barren land).
Meanwhile, the conversion of barren land to grassland and water bodies will mostly occur in the Weigan-Kuqu, Yarkand, and Kriya rivers. Cropland, grassland, and barren land emerge as the three most active land types. The transformation of arable land in the oasis is obvious, but the transformation magnitude decreases significantly. Specifically, the transformation of arable land and barren land to grassland is mainly concentrated in the middle reaches of the Tarim River Basin, while the areas transformed into barren land are mainly the Kaidu-Kongque, the Aksu, and the Qarqan rivers. Additionally, there is a transformation of cropland, grassland, and barren land to woodland, water bodies, and built-up land, leading to an increase in the area of the latter three land types.
3.3.3. Characteristics of Land Use Type Gravity Shift and Land Structure Change
Based on the model simulation results, we found that the migration characteristics of the center of gravity for each land type in the Tarim River Basin for the future period (up to 2030) are not the same as previous characteristics (Figure 8). The center of gravity for arable land changed from the earlier southwest-to-northwest migration route, and woodland was notably different, shifting from a northeast-to-southwest direction to a northwest-to-southeast one. The migration trajectories of the center of gravity for grassland and water bodies both moved from west to east at migration distances of 7.76 km and 9.71 km, respectively. Major changes also occurred in the center of gravity’s migration direction for built-up land in the 2020–2030 period, shifting 25.42 km northeast to southwest. This represented the longest migration among all land types, which indicates that the trends for built-up land in the future will likely continue to drastically change. In other words, the urbanization process will continue its rapid increase. The center of gravity for barren land is opposite to that for built-up land, moving from northwest to southeast at a relatively short distance of 7.10 km.
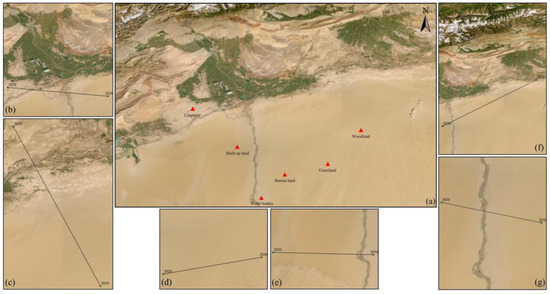
Figure 8.
Migration of the center of gravity of different land types in the Tarim River Basin in the future period. (Figure (a) shows the center of gravity of each land type in 2030, and Figure (b–g) show the migration trajectories of the centers of gravity of cultivated land, forest land, grassland, water bodies, built-up land, and unused land, respectively).
Finally, the entropy and equilibrium of land use information in the Tarim River Basin for 2020–2030 is combined to measure future changes in the land structure in the context of increasing urbanization. Both entropy and equilibrium tend to increase, but the variability slows down compared to pre-2020. The overall results indicate that the land use structure of the Tarim River Basin will gradually tend toward balance in the near future, as will the distribution of each land type.
4. Discussion
4.1. Model Accuracy and Applicability
The CA-Markov model has the advantage of being able to simulate and predict land use patterns in future periods based on land use data from historical periods. Hence, it is widely used in urban area planning and land use forecasting [54,55]. However, the model may overestimate or underestimate the area of different land use types in the process of simulation or prognosis [56,57,58]. We simulated future (2030) land use changes in the Tarim River Basin using the CA-Markov model. To ensure the accuracy of the model simulation, we compared the actual data of the Tarim River Basin in 2015 with the simulation results for validation (Figure 9). The simulated land use data were found to be consistent with the actual data, with the only inconsistent areas being grassland and water bodies. According to related studies, the Kappa index has a high consistency of results if it varies between 0.80 and 1 [45,59]. The Kappa index of the simulation results in this paper is 0.89, which indicates that the CA-Markov model is highly reliable for simulating land use changes in the Tarim River Basin, and, thus, can realistically predict the evolution of future land use patterns.
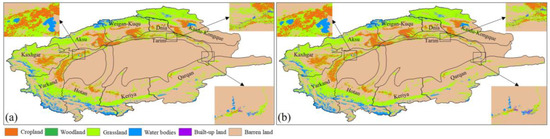
Figure 9.
Map of simulated and actual land use change in the Tarim River Basin in 2015. (a): Actual result (b): Simulation result.
4.2. Causes Associated with Increased Urbanization
During the period 1990–2020, the overall center of gravity of the built-up land moved from the desert to the oasis areas. This shows that the urbanization process occurring in the Tarim River Basin intensified during the study period, with rapid economic development resulting in an increased demand for built-up land. Nighttime light levels can reflect the degree of urbanization in an area, while nighttime light data can also monitor regional urbanization processes and expansion [60,61]. According to the results of Wang’s study, the lit area of the Tarim River Basin shows an increasing trend, which also indicates the rapid urbanization in the basin [62]. With the rapid population growth and economic development, the total population increased from 7,128,500 to 11,951,700 during 1990–2020, for an increase of 67.66%. The rise in demand for land in conjunction with corresponding government policies led to a significant expansion of arable land [63]. Similarly, with the rapid socio-economic development in the basin, the regional GDP dramatically increased, rising from CNY 8.156 billion in 1990 to CNY 412.712 billion in 2020. The significant increases in various industries and GDP per capita, coupled with the encouragement of local governments and the driving force of national policies, resulted in the continuous urbanization and expansion of built-up land area [47]. Wang also believes that regional planning policies can influence the degree of urbanization [64]. Thus, the significant increase in the area of arable land and built-up land is mainly dominated by human activities, while the demand for land and food is directly proportional to the area of arable land and residential land as the population continues to increase. Due to the large base and proportion of the current agricultural population coupled with rapid socio-economic development, the increase in the population will inevitably intensify the urbanization. This will lead to increasing contradictions in urban land use, which will, in turn, affect the changes in the pattern of land types in the region.
4.3. Recommendations and Strategies for Land Development
Since 1990, the encroachment of cropland on grassland and barren land throughout the region simultaneously occurred with the continuous development and conversion of cropland, grassland, and barren land into built-up land. This land type transfer was especially prominent in the oasis areas in the middle and upper reaches of the basin, reflecting the simultaneous expansion of cropland and urbanization processes. The large-scale human exploitation of the oases from 1990 to 2020 was one of the main reasons for the land use transformations. We found, based on the simulation results, that the area transferred in for built-up land in the future period is much larger than the area transferred out, and that the area of built-up land in the watershed increases significantly. As urbanization intensifies, it promotes regional economic development, but it may also be accompanied by ecological problems [65,66]. The demand for land varies from locale to locale, and the land structure likewise varies [67]. Regional land use change is not only critical but is considered a major indicator of climate change and global ecology [68]. Under the rapid urbanization process, great attention must be paid to the relationship and contradiction between economic development and ecological protection. In addition, because urbanization is intensifying, there is a continuous increase in the built-up land area and urban population. This increase is leading to a major growth in water consumption, imposing a serious burden on water resources and inevitably leading to changes in the regional land use pattern and structure [69]. These changes, when coupled with the extremely fragile ecosystem of the watershed, increasing land exploitation, and land desertification, will eventually lead to the imbalance of water and soil resources and result in further conflicts between supply and demand [70].
Accelerated urbanization is of great significance to regional economic and social development. However, maintaining regional land structure and ecological development while promoting urbanization is a difficult problem to solve [71]. Therefore, decision makers should link socio-economic and sustainable development in the urban development process while improving urban land utilization and adjusting the functional zoning and industrial land use structure of a city. In particular, considering the impact and sustainability of increasing urbanization on regional soil, water resources, and ecological development and promoting the ecological, economic, and social benefits of land use is essential for the coordinated development of regional resources and ecological security.
5. Conclusions
During 1990–2020, the distribution of land types in the Tarim River Basin was mainly characterized by a continuous increase in arable and built-up land and a continuous decrease in barren land. The arable land increased by 57.41%, the area of built-up land increased by a total of 2855.74 km2, and the area of barren land decreased significantly in the middle reaches of the Tarim River Basin. During the 30-year period, the area conversion between land types was frequent. This mainly manifested in the transformation of grassland into arable land, built-up land, and woodland, and the continuous development and utilization of barren land into arable land, grassland, and built-up land. The migration of the center of gravity of built-up land was characterized by a shift from desert areas to oasis areas, indicating increasing urbanization in the basin during this period.
Increases in urbanization will also affect future regional land use structures. According to the simulation results, we found that the arable land area in the watershed would decrease in 2020–2030. Meanwhile, the built-up land area would continue to increase, but the increase would be flat and mainly involve transfers from arable land and grassland, accounting for 37.94% and 20.40%, respectively. The migration characteristics of the center of gravity of each land type in the future watershed greatly vary. For built-up land, the center of gravity migration distance is expected to be the longest and shift from the northeast to the southwest, providing a clear indication that the urbanization process will continue into the future. In the context of rapid urbanization, it is necessary to focus on the impact and sustainability of increased urbanization on regional soil and water resources and ecological development, which is crucial for the coordinated and sustainable development of regional resources and the economy.
Author Contributions
Y.H. and Y.C. conceived the original design of this paper. Z.L. put forward valuable suggestions for this article. Y.W. improved the structure of the paper. All authors have read and agreed to the published version of the manuscript.
Funding
The research is supported by the International Cooperation program of Chinese Academy of Sciences (131965KYSB20210045) and the National Natural Science Foundation of China (52161145102).
Data Availability Statement
The data presented in this study are available on request from the corresponding author.
Conflicts of Interest
The authors declare no conflict of interest.
References
- Xie, H.; Zhang, Y.; Duan, K. Evolutionary overview of urban expansion based on bibliometric analysis in Web of Science from 1990 to 2019. Habitat Int. 2020, 95, 102100. [Google Scholar] [CrossRef]
- Tolessa, T.; Senbeta, F.; Kidane, M. The impact of land use/land cover change on ecosystem services in the central highlands of Ethiopia. Ecosyst. Serv. 2017, 23, 47–54. [Google Scholar] [CrossRef]
- Zhang, Z.; Liu, F.; Zhao, X.; Wang, X.; Shi, L.; Xu, J.; Yu, S.; Wen, Q.; Zuo, L.; Hu, S.; et al. Urban expansion in China based on remote sensing technology: A review. Chin. Geogr. Sci. 2018, 28, 727–743. [Google Scholar] [CrossRef]
- Kasimu, A.; Tang, B.; Tulake, G. Analysis of the spatial-temporal dynamic changes of urban expansion in oasis of Xinjiang based on RS and GIS. J. Glaciol. Geocryol. 2013, 35, 1056–1064. [Google Scholar]
- Li, P.; Cao, H. Comprehensive assessment on the ecological stress of rapid land urbanization per proportion intensity and location. Ecosyst. Health Sustain. 2019, 5, 242–255. [Google Scholar] [CrossRef]
- Hou, Y.; Zhou, S.; Burkhard, B.; Müller, F. Socioeconomic influences on biodiversity, ecosystem services and human well-being: A quantitative application of the DPSIR model in Jiangsu, China. Sci. Total Environ. 2014, 490, 1012–1028. [Google Scholar] [CrossRef] [PubMed]
- Łowicki, D.; Walz, U. Gradient of Land Cover and Ecosystem Service Supply Capacities-A Comparison of Suburban and Rural Fringes of Towns Dresden (Germany) and Poznan (Poland). Procedia Earth Planet. Sci. 2015, 15, 495–501. [Google Scholar] [CrossRef]
- Deng, C.; Liu, J.; Nie, X.; Li, Z.; Liu, Y.; Xiao, H.; Hu, X.; Wang, L.; Zhang, Y.; Zhang, G.; et al. How trade-offs between ecological construction and urbanization expansion affect ecosystem services. Ecol. Indic. 2021, 122, 107253. [Google Scholar] [CrossRef]
- Pérez-Soba, M.; Paterson, J.; Metzger, M.J.; Gramberger, M.; Houtkamp, J.; Dave Murray-Rust, A.J.; Verkerk, P.J. Sketching sustainable land use in Europe by 2040: A multi-stakeholderparticipatory approach to elicit cross-sectoral visions. Reg. Environ. Chang. 2018, 18, 775–787. [Google Scholar] [CrossRef]
- Zitti, M.; Ferrara, C.; Perini, L.; Carlucci, M.; Salvati, L. Long-Term Urban Growth and Land Use Efficiency in Southern Europe: Implications for Sustainable Land Management. Sustainability 2015, 7, 3359–3385. [Google Scholar] [CrossRef]
- Zhang, F.; Yushanjiang, A.; Jing, Y. Assessing and predicting changes of the ecosystem service values based on land use/cover change in Ebinur Lake Wetland National Nature Reserve, Xinjiang, China. Sci. Total Environ. 2019, 656, 1133–1144. [Google Scholar] [CrossRef]
- Sun, Q.; Qi, W.; Yu, X. Impacts of land use change on ecosystem services in the intensive agricultural area of North China based on Multi-scenario analysis. Alex. Eng. J. 2021, 60, 1703–1716. [Google Scholar] [CrossRef]
- Tian, Y.; Wang, S.; Bai, X.; Luo, G.; Xu, Y. Trade-offs among ecosystem services in a typical Karst watershed, SW China. Sci. Total Environ. 2016, 566, 1297–1308. [Google Scholar] [CrossRef] [PubMed]
- Wang, R.; Bai, Y.; Alatalo, J.M.; Yang, Z.; Yang, Z.; Yang, W.; Guo, G. Impacts of rapid urbanization on ecosystem services under different scenarios—A case study in Dianchi Lake Basin, China. Ecol. Indic. 2021, 130, 108102. [Google Scholar] [CrossRef]
- Yang, H.; Zhong, X.; Deng, S.; Xu, H. Assessment of the impact of LUCC on NPP and its influencing factors in the Yangtze River basin, China. Catena 2021, 206, 105542. [Google Scholar] [CrossRef]
- Li, Z.; Li, M.; Xia, B. Spatio-temporal dynamics of ecological security pattern of the Pearl River Delta urban agglomeration based on LUCC simulation. Ecol. Indic. 2020, 114, 106319. [Google Scholar] [CrossRef]
- Hu, C.; Zhang, L.; Wu, Q.; Soomro, S.E.H.; Jian, S. Response of LUCC on runoff generation process in Middle Yellow River Basin: The Gushanchuan Basin. Water 2020, 12, 1237. [Google Scholar] [CrossRef]
- Jin, G.; Deng, X.; Chu, X.; Li, Z.; Wang, Y. Optimization of land-use management for ecosystem service improvement: A review. Phys. Chem. Earth 2017, 101, 70–77. [Google Scholar] [CrossRef]
- Du, X.; Huang, Z. Ecological and environmental effects of land use change in rapid urbanization: The case of Hangzhou, China. Ecol. Indic. 2017, 81, 243–251. [Google Scholar] [CrossRef]
- Jiao, M.; Hu, M.; Xia, B. Spatiotemporal dynamic simulation of land-use and landscape-pattern in the Pearl River Delta, China. Sustain. Cities Soc. 2019, 49, 101581. [Google Scholar] [CrossRef]
- Liang, X.; Guan, Q.; Clarke, K.C.; Liu, S.; Wang, B.; Yao, Y. Understanding the drivers of sustainable land expansion using a patch-generating land use simulation (PLUS) model: A case study in Wuhan, China. Comput. Environ. Urban Syst. 2021, 85, 101569. [Google Scholar] [CrossRef]
- Matlhodi, B.; Kenabatho, P.K.; Parida, B.P.; Maphanyane, J.G. Analysis of the future land use land cover changes in the Gaborone dam catchment using CA-Markov model: Implications on water resources. Remote Sens. 2021, 13, 2427. [Google Scholar] [CrossRef]
- Zhang, Z.; Hu, B.; Jiang, W.; Qiu, H. Identification and scenario prediction of degree of wetland damage in Guangxi based on the CA-Markov model. Ecol. Indic. 2021, 127, 107764. [Google Scholar] [CrossRef]
- Aburas, M.M.; Ho, Y.M.; Ramli, M.F.; Ash’aari, Z.H. Improving the capability of an integrated CA-Markov model to simulate spatio-temporal urban growth trends using an Analytical Hierarchy Process and Frequency Ratio. Int. J. Appl. Earth Obs. Geoinf. 2017, 59, 65–78. [Google Scholar] [CrossRef]
- da Cunha, E.R.; Santos, C.A.G.; da Silva, R.M.; Bacani, V.M.; Pott, A. Future scenarios based on a CA-Markov land use and land cover simulation model for a tropical humid basin in the Cerrado/Atlantic forest ecotone of Brazil. Land Use Policy 2021, 101, 105141. [Google Scholar] [CrossRef]
- Jiang, L.; Liu, Y.; Wu, S.; Yang, C. Analyzing ecological environment change and associated driving factors in China based on NDVI time series data. Ecol. Indic. 2021, 129, 107933. [Google Scholar] [CrossRef]
- Lasanta, T.; Arnaez, J.; Pascual, N.; Ruiz-Flano, P.; Errea, M.P.; Lana-Renault, N. Space-time process and drivers of land abandonment in Europe. Catena 2017, 149, 810–823. [Google Scholar] [CrossRef]
- Liu, X.; Liang, X.; Li, X.; Xu, X.; Ou, J.; Chen, Y.; Li, S.; Wang, S.; Pei, F. A future land use simulation model (FLUS) for simulating multiple land use scenarios by coupling human and natural effects. Landsc. Urban Plan. 2017, 168, 94–116. [Google Scholar] [CrossRef]
- Zhang, Y.; Wu, D.; Lyu, X. A review on the impact of land use/land cover change on ecosystem services from a spatial scale perspective. J. Nat. Resour. 2020, 35, 1172–1189. [Google Scholar]
- Lawler, J.J.; Lewis, D.J.; Nelson, E.; Plantinga, A.J.; Polasky, S.; Withey, J.C.; Helmers, D.P.; Martinuzzi, S.; Pennington, D.; Radeloff, V.C. Projected land-use change impacts on ecosystem services in the United States. Proc. Natl. Acad. Sci. USA 2014, 111, 7492–7497. [Google Scholar] [CrossRef]
- Hu, M.; Li, Z.; Wang, Y.F.; Jiao, M.; Li, M.; Xia, B. Spatio-temporal changes in ecosystem service value in response to land-use/cover changes in the Pearl River Delta. Resour. Conserv. Recycl. 2019, 149, 106–114. [Google Scholar] [CrossRef]
- Tian, S.; Wang, S.; Bai, X.; Zhou, D.; Luo, G.; Yang, Y.; Hu, Z.; Li, C.; Deng, Y.; Lu, Q. Ecological security and health risk assessment of soil heavy metals on a village-level scale, based on different land use types. Environ. Geochem. Health 2020, 42, 3393–3413. [Google Scholar] [CrossRef]
- Chen, Y.; Hao, X.; Chen, Y.; Zhu, C. Study on water system connectivity and ecological protection countermeasures of Tarim River Basin in Xinjiang. Bull. Chin. Acad. Sci. 2019, 34, 1156–1164. [Google Scholar]
- Fu, A.; Li, W.; Chen, Y.; Wang, Y.; Hao, H.; Li, Y.; Sun, F.; Zhou, H.; Zhu, C.; Hao, X. The effects of ecological rehabilitation projects on the resilience of an extremely drought-prone desert riparian forest ecosystem in the Tarim River Basin, Xinjiang, China. Sci. Rep. 2021, 11, 18485. [Google Scholar] [CrossRef]
- Tang, Q.; Wang, J.; Jing, Z.; Yan, Y.; Niu, H. Response of ecological vulnerability to land use change in a resource-based city, China. Resour. Policy 2021, 74, 102324. [Google Scholar] [CrossRef]
- Chen, H.; Chen, Y. Changes of desert riparian vegetation along the main stream of Tarim River, Xinjiang. Chin. J. Ecol. 2015, 34, 3166. [Google Scholar]
- Sun, F.; Wang, Y.; Chen, Y.; Li, Y.; Zhang, Q.; Qin, J.; Kayumba, P.M. Historic and Simulated Desert-Oasis Ecotone Changes in the Arid Tarim River Basin, China. Remote Sens. 2021, 13, 647. [Google Scholar] [CrossRef]
- Chen, Y.; Li, B.; Fan, Y.; Sun, C.; Fang, G. Hydrological and water cycle processes of inland river basins in the arid region of Northwest China. J. Arid. Land 2019, 11, 161–179. [Google Scholar] [CrossRef]
- Chen, Y.; Ye, Z.; Shen, Y. Desiccation of the Tarim River, Xinjiang, China, and mitigation strategy. Quat. Int. 2011, 244, 264–271. [Google Scholar] [CrossRef]
- Fang, G.; Yang, J.; Chen, Y.; Li, Z.; Ji, H.; De Maeyer, P. How hydrologic processes differ spatially in a large basin: Multisite and multiobjective modeling in the Tarim River Basin. J. Geophys. Res. Atmos. 2018, 123, 7098–7113. [Google Scholar] [CrossRef]
- Fu, A.; Wang, W.; Li, W.; Chen, Y. Resistance and Resilience of Desert Riparian Communities to Extreme Droughts. Forests 2022, 13, 1032. [Google Scholar] [CrossRef]
- Chen, Y.; Xu, C.; Hao, X.; Li, W.; Chen, Y.; Zhu, C.; Ye, Z. Fifty-year climate change and its effect on annual runoff in the Tarim River Basin, China. Quat. Int. 2009, 208, 53–61. [Google Scholar]
- Chen, Y.; Takeuchi, K.; Xu, C.; Chen, Y.; Xu, Z. Regional climate change and its effects on river runoff in the Tarim Basin, China. Hydrol. Process. 2010, 20, 2207–2216. [Google Scholar] [CrossRef]
- Yang, J.; Huang, X. The 30 m annual land cover dataset and its dynamics in China from 1990 to 2019. Earth Syst. Sci. Data 2021, 13, 3907–3925. [Google Scholar] [CrossRef]
- Singh, S.K.; Laari, P.B.; Mustak, S.; Srivastava, P.K.; Szabó, S. Modelling of land use land cover change using earth observation data-sets of Tons River Basin, Madhya Pradesh, India. Geocarto Int. 2018, 33, 1202–1222. [Google Scholar] [CrossRef]
- Liu, J.; Ning, J.; Kuang, W.; Xu, X.; Zhang, S.; Yan, C.; Li, R.; Wu, S.; Hu, Y.; Du, G.; et al. Spatio-temporal patterns and characteristics of land-use change in China during 2010–2015. Acta Geogr. Sin. 2018, 73, 789–802. [Google Scholar]
- Long, H.; Liu, Y.; Hou, X.; Li, T.; Li, Y. Effects of land use transitions due to rapid urbanization on ecosystem services: Implications for urban planning in the new developing area of China. Habitat Int. 2014, 44, 536–544. [Google Scholar] [CrossRef]
- Ma, M.; Veroustraete, F. Reconstructing pathfinder AVHRR land NDVI time-series data for the Northwest of China. Adv. Space Res. 2006, 37, 835–840. [Google Scholar] [CrossRef]
- Wang, Y.; Chen, Y.; Li, Z. Evolvement characteristics of population and economic gravity centers in Tarim River Basin, Uygur Autonomous Region of Xinjiang, China. Chin. Geogr. Sci. 2013, 23, 765–772. [Google Scholar] [CrossRef]
- He, D.; Hou, K.; Wen, J.; Wu, S.; Wu, Z. A coupled study of ecological security and land use change based on GIS and entropy method-A typical region in Northwest China, Lanzhou. Environ. Sci. Pollut. Res. 2022, 29, 6347–6359. [Google Scholar] [CrossRef]
- Xu, C.; Pu, L.; Kong, F.; Li, B. Spatio-Temporal Change of Land Use in a Coastal Reclamation Area: A Complex Network Approach. Sustainability 2021, 13, 8690. [Google Scholar] [CrossRef]
- Fischer, G.; Sun, L. Model based analysis of future land-use development in China. Agric. Ecosyst. Environ. 2001, 85, 163–176. [Google Scholar] [CrossRef]
- Veldkamp, A.; Lambin, E.F. Predicting land-use change. Agric. Ecosyst. Environ. 2001, 85, 1–6. [Google Scholar] [CrossRef]
- Gidey, E.; Dikinya, O.; Sebego, R.; Segosebe, E.; Zenebe, A. Cellular automata and Markov Chain (CA_Markov) model-based predictions of future land use and land cover scenarios (2015–2033) in Raya, northern Ethiopia. Model. Earth Syst. Environ. 2017, 3, 1245–1262. [Google Scholar] [CrossRef]
- Han, H.; Yang, C.; Song, J. Scenario simulation and the prediction of land use and land cover change in Beijing, China. Sustainability 2015, 7, 4260–4279. [Google Scholar] [CrossRef]
- Hyandye, C.; Martz, L.W. A Markovian and cellular automata land-use change predictive model of the Usangu Catchment. Int. J. Remote Sens. 2017, 38, 64–81. [Google Scholar] [CrossRef]
- Maviza, A.; Ahmed, F. Analysis of past and future multi-temporal land use and land cover changes in the semi-arid Upper-Mzingwane sub-catchment in the Matabeleland south province of Zimbabwe. Int. J. Remote Sens. 2020, 41, 5206–5227. [Google Scholar] [CrossRef]
- Rahman, M.; Tabassum, F.; Rasheduzzaman, M.; Saba, H.; Sarkar, L.; Ferdous, J.; Uddin, S.Z.; Zahedul Islam, A. Temporal dynamics of land use/land cover change and its prediction using CA-ANN model for southwestern coastal Bangladesh. Environ. Monit. Assess. 2017, 189, 565. [Google Scholar] [CrossRef]
- Pontius, R.G., Jr.; Millones, M. Death to Kappa: Birth of quantity disagreement and allocation disagreement for accuracy assessment. Int. J. Remote Sens. 2011, 32, 4407–4429. [Google Scholar] [CrossRef]
- Huang, G. What are Extreme Learning Machines? Filling the Gap between Frank Rosenblatt’s Dream and John von Neumann’s Puzzle. Cogn. Comput. 2015, 7, 263–278. [Google Scholar] [CrossRef]
- Small, C.; Elvidge, C.D.; Balk, D.; Montgomery, M. Spatial scaling of stable night lights. Remote Sens. Environ. 2011, 115, 269–280. [Google Scholar] [CrossRef]
- Wang, Y.; Xia, T.; Shataer, R.; Zhang, S.; Li, Z. Analysis of characteristics and driving factors of land-use changes in the Tarim River Basin from 1990 to 2018. Sustainability 2021, 13, 10263. [Google Scholar] [CrossRef]
- Chen, Z.; Chen, Y.; Li, W.; Chen, Y. Changes of runoff consumption and its human influence intensity in the mainstream of Tarim river. Acta Geogr. Sin. 2011, 66, 89–98. [Google Scholar]
- Wang, Y.; Ren, Y.; Song, L.; Xiang, Y. Responses of extreme high temperatures to urbanization in the Beijing–Tianjin–Hebei urban agglomeration in the context of a changing climate. Meteorol. Appl. 2021, 28, 2024. [Google Scholar] [CrossRef]
- Chen, W.; Chi, G.; Li, J. The spatial association of ecosystem services with land use and land cover change at the county level in China, 1995–2015. Sci. Total Environ. 2019, 669, 459–470. [Google Scholar] [CrossRef] [PubMed]
- Liang, L.; Wang, Z.; Li, J. The effect of urbanization on environmental pollution in rapidly developing urban agglomerations. J. Clean. Prod. 2019, 237, 117649. [Google Scholar] [CrossRef]
- Maharjan, A.; Kochhar, I.; Chitale, V.S.; Hussain, A.; Gioli, G. Under-standing rural outmigration and agricultural land use change in the Gandaki Basin, Nepal. Appl. Geogr. 2020, 124, 102278. [Google Scholar] [CrossRef]
- Searchinger, T.D.; Wirsenius, S.; Beringer, T.; Dumas, P. Assessing the efficiency of changes in land use for mitigating climate change. Nature 2018, 564, 249–253. [Google Scholar] [CrossRef]
- Yang, Y.; Liu, Y. Spatio-temporal analysis of urbanization and land and water resources efficiency of oasis cities in Tarim River Basin. J. Geogr. Sci. 2014, 24, 509–525. [Google Scholar] [CrossRef]
- Xue, L.; Wang, J.; Zhang, L.; Wei, G.; Zhu, B. Spatiotemporal analysis of ecological vulnerability and management in the Tarim River Basin, China. Sci. Total Environ. 2019, 649, 876–888. [Google Scholar] [CrossRef]
- Wang, R.; Bai, Y.; Alatalo, J.M.; Guo, G.; Yang, Z.; Yang, Z.; Yang, W. Impacts of urbanization at city cluster scale on ecosystem services along an urban–rural gradient: A case study of Central Yunnan City Cluster, China. Environ. Sci. Pollut. Res. 2022, 29, 88852–88865. [Google Scholar] [CrossRef]
Disclaimer/Publisher’s Note: The statements, opinions and data contained in all publications are solely those of the individual author(s) and contributor(s) and not of MDPI and/or the editor(s). MDPI and/or the editor(s) disclaim responsibility for any injury to people or property resulting from any ideas, methods, instructions or products referred to in the content. |
© 2023 by the authors. Licensee MDPI, Basel, Switzerland. This article is an open access article distributed under the terms and conditions of the Creative Commons Attribution (CC BY) license (https://creativecommons.org/licenses/by/4.0/).