Article

A Geo-Hazard Risk Assessment Technique for Analyzing Impacts of Surface Subsidence within Onyeama Mine, South East Nigeria

by
Nixon N. Nduji
1,2,*,
Christian N. Madu
1,3,
Chukwuebuka C. Okafor
1 and
Martins U. Ezeoha
1
1
Centre for Environmental Management and Control (CEMAC), University of Nigeria (UNN), Enugu 410001, Nigeria
2
Department of Surveying and Geoinformatics, Enugu State University of Science and Technology (ESUT), PMB 01660, Enugu 402004, Nigeria
3
Department of Management and Management Science, Lubin School of Business, Pace University, 1 Pace Plaza, New York, NY 10038, USA
*
Author to whom correspondence should be addressed.
Land 2023, 12(3), 575; https://doi.org/10.3390/land12030575
Submission received: 3 February 2023 / Revised: 24 February 2023 / Accepted: 26 February 2023 / Published: 27 February 2023

Abstract

:
This paper proposes a geo-hazard risk assessment technique to analyze the impacts of surface subsidence monitored in a major coal mine in Nigeria. In many developing countries, disaster risk management schemes have mainly focused on traditional singular hazard assessment, vulnerability assessment, or risk assessment. However, it is difficult to use a singular application to adequately address hazard assessment due to the variation in data requirements, factors associated with the hazards, and the various elements at risk. Most times, hazard assessment schemes heavily rely on data and techniques from different global organizations that collate data on disasters, using various scales and objectives to make informed decisions. Several challenges seemingly arise from total reliance on these kinds of data due to standardization, the exact number of potential victims, and the purpose of the data collection. This makes disaster information collected at the local level unique and assessment schemes more complete; however, the coverage is limited worldwide. The proposed approach combines the spatial relationship between vulnerability assessment and elements at risk to highlight the grave consequences of potential disasters. Thus, the aim is to underscore the importance of integrating local-level inputs in analyzing risk factors and vulnerability indicators for hazard assessment. This study was conducted at the Onyeama coal mine in South East Nigeria. This area has experienced severe negative impacts of subsidence over the years. We exploit data from Sentinel-1 Synthetic Aperture Radar (SAR) Satellites and Small-Baseline Subset Differential Interferometric Synthetic Aperture Radar (SBAS-DInSAR) technique to map the study area. The results generate an elements-at-risk database with a particular focus on population density, road networks, and building networks identified as indices for loss estimation.

1. Introduction

Over the past decades, extreme events such as climate change, global warming, and unsustainable rapid urban development have expedited a significant increase in natural disasters around the world [1]. In many parts of the world, certain types of disasters are more prevalent in different regions [2]. Geophysical disasters such as earthquakes mainly occur within active plate tectonic boundaries. Volcanos are witnessed mainly around subduction zones, tsunamis occur in active plate margins, tropical cyclones, hurricanes, or typhoons occur in open waters, with impacts seen along coastlines or coastal areas, and landslides or subsidence occurs in hilly or mountainous regions with soft soil [1,3,4]. Some disasters are rapid, while others are quite subtle. Disasters such as hurricanes, earthquakes, and floods are instant with widespread losses, while others, such as desertification, drought, surface subsidence, sea level rise, soil erosion, and glacial retreat, are quite slow but may cause larger impacts over time [1,4]. In Nigeria, the most common disasters are occasional flooding, subsidence, desertification, drought, sea level rise, and soil erosion [5,6]. These events may be categorized as slow or negligible, with little media coverage [1]; however, their long-term impacts are witnessed in environmental degeneration, the degeneration of surface and underground water conditions, and the destruction of surface structures and utilities [2,7]. Recent studies have even suggested that Nigeria may not be free from seismogenic hazards due to recurring incidences of landslides triggered by rain or running water and ground shaking in various parts of the country [3,5,7].
In the South Eastern states of Nigeria, hazards such as land subsidence and soil erosion have increasingly become major environmental issues [8]. It is estimated that approximately 500 tons/km2 of soil per year are washed away due to soil erosion [6,8]. Land subsidence occurs due to both human-induced and natural causes, such as earth motion, excessive exploitation of groundwater, and indiscriminate exploration of minerals and resources such as coal, oil, and gas [9]. Soil erosion, on the other hand, is a result of rain on slopes, floods, and poor stormwater drainage networks [5,8]. The continuous ephemeral flows along steep slopes during intense rainfall usually cause soil erosion to advance into gully erosion [10]. The expansion of these gullies has degraded many areas of land and damaged building infrastructure. This may lead to the splitting of communities and the destruction of pathways [5,10]. With a booming population, these combined details put significant pressure on land resources and the safety of the population living around the gullies [5,8]. This problem is more prominent as the country is prone to flooding disasters. In the year 2022 alone, more than six hundred lives have been lost and hundreds of thousands of people have been displaced because of flooding (BBC News, 2022). This has become a perennial occurrence with long-term impacts on the economy, and the destruction of major infrastructure such as transportation routes, power transmission lines, and water supply. In addition, top soils are washed off from farmlands, thus, leading to poor food production [8,10,11].
Traditionally, the singular focus of most operational disaster risk management schemes has mainly been on either hazard assessment or vulnerability assessment [1,2]. However, the dynamics of different hazards limit the acceptance of each singular application due to data requirements, triggering factors, and various elements at risk [12,13]. Moreover, hazards can be exclusive, successive, or interconnected in their various origins and effects. Thus, each hazard is characterized by its location, the area affected (size or magnitude), intensity, speed of onset, duration, and frequency [2,14,15,16]. This ambiguity renders the application of each singular assessment inadequate for operational environmental disaster risk management schemes [16,17,18]. Again, for most operational disaster risk management schemes, emphasis is laid on data collection, rate of occurrence, effect on people, and potential cost to countries [1,19,20]. As such, most developing countries rely on organizations that collect information on disasters at different scales and with different objectives to make informed decisions [13,21,22,23]. However, several challenges arise from total reliance on data from these organizations. The issue of standardization, the exact number of people affected, triggering factors, and the purpose of data collection is usually a subjective decision, especially when insurance companies need to pay premiums [2,24,25]. Moreover, the spatial distribution of risks solely based on information from global databases is vague and cannot guide local disaster safety reduction work [8,10,11]. This makes disaster information collected at local levels unique and more complete; however, the coverage is limited worldwide [1,2]. Currently, many industrialized countries develop their own national disaster risk assessment schemes by integrating local-level inputs (data collection and appropriate assessment techniques) as a key part of the process [1,4]. Others collaborate to establish national or regional disaster risk databases, such as the Natural Disaster Database (Nat-Cat) of the Munich Reinsurance Company in Germany, the Swiss Reinsurance Company (Sigma), and the Emergency Disaster Database (EM-DAT) of the National Centre for Research on the Epidemiology of Disasters of the University of Leuven in Belgium, etc. [5,7,9]. In developing countries such as Nigeria, the local level inputs for appropriate assessment of disasters are hugely undervalued and in most cases ignored [12,13,14]. Unfortunately, the overlooked historical disaster data collected at local and small-scale regional units are effective statistical indicators for complete disaster risk assessment schemes [9,14]. Ignoring them renders disaster assessment response efforts inadequate.
This paper proposes a geo-hazard risk assessment technique for analyzing the impacts of surface subsidence monitored in a major coal mine in Nigeria. The technique combines the spatial relationship between vulnerability assessment and elements at risk to highlight the grave consequences of a potential disaster [1,3]. The aim is to underscore the importance of integrating local-level inputs in analyzing elements at risk and vulnerability indicators for hazard assessment. By integrating expert knowledge combined with “citizen science”, the technique analyzes various risk elements and vulnerability indices for decision-makers and practitioners [1,13,14]. The study area, the Onyeama mine in South East Nigeria, has experienced severe negative impacts of subsidence over the years. Largely, the severe effects of land subsidence around the Onyeama mine and its environment are due to the disproportionate extraction of groundwater for both agricultural and commercial purposes, the effect of overlying rock changes due to past coal exploration activities, and rapid urban population expansion that has encroached into the area [9]. The relatively cheap cost of obtaining water by sinking boreholes in many locations is the major factor that has made groundwater use quite attractive for various purposes [5,9]. We exploit data from Sentinel-1 Synthetic Aperture Radar (SAR) Satellites and Small-Baseline Subset Differential Interferometric Synthetic Aperture Radar (SBAS-DInSAR) technique for mapping the study area. The results generate an elements-at-risk database with a particular focus on population density, road networks, and building networks, identified as indices for loss estimation [2,4,14].

2. The Study Area

The study is carried out in the Onyeama Mine Field, Enugu State, Nigeria. The area is bounded by latitudes 6°25′ N and 6°29′ N and longitudes 7°25′ E and 7°30′ E, South East Nigeria (Figure 1). The total area is approximately 67,000 square kilometers (area bounded in red). Hills and lowlands with minor streams and rivers characterize the area. The River Ekulu and Asata River drain toward the northern and southern parts, respectively. Three geological formations characterize the area, namely Ajali sandstone, Mamu formation, and Enugu shale [26]. Toward the hilly and western part of the area, Ajali sandstone and Mamu formation are situated, while Enugu shale underlies the lowlands. Ajali sandstone is whitish to faint brown with patches of iron stains. According to [26], Enugu shale, which is visible at the extreme eastern part of the area, is fissile grey shale having a dipping direction of 2500 SW, striking 1500ES-3300 NW. The four major lithology units that characterize the area are shale, sandstone, coal, and siltstone. The sandstone is of fine to medium grade with a moderately weak consolidation quality. The coal, which comprises three thin coal seams that vary in thickness from 0.1 m to 0.9 m, is black in color. Grains of sandstone beds intercalate with flakes of pyrite mineral and make contact with the coal seams. The three geological formations (Ajali sandstone, Mamu formation, and Enugu shale) all have a normal fault with other associated fractures.

3. Methodology

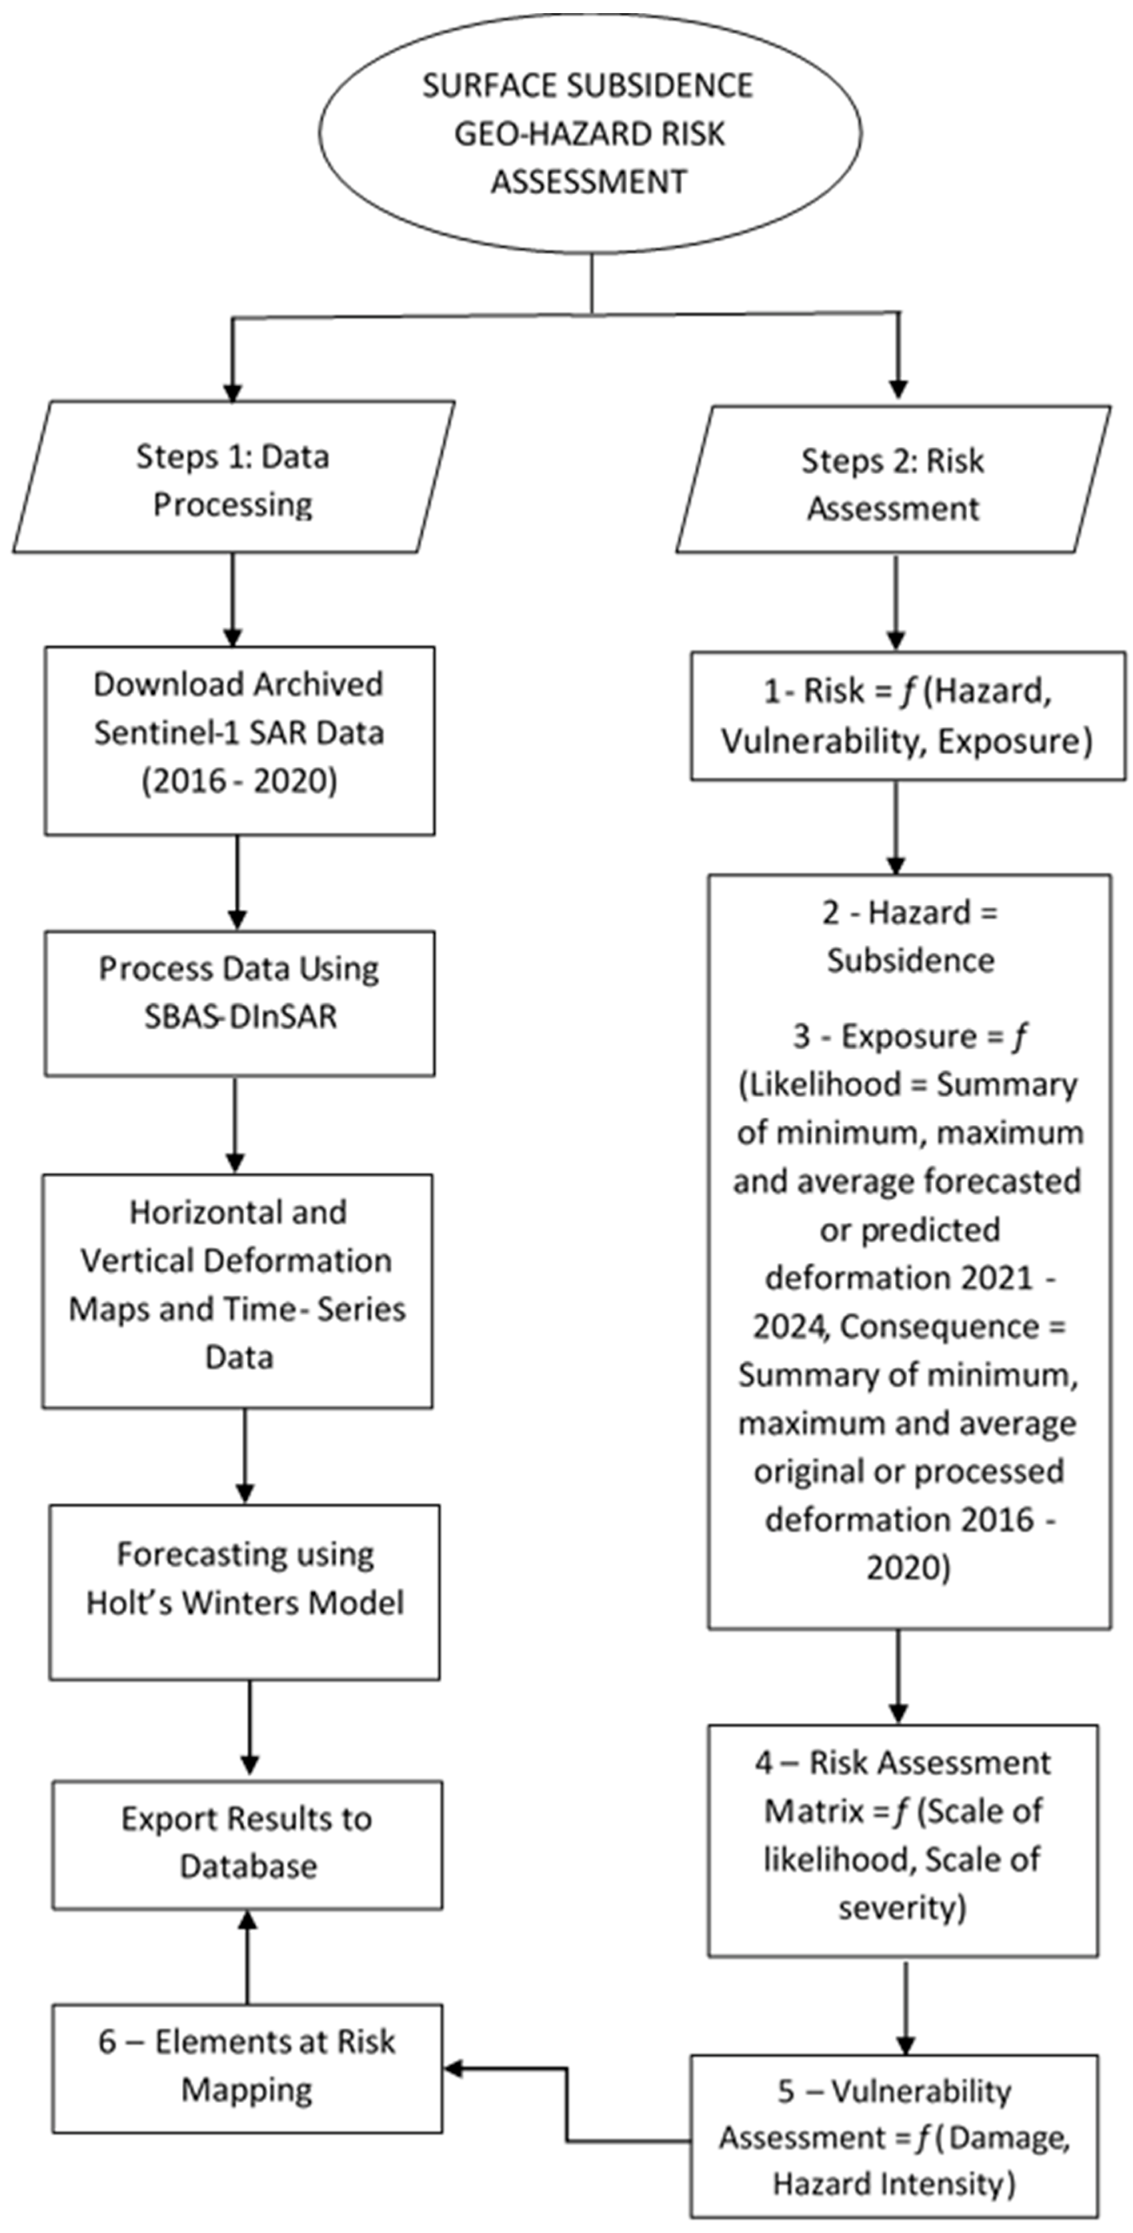
The methodology is structured into two parts, data processing and geo-hazard risk assessment of the results (Figure 2).

3.1. Preparation of the Data

The Copernicus Sentinel-1 Earth Observation Satellite SAR Data Archives was the primary source of the dataset used in this research for measuring, monitoring, and mapping the surface subsidence over the study area (Figure 3). Sentinel-1 SAR satellites possess some favorable advantages over other SAR satellites. Some of the advantages include regional-scale mapping capability, systematic and regular SAR observations, and rapid product delivery (typically in less than 3 h from data acquisition) [9,27]. Over a period of 5 years, from January 2016 to December 2020, we acquired a total of 60 SLC Sentinel 1 SAR images of the study area. The size of each image is about 4.6 GB, totaling approximately 276 GB for all images used [9]. We also acquired a secondary dataset for validation purposes from two different sources, (1) GPS (X, Y, Z) field data of fourteen investigation locations and (2) vector shapefiles of buildings and road networks, digitized from georeferenced high-resolution Google Earth Image of 2020.

3.2. SBAS-DInSAR Processing Technique

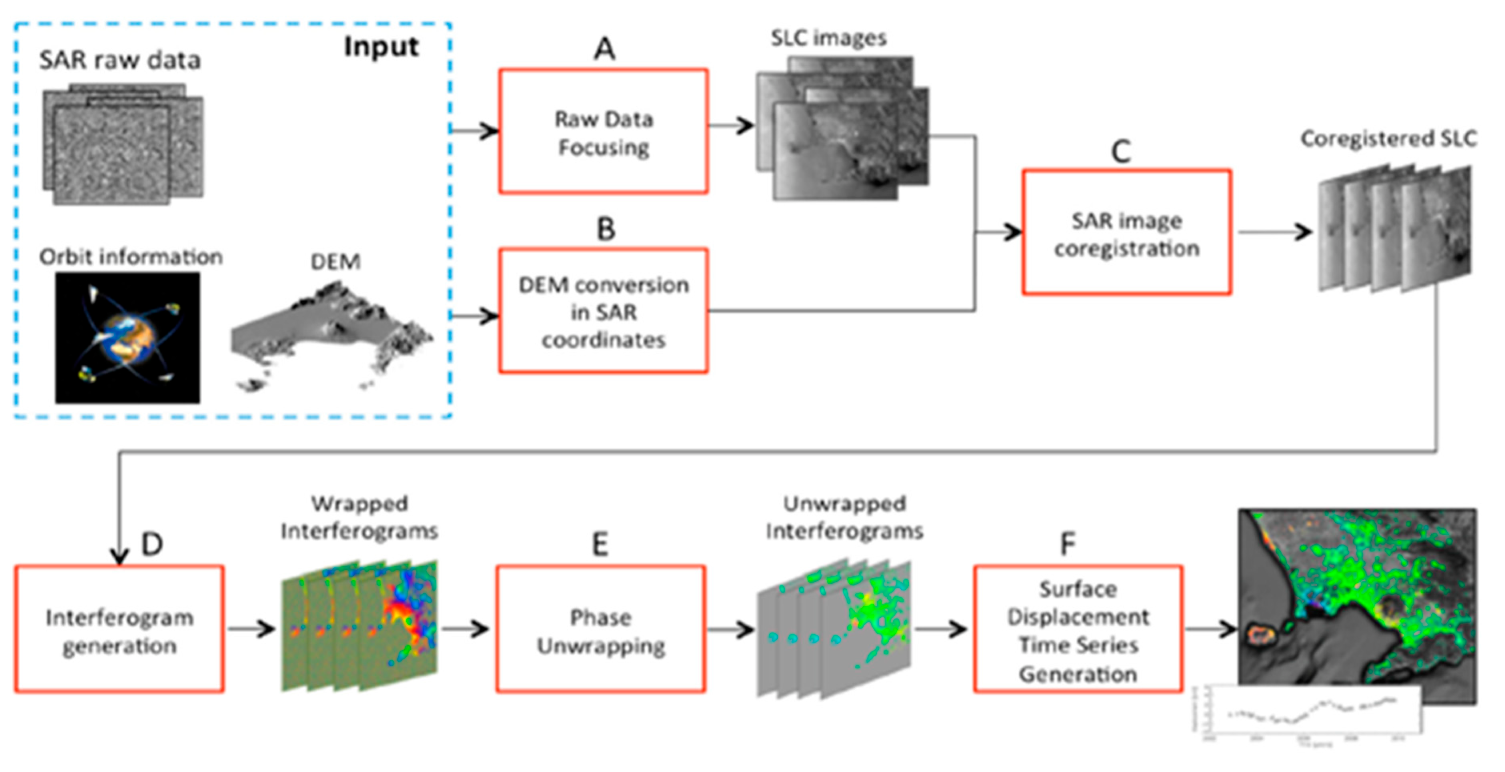
We adopted the parallel computing solution in [28] for the processing of the archived Sentinel-1 SAR images. This technique, known as the Small-Baseline Subset Differential Interferometric Synthetic Aperture Radar (SBAS-DInSAR) technique, is applied to generate Earth surface subsidence time series (TS) maps along the satellite line of sight (LOS) and to estimate the mean yearly velocity in millimetric accuracy (mm/yr). According to [28,29], the workflow of the SBAS-DInSAR technique makes use of raw SAR data acquired from the same region and with the same look angle (same acquisition geometry). The data should also have the same orbital information indicating the position of the satellite during the acquisition time and the digital elevation model (DEM) of the investigated area. In Block A of Figure 4, the raw SAR data pass a specific processing (SAR focusing) in order to be converted into a corresponding radar image, referred to as Single Look Complex (SLC). Next, co-registration is performed by geometric considerations of satellite orbital information and the topography of the area using the DEM from Shuttle Radar Topography Mission (SRTM). At this stage, the DEM has to be converted into the SAR geometry (Block B of Figure 4). This is necessary for the correct application of the co-registration step (Block C). In the next phase, the SLCs are intercalated as interferometric pairs, using a minimum baseline criterion (spatial and temporal baselines and orbital and time separations between two SAR images). The outcome of such image pairs is used for the differential interferometric phase (to generate an interferogram) (Block D). Studies have suggested that such phase difference is directly related to the ground displacement occurring between the two SAR images in such a time-space [13]. The next step is to perform the phase differencing (unwrapping the phase result to retrieve its full evolution of the displacement) (Block E). This is achieved by applying the Extended Minimum Cost Flow (EMCF) phase unwrapping algorithm [28,29]. In Block F, the residual topography estimation step is performed at a pixel level for the final retrieval of the displacement time series. The phase velocities between adjacent acquisitions are determined by the number of SAR acquisitions used for the interferometric analysis. In general, the quality and reliability of generated DInSAR results from DInSAR processing are dependent on the skill of the user and evaluation capacity [29].
The software is used for applying the SBAS-DInSAR processing chain, including Sentinel Toolbox (SNAP—Open Source), ArcGIS (Licensed), R for Spatial Statistics (Open Source), and Virtual Machine Player (VMware—Open Source). According to [28], some general notes are in order for the SBAS-DInSAR procedure. First, the processing steps from block A to D (Figure 4) are performed at full spatial resolution, whereas the subsequent steps work on multi-looked data (block E to F of Figure 4). This first step was performed using the SNAP software. Second, a common storage is assumed to be available to all the processing phases, i.e., each step gains access to the same common storage for reading inputs and writing outputs. This second phase was performed using SNAP and VMware software. ArcGIS and R were both used for visualization and statistical analysis, respectively. The full sequential steps of the SBAS-DInSAR processing chain through widely used metrics (such as speedup, efficiency, and load balance) are shown in Figure 4. The SBAS-DInSAR processing was performed stand-alone (Figure 4), while statistical analysis and prediction were performed using Holt–Winter (Figure 2). The ascending satellite track was used for the SBAS-DInSAR measurement.

3.3. The Geo-Hazard Risk Assessment Technique

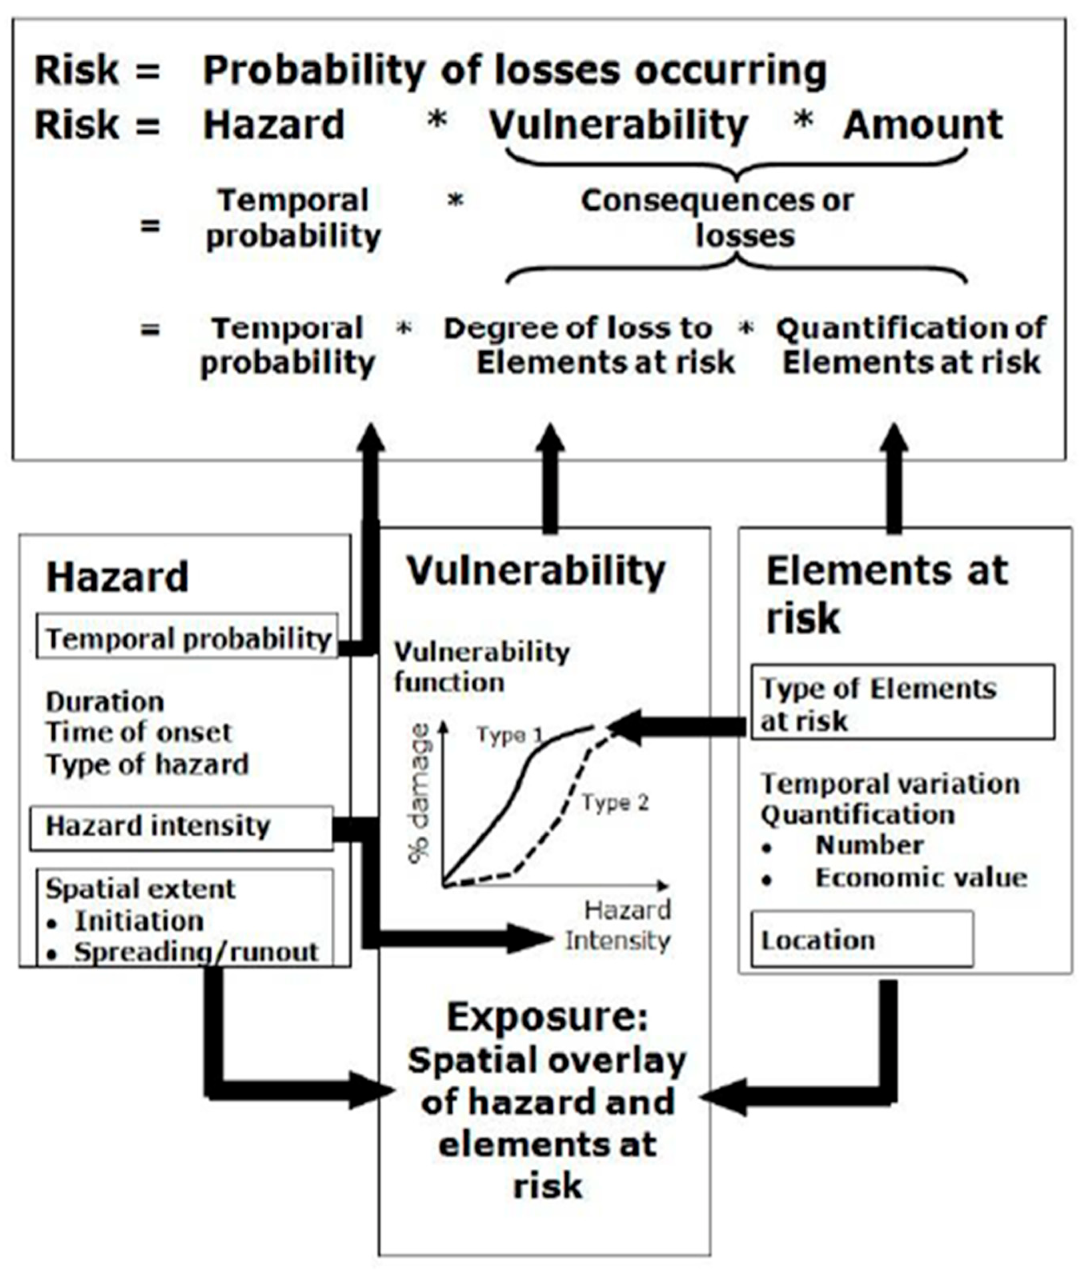
Risk is defined as the possibility of loss or injury and may have different degrees of effects and chances of occurrence [13]. Usually, risk assessment begins with a hazard assessment, which is accompanied by vulnerability estimations and elements at risk mapping [12,14]. This composition suggests risk as a function of hazard, vulnerability, and exposure [30]. Several frameworks have been developed to measure disaster risks, and their outcome has expanded, evolved, and characterized new disciplines [14,31]. Risk assessment is, therefore, a mandatory pre-disaster activity that supports preparedness and provides adaptation response to mitigate potential disasters [2,4,31]. In this study, we are dealing with a single hazard component (surface subsidence) with multiple vulnerability dimensions and different elements at risk [9,32]. Therefore, we combine the spatial relationship between vulnerability assessment and elements at risk to develop our approach (Figure 2 and Figure 5). The probability that an incident would occur is termed likelihood, while the severity of occurrence is consequence.

3.3.1. Horizontal Deformation and Vertical Subsidence Risk Assessment

We performed a risk assessment analysis for horizontal deformation and vertical subsidence through the following steps.
i.
Calculate the summary of minimum, maximum, and average forecasted or predicted horizontal deformation and vertical subsidence across the fourteen investigation locations from 2021 to 2024. Use it to rank the scale of likelihood.
ii.
The scale of likelihood is ranked: Minimum = Not Likely; Average = Possible; Maximum = Probable.
iii.
Calculate the summary of minimum, maximum, and average original or processed horizontal deformation and vertical subsidence across the fourteen investigation locations from 2016 to 2020. Use it to rank the scale of severity.
iv.
The scale of severity is ranked: Minimum = Acceptable; Average = Tolerable; Maximum = Generally Unacceptable.
v.
Design the risk assessment matrix based on the scale of likelihood and scale of severity.
vi.
Summarize the level of risk as Low, Medium, and High by matching the scale of severity against the scale of likelihood.
To analyze the risk due to the horizontal deformation and vertical subsidence over the years, we adopted a risk assessment matrix [1,14] which is seen in Equation (1) below.
Risk = f (Likelihood, Consequence)
where likelihood = the summary of minimum, maximum, and average forecasted or predicted subsidence outcomes from 2021 to 2024. Since the forecasted or predicted values are tentative, they were associated with the likelihood of occurrence. Consequence = the summary of minimum, maximum, and average original extracted subsidence outcome from 2016 to 2020. Similarly, since the original extracted subsidence values are actual, they were associated with the severity of occurrence. Looking at the above, a new risk matrix is formulated in Equation (2) below.
Risk = f (Likelihood = Summary of minimum, maximum, and average forecasted or predicted subsidence 2021–2024, Consequence = Summary of minimum, maximum, and average original or processed subsidence 2016–2020)
Note: Equation (2) formed the basis of our risk assessment analysis for horizontal and vertical subsidence across the fourteen investigation locations within our study area.

3.3.2. Vulnerability Assessment

Vulnerability refers to the diverse and sensitive aspects that make up human living conditions (social, economic, physical, institutional, environmental, and cultural) that are susceptible to protection in the event of potential hazard [13]. Six dimensions of vulnerability were outlined [14,31].
i.
Physical dimension: Physical properties that are likely to be affected include physical infrastructures such as roads, built-up environments, utilities, and open spaces.
ii.
Social dimension: This is specific to the people or organizations in the social system that may be exposed to disaster.
iii.
Institutional dimension: This includes governance and organizational structures, formal legal process, operations and directions, as well as informal customary laws, which may be affected by a disaster.
iv.
Environmental dimension: This involves the general ecosystem (ecological and biophysical processes) that may be degraded and polluted in the event of a disaster.
v.
Economic dimension: This refers to the destruction of production capacity and economic losses to people in the event of a disaster.
vi.
Cultural dimension: This refers to the damaging impacts of disasters on beliefs and value systems.
To analyze vulnerability due to horizontal deformation and vertical subsidence over the years, we adopt the vulnerability matrix, which is seen in Equation (3) below [1,14].
Vulnerability = f (Potential damage, Hazard Intensity)
where potential damage is measured by = the degree of loss across the six dimensions of human living conditions (social, economic, physical, institutional, environmental, and cultural) in case of a potential disaster from 2021 to 2024. Hazard intensity is measured by the = summarizing level of potential hazard by matching the scale of severity against the scale of likelihood.

3.3.3. Mapping the Elements at Risk

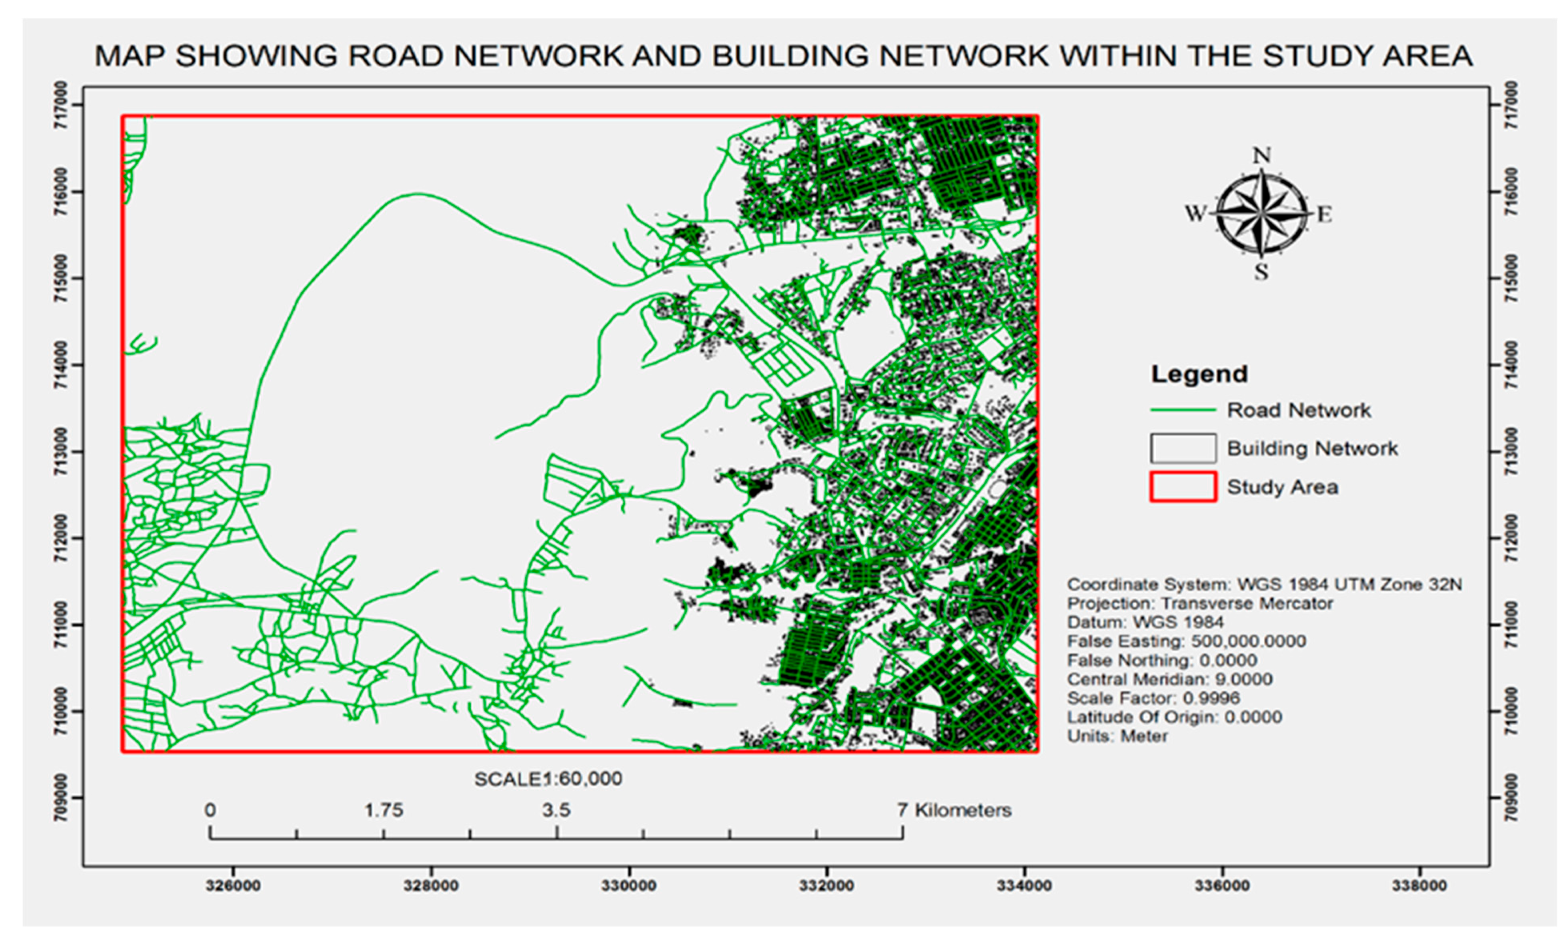
In this study, the various elements at risk are mapped, mainly the physical vulnerability dimension. Physical infrastructures that may be likely affected include roads, buildings, and open spaces. These elements are paramount and visible, and they are of interest in this study (Figure 1). The outcome of this process, which was stored in a database, has a particular focus on population density, road networks, and building networks, identified as indices for loss estimation (Figure 2 and Figure 6). The level of impact on these identified indices for loss estimation (roads and building networks) may vary across the study area due to the rate of extraction of groundwater over time, the geography and geological conditions over the years, and the population growth within the area [3,26,32].

4. Results

The proposed technique was illustrated by monitoring the surface subsidence within our study area (a major coal mine in Nigeria known as Onyeama Mine Field). In general, the severe effects of land subsidence in this environment (Figure 1) are mostly due to past underground hard coal exploration activities, exponential rapid urban population growth, and disproportionate extraction of underground water [9]. The subsidence of rock mass within this area due to subsidence is in multidimensional form. Usually, it is either elastic, brittle, or a combination of both processes [9].

4.1. Horizontal Deformation and Vertical Subsidence

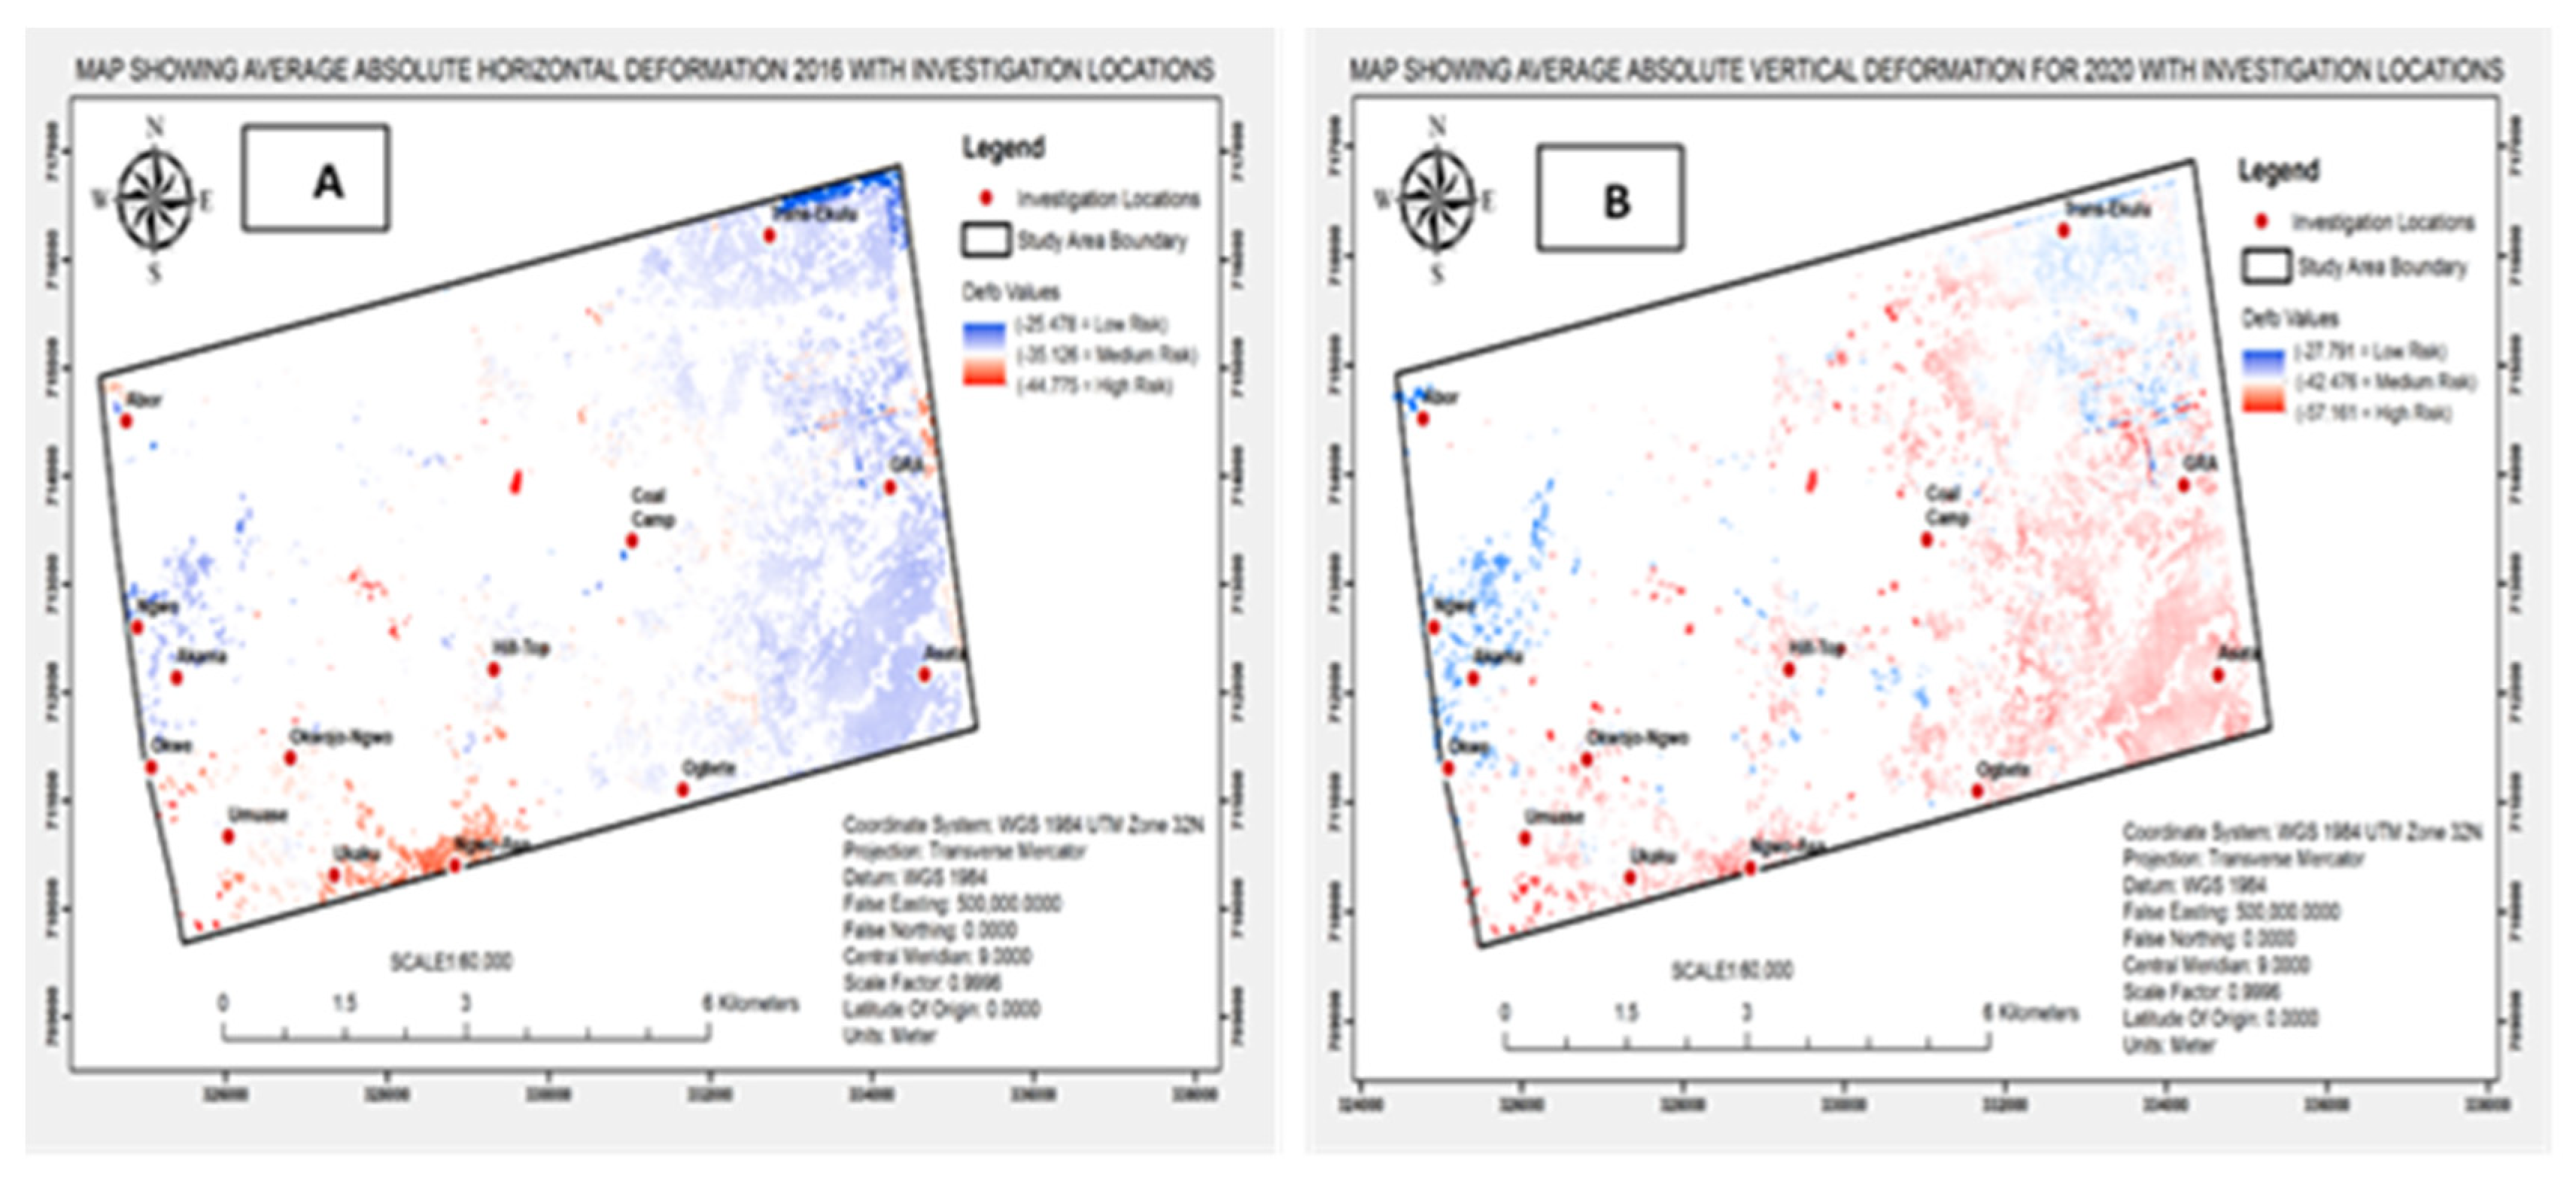
The results of horizontal deformation and vertical subsidence were obtained for every InSAR combination after the application of Block A to F (Figure 4). The absolute deformation results were calculated using quantitative comparative analysis, and a detailed procedure can be found in [9]. The accuracy of monitored ground subsidence values is directly related to the coherence of the subsidence zones [9]. Hence, the coherence between the reference and the secondary image is estimated as an indicator of the quality of the phase information [9]. If the images have strong similarities, they are, therefore, usable for interferometric processing. We averaged the coherence coefficient of each map (based on level of risk) to determine the spatial distribution and variations in the subsidence values monitored [9]. The average coherence level for both horizontal and vertical deformation ranges between 0.45 and 0.47 across the time series image. We proceeded to mask out areas of low coherence using band maths and some logical expressions. For each yearly coherence image, we subtracted the minimum value from the maximum value and divided the outcome by two [9]. Next, we applied a logical Expression: IF (Coherence_Image >= outcome) THEN 1 ELSE NaN. This helps eliminate the areas of low coherence while leaving areas of high coherence. The outcome was a Coherence_Masked_Image. Finally, we multiplied the horizontal and vertical deformation image in millimeters in SNAP software band maths using the Expression: Horizontal_Displacement x Coherence_Masked_Image and Vertical_Displacement x Coherence_Masked_Image. After masking out areas of low coherence and final geo-coding, we obtain the results, which have absolute geographical coordinates. According to the amount of subsidence within each pair, the settlement is classified with three different colors (red, white, and blue), representing (high-risk, medium-risk, and low-risk) subsidence, respectively. The final deformation results of both horizontal and vertical components are shown in Figure 7A,B, respectively.
Figure 7A shows the average horizontal deformation (mm) for 2016, while Figure 7B shows the average vertical subsidence (mm) for 2020. The yearly cumulative amount of horizontal deformation for the year 2016 ranges from (−25.487 mm = low-risk, −35.126 mm = medium-risk, to −44.775 mm = high-risk), respectively, while the yearly cumulative amount of vertical subsidence for the year 2020 ranges from (−27.791 mm = low-risk, −42.476 mm = medium-risk, to −57.161 mm = high-risk), respectively [9].
Table 1 summarizes the yearly average horizontal deformation (mm), with the associated level of risks over the period of study (2016–2020). The low-risk level ranges from −20.893 mm to −28.134 mm, the medium-risk level ranges from −33.072 mm to −39.539 mm, and the high-risk level ranges from −44.775 mm to −51.115 mm. The year with the lowest level of risk is 2020, with −28.134 mm, while the year with the highest level of risk is 2016, with −44.775 mm [9].
Table 2 summarizes the yearly average vertical subsidence (mm), with the associated level of risks over the period of study (2016–2020). The low-risk level ranges from −18.665 mm to −28.008 mm, the medium-risk level ranges from −34.308 mm to −43.785 mm, and the high-risk level ranges from −49.312 mm to −60.750 mm. The year with the lowest level of risk is 2018, with −28.008 mm, while the year with the highest level of risk is 2016, with −49.312 mm [9].

4.2. Geo-Hazard Risk Assessment Results for Horizontal Deformation

Geo-hazard risk assessment for horizontal deformation was performed using a risk assessment matrix of Equation (2). The risk assessment matrix was based on a scale of likelihood and a scale of severity. By matching the scale of severity against the scale of likelihood, the level of risk is summarized as low, medium, and high. If the minimum scale of likelihood (dependent factor) for each investigation location is within the bounds of the scale of severity (assessment factor), then the result is low-risk. Similarly, if the maximum of the scale of likelihood (dependent factor) for each investigation location is within the bounds of the scale of severity (assessment factor), then the result is medium-risk. Finally, if the average of the scale of likelihood (dependent factor) for each investigation location is within the bounds of the scale of severity (assessment factor), then the result is high-risk.

4.3. Geo-Hazard Risk Assessment Results for Vertical Subsidence

Similarly, geo-hazard risk assessment for vertical subsidence was analyzed using a risk assessment matrix. The risk assessment matrix was based on the scale of likelihood and scale of severity. By matching the scale of severity against the scale of likelihood, the level of risk was summarized as low, medium, and high. If the minimum scale of likelihood (dependent factor) for each investigation location is within the bounds of the scale of severity (assessment factor), then the result is low-risk. Similarly, if the maximum scale of likelihood (dependent factor) for each investigation location is within the bounds of the scale of severity (assessment factor), then the result is medium-risk. Finally, if the average of the scale of likelihood (dependent factor) for each investigation location is within the bounds of the scale of severity (assessment factor), then the result is high-risk.

4.4. Vulnerability Assessment Results

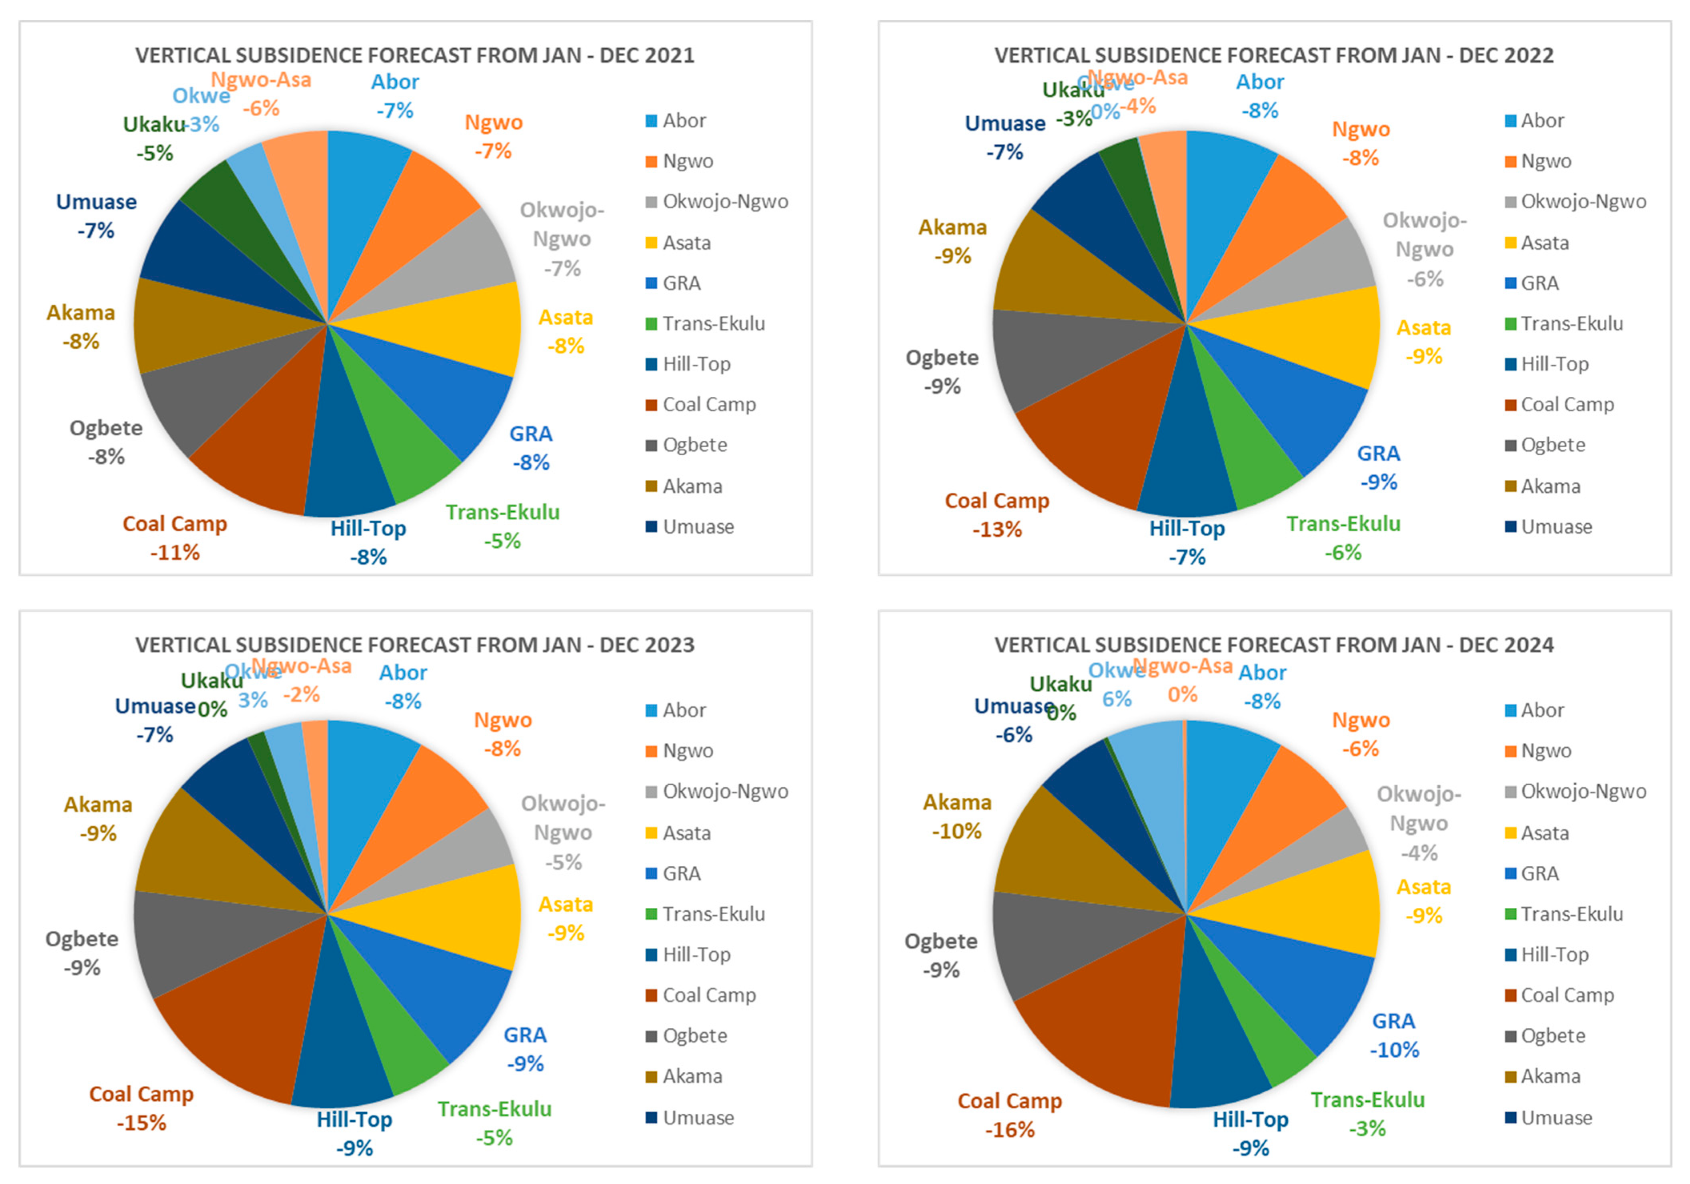
A vulnerability assessment was performed using the vulnerability matrix of Equation (3). We estimate the potential damage using weighting criteria from the forecasted horizontal deformation and vertical subsidence across the fourteen investigation locations. The weighting criteria were computed by dividing the forecasted subsidence values for each investigation location by the sum of subsidence values for each particular year and multiplying by 100%. The hazard intensity is the outcome of the summarized level of potential hazard by matching the scale of severity against the scale of likelihood. Values of 1 and 2 are allocated to the outcomes corresponding to (low–medium) and (medium–high) intensities, respectively. The six indices of vulnerability dimensions (social, economic, physical, institutional, environmental, and cultural) were rated based on the impact of exposure [2,4]. The dimensions vary across each investigation location based on the level of human development index (HDI) [14,31]. Impact on exposure was computed using a buffer zone radius of 1 km from each investigative location. The total number of buildings, road networks, and population density within such buffer zones determined the degree of exposure. The degree of exposure was summarized according to a severity score as follows: none (0%); low (1–39%); medium (40–69%); high (70–89%); critical (90–100%) [14,31]. A total of 19,781 buildings (both old and new) and 1434 roads (tarred and untarred) were used for our assessment [9]. The population density within Enugu State is about 584.49 km2 [5,9].

5. Discussion

The impact of surface subsidence within the Onyeama coal mine and environment was measured using the SBAS-DInSAR technique from 2016 to 2020 (Figure 4) [9]. TOPSAR Sentinel-1 SLC time series SAR data were employed for the study (Figure 1). The absolute subsidence results were calculated using a quantitative comparative analysis [9,33]. The detailed procedure can be found in [9]. The accuracy of geo-hazard assessment schemes is relative to the type of hazard, the available data, the size and characteristics of the study area, and the required accuracy [1,14]. Based on the available data, this study is limited to surface subsidence and characteristics of the study area (Figure 1).
Figure 7A,B shows the yearly absolute horizontal deformation and vertical subsidence (mm) for 2016 and 2020, respectively. The rate of subsidence varies across the study area largely due to triggering factors such as disproportionate extraction of groundwater over the years, the geography and geological conditions of the environment, the effect of overlying rock changes due to past coal exploration activities, and rapid urban population expansion that encroached into the area [3,26,33]. It is possible that these triggering factors likely disturbed the overlying strata of goaf formed by past mining activities over the years, destroyed the in situ stress distributions within the study area, and thus affected the overall structure of the surrounding rock [9]. The implication is that the aquifer in the thick surface soil may have lost water and the overlying stratum may have been compacted, thus, resulting in an increase in vertical ground subsidence and nonlinear horizontal deformations of the ground [9]. To minimize the potential risks [3,9], monitoring procedures may be combined with planned adaptation response to identify key risk areas and mitigate potential disasters in such fast-changing environments [3,9,26,27,33]. With the various available differential interferometric synthetic aperture radar (DInSAR) techniques and online processing platforms, the potentials of synthetic aperture radar (SAR) constellations can be fully exploited to provide cutting-edge solutions for disaster monitoring applications [3,27,34,35,36]. This is fundamental because to mitigate and reduce the impacts of disasters, the outcome of various DInSAR monitoring solutions and applications is usually employed for further analysis in disaster risk management [3,27,36].
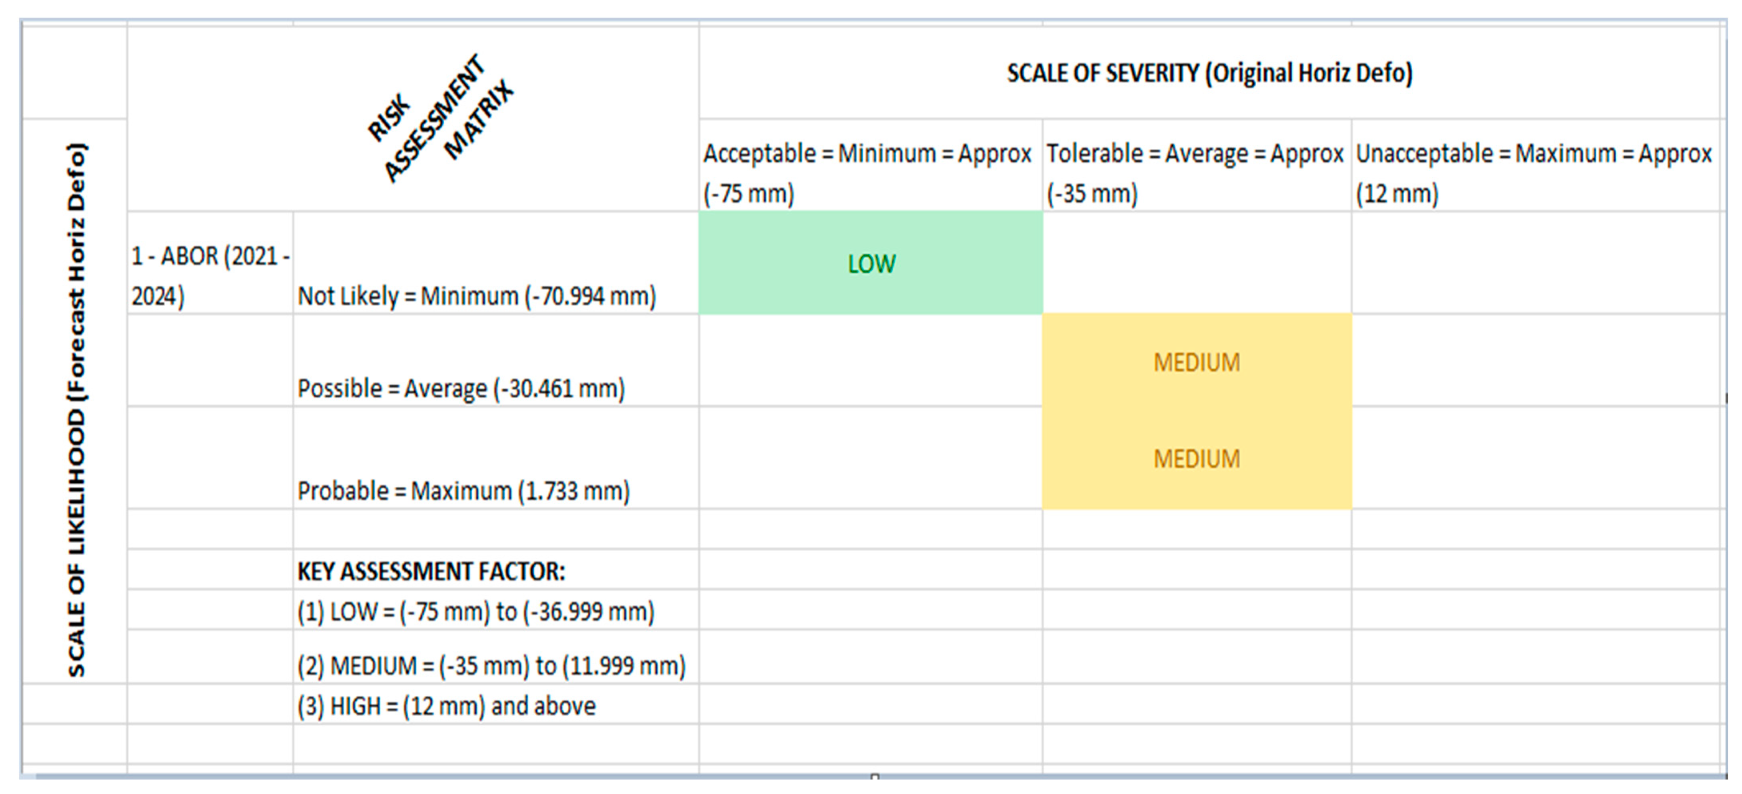
The geo-hazard risk assessment for horizontal deformation was analyzed using the risk assessment matrix of Equation (2). The risk assessment matrix is based on a scale of likelihood and a scale of severity. By matching the scale of severity against the scale of likelihood, the level of risk was summarized as low, medium, and high. Figure 8 shows the horizontal deformation risk assessment matrix for investigation location Abor. Based on the key assessment factor, the perceived risk of horizontal deformation between 2021 and 2024 ranges from low to medium. This implies that the likelihood of the horizontal deformation turning into a disaster at these locations is possible. However, this potential disaster, based on the scale of severity, would still be tolerable.
Table 3 summarizes the horizontal deformation risk assessment analysis showing elements-at-risk, vulnerability parameters, and consequences in the event of a likely disaster. From the risk assessment columns and based on key assessment factors, the perceived risk of horizontal deformation for investigation locations Ngwo, Asata, GRA, Trans-Ekulu, Coal Camp, Ogbete, Akama, and Umuase is low to medium. Thus, the likelihood of the horizontal deformation turning into a disaster is possible, while the scale of severity is tolerable. For investigation locations Okwojo-Ngwo, Hill-Top, Ukaku, Okwe, and Ngwo-Asa, respectively, the perceived risk of horizontal deformation is medium to high. This implies that the likelihood of the horizontal deformation turning into a disaster at these locations is probable, and the scale of severity is unacceptable.
Figure 9 shows the results of the forecast for horizontal deformation made using the Holt–Winters model across the fourteen investigation locations within the study area. We made use of data on the yearly rate of horizontal deformation from January 2016 to December 2020. The prediction is for January 2021 to December 2024 (48 months). On average, there is a gradually increasing trend of potential hazards across all investigation locations over the years. This increase in the horizontal dimension may worsen due to the adverse effects of global warming, climate change, increased poverty rate, ever-growing population, and fast-growing urbanization with a disregard for sustainability [9].
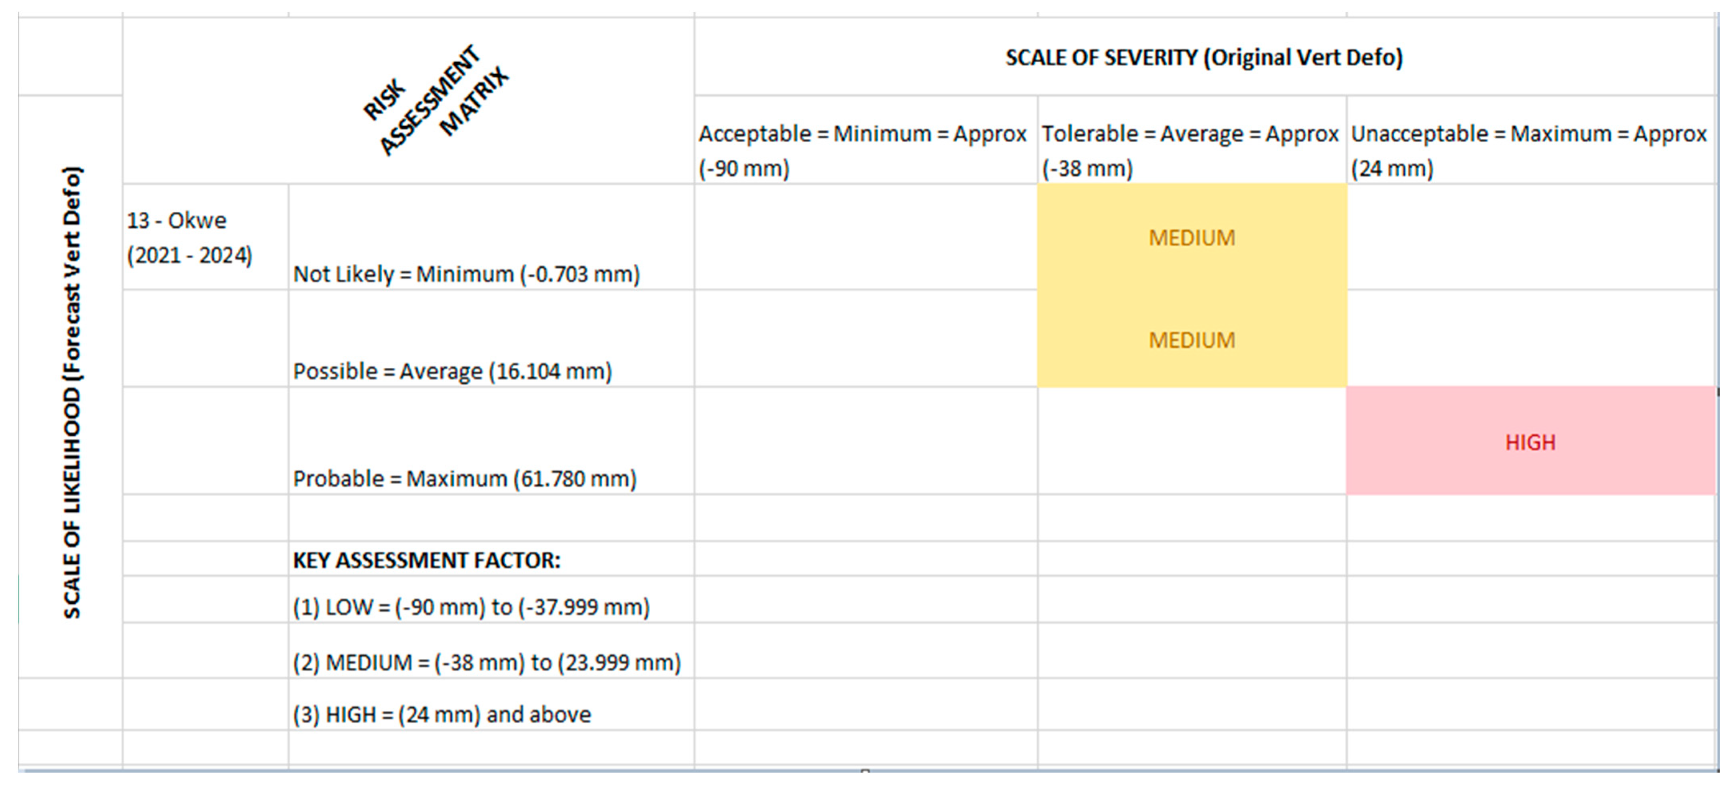
Figure 10 shows the vertical subsidence risk assessment matrix for the investigation location Okwe. Similarly, based on the key assessment factor, the perceived risk of vertical deformation between 2021 and 2024 ranges from medium to high. This implies that the likelihood of the vertical subsidence turning into a disaster at this location is likely. The potential disaster based on the scale of severity is unacceptable. Table 4 summarizes the vertical subsidence risk assessment analysis showing elements at risk, vulnerability parameters, and consequences in the event of a likely disaster. From the risk assessment columns and based on key assessment factors, the perceived risk of vertical subsidence for investigation locations Abor, Ngwo, Okwojo-Ngwo, Asata, GRA, Trans-Ekulu, Hill-Top, Coal Camp, Ogbete, Akama, and Umuase is low to medium. Thus, the likelihood of the vertical subsidence turning into a disaster is possible, while the scale of severity is tolerable. For the investigation location Ngwo-Asa, the perceived risk of vertical subsidence is medium. This implies that the likelihood of the vertical subsidence turning into a disaster is possible; however, the scale of severity will still be tolerable.
Figure 11 shows the results of the forecast for vertical subsidence made using the Holt–Winters model across the fourteen investigation locations. We made use of data on the yearly rate of vertical subsidence from January 2016 to December 2020. The prediction is for January 2021 to December 2024 (48 months). On average, there is also a gradually increasing trend of potential hazards over the years. Similarly, this increase in the vertical dimension may worsen due to adverse effects of global warming, climate change, increased poverty rate, ever-growing population, and fast-growing urbanization with a disregard for sustainability [9].
Table 5 summarizes the vulnerability assessment analysis from 2023 to 2024 over the fourteen investigation locations within our study area. A vulnerability assessment was performed using the vulnerability matrix of Equation (3). The six dimensions of vulnerability (social, economic, physical, institutional, environmental, and cultural) were rated based on the impact of exposure. The hazard intensity across the fourteen investigation locations ranges from 1 to 2. Values of 1 and 2 are allocated for the outcome corresponding to (low–medium) and (medium–high) intensities, respectively. The impact on exposure showed that the degree of exposure was within the severity score of low (1–39%). This highlights an increasing trend with the possibility of potential disaster with grave consequences.

6. Conclusions

In order to respond to physical and social forces that trigger disasters across the world, historical disaster data collected at local and small-scale regional units are effective statistical indicators for complete disaster assessment schemes. Regrettably, most developing countries ignore this useful information during operational disaster risk management operations. Consequently, in this era of global warming and rapid urbanization, ignoring these forces can have a huge impact that can affect the well-being of people living in cities. In Nigeria, disaster risk management schemes have mainly focused on traditional singular hazard assessment, vulnerability assessment, or risk assessment. However, the dynamics of different hazards limit the acceptance of a singular application due to data requirements, triggering factors, and various elements at risk. Most times, the hazard assessment heavily relies on data from different global organizations that collect information on disasters at different scales and with different objectives to make informed decisions. Several challenges seemingly arise from total reliance on these kinds of data due to standardization, the exact number of people affected, local factors, and the purpose of data collected. Moreover, the spatial distribution of risks solely based on information from global databases is vague and cannot guide local disaster safety reduction work. This makes disaster information collected at the local level unique and more representative. However, the coverage is limited worldwide. In this study, we proposed a geo-hazard risk assessment technique for analyzing the impacts of surface subsidence monitored in a major coal mine in Nigeria. The developed approach combines the spatial relationship between vulnerability assessment and elements at risk to highlight the grave consequences of potential disasters. The results of our efforts underscore the importance of integrating local-level inputs in analyzing risk factors and vulnerability indicators for potential geo-hazard assessment and management. The novelty in this research is the evaluation of the impact on exposure over the investigation locations based on the level of human development index (HDI) and using historical disaster information collected at the local level. Due to a lack of data, this research did not examine the influences of ecological change, climate conditions, overlying rock changes in the mining area, construction safety, and urban expansion speed on surface subsidence as indicators for vulnerability assessment [9]. Therefore, a multi-hazard dimension with more robust indicators would be ideal and highly recommended for improved assessment in further studies.

Author Contributions

N.N.N. conceptualized, investigated, curated the research data, formally analyzed the research data, and wrote the original manuscript. C.N.M. supervised the project and reviewed the manuscript. C.C.O. and M.U.E. participated in revising the manuscript. All authors have read and agreed to the published version of the manuscript.

Funding

The study received no external funding.

Institutional Review Board Statement

Not applicable.

Informed Consent Statement

Not applicable.

Data Availability Statement

Not applicable.

Conflicts of Interest

The authors declare no conflict of interest.

References

  1. Van Westen, C.J. Remote sensing and GIS for natural hazards assessment and disaster risk management cees. Treatise Geomorphol. 2013, 3, 259–298. [Google Scholar]
  2. Zhang, J.; Wang, J.; Chen, S.; Tang, S.; Zhao, W. Multi-hazard meteorological disaster risk assessment for agriculture based on historical disaster data in Jilin Province, China. Sustainability 2022, 14, 7482. [Google Scholar] [CrossRef]
  3. Cian, F.; Delgado, M.; Carrera, L. Sentinel-1 for monitoring land subsidence of coastal cities in africa using PSInSAR: A methodology based on the integration of SNAP and staMPS. Geosciences 2019, 9, 124. [Google Scholar] [CrossRef] [Green Version]
  4. Fahim, A.U. Natural disaster risk assessment in the coastal area of Bangladesh: A case study on Cox ’s Bazar Paurashava. Bauet J. 2021, 3, 28–42. [Google Scholar]
  5. Ezemokwe, I. Environmental impact assessment of Onyeama coal mine in Enugu, Southeastern Nigeria. Impact Assess. Proj. Apprais. 2018, 33, 73–79. [Google Scholar]
  6. Grassi, F.; Mancini, F. Sentinel-1 data for ground subsidence monitoring: The SNAP-StaMPS workflow. In Proceedings of the 12 Workshop Tematico di Telerilevamento, Bologna, Italy, 25–25 July 2019. [Google Scholar]
  7. Di Martire, D.; Tessitore, S.; Brancato, D.; Ciminelli, M.G.; Costabile, S.; Costantini, M.; Graziano, G.V.; Minati, F.; Ramondini, M.; Calcaterra, D. Landslide detection integrated system (LaDIS) based on in-situ and satellite SAR interferometry measurements. Catena 2016, 137, 406–421. [Google Scholar] [CrossRef]
  8. Igwe, O.; John, U.I.; Solomon, O.; Obinna, O. GIS-based gully erosion susceptibility modeling, adapting bivariate statistical method and AHP approach in Gombe town and environs Northeast Nigeria. Geoenviron. Disasters 2020, 7, 1–16. [Google Scholar] [CrossRef]
  9. Nduji, N.N.; Madu, C.N.; Okafor, C.C. A low-cost web application system for monitoring geometrical impacts of surface subsidence. Sustainability 2022, 14, 14240. [Google Scholar] [CrossRef]
  10. Ghorbanzadeh, O.; Rostamzadeh, H.; Blaschke, T.; Gholaminia, K.; Aryal, J. A new GIS-based data mining technique using an adaptive neuro-fuzzy inference system (ANFIS) and k-fold cross-validation approach for land subsidence susceptibility mapping. Nat. Hazards 2018, 94, 497–517. [Google Scholar] [CrossRef] [Green Version]
  11. Ghorbanzadeh, O.; Valizadeh Kamran, K.; Blaschke, T.; Aryal, J.; Naboureh, A.; Einali, J.; Bian, J. Spatial prediction of wildfire susceptibility using field survey GPS data and machine learning approaches. Fire 2019, 2, 43. [Google Scholar] [CrossRef] [Green Version]
  12. Zlateva, P.; Hristozov, S.; Velev, D. A fuzzy logic approach for drone capability analysis on disaster risk assessment. Int. Arch. Photogramm. Remote Sens. Spat. Inf. Sci. 2019, 42, 485–489. [Google Scholar] [CrossRef] [Green Version]
  13. Ramli, M.W.A.; Alias, N.E.; Mohd Yusof, H.; Yusop, Z.; Taib, S.M. Development of a local, integrated disaster risk assessment framework for malaysia. Sustainability 2021, 13, 10792. [Google Scholar] [CrossRef]
  14. Simmons, D.C.; Corbane, C.; Menoni, S.; Schneiderbauer, S.; Zschau, L. Understanding Disaster Risk: Risk Assessment Methodologies and Examples. In Science for Disaster Risk Management 2017: Knowing Better and Losing Less; Publications Office of the European Union: Rome, Italy, 2017; pp. 38–130. Available online: https://drmkc.jrc.ec.europa.eu/portals/0/Knowledge/ScienceforDRM/ch02/ch02.pdf (accessed on 21 January 2023).
  15. Radtke, K.; Day, J.; Forster, T.; Himmelsbach, J.; Korte, L.; Mucke, P. World Risk Report 2019 Focus: Water Supply. Available online: https://reliefweb.int/sites/reliefweb.int/files/resources/WorldRiskReport2019_Online_english.pdf (accessed on 10 January 2023).
  16. Ayeb-Karlsson, S.; Kniveton, D.; Cannon, T.; van der Geest, K.; Ahmed, I.; Derrington, E.M.; Florano, E.; Opondo, D.O. I will not go, I cannot go: Cultural and social limitations of disaster preparedness in Asia, Africa, and Oceania. Disasters 2019, 43, 752–770. [Google Scholar] [CrossRef] [PubMed] [Green Version]
  17. Moreira, L.L.; de Brito, M.M.; Kobiyama, M. Review article: A systematic review and future prospects of flood vulnerability indices. Nat. Hazards Earth Syst. Sci. 2021, 21, 1513–1530. [Google Scholar] [CrossRef]
  18. Komendantova, N.; Mrzyglocki, R.; Mignan, A.; Khazai, B.; Wenzel, F.; Patt, A.; Fleming, K. Multi-hazard and multi-risk decision-support tools as a part of participatory risk governance: Feedback from civil protection. Int. J. Disaster Risk Reduct. 2014, 8, 50–67. [Google Scholar] [CrossRef] [Green Version]
  19. Birkmann, J.; Cardona, O.D.; Carreño, M.L.; Barbat, A.H.; Pelling, M.; Schneiderbauer, S.; Kienberger, S.; Keiler, M.; Alexander, D.; Zeil, P.; et al. Theoretical and Conceptual Framework for the Assessment of Vulnerability to Natural Hazards and Climate Change in Europe: The MOVE Framework. In Assessment of Vulnerability to Natural Hazards: A European Perspective; Elsevier: Amsterdam, The Netherlands, 2014; pp. 1–19. [Google Scholar]
  20. Wu, Z.; Lv, H.; Meng, Y.; Guan, X.; Zang, Y. The determination of flood damage curve in areas lacking disaster data based on the optimization principle of variation coefficient and beta distribution. Sci. Total Environ. 2021, 750, 142277. [Google Scholar] [CrossRef]
  21. Tate, E. Social vulnerability indices: A comparative assessment using uncertainty and sensitivity analysis. Nat. Hazards 2012, 63, 325–347. [Google Scholar] [CrossRef]
  22. Sullivan-Wiley, K.A.; Short Gianotti, A.G. Risk Perception in a Multi-Hazard Environment. World Dev. 2017, 97, 138–152. [Google Scholar] [CrossRef]
  23. Papathoma-köhle, M.; Cristofari, G.; Wenk, M.; Fuchs, S. The importance of indicator weights for vulnerability indices and implications for decision making in disaster management. Int. J. Disaster Risk Reduct. 2019, 36, 101103. [Google Scholar] [CrossRef]
  24. Zaki, R.; Bulgiba, A.; Nordin, N.; Ismail, N.A. A systematic review of statistical methods used to test for reliability of medical instruments measuring continuous variables. Iran. J. Basic Med. Sci. 2013, 16, 803. Available online: http:///pmc/articles/PMC3758037/ (accessed on 10 January 2023).
  25. Medina, N.; Abebe, Y.A.; Sanchez, A.; Vojinovic, Z. Assessing socioeconomic vulnerability after a hurricane: A combined use of an index-based approach and principal components analysis. Sustainability 2020, 12, 1452. [Google Scholar] [CrossRef] [Green Version]
  26. Salufu, S.O. Integrated Study of Acid mine drainage and its environmental effects on Onyeama mine and its environment. J. Multidiscip. Eng. Sci. Technol. 2014, 1, 7–12. [Google Scholar]
  27. Raspini, F.; Bianchini, S.; Ciampalini, A.; Del Soldato, M.; Solari, L.; Novali, F.; Del Conte, S.; Rucci, A.; Ferretti, A.; Casagli, N. Continuous, semi-automatic monitoring of ground subsidence using Sentinel-1 satellites. Sci. Rep. 2018, 8, 7253. [Google Scholar] [CrossRef] [PubMed] [Green Version]
  28. Casu, F.; Elefante, S.; Imperatore, P.; Zinno, I.; Manunta, M. SBAS-DInSAR parallel processing for subsidence time-series computation. IEEE J. Sel. Top. Appl. Earth Obs. Remote Sens. 2014, 7, 3285–3296. [Google Scholar] [CrossRef]
  29. De Luca, C.; Cuccu, R.; Elefante, S.; Zinno, I.; Manunta, M.; Casola, V.; Rivolta, G.; Lanari, R.; Casu, F. an on-demand web tool for the unsupervised retrieval of earth’s surface subsidence from SAR data: The P-SBAS service within the ESA G-POD environment. Remote Sens. 2015, 7, 15630–15650. [Google Scholar] [CrossRef] [Green Version]
  30. Gallina, V.; Torresan, S.; Critto, A.; Sperotto, A.; Glade, T.; Marcomini, A. A review of multi-risk methodologies for natural hazards: Consequences and challenges for a climate change impact assessment. J. Environ. Manag. 2016, 168, 123–132. Available online: https://www.sciencedirect.com/science/article/pii/S0301479715303650 (accessed on 10 January 2023). [CrossRef]
  31. UNISDR. National Disaster Risk Assessment: Governance System, Methodologies, and Use of Results; Consultati; Safaie, S., Ed.; United Nation Office for Disaster Risk Reduction (UNISDR): Geneva, Switzerland, 2017; pp. 1–81. [Google Scholar]
  32. Sharma, A.; Miyazaki, H. Multi-hazard risk assessment in urban planning and development using AHP. Int. Arch. Photogramm. Remote Sens. Spat. Inf. Sci. 2019, 42, 363–371. [Google Scholar] [CrossRef] [Green Version]
  33. Chen, Y.; Wang, K. Accuracy verification and evaluation of Sentinel-1A repeat track differential interferometric synthetic aperture radar in monitoring mining subsidence. J. Appl. Remote Sens. 2021, 14, 014501. [Google Scholar] [CrossRef]
  34. Ge, L.; Rizos, C.; Han, S.; Zebker, H. Mining subsidence monitoring using the combined insar and gps approach. In Proceedings of the 10th International Symposium on Subsidence Measurements, Orange, CA, USA, 19–22 March 2001; pp. 1–10. [Google Scholar]
  35. Nguyen, K.A.; Liou, Y.A.; Terry, J.P. Vulnerability of Vietnam to typhoons: A spatial assessment based on hazards, exposure and adaptive capacity. Sci. Total Environ. 2019, 682, 31–46. [Google Scholar] [CrossRef]
  36. Owczarz, K. A review of geodetic and remote sensing methods used for detecting surface displacements caused by mining. IOP Conf. Ser. Earth Environ. Sci. 2020, 609, 012076. [Google Scholar] [CrossRef]
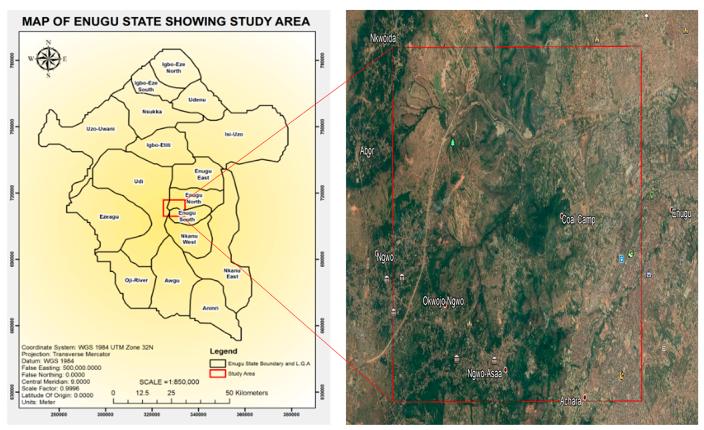
Figure 1. Map of the study area.
Land 12 00575 g001
Figure 2. Workflow of the designed methodology.
Land 12 00575 g002
Figure 3. Coherence image of the study area acquired 06-03 2016 (source: [9]).
Land 12 00575 g003
Figure 4. Workflow of the SBAS-DInSAR algorithm (source: [28]).
Land 12 00575 g004
Figure 5. Components of risk assessment (source: [1]).
Land 12 00575 g005
Figure 6. Showing the various indices for loss estimation (roads and building networks) mapped in the study area (source: [9]).
Land 12 00575 g006
Figure 7. (A) Average horizontal deformation (mm) 2016 and (B) average vertical subsidence (mm) 2020 (source: [9]).
Land 12 00575 g007
Figure 8. Horizontal deformation risk assessment matrix for investigation locations Abor.
Land 12 00575 g008
Figure 9. Result of yearly absolute horizontal deformation (mm) forecast from January 2021 to December 2024 for the fourteen investigation locations using Holt–Winters.
Land 12 00575 g009
Figure 10. Vertical subsidence risk assessment matrix for investigation locations Okwe.
Land 12 00575 g010
Figure 11. Result of yearly absolute vertical subsidence (mm) forecast from January 2021 to December 2024 for the fourteen investigation locations using Holt–Winters.
Land 12 00575 g011
Table 1. Summary of yearly average rate of horizontal deformation (mm) from 2016 to 2020 (source: [9]).
S/NYearly Image of Study AreaAverage Rate of Horizontal Deformation (mm)
1Sentinel-1 SLC SAR 2016−25.487 = low−35.126 = medium−44.775 = high
2Sentinel-1 SLC SAR 2017−20.893 = low−33.072 = medium−45.251 = high
3Sentinel-1 SLC SAR 2018−27.596 = low−37.660 = medium−47.722 = high
4Sentinel-1 SLC SAR 2019−24.636 = low−37.778 = medium−51.115 = high
5Sentinel-1 SLC SAR 2020−28.134 = low−39.539 = medium−50.945 = high
Table 2. Summary of yearly average rate of vertical subsidence (mm) from 2016 to 2020 (source: [9]).
S/NYearly Image of Study AreaAverage Rate of Vertical Subsidence (mm)
1Sentinel-1 SLC SAR 2016−24.532 = low−36.922 = medium−49.312 = high
2Sentinel-1 SLC SAR 2017−18.665 = low−34.308 = medium−49.950 = high
3Sentinel-1 SLC SAR 2018−28.008 = low−40.927 = medium−53.846 = high
4Sentinel-1 SLC SAR 2019−26.821 = low−43.785 = medium−60.750 = high
5Sentinel-1 SLC SAR 2020−27.791 = low−42.476 = medium−57.161 = high
Table 3. Summary of horizontal deformation risk assessment analysis for the fourteen investigation locations within our study area.
S/NInvestigation LocationRisk Assessment MatrixElements at RiskConsequence of Potential Hazard
1AborLow–MediumThe main elements at risk of possible hazards include:
1. Population;
2. Properties (roads, buildings, utilities);
3. Economic activities (markets, schools, public offices, etc.);
4. Environmental degradation (pollution, waste discharge, etc.).
There is a likelihood of harmful consequences and losses which may arise through deaths, injuries, damage to properties and livelihoods, disruption of economic activity, and degradation of the environment. This may result from interactions between (natural, anthropogenic) hazards and vulnerable conditions within the area and time period.
2NgwoLow–Medium
3Okwojo-NgwoMedium–High
4AsataLow–Medium
5GRALow–Medium
6Trans-EkuluLow–Medium
7Hill-TopMedium–High
8Coal CampLow–Medium
9OgbeteLow–Medium
10AkamaLow–Medium
11UmuaseLow–Medium
12UkakuMedium–High
13OkweMedium–High
14Ngwo-AsaMedium–High
Table 4. Summary of vertical subsidence risk assessment analysis for the fourteen investigation locations within our study area.
S/NInvestigation LocationRisk Assessment MatrixElements at RiskConsequence of Potential Hazard
1AborLow–MediumThe main elements at risk of possible hazards include:
1. Population;
2. Properties (roads, buildings, utilities);
3. Economic activities (markets, schools, public offices, etc.);
4. Environmental degradation (pollution, waste discharge, etc.).
There is a likelihood of harmful consequences and losses which may arise through deaths, injuries, damage to properties and livelihoods, disruption of economic activity, and degradation of the environment. This may result from interactions between (natural, anthropogenic) hazards and vulnerable conditions within the area and time period.
2NgwoLow–Medium
3Okwojo-NgwoLow–Medium
4AsataLow–Medium
5GRALow–Medium
6Trans-EkuluLow–Medium
7Hill-TopLow–Medium
8Coal CampLow–Medium
9OgbeteLow–Medium
10AkamaLow–Medium
11UmuaseLow–Medium
12UkakuMedium
13OkweMedium–High
14Ngwo-AsaMedium
Table 5. Summary of vulnerability assessment analysis from 2023 to 2024 over the fourteen investigation locations within our study area.
Investigation LocationsDimension of VulnerabilityPotential Damage (%)Hazard Intensity (1–2)Severity Score
(None, Low, Medium, High, Critical) %
Average Horizontal DeformationAverage
Vertical Subsidence
Average
Horizontal Deformation
Average
Vertical Subsidence
Abor1. Physical vulnerability impact
2. Social vulnerability impact
3. Institutional vulnerability impact.
4. Economic vulnerability impact.
5. Environmental vulnerability impact.
6. Cultural vulnerability impact.
−6%−8%11Road—1.1% (Low)
Building—1.1% (Low)
Population Density—1.1% (Low)
Ngwo−5%−7%11Road—6.1% (Low)
Building—1.5% (Low)
Population Density—2% (Low)
Okwojo-Ngwo−5%−5%12Road—3.9% (Low)
Building—1.1% (Low)
Population Density—1.6% (Low)
Asata−11%−9%11Road—11.2% (Low)
Building—22.5% (Low)
Population Density—5.8% (Low)
GRA−10%−9%11Road—11.8% (Low)
Building—12.4% (Low)
Population Density—5% (Low)
Trans-Ekulu−8%−4%11Road—11% (Low)
Building—13.6% (Low)
Population Density—5.6% (Low)
Hill-Top−3%−9%12Road—2.3% (Low)
Building—1.4% (Low)
Population Density—1.4% (Low)
Coal Camp−13%−15%11Road—3.8% (Low)
Building—5.5% (Low)
Population—2.5% (Low)
Ogbete−10%−9%11Road—7.9% (Low)
Building—10.3% (Low)
Population Density—2.1% (Low)
Akama−11%−9%11Road—7.1% (Low)
Building—1.6% (Low)
Population Density—1.1% (Low)
Umuase−9%−7%11Road—5.1% (Low)
Building—1.3% (Low)
Population—1.5% (Low)
Ukaku−2%0%22Road—3.5% (Low)
Building—1.1% (Low)
Population Density—1.1% (Low)
Okwe4.5%4.5%22Road—4.1% (Low)
Building—1.1% (Low)
Population Density—1.1% (Low)
Ngwo-Asa−2%−2%22Road—2.3% (Low)
Building—1.2% (Low)
Population Density—1.3% (Low)
Disclaimer/Publisher’s Note: The statements, opinions and data contained in all publications are solely those of the individual author(s) and contributor(s) and not of MDPI and/or the editor(s). MDPI and/or the editor(s) disclaim responsibility for any injury to people or property resulting from any ideas, methods, instructions or products referred to in the content.