Article

Carbon Nitrogen Isotope Coupling of Soils and Seasonal Variation Characteristics in a Small Karst Watershed in Southern China

1
School of Karst Science, Guizhou Normal University, Guiyang 550001, China
2
State Engineering Technology Institute for Karst Desertification Control, Guiyang 550001, China
*
Authors to whom correspondence should be addressed.
Land 2023, 12(2), 501; https://doi.org/10.3390/land12020501
Submission received: 2 December 2022 / Revised: 11 February 2023 / Accepted: 15 February 2023 / Published: 17 February 2023

Abstract

:
Carbon and nitrogen are among the most important biogenic elements in terrestrial ecosystems, and carbon and nitrogen stable isotopes (δ13C and δ15N) are often used to indicate the sources of carbon and nitrogen elements and turnover processes, and the study of C and N isotopes coupling can provide more precise indications. To this end, this study was conducted to investigate the effects of different land use types on soil organic carbon (SOC), soil organic nitrogen (SON) and the coupling relationship of C-N isotopes, as well as to reveal the seasonal variation characteristics of soil C and N. The results showed that SOC and SON contents of forest land were significantly higher than those of agricultural land and grassland. The soil C/N was significantly higher in the dry season than in the rainy season (p < 0.01), indicating that the decomposition rate of soil organic matter (SOM) was faster in the rainy season, which was not conducive to the accumulation of soil C. Soil δ13C and δ15N coupling showed seasonal characteristics: soil δ13C and δ15N did not have a good linear relationship in the rainy season, but showed a significant positive correlation in the dry season (r2 = 0.75, p < 0.05), indicating that there are differences in the soil C-N isotope fractionation coupling under the influence of climatic factors. This study provides a reference for regional land resource management as well as carbon and nitrogen cycle studies in karst areas.

1. Introduction

The karst region in Southern China has fragmented land and limited arable land resources [1]. The increasing population and the rising standard of living of the people have led to an increasing demand for food [2], and due to the population carrying capacity limitation of the ecosystem, one of the major measures to solve the demand problem is to reclaim forest land to expand agricultural land. However, the conversion of forest land to agricultural land must be accompanied by a reduction in soil nutrient levels, such as carbon, nitrogen and phosphorus [3]. SOC, SON and their stable isotopic compositions (δ13C and δ15N) are important material forms in the material cycle of terrestrial ecosystems and are also one of the factors that cause climate change that cannot be ignored [4,5]. δ13C and δ15N can also indicate terrestrial ecosystem carbon and nitrogen cycling [6,7]. Understanding the biochemical cycles of these two elements and their coupling is of great scientific importance for regional agricultural development and land use management.
Understanding the spatial and temporal changes in SOC and SON, as well as those of their stable isotopes can contribute to an in-depth understanding of the environmental changes and regional carbon sinks [8,9,10]. However, most of the previous literature focused on the changes in single processes of SOC and total nitrogen (TN) under land use change [11,12,13]. However, the biogeochemical cycling of C and N elements in terrestrial ecosystems often interacts with each other. The seldom simultaneous inclusion of both in the study has led to a very limited understanding of their coupling and the fractional coupling of stable isotopes. Moreover, the changes of C and N during land use change are not completely uniform due to the influence of vegetation type, climatic conditions and microbial activity [14]. For example, Rumpel and Kogel-Knabner [15] showed that the SOC and SON in forest soils were significantly higher than in agricultural land and grazing land, while Yang Gao et al. [16] studied orchards and farmland in subtropical China soils and found that C and N density and storage were significantly higher than those in forest land. Tesfaye [17] suggested that land use type and soil depth are important influencing factors in the transformation of SOC and SON, while the spatial and temporal changes in SOC and SON with land use changes in karst areas and the interrelationship with their stable isotopes deserve attention.
From the 1980s to the present, stable isotope techniques have been widely used in the field of soil cycle research, mainly to study the contribution of soil carbon to terrestrial carbon sinks and its turnover process [18], and soil C and N cycling processes [19]. Meanwhile, these techniques can also be used to predict soil carbon and nitrogen dynamics in the context of future land use change and climate change and to assess the decomposition rate of organic carbon [20,21,22]. Previous studies have shown that differences in climatic conditions, topography and soil parent material allow for differences in the feedback of land use changes on SOC and SON dynamics [23,24]. In addition, fractionation of 13C by soil microorganisms during soil organic matter decomposition can interfere with the accurate indication of SOC sources [25], and similarly, excessive use of synthetic N fertilizers (15N depletion) in agricultural land leads to multiple forms of N loss, thus making the soil transformation process different from the enrichment of heavier 15N in the residual substrate [26]. It has been shown that soil transformation processes are different from the enrichment of heavier 15N in the residual matrix, and that land use changes lead to alternating soil C and N sources and their transformation processes, and it is difficult to explain the fate of soil C and N with a single C and N stable isotope study method. In previous studies, the coupling of δ13C and δ15N in soil profiles has been used to show the conversion rate of SOM in C3 forests; however, whether the coupling of δ13C and δ15N can provide more accurate indications of elemental sources and their conversion processes under land use changes needs further validation.
The karst region in Southern China is the largest area; and has the most strongly developed karst area, and it has the most prominent human land conflict among the global karst concentration distribution areas [27,28]. The ecological environment is fragile, and the binary three-dimensional spatial structure above and below the ground makes it characteristic of rapid surface water loss [29], and coupled with unreasonable human reclamation leads to a large loss of nitrogen from the soil, leaving the soil nitrogen in an unsaturated state for a long time, this has led to the nitrogen limitation of plant growth [30]. However, in karst areas with climate change and frequent extreme weather, coupled with the increase in regional population and the continuous improvement of people’s living standards (leading to a shortage of unit land supply), a large amount of native forest land has been reclaimed for cultivation to meet the growing demand of people, and the conversion of forest land into cultivated land has caused changes in the ecological environment, resulting in an imbalance in the carbon and nitrogen ecological stoichiometry of its ecosystem, and breaking the long-established adaptations and the inherent constant coupling relationships between different elemental biochemical cycles. Thus, those biological, chemical and physical reflective processes associated with the carbon and nitrogen cycles have been changed accordingly [8]. To this end, the main objectives of this study were to understand the relationships of soil C-N stable isotope coupling and its seasonal characteristics in karst areas, to investigate the coupling between δ13C and δ15N in soil profiles under land use changes in small karst watersheds in Southern China, to understand the intrinsic correlation between the content of SOC and SON and their stable isotope (δ13C, δ15N) composition, and to determine the soil δ13C and δ15N seasonal characteristics in the rainy and dry seasons. We propose the hypothesis that: soil δ13C and δ15N values differ significantly in seasonal variation; climate factors can influence the soil δ13C and δ15N coupling relationships. This study can provide a reference for the study of soil carbon sinks in karst regions and land resource management in the context of global warming.

2. Materials and Methods

2.1. Overview of the Study Area

The study area is located in the Heichong sub-basin of Qiandongnan Prefecture, Southern China (108°01′36″~108°10′52″ E, 27°04′51″~27°13′56″ N), where dolomitic carbonate rocks are widely distributed and belong to the typical dolomite karst landscape, and the karst landscape area accounts for 82% of the total area of the region. Most of its areas are between 500–1200 m in elevation, with an average elevation of 912 m. The area has complex geological and geomorphological development, and it is the world’s most completely preserved karst of this type in the world. According to the meteorological monitoring from 2020 to 2021, the annual precipitation in the region ranges from 1060 to 1200 mm, with an uneven distribution of rainfall seasons, which are mainly concentrated in the period from April-September (rainy season), with rainfall in the rainy season accounting for 75% of the total rainfall for the year and a temperate climate with an average annual humidity of 80%. The average annual sunshine duration is 1200 h, the maximum temperature is 38.4 °C, the minimum temperature is 7.6 °C, and the average annual temperature is 16 °C, which is typical of a temperate monsoon climate in the central subtropics. The bedrock type of the entire study area is the dolomite of Cambrian-Shilengshui formation, and the thicknesses of the soil layers vary greatly (the depth of the soil profiles between different land types range from 5 to 110 cm). The area is mainly coniferous forests dominated by horsetail pine and mixed coniferous and broad forests dominated by Polygonace and Magnoliidae.

2.2. Sample Collection and Processing

Six dominant crop soil profiles were sampled in July 2020 (rainy season) and January 2021 (dry season) in the selected sub-watersheds, namely, forest land (FL), peach (PC), paddy land (PL), tobacco field (TF), maize field (MF) and grassland (GL), in which the forests, paddy, peach and tobacco were primarily C3 plants and the maize and grassland were mainly C4 plants. Three sampling points of similar elevation were selected for each land type in the small karst watershed and each sampling point was evenly arranged along the diagonal in a 10 m × 3 m sample square. Five samples were collected from each sample site in the 0–20 cm and 20–40 cm soil layers along the “S” curve for each layer, and two layers were collected from each sample site (0–20 cm for the soil surface layer, 20–40 cm for sub-layer). From each layer, we collected five samples mixed into one sample, and put them in self-sealing bags for preservation. In total, we collected 72 soil profile samples. The specific sampling point information is shown in Table 1. Soil samples were collected twice, and the first sample was taken in July to mark each sampling point for the sample collection in the rainy season. The collected soil samples were dried outdoors in a cool place, and the grains of debris, plant roots and plant foliage were removed, ground and passed through a 60 mesh sieve (0.25 mm). The finely ground soil samples were soaked in a beaker with 1 mol·L−1 HCl for 24 h at room temperature to remove carbonates from the samples, and washed with deionized water to neutral. Similarly, the inorganic nitrogen (largely NH4+) was removed from the soil samples by soaking with 2 mol·L−1 KCl for 24 h, washing them to neutrality, and then drying them in an oven at 60 °C. Then, the samples were ground again and stored for subsequent analysis [31].
For the determination of the stable isotopes, 2–5 mg samples were weighed for δ13C and 9–11 mg samples were weighed for δ15N, respectively, using a one-millionth balance (WXTS3DU, Mettler Toledo, Zurich, Switzerland), and both were determined using an elemental analysis-stable isotope ratio mass spectrometer (EA IsoLink + Delta V Advantage, Thermo Fisher, Waltham, MA, USA) to determine the amount of δ13CSOC and δ15NSON in the samples, with a test accuracy of ≤0.1‰. The weighed soil samples were wrapped in tin cups, and one standard sample and one parallel sample were put in 15 samples for calibration during the measurement process, with an error of the sample duplication of <0.05‰. The reference standards were selected as V-PDB (δ13C = 1.124‰) and N2-AIR, and the isotopic ratios of the δ13CSOC and δ15NSON in the samples were calculated according to the international standard formula [32].
δ C 13 = C 13 / C 12 s a m p l e / C 13 / C 12 V P D B 1 × 1000
δ N 15 = N 15 / N 14 s a m p l e / N 15 / N 14 a i r 1 × 1000
In Formula (1), (13C/12C) sample represents the C isotope ratio in the sample, (13C/12C)VPDB represents the C isotope ratio of the international standard VPDB (Vienna PeeDee Belemnite. In Formula (2), (15N/14N) sample represents the N isotope ratio in the sample, (15N/14N)air represents the N isotope ratio of N2 in the atmosphere. Each sample was run in duplicate. The overall accuracy of δ13C and δ15N measurements were ±0.2‰ and ±0.25‰, respectively.

2.3. Statistical Analysis

The normality of all parameter sets was tested with a K–S test, and the significance (p < 0.05) of the SOC, SON, δ13C, δ15N and C/N in the different land use types was analyzed by one-way ANOVA and the least significant difference (LSD). A Pearson correlation analysis was used to test the correlation between the indicators. A linear regression analysis was used to understand the relationship between δ13C and δ15N of the organic matter in the soil corresponding to C3 plants and C4 plants, and the box-plot test was used to remove the outliers, plot the best-fit line, and determine the equations, r coefficients and p-values. All data were statistically analyzed using IBM SPSS 25, and the data were edited and visualized using Excel 2019 and Origin 2018.

3. Results

3.1. Seasonal Variation of SOC, SON, and C/N in the Soil Profiles of the Different Land Types

In the soil layer profiles of the six different land types, the average variation in SOC content (0–40 cm) in the rainy and dry seasons ranged from 0.32% to 11.19% and from 0.49% to 7.67%, respectively (Figure 1a,b). The maximum values of the SOC contents came from the forest soil profiles, and the organic carbon content of the forest profiles was significantly higher than that of the other five land types (p < 0.05). The SOC contents of the paddy fields were significantly higher than those of the grassland and roasted tobacco fields (p < 0.05), while the SOC contents of the remaining land types were not significantly different. In terms of seasonal variation, there was no significant difference in SOC content among land types (p > 0.05). In the rainy season, the maximum SOC content of all land types, with the exception of the peach and paddy fields, was found in the soil surface layer (0–20 cm), while the SOC contents of the forest and roasted tobacco soils showed the maximum value in the 20–40 cm soil layer in the dry season.
The SON contents of all of the soil profile samples ranged from 0.14% to 0.63% and from 0.05% to 0.44% in the dry and rainy seasons, respectively (Figure 1c,d), similarly, the maximum SON content occurred in the arboreal forest soil profile. The mean values of SON contents in the six land types of soil samples in the dry season were arboreal FL > PL > MF > TF > PC > GL, while in the rainy season, the mean values of soil SON contents were FL > PL > MF > PC > GL > TF. Analysis by a paired-sample t-test showed that, unlike organic carbon, SON contents were significantly different due to seasonal variation (p < 0.05). Specifically, in the rainy season, the soil organic N contents of the tree woodland and paddy land samples were significantly higher than those of the maize, peach and tobacco fields and grassland, and there was no significant difference between the SON contents of the forest land and the paddy land. In the dry season, there was no significant difference in the SON contents of the forest land and tobacco field. The correlation analysis showed that SOC and SON were highly significantly and positively correlated with soil C/N (p < 0.01), indicating a strong coupling relationship between SOC and SON in karst areas.
The magnitude of soil C/N affects the microbial activity in the soil, which in turn affects the rate of organic matter decomposition. The soil C/N also responds to the coupling relationship between soil C and N and is an important indicator for evaluating the level of soil quality [9,10]. The C/N of all soil samples ranged from 1.29 to 23.37 and from 7.69 to 30.34 in the rainy and dry seasons, respectively, with significant differences (p < 0.05) in the seasonal variation of soil C/N, which was significantly higher in the dry season than in the rainy season. In addition, except for forest and grassland, the mean soil C/N values of several agricultural land types in the rainy and dry seasons were 4.64 and 10.57, respectively, which were lower than those of the soil C/N ratios of global ecosystems (14.3) and grassland ecosystems (13.8). This indicates that the rates of SOM decomposition and soil mineralization in the southwest karst region are higher than the global level.
The pH of all soil samples ranged from 6.75 to 7.63 and from 6.05 to 7.86 in the rainy and dry seasons, respectively. In the correlation analysis of SOC, SON, soil C/N and soil pH, it was found that SOC and SON contents did not decrease with increasing soil pH at all times, but they showed the following significant differences due to seasonal changes: there was a significant negative correlation between SOC, SON and soil pH in the rainy season, such that the lower the organic carbon and organic nitrogen content, the higher their corresponding soil pH. In addition, there was a significant positive correlation between the SOC, SON, soil C/N and soil pH for all of the samples in the dry season (Table 2).

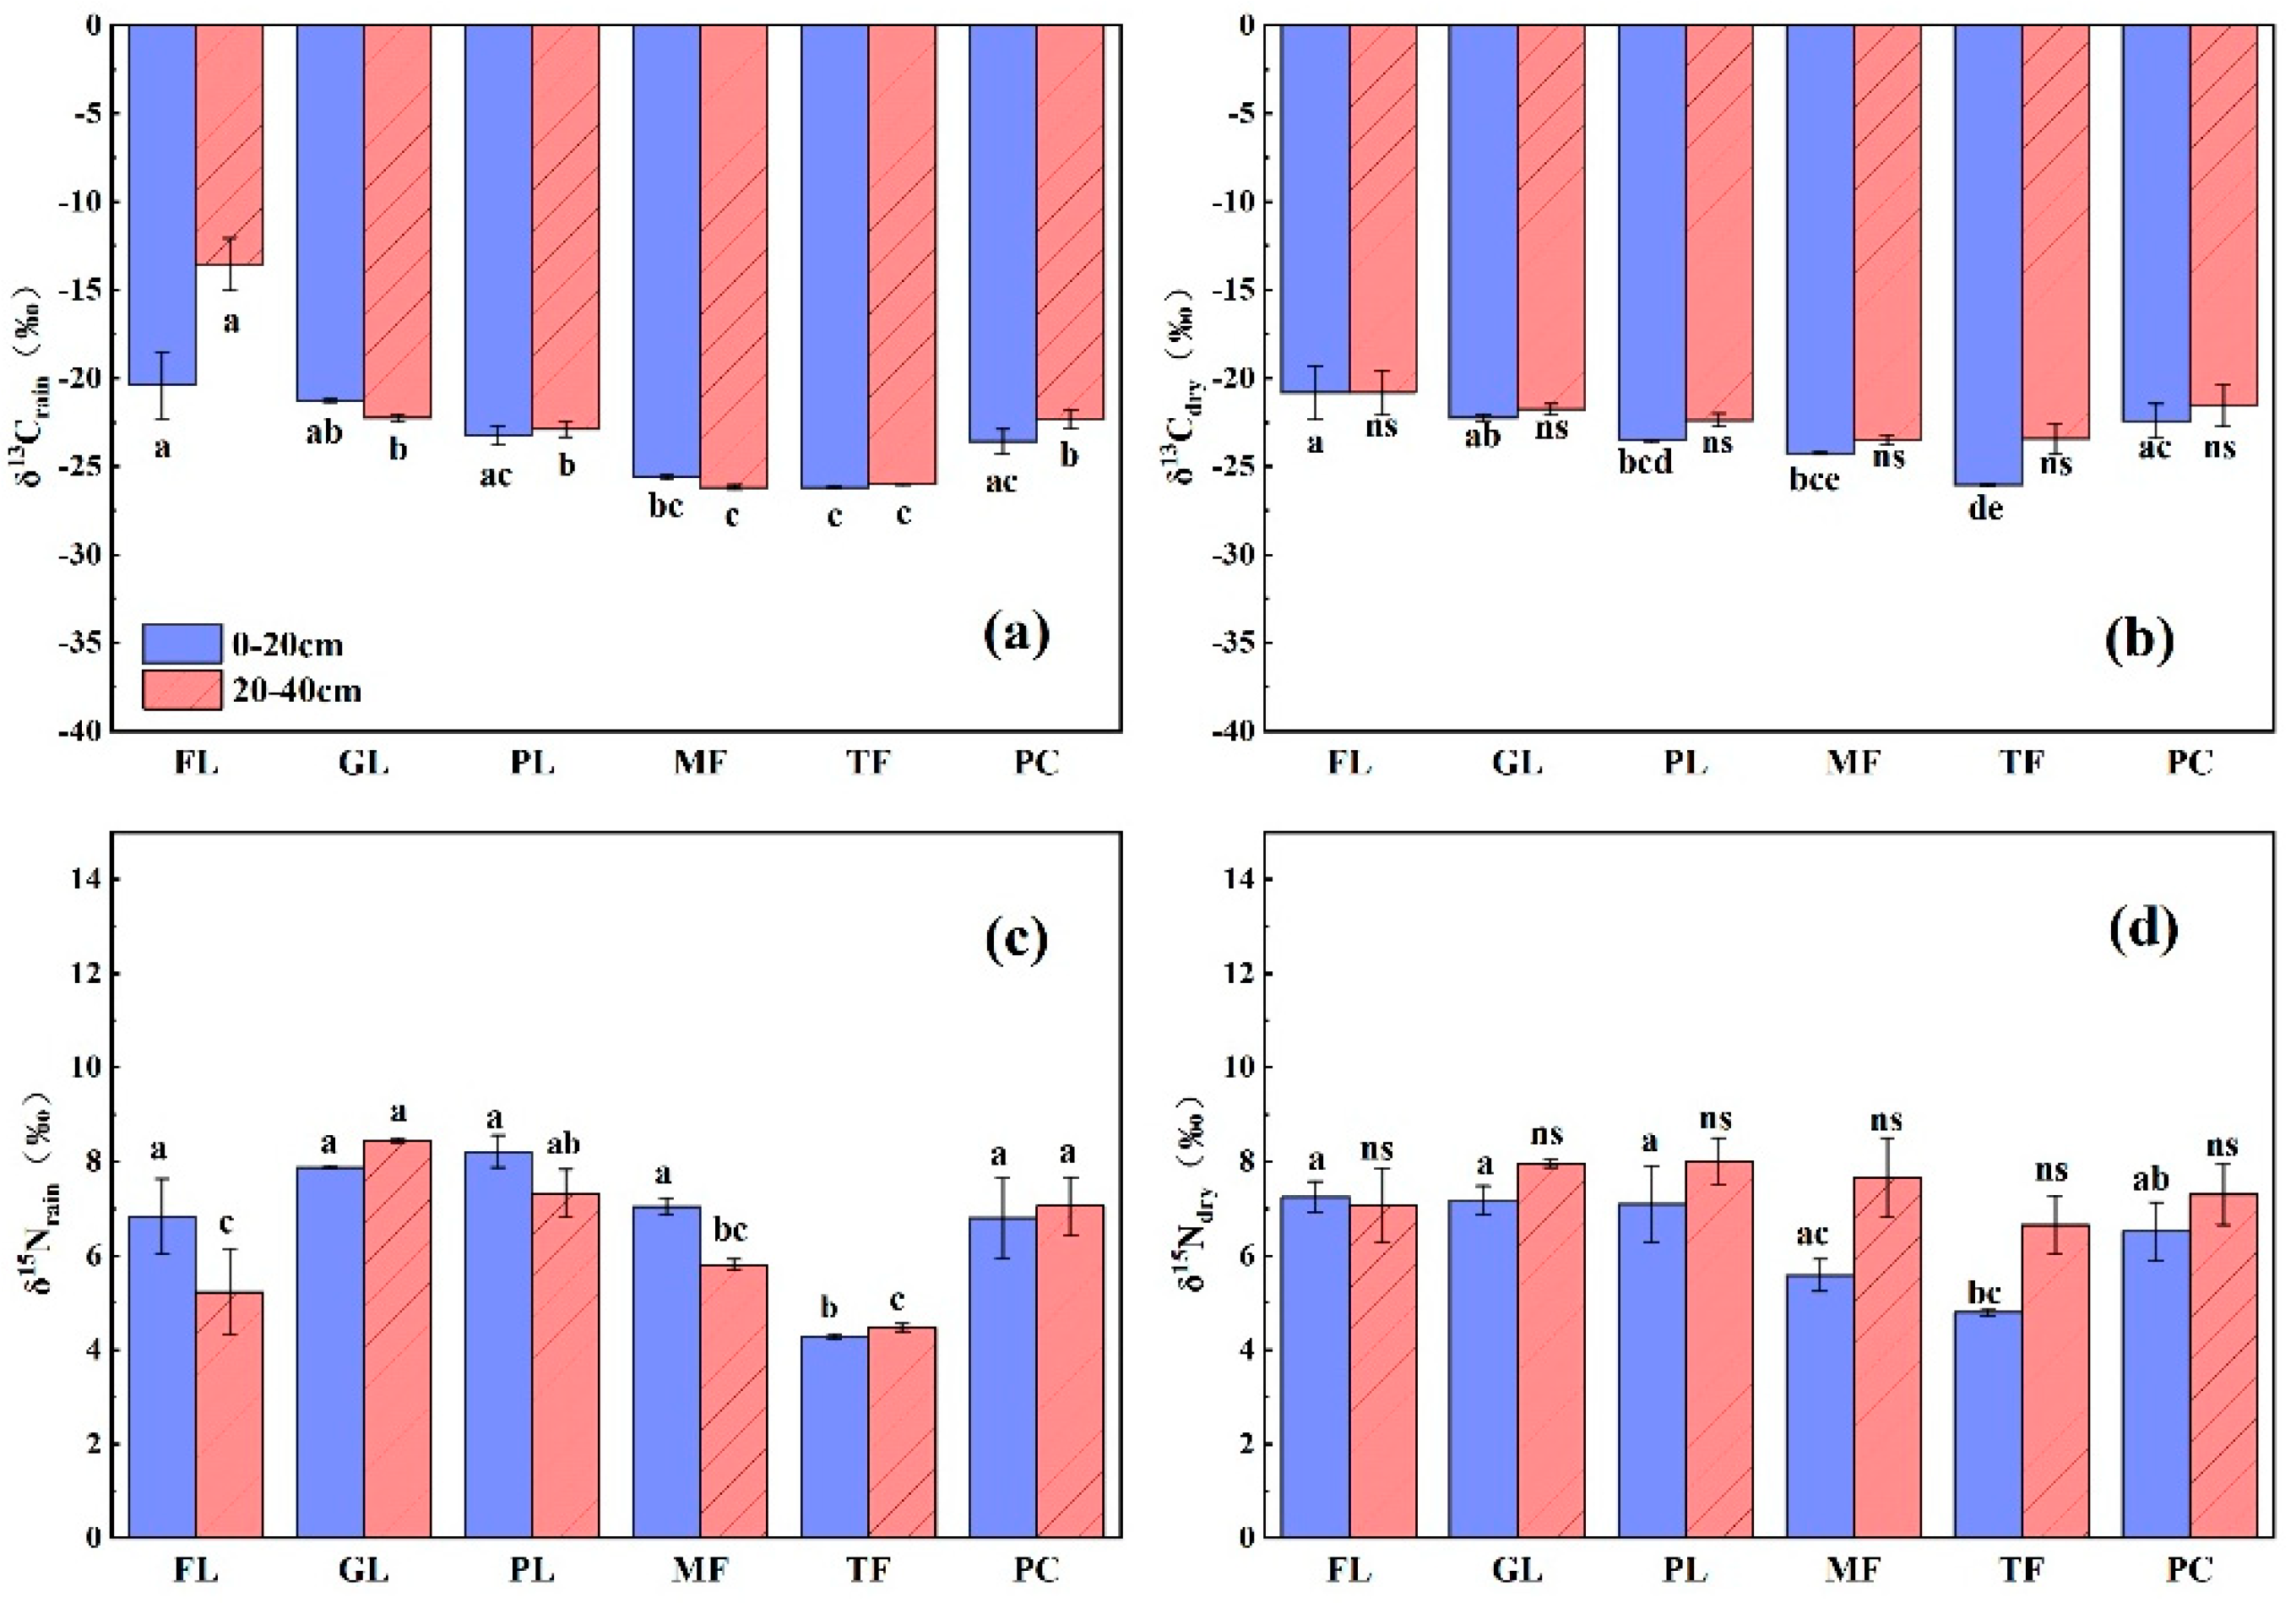
3.2. Seasonal Distribution Characteristics of Stable Isotopes δ13C and δ15N in the SOM of Different Land Types

The δ13C values in the soils of all the land types in this study were more negative in the rainy season than in the dry season, and the mean values varied from −26.2‰ to −13.5‰ and form −26.06‰ to −20.84‰, respectively (Figure 2a,b). In the rainy season, the δ13C values in the SOM of the forest land were significantly higher than those of other land use types, with the exception of grassland, whose soil δ13C values were significantly higher than those of peach and paddy land, while the δ13C values of soils in the rest of the land use types were not significantly different. In the dry season, the δ13C values of forest land soils were significantly higher than those of the maize field and peach and paddy land, and the δ13C values of the grassland and roasted tobacco soils were significantly higher than those of the paddy lands, while there were no significant differences among the remaining land use types. In terms of seasonal variation, there were no significant differences in the soil δ13C values among the land types (p > 0.05), and the most negative soil δ13C values occurred in the surface layer of soil (0–20 cm) from the paddy lands in both the rainy and dry seasons. Soil δ13C values showed a significant positive correlation with SOC (p < 0.01) and a significant positive correlation with soil C/N in all land use types. In contrast, previous studies differed in that soil δ13C values showed significant positive correlations with SON only in the dry season, and no significant correlations were found between soil δ13C values and SON in the rainy season (Table 2).
The mean δ15N values in soils varied in the rainy and dry seasons in the atmosphere of 4.28‰ to 8.45‰ and 4.79‰ to 8.01‰, respectively, and the maximum δ15N values were found in the soil surface layer of maize fields, while forests and paddy lands had relatively negative δ15N values in the rainy season (Figure 2c,d). In general, there was no significant difference in seasonal variation of soil δ15N values. The correlation of soil δ15N with soil δ13C and SON showed seasonal differences, as follows: there was no significant correlation between soil δ15N and δ13C in the rainy season, and there was a highly significant negative correlation with SON (p < 0.01). However, the soil δ15N had a highly significantly positive correlation with δ13C in the dry season, and did not reach significance levels with SOC, SON, soil C/N and soil pH.

4. Discussion

4.1. Effect of Land Use Type on SOC and SON

Previous studies have shown that the SOC content in native forests is significantly higher than that in other land use types [3,33,34]. This is consistent with the results of this study, where the organic matter content and soil fertility of native woodlands were significantly higher than those of grasslands and agricultural lands, and the effect of different land uses on SOM content is largely dependent on the type of vegetation function [35,36,37]. Differences in plant biomass exist between different land use types, and plant biomass decreases when native forest land is converted to agricultural land [34]. Differences in plant biomass directly affect the input of SOM through plant roots and its secretions, as well as the plant apoplast [38]. In the karst region of Southern China, there are fewer land resources suitable for cultivation, and for this reason, deforestation and long-term cultivation have become the main solutions to the limited arable land in the karst region. The long-term tillage of agricultural land destabilizes soil aggregates and reduces soil microbial populations, thus accelerating the rate of organic matter decomposition [39,40].
The differences in organic matter input and decomposition reflect the effects of different land use types on soil SOC and SON contents, and the conversion of native forest to agricultural land or grassland significantly reduces organic carbon stocks [41,42]. The results of this study are consistent with previous results that found that the native forests in the karst areas have higher SOC and SON contents than those of grassland and agricultural land (Figure 1), which is mainly due to the shallow soil layer in karst areas, whose top soil is the main area for agricultural cultivation, plant roots and soil microbial activities, in addition to the main area where land use type affects the SOM content [43]. Moreover, Shibing belongs to a typical central subtropical monsoon climate with active soil microorganisms, which is more conducive to plant biomass accumulation than dry and cold areas, providing a large amount of organic substrate for surface soil microbial metabolism (National Soil Survey Office (NSSO, 1998)). In addition, the use of organic fertilizers and the return of organic materials, such as rice straw, to the field can improve the soil’s physicochemical properties and significantly increase SOC and SON contents [44]. The results of the present study were similar in that the soil layers of paddy fields had more SOC and SON contents than those of other agricultural land and grassland during the rainy season (Figure 1), which may be due to the long-term use of organic pig manure and the enhanced conservation of SOC through the return of rice straw to the field, as was seen in this study area, resulting in more effective carbon.

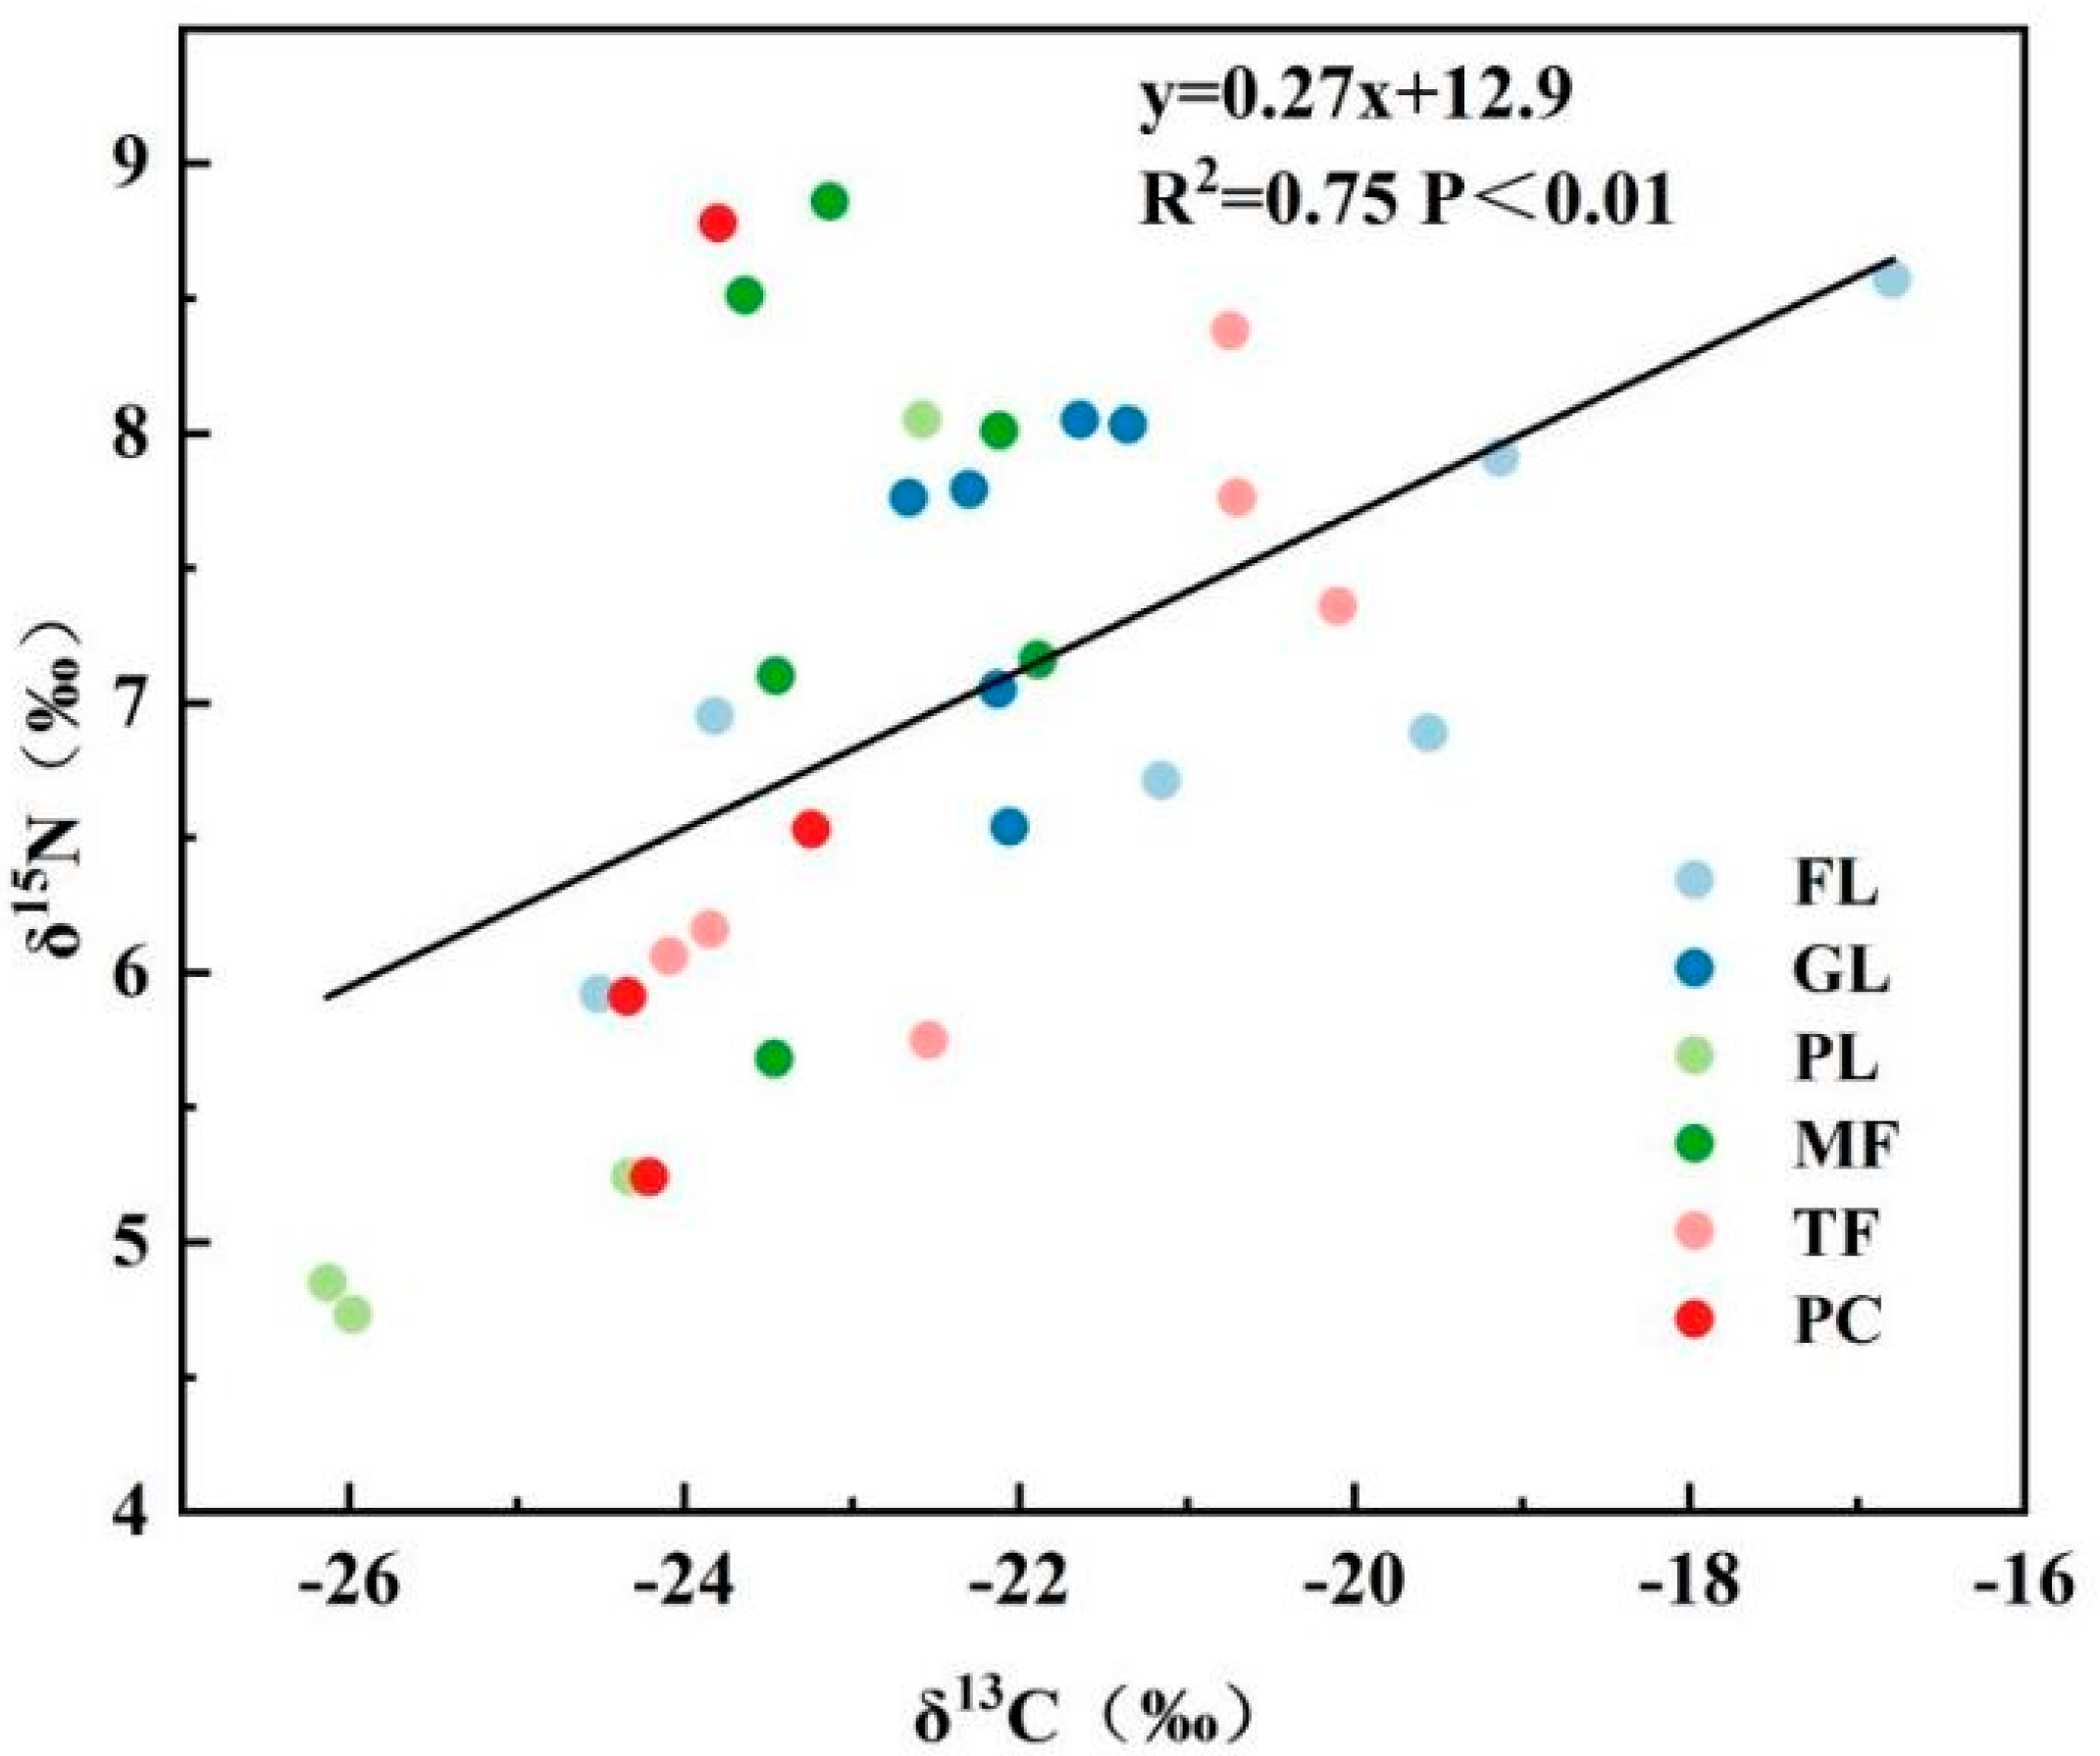
4.2. Intrinsic Correlation of Soil Ecological Stoichiometry (SOC, SON, C\N and pH) with δ13C and δ15N

Soil C/N is an important parameter reflecting soil C and N balance and mineralization, as well as the coupling relationship between soil C and N [45]. The soil C/N in this study area is significantly higher in the dry season than in the rainy season, in general, a higher soil C/N causes the biological activity of microorganisms in the soil to be limited by the soil N and the fractionation of δ15N during mineralization is thus attenuated [46]. On the contrary, the biological activity of microorganisms under low soil C/N conditions is limited by soil C, and it enhances the decomposition of soil N during mineralization [47]. This indicates that the rate of SOM decomposition is greater in the rainy season than in the dry season (foe tillage as well as the crop growing season) in this study area and that the dry season favors soil C accumulation. Previous studies have shown that soil δ15N is significantly negatively correlated with C/N and significantly positively correlated with pH [48]. Previous studies have also shown a weak correlation between soil δ15N and C/N and a positive correlation with pH, and although this was statistically significant, it has a low correlation coefficient [49]. The present study showed that soil δ15N was negatively correlated with C/N in the rainy season and positively correlated in the dry season, and similarly, δ15N was positively correlated with pH in the rainy season and negatively correlated in the dry season, but they did not reach significance levels (Table 2). Which has some similarity with previous studies, indicating that either the soil δ15N fractionation in this study area was affected by the soil pH, or was also disturbed by other main control factors, and thus needs to be further investigated.
The fractionation of δ13CSOC during the microbial decomposition of organic residues is the main cause of soil δ13C enrichment, and so δ13CSOC during land use change provides an effective method for assessing organic matter turnover, as well as the rate of soil microbial decomposition [50,51]. This is due to the faster decomposition of soil SOC at a lower soil C/N, the high release of 12CO2 and the enrichment of 13C from the remaining soil C pool [52,53]. The results of this study showed a significant positive correlation between soil δ13C and C/N in the rainy season (r2 of 0.45), and no significant correlation in the dry season (p > 0.05). The results of this study are somewhat different from those of Wang, G. and Yu, Y. et al, who studied a negative correlation between the soil C/N ratio and δ13C in plantation forests in karst areas [49,52]. The reason for this may be that the different local microclimates in the study area make the vegetation species, as well as the number of vegetation in their areas different, which leads to a large difference in the environmental adaptation strategies of vegetation, as well as the way of resource utilization. Soil C/N was significantly higher in the dry season than in the rainy season. The strong correlation between soil δ13C and soil C/N may be influenced by other environmental factors and cannot be used as the only basis for judgment.

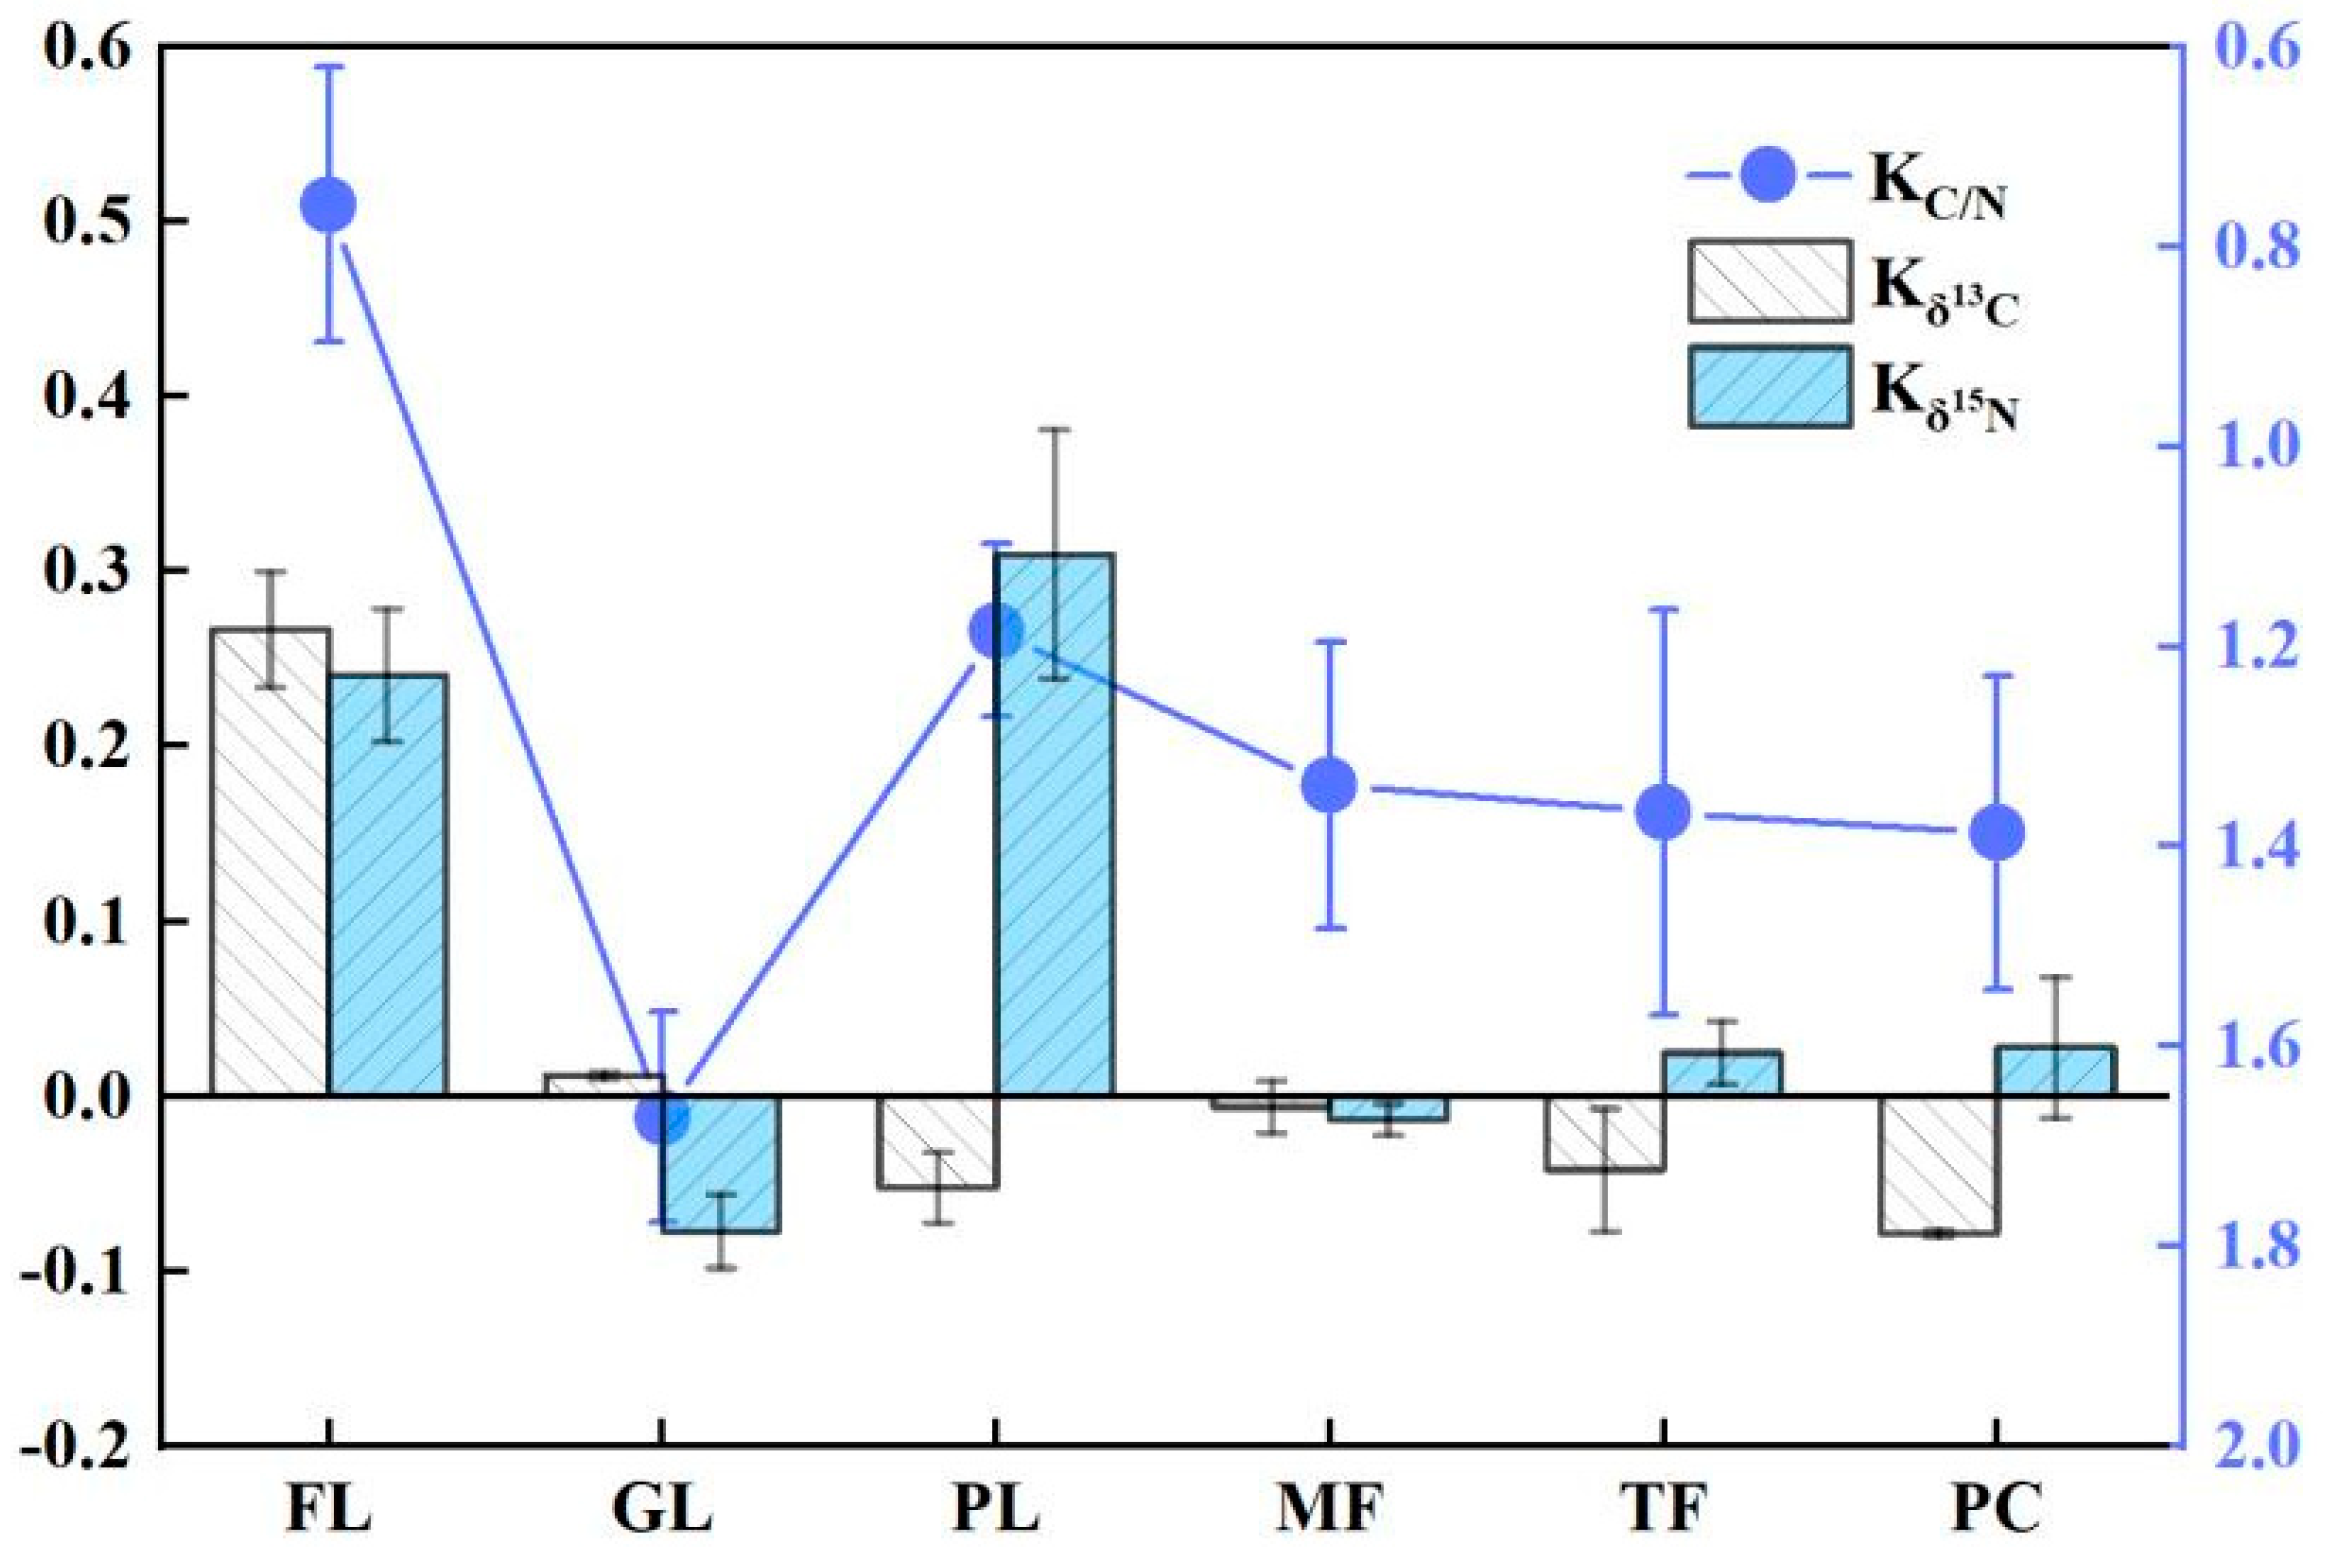
4.3. Seasonal Characteristics of C and N Isotope Fractionation Coupling in Soil Organic Matter

In the southern karst region, a single δ13C cannot reflect the migration and transformation processes of SOM due to the shallow soil layer that is susceptible to bedrock, as well as rotational crop cultivation. Similarly, the influence of land use changes and fertilizer applications lead to changes in the soil δ15N fractionation, and thus a single δ15N value cannot reflect the migration and transformation processes of the soil N in karst areas [33]. In general, δ13C and δ15N of SOM increase with the increasing depths of the soil layers in the absence of land use changes and fertilization [19,54]. The organic matter decomposition time is longer in deeper soil layers, compared to that of the soil surface layer, which facilitates the accumulation of large amounts of soil 13C [55]. However, in this study, it was found that the soil δ13C and δ15N did not exactly increase with the increase in soil layers in both the rainy and dry seasons, and it partly showed a relative enrichment of the soil surface layer than the deeper layers, such that the soil δ15N showed the most obvious performance (Figure 2c,d), which may have been due to the conversion from native forest to arable land and the application of chemical fertilizers on the one hand, and the anthropogenic disturbance to break the soil carbon and nitrogen. On the other hand, in the study area, people distributed rice straw (C4 plants) and corn stalks (C3 plants) to the fields after the autumn harvest and planting rotation patterns were completed, and the C3 and C4 planting rotation and fielding treatments made the soil organic carbon δ13C levels in the agricultural land rise a result of mixing the old carbon from the initial planting crop and the new carbon from the later crop rotation [49,56], which led to the soil profile’s δ13C and δ15N values being irregularly distributed.
15N-depleted NO3− loss is an important influencing factor of deep soil δ15N values. This is because the SON in soil produces NH4+ through mineralization and, subsequently, NH4+ is nitrated to NO3− by nitrifying bacteria, while microorganisms preferentially fix 15N during both mineralization and nitrification, making both the produced NH4+ and NO3− depleted 15N [57,58]. In this study, the controlled native forest δ15N was significantly higher than that of grasslands, paddy lands and maize fields only in the rainy season, and it showed no significant difference from other land use types in the dry season. This indicates that the soil NO3− loss through leaching caused by heavy rainfall is greater in the wet season, compared to the dry season, which also implies that 15N-depleted inorganic N is more likely to be stored in the soil system in the dry season, making soil δ15N values higher in the dry season than in the wet season. In addition, because of the strong natural correlation between carbon and nitrogen [59], considering only the correlation between soil C and soil N is not conducive to better revealing the interrelationship between carbon and nitrogen and their stable isotopes during land use changes. For this reason, this paper used the soil C/N ratio and its stable isotope change rate (K) to express the coupling relationship, and it found that, except for native forests and maize fields, the change rates of soil δ13C and δ15N from the rainy season to the dry season in other land types were not consistent and changed in opposite directions, and the change rates of soil C/N were relatively stable (Figure 3), indicating that soil SOC and SON have a better coupling relationship. Some studies have shown that soil SOC and SON are significantly and positively correlated with soil temperature and rainfall, and their changes are more sensitive to rainfall and temperature [60,61]. In this study, it was also found that soil δ13C and δ15N had a good linear relationship overall in the dry season regardless of the tree woodland or other land types (Figure 4), while δ13C and δ15N did not have a significant linear relationship in the rainy season (p > 0.05). The reasons for this were that in the dry season, soil moisture content is low and water loss is reduced, and so the soil δ13C and δ15N showed a numerical relationship. The second reason is that the rainy season is a period of peak crop growth, and the soil mineralization process is strong in the rainy season due to anthropogenic fertilization or the degradation of apoplastic matter (the results of this paper showed that soil C/N was higher in the dry season than in the rainy season), resulting in negative δ13C and δ15N. In addition, organic C and organic N showed highly significant positive correlations in both seasons, which was inconsistent with the coupling of δ13C and δ15N. It is possible that during the rainy season, nutrients were relatively abundant, resulting in the desynchronization of C and N utilization efficiency by plants, but the exact reasons for this need to be analyzed in depth.

5. Conclusions

The conversion of forest land into agricultural land, such as paddy land and maize field changes the differences in organic matter input and decomposition, resulting in a significant decrease in SOC and SON. Soil C/N and pH had a strong correlation with SOC and SON, the correlation between pH and soil δ15N was not significant, and the effect of soil pH on soil δ15N fractionation was interfered by other factors with uncertainty. In addition, the results of this study suggest that the correlation between soil C/N and soil δ13C may be influenced by environmental factors, and the use of δ13C to assess the decomposition rate and turnover of SOM has limitations. SOC and SON have a good coupling relationship in both rainy and dry seasons, while the isotopic fractionation coupling of soil δ13C and δ15N has seasonal characteristics, specifically in the rainy season, δ13C and δ15N change inconsistently and the coupling relationship is not obvious, while in the dry season there is a good linear coupling relationship. In summary, the coupling relationship of SOC and SON and C-N isotopic fractionation coupling are not consistent, and the C-N isotopic fractionation coupling is influenced by the climate shadow. How the isotope fractionation responds to climate factors needs further understanding of the degree of influence of different rainfall gradients and temperature on isotope fractionation coupling.

Author Contributions

Y.L. (Ya Liu) analyzed the data and wrote the manuscript. Z.L. conceptualization, methodology and formal analysis. K.X. review and editing, funding acquisition. Y.L. (Yuan Li) methodology, modification and supervision. Y.L. (Yuan Li), X.L. and L.C. Field survey and instrument installation. All members commented on the data analyses and reviewed the manuscript. All authors have read and agreed to the published version of the manuscript.

Funding

This work was supported by the Philosophy and Social Science Planning Key Project of Guizhou Province, China (21GZZB43), the Key Science and Technology Program of Guizhou Provence (No. 5726-28 2017 QianKehe Pingtai Rencai), and the China Overseas Expertise Introduction Program for Discipline Innovation (D17016).

Institutional Review Board Statement

Not applicable.

Informed Consent Statement

Not applicable.

Data Availability Statement

Not applicable.

Acknowledgments

The authors would like to thank each of the editors and reviewers for their contributions to this paper, which enriched the content of this paper. As well as the local residents for their help in the land survey, the National Institute of Engineering and Technology for Karst Desertification Control, School of Karst Science, Guizhou Normal University for providing the experimental equipment and good environment.

Conflicts of Interest

The authors declare no conflict of interest.

References

  1. Ford, D.; Williams, P.D. Karst Hydrogeology and Geomorphology; John Wiley & Sons: Chichester, UK, 2007. [Google Scholar]
  2. Amundson, R.; Berhe, A.A.; Hopmans, J.W.; Olson, C.; Sztein, A.E.; Sparks, D.L. Soil and human security in the 21st century. Science 2015, 348, 126–1071. [Google Scholar] [CrossRef] [PubMed] [Green Version]
  3. Smith, P.; House, J.I.; Bustamante, M.; Sobocká, J.; Harper, R.; Pan, G.; Pugh, T.A. Global change pressures on soils from land use and management. Glob. Chang. Biol. 2016, 22, 1008–1028. [Google Scholar] [CrossRef] [PubMed]
  4. Wang, W.; Sardans, J.; Zeng, C.; Zhong, C.; Li, Y.; Peñuelas, J. Responses of soil nutrient concentrations and stoichiometry to different human land uses in a subtropical tidal wetland. Geoderma 2014, 232, 459–470. [Google Scholar] [CrossRef] [Green Version]
  5. Lei, Z.; Ming-Hua, S.; Shao-Qiang, W. Patterns of soil 15N and total N and their relationships with environmental factors on the Qinghai-Tibetan Plateau. Pedosphere 2014, 24, 232–242. [Google Scholar]
  6. Robinson, D. δ15N as an integrator of the nitrogen cycle. Trends Ecol. Evol. 2001, 16, 153–162. [Google Scholar] [CrossRef] [PubMed]
  7. Zeng, X.; Ni, Z.; Diao, H.; Jiang, K.; Hu, C.; Shao, L.; Huang, W. Root Endophytic Fungal Community and Carbon and Nitrogen Stable Isotope Patterns Differ among Bletilla Species (Orchidaceae). J. Fungi 2021, 7, 69. [Google Scholar] [CrossRef]
  8. Chen, Q.; Sun, Y.; Shen, C.; Peng, S.; Yi, W.; Jiang, M. Organic matter turnover rates and CO2 flux from organic matter decomposition of mountain soil profiles in the subtropical area, south China. Catena 2002, 49, 217–229. [Google Scholar] [CrossRef]
  9. Liu, W.; Wei, J.; Cheng, J.; Li, W. Profile distribution of soil inorganic carbon along a chronosequence of grassland restoration on a 22-year scale in the Chinese Loess Plateau. Catena 2014, 121, 321–329. [Google Scholar] [CrossRef]
  10. Piao, S.; Huang, M.; Liu, Z.; Wang, X. Lower land-use emissions responsible for increased net land carbon sink during the slow warming period. Nat. Geosci. 2018, 11, 739–743. [Google Scholar] [CrossRef] [Green Version]
  11. Sasmito, S.D.; Kuzyakov, Y.; Lubis, A.A. Organic carbon burial and sources in soils of coastal mudflat and mangrove ecosystems. Catena 2020, 187, 104414. [Google Scholar] [CrossRef]
  12. Tian, H.; Shen, X.; Qiu, L. Responses of soil organic carbon and nitrogen to land-use changes in a semiarid region of northwest China. Arid Land Res. Manag. 2020, 34, 188–206. [Google Scholar] [CrossRef]
  13. Li, B.B.; Li, P.P.; Yang, X.M. Land-use conversion changes deep soil organic carbon stock in the Chinese Loess Plateau. Land Degrad. Dev. 2021, 32, 505–517. [Google Scholar] [CrossRef]
  14. Smal, H.; Ligęza, S.; Pranagal, J.; Urban, D.; Pietruczyk-Popławska, D. Changes in the stocks of soil organic carbon, total nitrogen and phosphorus following afforestation of post-arable soils: A chronosequence study. For. Ecol. Manag. 2019, 451, 117536. [Google Scholar] [CrossRef]
  15. Rumpel, C.; Kögel-Knabner, I. Deep soil organic matter—A key but poorly understood component of terrestrial C cycle. Plant Soil 2011, 338, 143–158. [Google Scholar] [CrossRef]
  16. Gao, Y.; He, N.; Yu, G.; Chen, W.; Wang, Q. Long-term effects of different land use types on C, N, and P stoichiometry and storage in subtropical ecosystems: A case study in China. Ecol. Eng. 2014, 67, 171–181. [Google Scholar] [CrossRef]
  17. Tesfaye, M.A.; Bravo, F.; Ruiz-Peinado, R.; Pando, V.; Bravo-Oviedo, A. Impact of changes in land use, species and elevation on soil organic carbon and total nitrogen in Ethiopian Central Highlands. Geoderma 2016, 261, 70–79. [Google Scholar] [CrossRef]
  18. Rustad, L.; Campbell, J.; Marion, G. A meta-analysis of the response of soil respiration, net nitrogen mineralization, and aboveground plant growth to experimental ecosystem warming. Oecologia 2001, 126, 543–562. [Google Scholar] [CrossRef]
  19. Ehleringer, J.R.; Buchmann, N.; Flanagan, L.B. Carbon isotope ratios in belowground carbon cycle processes. Ecol. Appl. 2000, 10, 412–422. [Google Scholar] [CrossRef]
  20. Campbell, J.E.; Fox, J.F.; Davis, C.M. Carbon and nitrogen isotopic measurements from southern Appalachian soils: Assessing soil carbon sequestration under climate and land-use variation. J. Environ. Eng. 2009, 135, 439–448. [Google Scholar] [CrossRef]
  21. Field, C.B.; Campbell, J.E.; Lobell, D.B. Biomass energy: The scale of the potential resource. Trends Ecol. Evol. 2008, 23, 65–72. [Google Scholar] [CrossRef]
  22. Peri, P.; Ladd, B.; Pepper, D.A. Carbon (δ13C) and nitrogen (δ15N) stable isotope composition in plant and soil in S outhern P atagonia’s native forests. Glob. Chang. Biol. 2012, 18, 311–321. [Google Scholar] [CrossRef]
  23. Reddy, K.R.; Patrick, W.H. Effect of alternate aerobic and anaerobic conditions on redox potential, organic matter decomposition and nitrogen loss in a flooded soil. Soil Biol. Biochem. 1975, 7, 87–94. [Google Scholar] [CrossRef]
  24. Fissore, C.; Dalzell, B.J.; Berhe, A.A.; Voegtle, M.; Evans, M.; Wu, A. Influence of topography on soil organic carbon dynamics in a Southern California grassland. Catena 2017, 149, 140–149. [Google Scholar] [CrossRef]
  25. Krull, E.S.; Skjemstad, J.O. δ13C and δ15N profiles in 14C-dated Oxisol and Vertisols as a function of soil chemistry and mineralogy. Geoderma 2003, 112, 1–29. [Google Scholar] [CrossRef]
  26. Choi, W.J.; Kwak, J.H.; Lim, S.S. Synthetic fertilizer and livestock manure differently affect δ15N in the agricultural landscape: A review. Agric. Ecosyst. Environ. 2017, 237, 1–15. [Google Scholar] [CrossRef]
  27. Wang, K.L.; Chen, H.S.; Yue, Y.M. Experiment and demonstration on degraded mechanism and its adaptive restoration of karst ecosystems in Northwest Guangxi. Sci. Technol. Dev. 2015, 11, 179–183. [Google Scholar]
  28. Xiong, K.; Li, J.; Long, M. Characteristics and key problems of soil erosion in typical karst rocky desertification control area. Acta Geogr. Sin. 2012, 67, 878–888. (In Chinese) [Google Scholar]
  29. Xiong, K.; Chen, Q. Discussion on karst rocky desert evolution trend based on ecologically comprehensive treatment. Caisologica Sin. 2010, 29, 50–56. (In Chinese) [Google Scholar]
  30. Tian, H.; Lu, C.; Ciais, P.; Michalak, A.M.; Canadell, J.G.; Saikawa, E.; Wofsy, S.C. The terrestrial biosphere as a net source of greenhouse gases to the atmosphere. Nature 2016, 531, 225–228. [Google Scholar] [CrossRef] [Green Version]
  31. Meng, L.; Ding, W.; Cai, Z. Long-term application of organic manure and nitrogen fertilizer on N2O emissions, soil quality and crop production in a sandy loam soil. Soil Biol. Biochem. 2005, 37, 2037–2045. [Google Scholar] [CrossRef]
  32. Farquhar, G.D.; O’Leary, M.H.; Berry, J.A. On the relationship between carbon isotope discrimination and the intercellular carbon dioxide concentration in leaves. Funct. Plant Biol. 1982, 9, 121–137. [Google Scholar] [CrossRef]
  33. Han, G.; Tang, Y.; Liu, M.; Van Zwieten, L.; Yang, X.; Yu, C.; Song, Z. Carbon-nitrogen isotope coupling of soil organic matter in a karst region under land use change, Southwest China. Agric. Ecosyst. Environ. 2020, 301, 107027. [Google Scholar] [CrossRef]
  34. Aryal, D.R.; Morales Ruiz, D.E.; Tondopó Marroquín, C.N. Soil organic carbon depletion from forests to grasslands conversion in Mexico: A Review. Agriculture 2018, 8, 181. [Google Scholar] [CrossRef] [Green Version]
  35. Han, G.; Li, F.; Tang, Y. Variations in soil organic carbon contents and isotopic compositions under different land uses in a typical karst area in Southwest China. Geochem. J. 2015, 49, 63–71. [Google Scholar] [CrossRef] [Green Version]
  36. Deng, J.; Zhu, W.; Zhou, Y.; Yin, Y. Soil organic carbon chemical functional groups under different revegetation types are coupled with changes in the microbial community composition and the functional genes. Forests 2019, 10, 240. [Google Scholar] [CrossRef] [Green Version]
  37. Paul, E.A. The nature and dynamics of soil organic matter: Plant inputs, microbial transformations, and organic matter stabilization. Soil Biol. Biochem. 2016, 98, 109–126. [Google Scholar] [CrossRef] [Green Version]
  38. Jobbágy, E.G.; Jackson, R.B. The vertical distribution of soil organic carbon and its relation to climate and vegetation. Ecol. Appl. 2000, 10, 423–436. [Google Scholar] [CrossRef]
  39. Six, J.; Elliott, E.T.; Paustian, K. Soil macroaggregate turnover and microaggregate formation: A mechanism for C sequestration under no-tillage agriculture. Soil Biol. Biochem. 2000, 32, 2099–2103. [Google Scholar] [CrossRef]
  40. Liu, M.; Han, G.; Zhang, Q. Effects of soil aggregate stability on soil organic carbon and nitrogen under land use change in an erodible region in Southwest China. Int. J. Environ. Res. Public Health 2019, 16, 3809. [Google Scholar] [CrossRef] [Green Version]
  41. Schulp, C.J.; Nabuurs, G.J.; Verburg, P.H. Future carbon sequestration in Europe—Effects of land use change. Agric. Ecosyst. Environ. 2008, 127, 251–264. [Google Scholar] [CrossRef]
  42. Fang, X.; Xue, Z.; Li, B.; An, S. Soil organic carbon distribution in relation to land use and its storage in a small watershed of the Loess Plateau, China. Catena 2012, 88, 6–13. [Google Scholar] [CrossRef]
  43. Chaopricha, N.T.; Marín-Spiotta, E. Soil burial contributes to deep soil organic carbon storage. Soil Biol. Biochem. 2014, 69, 251–264. [Google Scholar] [CrossRef]
  44. Yu, Q.; Hu, X.; Ma, J.; Ye, J.; Sun, W.; Wang, Q.; Lin, H. Effects of long-term organic material applications on soil carbon and nitrogen fractions in paddy fields. Soil Tillage Res. 2020, 196, 104483. [Google Scholar] [CrossRef]
  45. Liu, L.B.; Zhong, Q.L.; Ni, J. Ecosystem C: N: P stoichiometry and storages of a secondary plateau-surface karst forest in Guizhou Province, southwestern China. Acta Ecol. Sin. 2019, 39, 8606–8614. [Google Scholar]
  46. Collins, J.G.; Dijkstra, P.; Hart, S.C.; Hungate, B.A.; Flood, N.M.; Schwartz, E. Nitrogen source influences natural abundance 15N of Escherichia coli. FEMS Microbiol. Lett. 2008, 282, 246–250. [Google Scholar] [CrossRef] [Green Version]
  47. Vitousek, P. Nutrient cycling and nutrient use efficiency. Am. Nat. 1982, 119, 553–572. [Google Scholar] [CrossRef]
  48. Stevenson, B.A.; Parfitt, R.L.; Schipper, L.A.; Baisden, W.T.; Mudge, P. Relationship between soil δ15N, C/N and N losses across land uses in New Zealand. Agric. Ecosyst. Environ. 2010, 139, 736–741. [Google Scholar] [CrossRef]
  49. Yu, Y.; Wu, Y.; Song, Y.; Li, Y. Carbon and Nitrogen Stable Isotope Abundance and Soil Stoichiometry of Zanthoxylum planispinum var. dintanensis Plantations of Different Ages. Agronomy 2022, 12, 1248. [Google Scholar]
  50. Drollinger, S.; Kuzyakov, Y.; Glatzel, S. Effects of peat decomposition on δ13C and δ15N depth profiles of Alpine bogs. Catena 2019, 178, 1–10. [Google Scholar] [CrossRef]
  51. Xia, S.; Song, Z.; Wang, Y.; Wang, W.; Fu, X.; Singh, B.P.; Wang, H. Soil organic matter turnover depending on land use change: Coupling C/N ratios, δ13C, and lignin biomarkers. Land Degrad. Dev. 2021, 32, 1591–1605. [Google Scholar] [CrossRef]
  52. Wynn, J.G. Carbon isotope fractionation during decomposition of organic matter in soils and paleosols: Implications for paleoecological interpretations of paleosols. Palaeogeogr. Palaeoclimatol. Palaeoecol. 2007, 251, 437–448. [Google Scholar] [CrossRef]
  53. Lerch, T.Z.; Nunan, N.; Dignac, M.F. Variations in microbial isotopic fractionation during soil organic matter decomposition. Biogeochemistry 2011, 106, 5–21. [Google Scholar] [CrossRef]
  54. Wang, G.; Jia, Y.; Li, W. Effects of environmental and biotic factors on carbon isotopic fractionation during decomposition of soil organic matter. Sci. Rep. 2015, 5, 11043. [Google Scholar] [CrossRef] [PubMed] [Green Version]
  55. Krull, E.S.; Bestland, E.A.; Skjemstad, J.O.; Parr, J.F. Geochemistry (δ13C, δ15N, 13C NMR) and residence times (14C and OSL) of soil organic matter from red-brown earths of South Australia: Implications for soil genesis. Geoderma 2006, 132, 344–360. [Google Scholar] [CrossRef]
  56. Chen, Q.; Shen, C.; Sun, Y.; Peng, S.; Yi, W.; Li, Z.A.; Jiang, M. Spatial and temporal distribution of carbon isotopes in soil organic matter at the Dinghushan Biosphere Reserve, South China. Plant Soil 2005, 273, 115–128. [Google Scholar] [CrossRef]
  57. Högberg, P.; Ekblad, A. Substrate-induced respiration measured in situ in a C3-plant ecosystem using additions of C4-sucrose. Soil Biol. Biochem. 1996, 28, 1131–1138. [Google Scholar] [CrossRef]
  58. Craine, J.M.; Brookshire, E.N.; Cramer, M.D.; Hasselquist, N.J.; Koba, K.; Marin-Spiotta, E.; Wang, L. Ecological interpretations of nitrogen isotope ratios of terrestrial plants and soils. Plant Soil 2015, 396, 1–26. [Google Scholar] [CrossRef] [Green Version]
  59. Buchmann, N.; Kao, W.Y.; Ehleringer, J. Influence of stand structure on carbon-13 of vegetation, soils, and canopy air within deciduous and evergreen forests in Utah, United States. Oecologia 1997, 110, 109–119. [Google Scholar] [CrossRef]
  60. Shi, S.; Zhang, W.; Zhang, P.; Yu, Y.; Ding, F. A synthesis of change in deep soil organic carbon stores with afforestation of agricultural soils. For. Ecol. Manag. 2013, 296, 53–63. [Google Scholar] [CrossRef]
  61. Wei, X.; Shao, M.; Fu, X.; Horton, R.; Li, Y.; Zhang, X. Distribution of soil organic C, N and P in three adjacent land use patterns in the northern Loess Plateau, China. Biogeochemistry 2009, 96, 149–162. [Google Scholar] [CrossRef]
Figure 1. Average contents of SOC and SON in the 0–20 cm and 20–40 cm soil layers of the six land use types in the rainy and dry seasons. (a) SOCrain, rainfed soil organic carbon; (b) SOCdry, dry-season soil organic carbon; (c) SONrain, rainfed soil organic nitrogen; (d) SONdry, dry-season soil organic nitrogen. Forest land: FL; peach: PC; paddy land: PL; tobacco field: TF; maize field: MF; and grassland: GL. Different lowercase letters indicate significant differences in SOC content (SON) between land types in the same soil layer at the p < 0.05 level.
Land 12 00501 g001
Figure 2. Mean values of δ13C and δ15N for the 0–20 cm and 20–40 cm soil layers of the six land use types in the rainy and dry seasons. (a) δ13Crain, δ13C value of rainy season soil; (b) δ15Nrain, δ15N value of rainy season soil; (c) δ13Cdry, δ13C value of dry season soil; (d) δ15Ndry, δ15N value of dry season soil. Different lowercase letters indicate significant differences in δ13C values (δ15N values) of different land types in the same soil layer at the p < 0.05 level, while ns indicates no significant differences.
Land 12 00501 g002
Figure 3. Rates of change of soil δ13C, δ15N and C/N for six land use types from the rainy season to the dry season. KC/N, Kδ13C, Kδ15N are the rates of change of the soil C/N, δ13C and δ15N, respectively.
Land 12 00501 g003
Figure 4. Relationship between δ13C and δ15N values of 0–40 cm soils of six land use types in the dry season. In contrast, the linear relationship between δ13C and δ15N of soils in the rainy season is not credible (p > 0.05), and therefore the best-fit curve between them is not shown.
Land 12 00501 g004
Table 1. General description of the sampling points at Shibing, China.
Sampling IDSampling SitesAltitudeSoil TextureLand-Use TypeVegetationDisturbance History
Sand (%)Silt (%)Clay (%)
FL127°09′25″ N, 108°08′40″ E106352.9233.6613.42ForestPinus massonianaMore than 100 years
without disturbance.
FL227°09′44″ N, 108°07′43″ E106450.7533.7515.50ForestCunninghamia lanceolata, Podocarpus macrophyllusSame as above
FL227°08′54″ N, 108°07′33″ E105851.5634.0814.36ForestCinnamomum camphora (L.), Cyclobalanopsis glaucaSame as above
PC127°08′49″ N, 108°07′28″ E99821.2240.3938.39Peach orchardPeach treeThe planting period is 7–8 years, the land was abandoned before planting.
PC227°09′37″ N, 108°07′40″ E98226.1539.2834.57Peach orchardPeach treeSame as above
PC327°09′57″ N, 108°07′32″ E97625.7235.3238.96Peach orchardPeach treeThe planting period is 10 years, the land was abandoned before planting.
PL127°08′53″ N, 108°07′45″ E98418.3738.0843.55Paddy landOryza sativa L.Rice is planted in the rainy season, drained and fallow in the dry season, the length of continuous planting is about 30 years.
PL227°09′10″ N, 108°07′55″ E98119.2539.9340.82Paddy landOryza sativa L.Same as above
PL327°06′52″ N, 108°07′47″ E98519.3038.5642.14Paddy landOryza sativa L.Same as above
TF127°08′55″ N, 108°07′28″ E98726.9537.9635.09Tobacco fieldNicotiana tabacun L.Corn and roasted tobacco are planted in rotation for more than a decade, urea and compound fertilizer are mainly applied in the cultivation process.
TF227°08′54″ N, 108°07′27″ E98427.1338.5334.34Tobacco fieldNicotiana tabacun L.Same as above
TF327°08′48″ N, 108°07′26″ E98127.4437.2435.32Tobacco fieldNicotiana tabacun L.Same as above
MF127°08′53″ N, 108°07′45″ E99727.8537.5834.57Maize fieldZea mays L.Same as above
MF227°09′34″ N, 108°07′43″ E99126.9238.7134.37Maize fieldZea mays L.Same as above
MF327°08′54″ N, 108°07′35″ E98928.3138.0633.63Maize fieldZea mays L.Same as above
GL127°08′53″ N, 108°07′28″ E101827.1437.6535.21Grass landWeeds (Mainly C4 plant)Natural recovery of corn land for 4–5 years after abandonment.
GL227°08′11″ N, 108°07′33″ E101027.0437.1235.84Grass landWeedsSame as above
GL327°09′51″ N, 108°07′47″ E100827.1138.4334.46Grass landWeedsNatural recovery of corn land for 5 years after abandonment.
Table 2. Correlation analysis of the soil traits in the karst areas in the dry and rainy seasons.
IndexSOCrainSOCdrySONrainSONdryδ13Crainδ13Cdryδ15Nrainδ15NdryC/NrainC/NdrypHrain
SOCdry0.719 **1
SONrain0.769 **0.640 **1
SONdry0.739 **0.903 **0.623 **1
δ13Crain0.626 **0.436 *0.3060.361 *1
δ13Cdry0.354 *0.576 **0.1130.558 **0.3491
δ15Nrain−0.337−0.271−0.496 **−0.3160.0870.0211
δ15Ndry0.0340.083−0.0360.0840.1790.597 **0.1651
C/Nrain0.972 **0.657 **0.648 **0.684 **0.668 **0.338−0.3370.0141
C/Ndry0.623 **0.845 **0.575 **0.573 **0.469 **0.34−0.2420.0350.578 **1
pHrain−0.361 *−0.312−0.388 *−0.328−0.0470.1290.1750.274−0.34−0.2441
pHdry0.517 **0.439 *0.421 *0.364 *0.209−0.021−0.232−0.1060.480 **0.537 **0.02
* indicates a significant correlation (p < 0.05); ** indicates an extremely significant correlation (p < 0.01).
Disclaimer/Publisher’s Note: The statements, opinions and data contained in all publications are solely those of the individual author(s) and contributor(s) and not of MDPI and/or the editor(s). MDPI and/or the editor(s) disclaim responsibility for any injury to people or property resulting from any ideas, methods, instructions or products referred to in the content.

