Article

Corn Land Extraction Based on Integrating Optical and SAR Remote Sensing Images

1
Research Center of Information Technology, Beijing Academy of Agriculture and Forestry Science, Beijing 100097, China
2
School of Civil Engineering, University of Science and Technology Liaoning, Anshan 114051, China
3
Key Laboratory of Quantitative Remote Sensing in Agriculture, Ministry of Agriculture, Beijing 100097, China
4
School of Surveying and Mapping Science and Technology, Xi’an University of Science and Technology, Xi’an 710054, China
*
Authors to whom correspondence should be addressed.
Land 2023, 12(2), 398; https://doi.org/10.3390/land12020398
Submission received: 5 January 2023 / Revised: 27 January 2023 / Accepted: 29 January 2023 / Published: 1 February 2023

Abstract

:
Corn is an important food crop worldwide, and its yield is directly related to Chinese food security. Accurate remote sensing extraction of corn can realize the rational application of land resources, which is of great significance to the sustainable development of modern agriculture. In the field of large-scale crop remote sensing classification, single-period optical remote sensing images often cannot achieve high-precision classification. To improve classification accuracy, multiple time series image combinations have gradually been adopted. However, due to the influence of cloudy and rainy weather, it is often difficult to obtain complete time series optical images. Synthetic aperture radar (SAR) data are imaged by microwaves, which have strong penetrating power and are not affected by clouds. A critical way to solve this problem is to use SAR images to compensate for the lack of optical images and obtain a complete time series image in the corn-growing season. However, SAR images have limited wavelengths and cannot provide important wavelengths, such as visible light bands and near-infrared information. To solve this problem, this study took Zhaodong City, a vital corn-planting base in China, as the research area; took GF-6/GF-3 and Sentinel-1/Sentinel-2 as remote sensing data sources; designed12 classification scenarios; analyzed the best classification period and the best time series combination of corn classification; studied the influence of SAR images on the classification results of time series images; and compared the classification differences between GF-6/GF-3 and Sentinel-1/Sentinel-2. The results show that the classification accuracy of time series combinations is much higher than that of single-period images. The polarization characteristics of SAR images can improve the classification accuracy with time series images. The classification accuracy of GF series images from China is obviously higher than that of Sentinel series images. The research performed in this paper can provide a reference for agricultural classification by using remote sensing data.

1. Introduction

Food security is a significant factor in ensuring social stability worldwide, and corn is one of the most important food crops in the world [1]. In recent years, the rapid development of remote sensing technology has provided an opportunity for corn extraction. Remote sensing technology has been widely used in agriculture since its conception [2,3,4]. Large-scale remote sensing extraction of corn can help farmers improve the efficiency of field management, assist agricultural departments in carrying out agricultural planting supervision and statistics, and provide help in corn yield estimation and agricultural technology services [5].
When using medium- and low-resolution images to extract crops on a large scale, it is often difficult to guarantee classification accuracy with single-period images [6], while multitemporal series images have richer phenological information, which can reflect the growth cycle of different vegetation and distinguish different ground objects effectively, thus significantly improving the classification accuracy [7]. Wang, X [8] et al. used Landsat 8 remote sensing images to construct the NDVI and the first principal component (PCA1) time series of the main crops to reflect phenological differences among different crops and identify crops in Xinjiang. Xiong, J. et al. used multi-time series Landsat8 OLI data to classify crops in Hokkaido, Japan, and the overall accuracy of classification results was very high [9]. Inglada, J. et al. used multi-time series SAR images and optical images with a high time resolution to classify early crop types. The research showed that multi-time series images could significantly improve the accuracy of crop-type classification [10]. Luo, C. et al. used the GEE platform to collect Sentinel-1 and Sentinel-2 time series images of critical growth period of crops for crop classification, and the results showed that the classification performance of time series images was obviously better than that of single period images [11]. Therefore, image time selection is significant in crop classification, and the use of time series images is an important way to improve the accuracy of crop classification [12,13].
Optical remote sensing images have abundant spectral information, which is the primary data in remote sensing image classification. However, according to global cloud cover data from the International Satellite Cloud Climatology Program, more than 66 percent of the Earth's surface is regularly covered by clouds [14]. Because it is easily affected by cloud coverage, its practical application is limited [15], which makes it difficult to obtain images in the best time range and affects classification accuracy. SAR images represent microwave imaging, and microwave remote sensing has the advantages of all-day, all-weather, and robust penetration and is not interfered with by clouds [16]. Therefore, combining SAR images with optical remote sensing images to construct time series images can compensate for the defects of optical remote sensing images [17,18]. At the same time, SAR images are sensitive to the physical structure and geometric information of ground objects and can reflect the physical characteristics of ground objects [19]. Tommaso Orusa et al. pointed out that the combination of optical and SAR images can reduce the limitations of each and increase the advantages of each [20]. Erinjery et al. [21] monitored vegetation growth by combining optical and radar polarization characteristics. Shuai et al. [22] extracted and mapped corn by constructing radar polarization features with multiple time series. Lee, C. [23] et al. used Sentinel-1 and Sentinel-2 data to extract winter wheat at the county scale. Experiments have shown that a combination of SAR images and optical images can improve winter wheat extraction accuracy. Zhang, C. et al. [24] used Sentinel-1/2 as the data source to identify crops in cloudy areas south of the Yangtze River and supplemented the lack of optical images in the cloud period with Sentinel-1 radar images, which solved the problem of cloud coverage in the optical images. Liu, Z. et al. [25] pointed out that combining the radar index with the optical remote sensing index can effectively improve the inversion accuracy of straw coverage. Li, L. et al. [26] pointed out that combining optical remote sensing images and SAR images has obvious advantages over using only a single image. Cai et al. pointed out that crop residue retrieval based on optical images has the disadvantage of signal saturation and is easily affected by weather conditions in high-coverage areas. In contrast, crop residue retrieval based on SAR images is easily affected by soil moisture and crop types, which shows that optical images and SAR images have their advantages and disadvantages [27]. Although SAR images have the advantage of penetrating clouds, the band information of SAR images is relatively simple, and there is no sensitive vegetation band, such as visible light and near-infrared, so SAR images have certain limitations in corn remote sensing extraction. Therefore, the cooperative use of optical and SAR images may be a potential advantage for agricultural classification [28,29]. The above studies all point out that SAR images play a positive role in remote sensing crop extraction. However, few studies have been carried out in the field of optical and SAR multi-time series images for two different types of data. In this study, GF-6 and GF-3 were selected as representatives of high spatial resolution and low spatial resolution images, and Sentinel-2 and Sentinel-1 were selected as representatives of high spatial resolution and low temporal resolution images, respectively. The classification results of the two types of data were studied and compared.
This paper aims to explore the cooperative use of optical and SAR images for remote sensing extraction of corn. The objectives of this paper are as follows: (1) To study whether the polarization characteristics of SAR images have a positive impact on the classification results with time series remote sensing images, we examined whether SAR images can be used to make up and replace the complete optical time series images in rainy weather. (2) In multi-time series image classification, both spatial resolution and temporal resolution are important factors for image classification accuracy. In this paper, GF-6 and GF-3 data are used as representatives of high temporal resolution and low spatial resolution, and Sentinel-2 and Sentinel-1 are used as representatives of high spatial resolution and low temporal resolution data. The accuracy difference between the two kinds of time series image data sets in maize extraction is discussed. This paper studies which contributes more to the classification results—temporal resolution or spatial resolution.

2. Materials and Methods
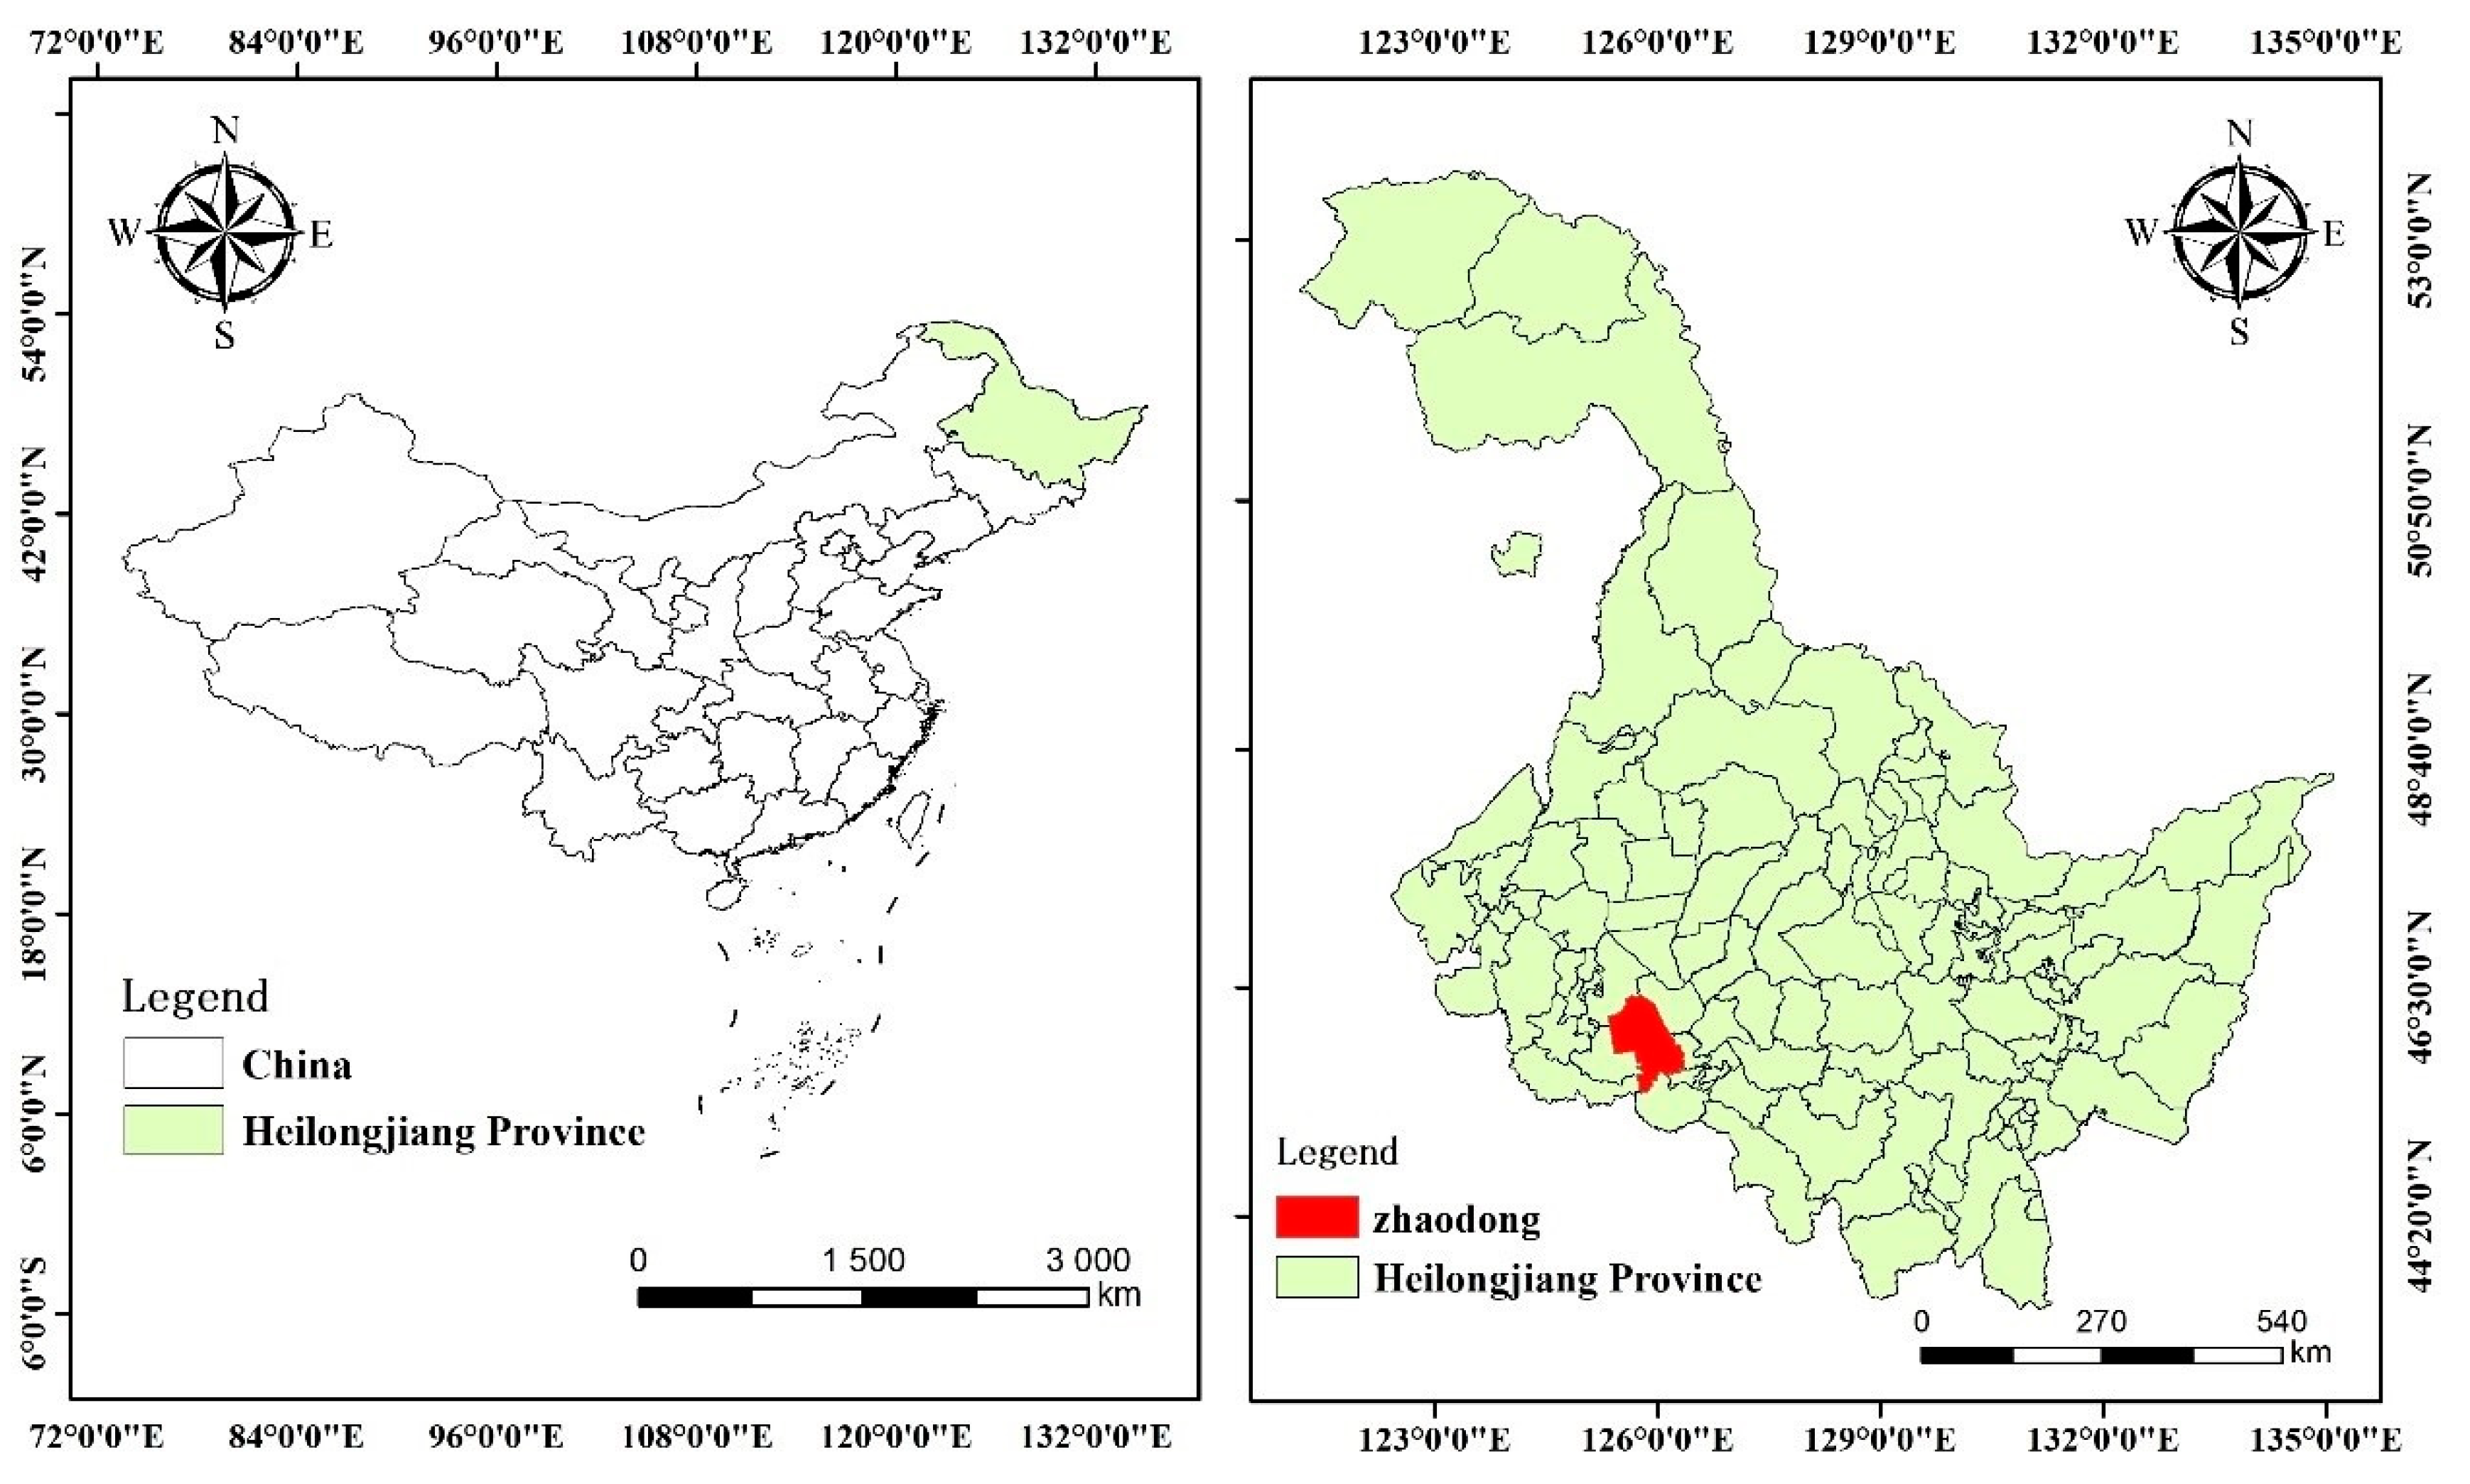
2.1. Study Area

Heilongjiang Province, located in Northeastern China, is the northernmost and easternmost provincial administrative region in China and is located in a cold temperate zone and has a temperate continental monsoon climate. Black land is recognized as the most fertile land in the world, and the cultivated land in Heilongjiang is mainly black land. Heilongjiang has always been the most important grain-producing province in China due to its unique geographic advantages [30,31].
Zhaodong city is located in the middle of the Songnen Plain in Southwestern Heilongjiang Province, between 125°22’ E and 126°22’ N and 45°10’ N and 46°20′ N, with little rain in spring and autumn, hot and rainy conditions in summer, and cold and dry conditions in winter, seeing Figure 1. Zhaodong city is located in a rare green agricultural area of “cold black soil” in China, which is mainly composed of chernozem and meadow soil. The inherent cold black soil is the most fertile soil in China, and its soil fertility, physical and chemical properties, and soil structure rank first among all kinds of soils. Its unique geographic advantages make it one of the golden areas for crop planting in China. Corn and rice are mainly planted in this area, and other lands include fresh corn, grassland, villages and towns, water bodies, and other crops of dry land. Crops are planted in a single season.

2.2. Date Preparation

2.2.1. Remote Sensing Data Acquisition

The remote sensing images selected in this paper are GF-6 WFV wide images, GF-3 radar images, Sentinel-1 radar images, and Sentinel-2 images. GF images and Sentienl images constructed time series images, respectively, for comparison.
GF-3 and GF-6 data were obtained from the China Centre for Resources Satellite Data and Application. Sentinel 2 images were obtained by the GEE cloud computing platform, which has a strong cloud-computing capability and big data storage capability. Sentinel-1 images were obtained from the official website of the ESA.
GF-6, a low-orbit optical satellite and the Chinese first precision agriculture observation satellite, was successfully launched in June 2018. GF-6 is divided into a 2-m panchromatic/8-m multispectral camera and a 16-m multispectral medium-resolution wide camera. In this paper, GF-6 WFV wide images were used; the spatial resolution was 16 m, the width was 800 km, and the revisit period was 4 days. The images included 8 bands: violet band from 0.40 to 0.45 μm, blue band from 0.450 to 0.52 μm, green band from 0.52 to 0.59 μm, yellow band from 0.59 to 0.63 μm, red edge 1 band from 0.69 to 0.73 μm, red edge 2 band from 0.73 to 0.77 μm, and near-infrared band from 0.77 to 0.89 μm.
The sensor carried by the GF-3 satellite was a C-band multi-polarization synthetic aperture radar with a resolution of 5 m. The GF-3 data selected in this paper were L1A data, and the imaging mode was Fine Strip Mode 2 (FS2), which has two polarization modes: HH and HV. Polarization is one of the essential properties of electromagnetic waves. The propagation and scattering of electromagnetic waves represent vector phenomena, and polarization is used to express the vector phenomenon of electromagnetic waves. Polarization characteristics are sensitive to the physical characteristics and geometric shapes of ground objects and can reflect the differences in physical characteristics between ground objects well.
The Sentinel-2 satellite is a product of the European Space Agency’s Copernicus program. It consists of two satellites, Sentinel-2A and Sentinel-2B. The 2A satellite was successfully launched in June 2015, and the 2B satellite was successfully launched in March 2017. After the two satellites were networked, the revisit period was 5 days, and the image width was 290 km. Both satellites carry a multispectral imager MSI, which contains 13 bands. The band information is shown in Table 1.
The Sentinel-1 satellites consist of two polar-orbiting satellites, A and B, equipped with C-band synthetic aperture radar, and the revisit period is 6 days. Star 1A was successfully launched in April 2014, and Star 1B was successfully launched in April 2016. They operate day and night and can provide continuous images. Sentinel-1 includes four imaging modes. The images selected in this paper were in the IW imaging mode, which is the default mode of Sentinel-1 on land, and its width is 250 km. The data type is SLC data, which has two polarization modes: VV and VH.
The growth period of corn in Northeast China is from May to September. Due to cloud cover, complete optical images of GF-6WFV could not be obtained in June, so GF-3 SAR images were selected. Due to cloud cover, complete Sentinel-2 optical images could not be obtained in July and August, so Sentinel-1 SAR images were selected. According to the cloud coverage in optical images, a cloudless image was selected in each growth period to form the time sequence image of the whole growth period; Table 2 shows the time of each growth period and the corresponding image.

2.2.2. Ground Data Acquisition

To ensure the accuracy of selecting sample areas on satellite images, the team conducted a two-week field investigation in the study area in October 2021 and obtained 679 sampling points. Portable GPS positioning equipment was used to record the position information of various subjects, with an error of less than 5 m. The collected point information was imported into ArcGIS to determine the position of all kinds of features.

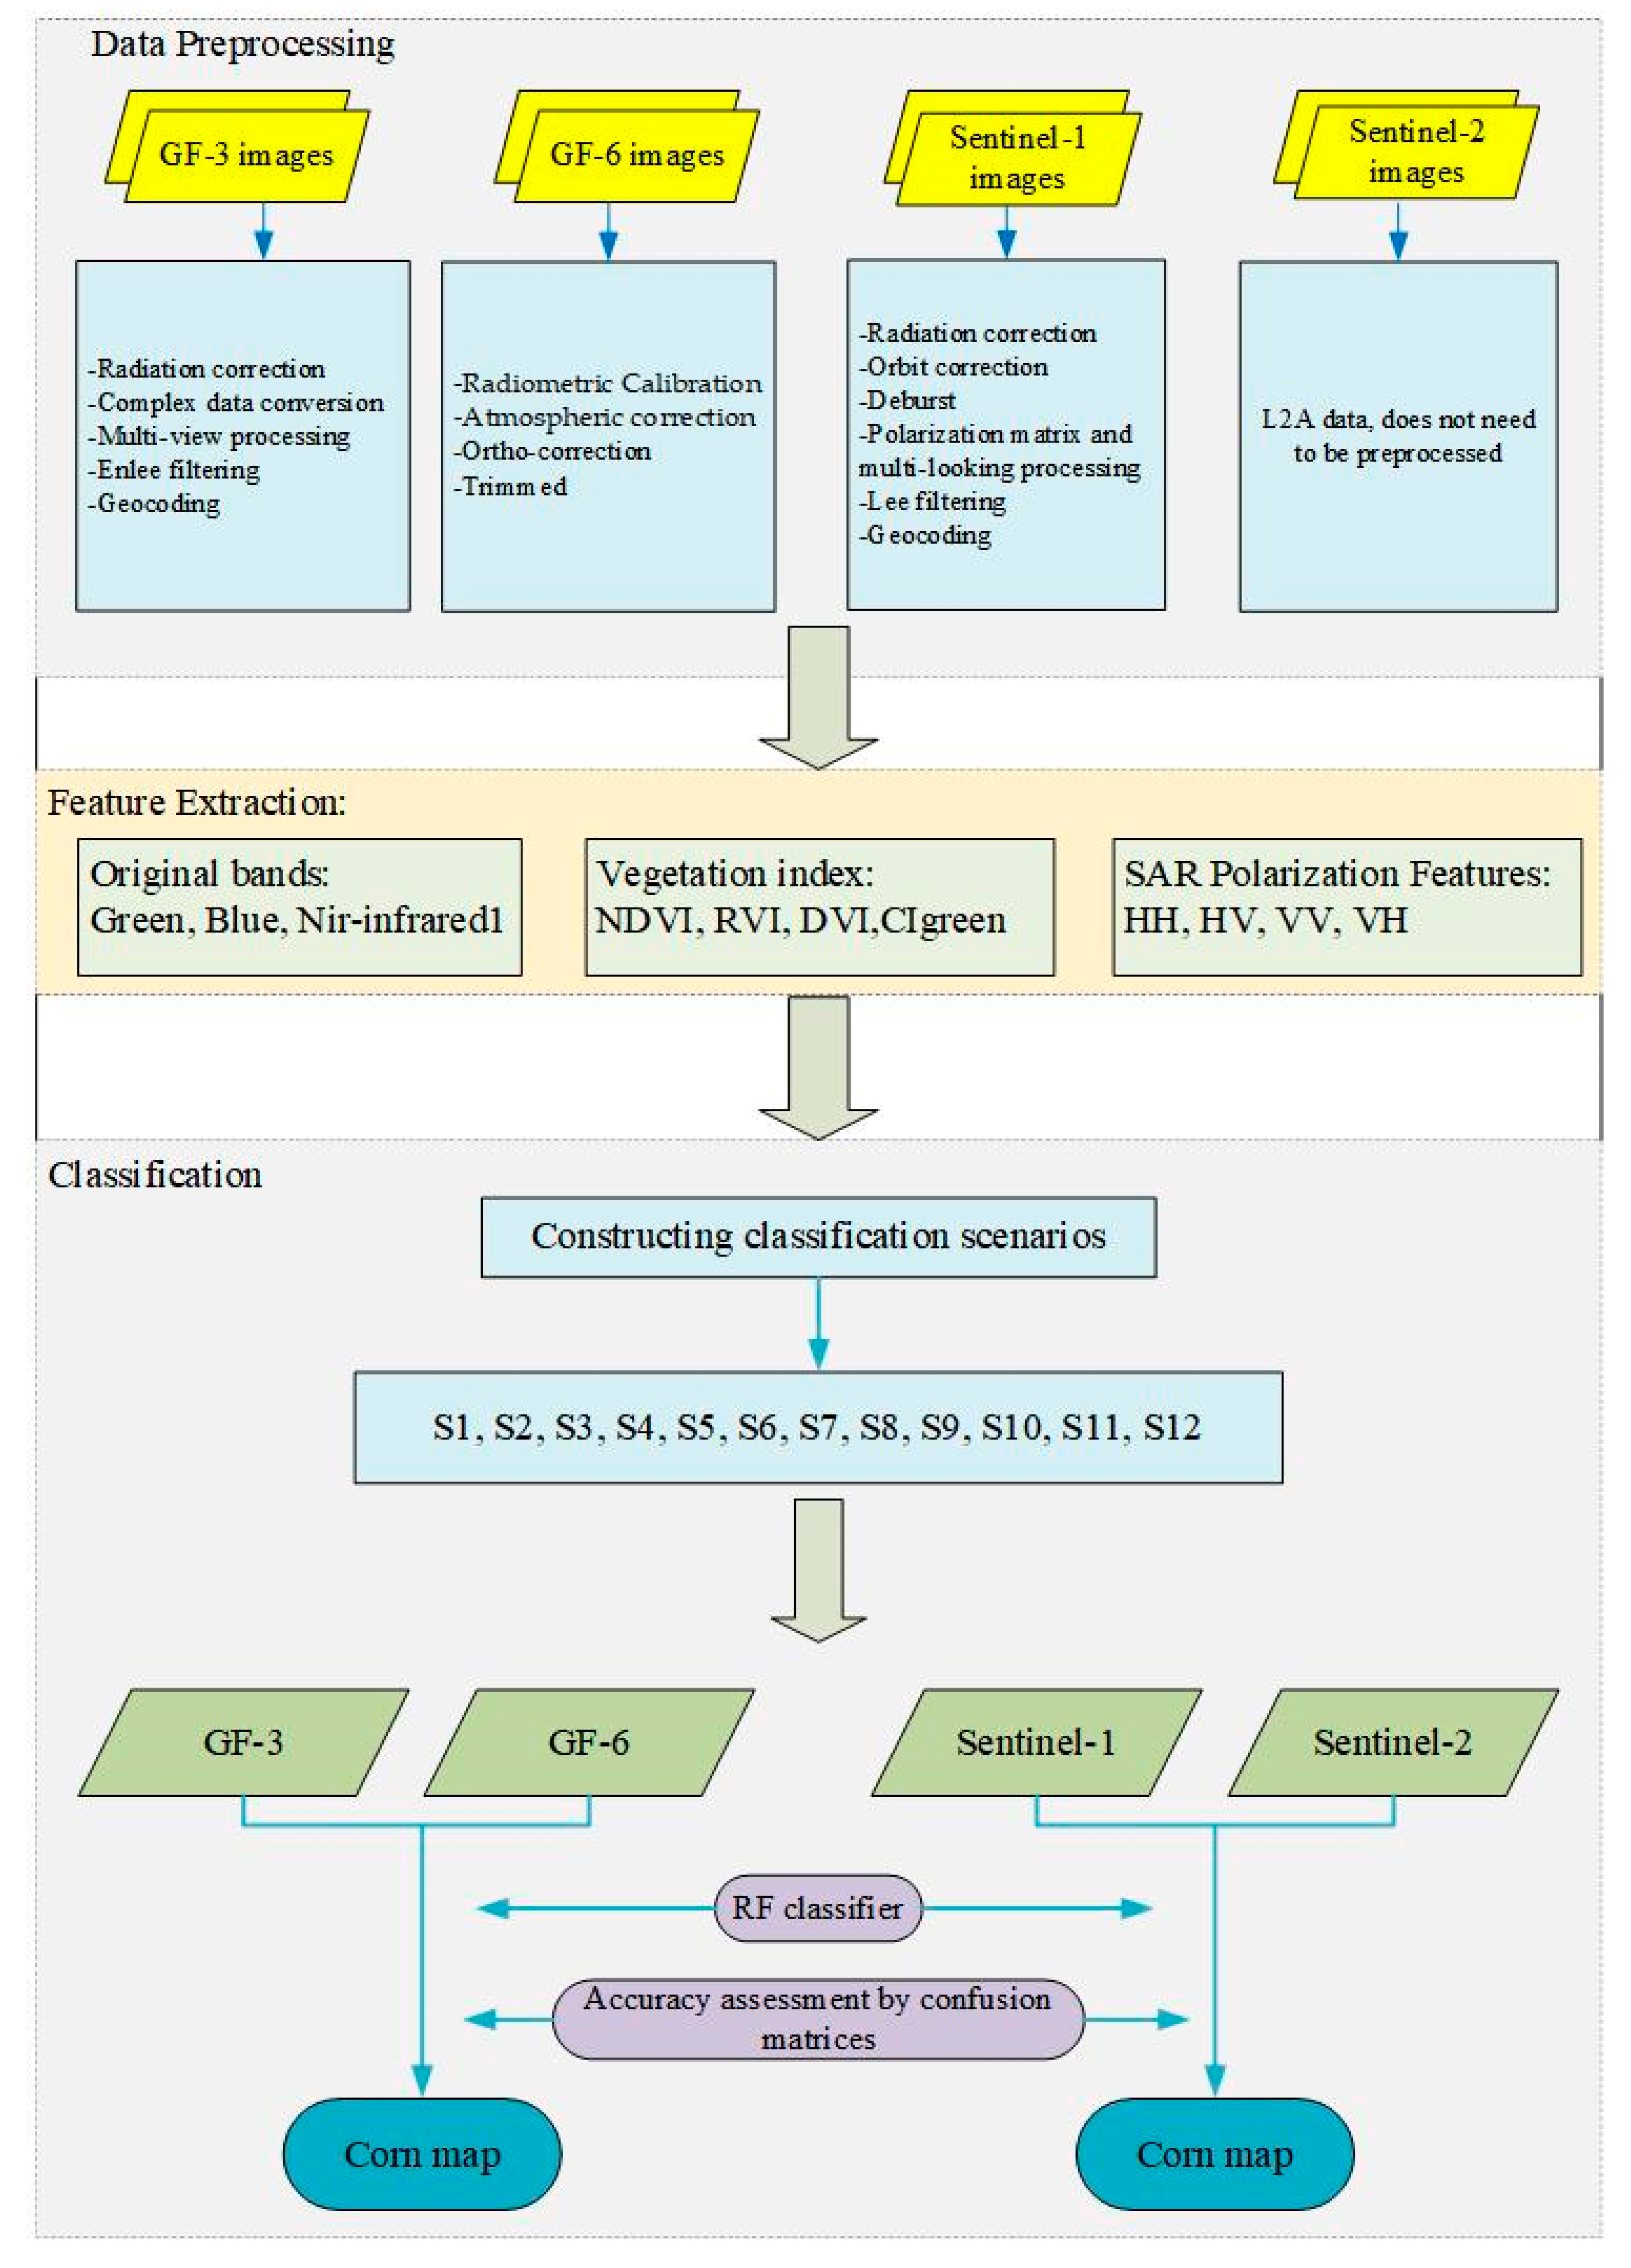
2.2.3. Remote Sensing Data Preprocessing

The preprocessing of GF-6 images was completed in ENVI. Radiometric calibration, atmospheric correction, and ortho-correction were carried out for GF-6 data, and then the vector boundary was trimmed. Radiometric calibration converts the DN value of the image into radiant brightness. The FLAASH atmospheric correction model was used for atmospheric correction. Atmospheric correction converts the radiation brightness of the image into apparent reflectance. Ortho-correction was based on ASTER GDEM data. After ortho-correction, a terrain correction image is obtained. The GF-3 SAR image was preprocessed by PIE-SAR. First, radiation correction and complex data conversion were completed, multi-view processing was carried out to reduce the amount of data and eliminate some noise, Enlee filtering was used to denoise it, and finally, geocoding was carried out.
Sentinel-2 images represent L2A data, which were preprocessed with radiometric calibration and atmospheric correction. The preprocessing of the Sentinel-1SAR images was carried out in SNAP. First, radiation correction and orbit correction were carried out. Second, Deburst was carried out to remove the dark band of the pulse band in the IW image to merge all practical regions of the burst band. Third, the polarization matrix and multi-looking processing were carried out. Fourth, Lee filtering was used to remove speckle noise. Finally, geocoding was carried out.

2.3. Research Methods

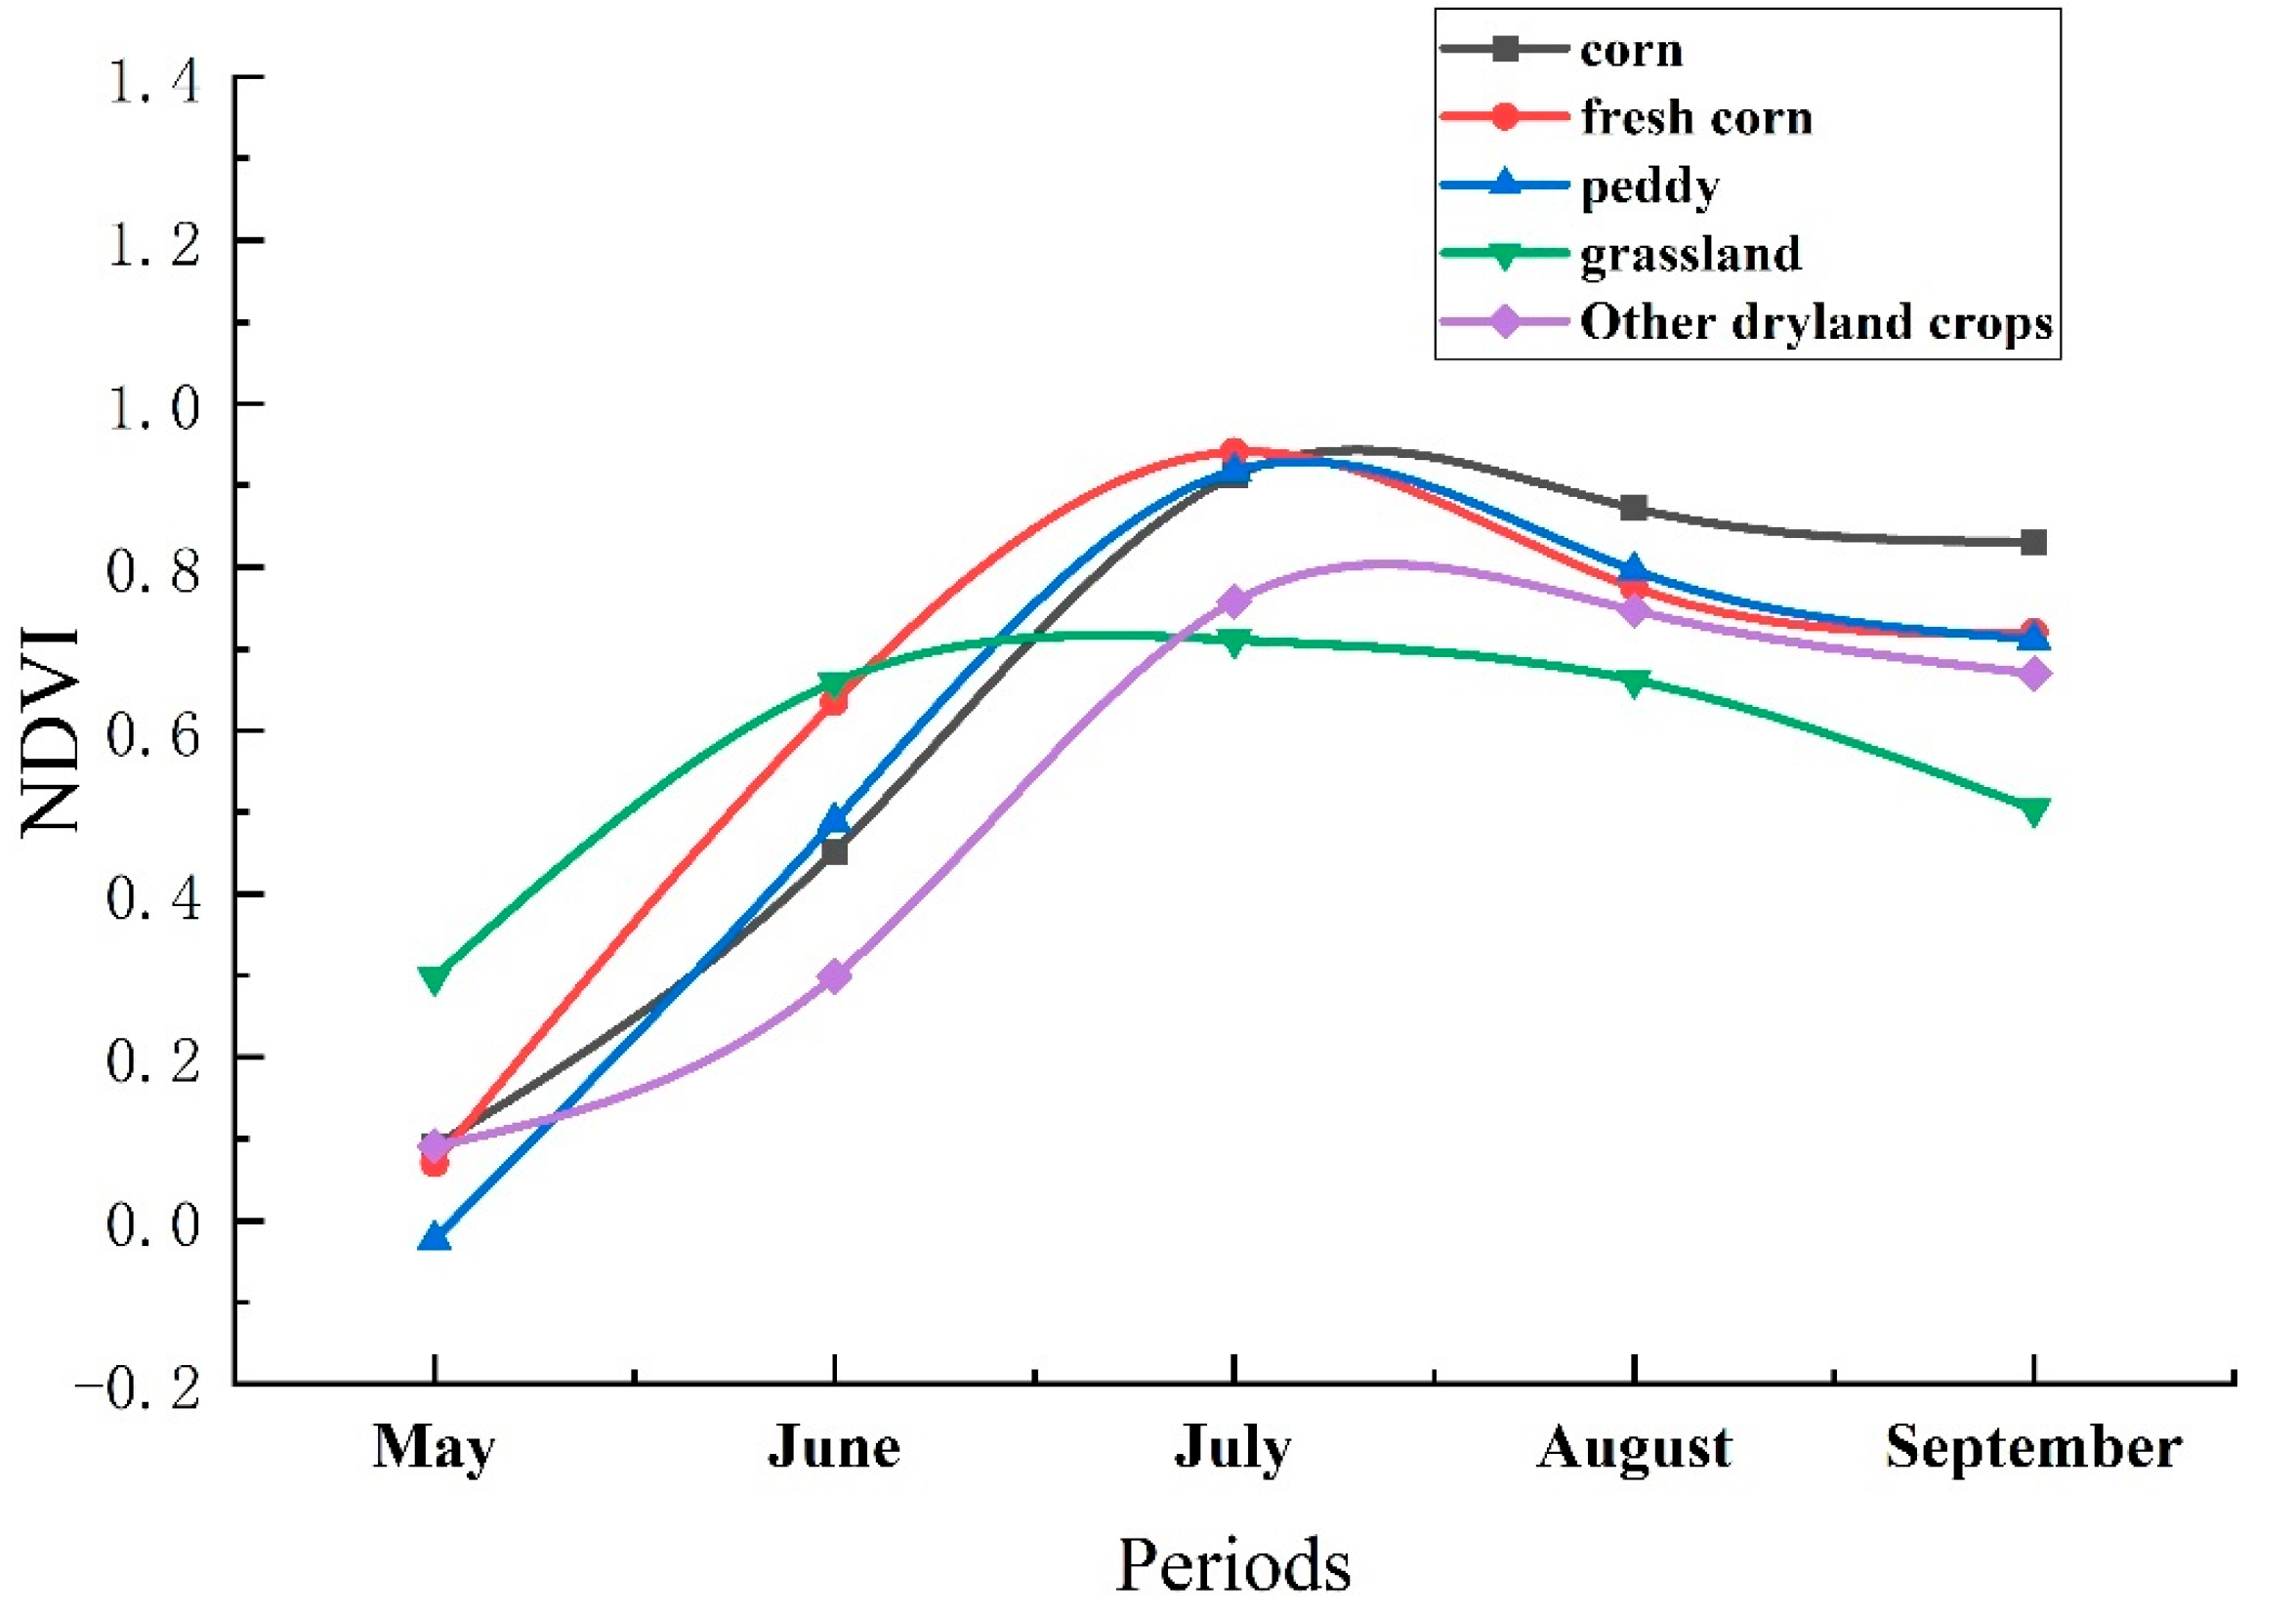
2.3.1. Vegetation Index

Four vegetation indices were selected as spectral characteristics, namely, the normalized difference vegetation index (NDVI), ratio vegetation index (RVI), difference vegetation index (DVI), and green band chlorophyll index (CIgreen). Table 3 shows the expressions and names of the four vegetation indexes.Vegetation has different absorption and reflection to different wavelengths. It has an absorption in the wavelength bands of 450 nm (blue band) and 650 nm (red band) and a small amplitude reflection in the wavelength band of 540 nm (green band). The 690~7770 nm band (red edge band) is the sensitive band of vegetation, and the spectral reflection of vegetation changes the fastest in this band. The application of the red edge band is one of the high-tech means used to identify crop remote sensing and realize accurate classification of vegetation features [32], while there is a vital reflection in the band with a central wavelength of 820 nm (near-infrared band).
The NDVI highlights green vegetation using the characteristics of high reflection in the near-infrared band and strong absorption in the red band. The NDVI is one of the most widely used vegetation indices for vegetation classification. The RVI is sensitive to densely covered areas and can identify lush corn fields; the DVI is more sensitive to the change in grassland and woodland with low vegetation coverage, while the CIgreen is the green band chlorophyll index, which is sensitive to vegetation with high chlorophyll content. The formulas for calculating the four vegetation indices are as follows.

2.3.2. SAR Polarization Feature

HH and HV of GF-3 SAR images and VV and VH of Sentinel-1 SAR images are all polarization features. Polarization is one of the properties of electromagnetic waves and represents critical information in addition to frequency, amplitude, and phase. The scattering and propagation of electromagnetic waves is a vector phenomenon, and polarization reflects this phenomenon. Radar signals can transmit horizontal (H) or vertical (V) electric field vectors and receive horizontal (H), vertical (V), or both return signals. The polarization characteristics of SAR images are sensitive to the dielectric constant, physical characteristics, and geometry of target objects; therefore, polarization characteristics can significantly increase the ability of satellite images to distinguish the types and features of target objects in physical dimensions. HH and HV were selected as corn classification features in GF-3 image, and VV and VH were selected as corn classification features in Sentinel-1 image.

2.3.3. Classification Methods

In this paper, the random forest (RF) method proposed by Breiman in 2001 was used for classification. The random forest algorithm uses the idea of ensemble learning to integrate multiple decision trees, and decision trees are its basic units. Sampling and splitting rule discrimination are two key links. N samples are extracted by the bootstrap random sampling method for training, and multiple decision trees are constructed for each resampled example by node random splitting technology. Finally, multiple decision trees are combined, and the final classification result is determined by the voting result of each decision tree. The characteristics of random forest are as follows: it can run effectively on large datasets, and it has high prediction accuracy, high operation efficiency, strong stability, and good robustness.

2.3.4. Classification Scene Design

In Figure 2, May is the seedling stage of corn, June is the jointing stage, July is the heading stage, August is the milk ripening stage, and September is the maturation stage. Because of the different NDVI variation curves of vegetation during the growth cycle of corn (Figure 2), twelve classification scenes were constructed based on spectral features, time series combinations, and random forest (RF) algorithms, as shown in Table 4. Due to the lack of GF-6 optical images in June, the NDVI in June was calculated from Sentinel-2 images. From May to July, the NDVI values of all kinds of ground objects changed greatly, which indicated that all kinds of ground objects grew rapidly during this period. However, the change in the NDVI value slowed from July to August, indicating that the growth state of various ground objects did not change much after reaching its peak in July. The period from May to July was defined as the rapid growth period, while the period from July to September was defined as the stable period. Figure 2 shows that the distinction between corn and other features was smaller from May to July, and the distinction between corn and other features became larger from July to September.
Scenes S5 and S6 show the classification effects from May to July and July to September, respectively. Scenes S1–S4 are GF-6 single growth period images, which were used to screen the best classification period. Scenes S5–S8 are GF-6 different growth time series combinations, which were used to screen the best time series combinations and evaluate the influence of SAR images on classification results. Scenes S9–S12 are the classification results of Sentinel series images, which were compared with Chinese GF images to evaluate the overall classification effect of the two images.
To better illustrate the above approach, a workflow diagram was drawn, as shown in Figure 3.

2.4. Accuracy Evaluation

In this paper, four indices were used to evaluate the accuracy of the classification results: overall accuracy (OA), Kappa coefficient, producer accuracy (PA), and user accuracy (UA). The four indices were calculated based on the confusion matrix.
OA = i = 1 n X i i i = 1 n j = 1 n X i j
Kappa = N i = 1 n X i i i = 1 n X i + + X + i N 2 i = 1 n X i + + X + i
PA = X j j X + j
UA = X i i X i +
where N represents the number of training samples, and n represents the number of classification categories. Overall accuracy (OA) refers to the percentage of verification points correctly classified by all categories to the total number of verification points. The Kappa coefficient is an index used to evaluate the consistency between classification results and real results, and its value is between 0 and 1. The larger its value is, the better the consistency and the higher the classification accuracy. Producer accuracy refers to the probability that the real data of this category are correctly classified. User accuracy refers to the proportion of checkpoints falling into this category that are correctly classified in this category.

3. Results

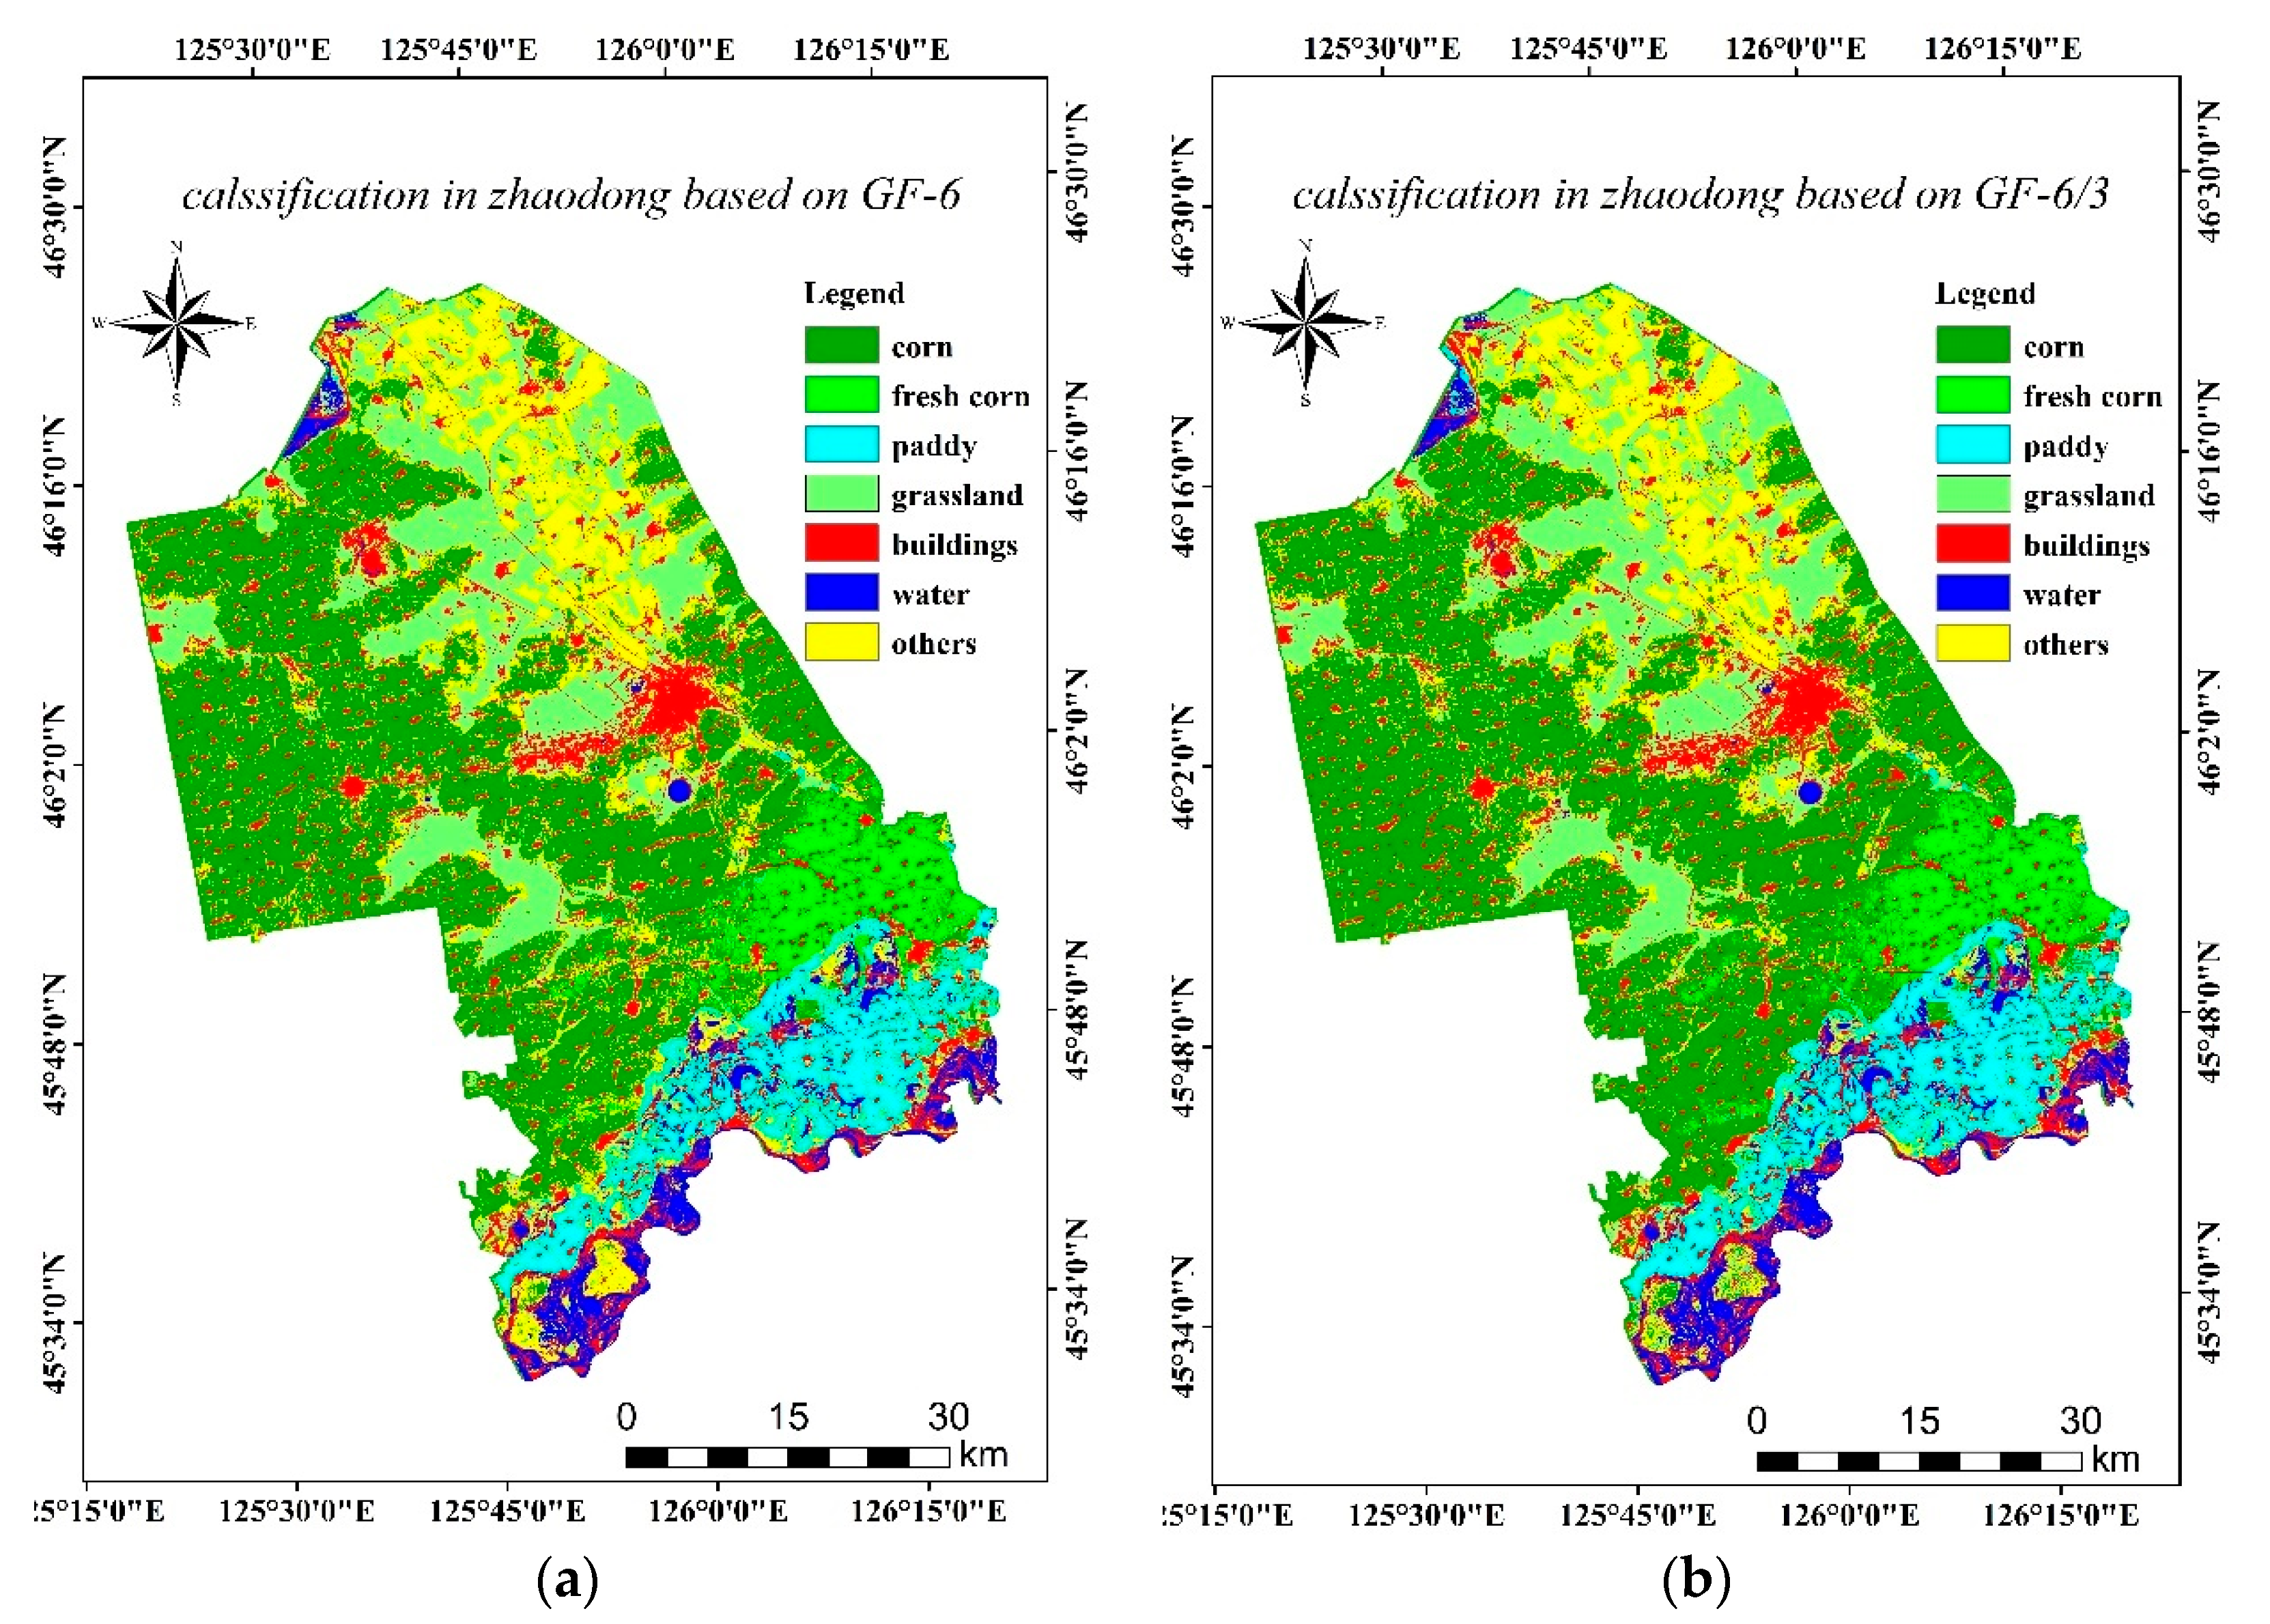
3.1. Corn Field Extraction Accuracy in Different Time Series of GF-6/GF-3 Images

The classification results of the corn multisequence combination and single period image based on the GF3/GF6 image (S1–S8) are shown in Table 5.
As shown in Table 5, in the single growth period image, the overall accuracy, Kappa coefficient, and corn producer accuracy in August were higher than those in other periods, which were 89.16%, 0.8599, and 86.10%, respectively, while only the corn user accuracy was slightly lower than that in September, which was 91.72%. Therefore, in the single growth period images, the most suitable season for corn classification was August. The precision in May was the lowest, which was lower than that in other months. The reason for this was that in May, all kinds of ground features in Zhaodong city were in the bud, corn had just been sown, and there was little difference between ground features, which made it difficult to distinguish them. However, August was the period when all kinds of ground objects were growing vigorously, and there were significant differences between them.
Among the multigrowth period temporal images, the total classification accuracy, Kappa coefficient, and corn producer accuracy of the time series images in 5,6,7,8,9-month were the highest. Nevertheless, the corn user accuracy was slightly lower than other time series images, which were 93.37%, 0.9143, 89.39%, and 91.97%, respectively. Overall, 5,6,7,8,9 month time series images had the best effect. The time series images of 5,6,7,8,9-month included 5 periods of corn and contained more phenological information; therefore, the overall classification effect was the best. In the 5,6,7 month time series images and the 7,8,9-month time series images, the overall accuracy and Kappa coefficient of the 5,6,7-month time series images were slightly higher than those of the 7,8,9-month time series images. However, the producer accuracy and user accuracy of corn were lower than those of 7,8,9-month time series images. In summary, the classification effect of the time series combination was obviously better than that of the single period image.

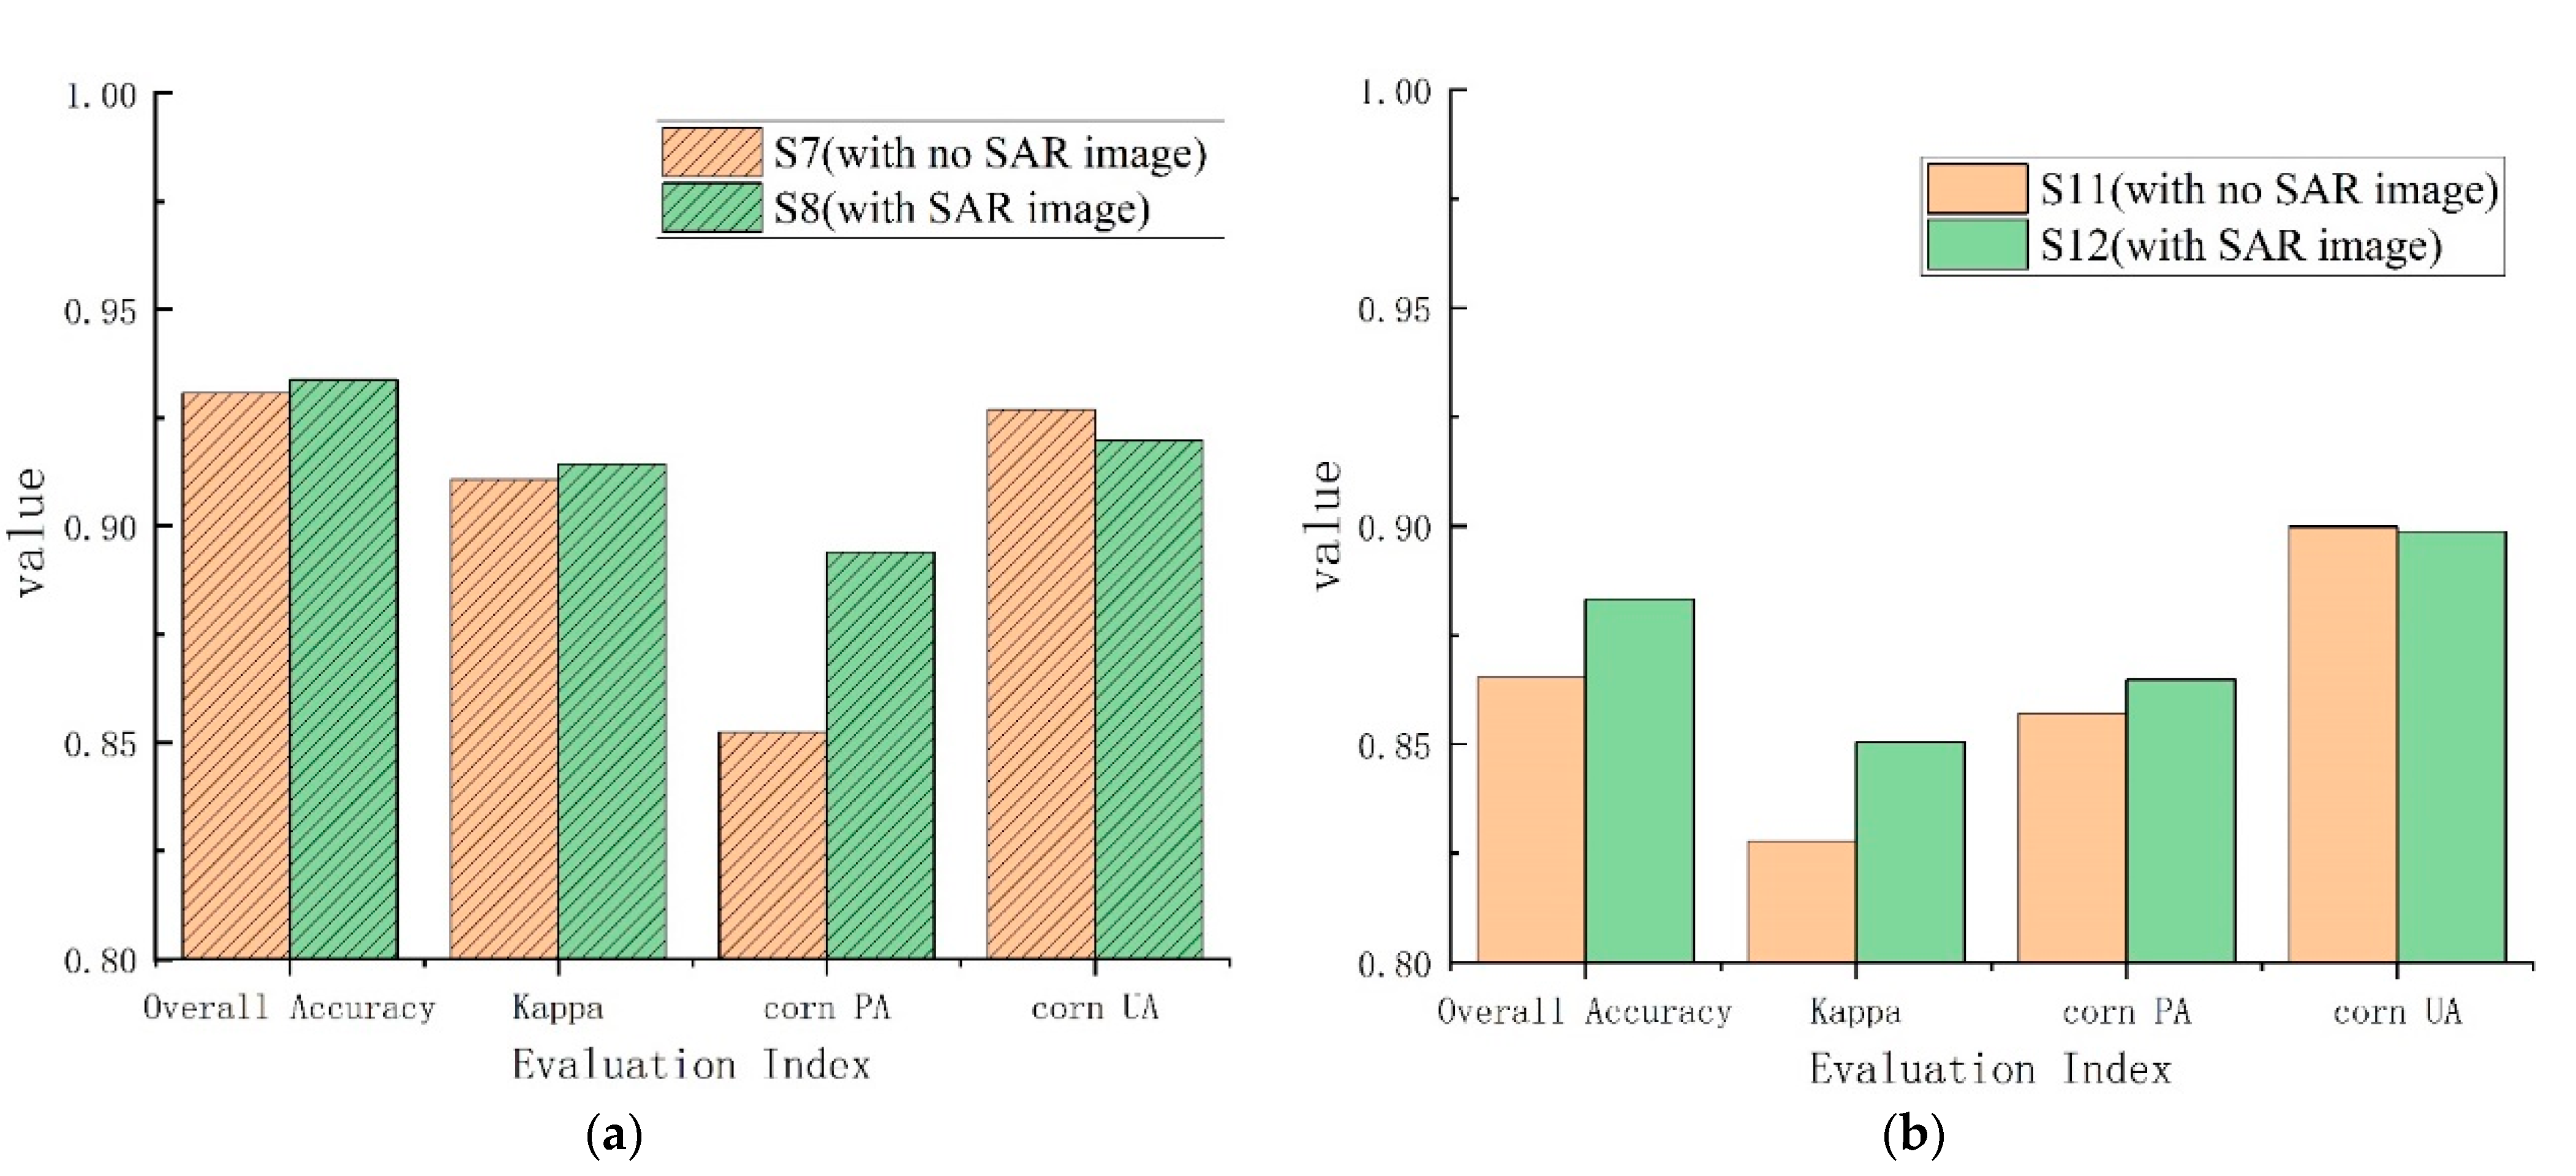
3.2. Influence of SAR Images on Corn Field Extraction Accuracy

Four classification scenes, S7, S8, S11, and S12, were designed to explore the influence of SAR images on the improvement in classification accuracy of time series image combinations. Scenes S7, S8, S11, and S12 reflect the experimental results of the GF images and Sentinel images, respectively.
Figure 4 shows the classification results of scenes S7, S8, S11, and S12. When the polarization features of the SAR image were added, the misclassification was reduced.
As shown in Figure 5a, after adding SAR images, the overall accuracy, Kappa coefficient, and corn PA increased by 0.30%, 0.035, and 4.16%, respectively, in the GF series images, and only corn UA decreased by 0.72%. Therefore, GF-3 SAR images could improve the accuracy of multiple temporal image classification in Chinese GF series images. As shown in Figure 5b, the overall accuracy, Kappa coefficient, and corn PA increased by 1.79%, 0.0227, and 0.68%, respectively, in the Sentinel series images. The UA of corn only decreased by 0.11%. Therefore, in Sentinel series images, Sentinel-1SAR images could greatly improve the accuracy of multiple temporal image classification. There were many cloudy and rainy weather events in June, July, and August on the Songnen Plain in Northeast China, which led to serious cloud coverage in some optical remote sensing images. SAR images were not affected by clouds. Therefore, SAR images compensated for the defects of optical images, which is very important in multitemporal image research. Therefore, in Chinese GF series images and Sentinel images, the addition of SAR images could improve the classification accuracy of ground objects in multiple time sequences.

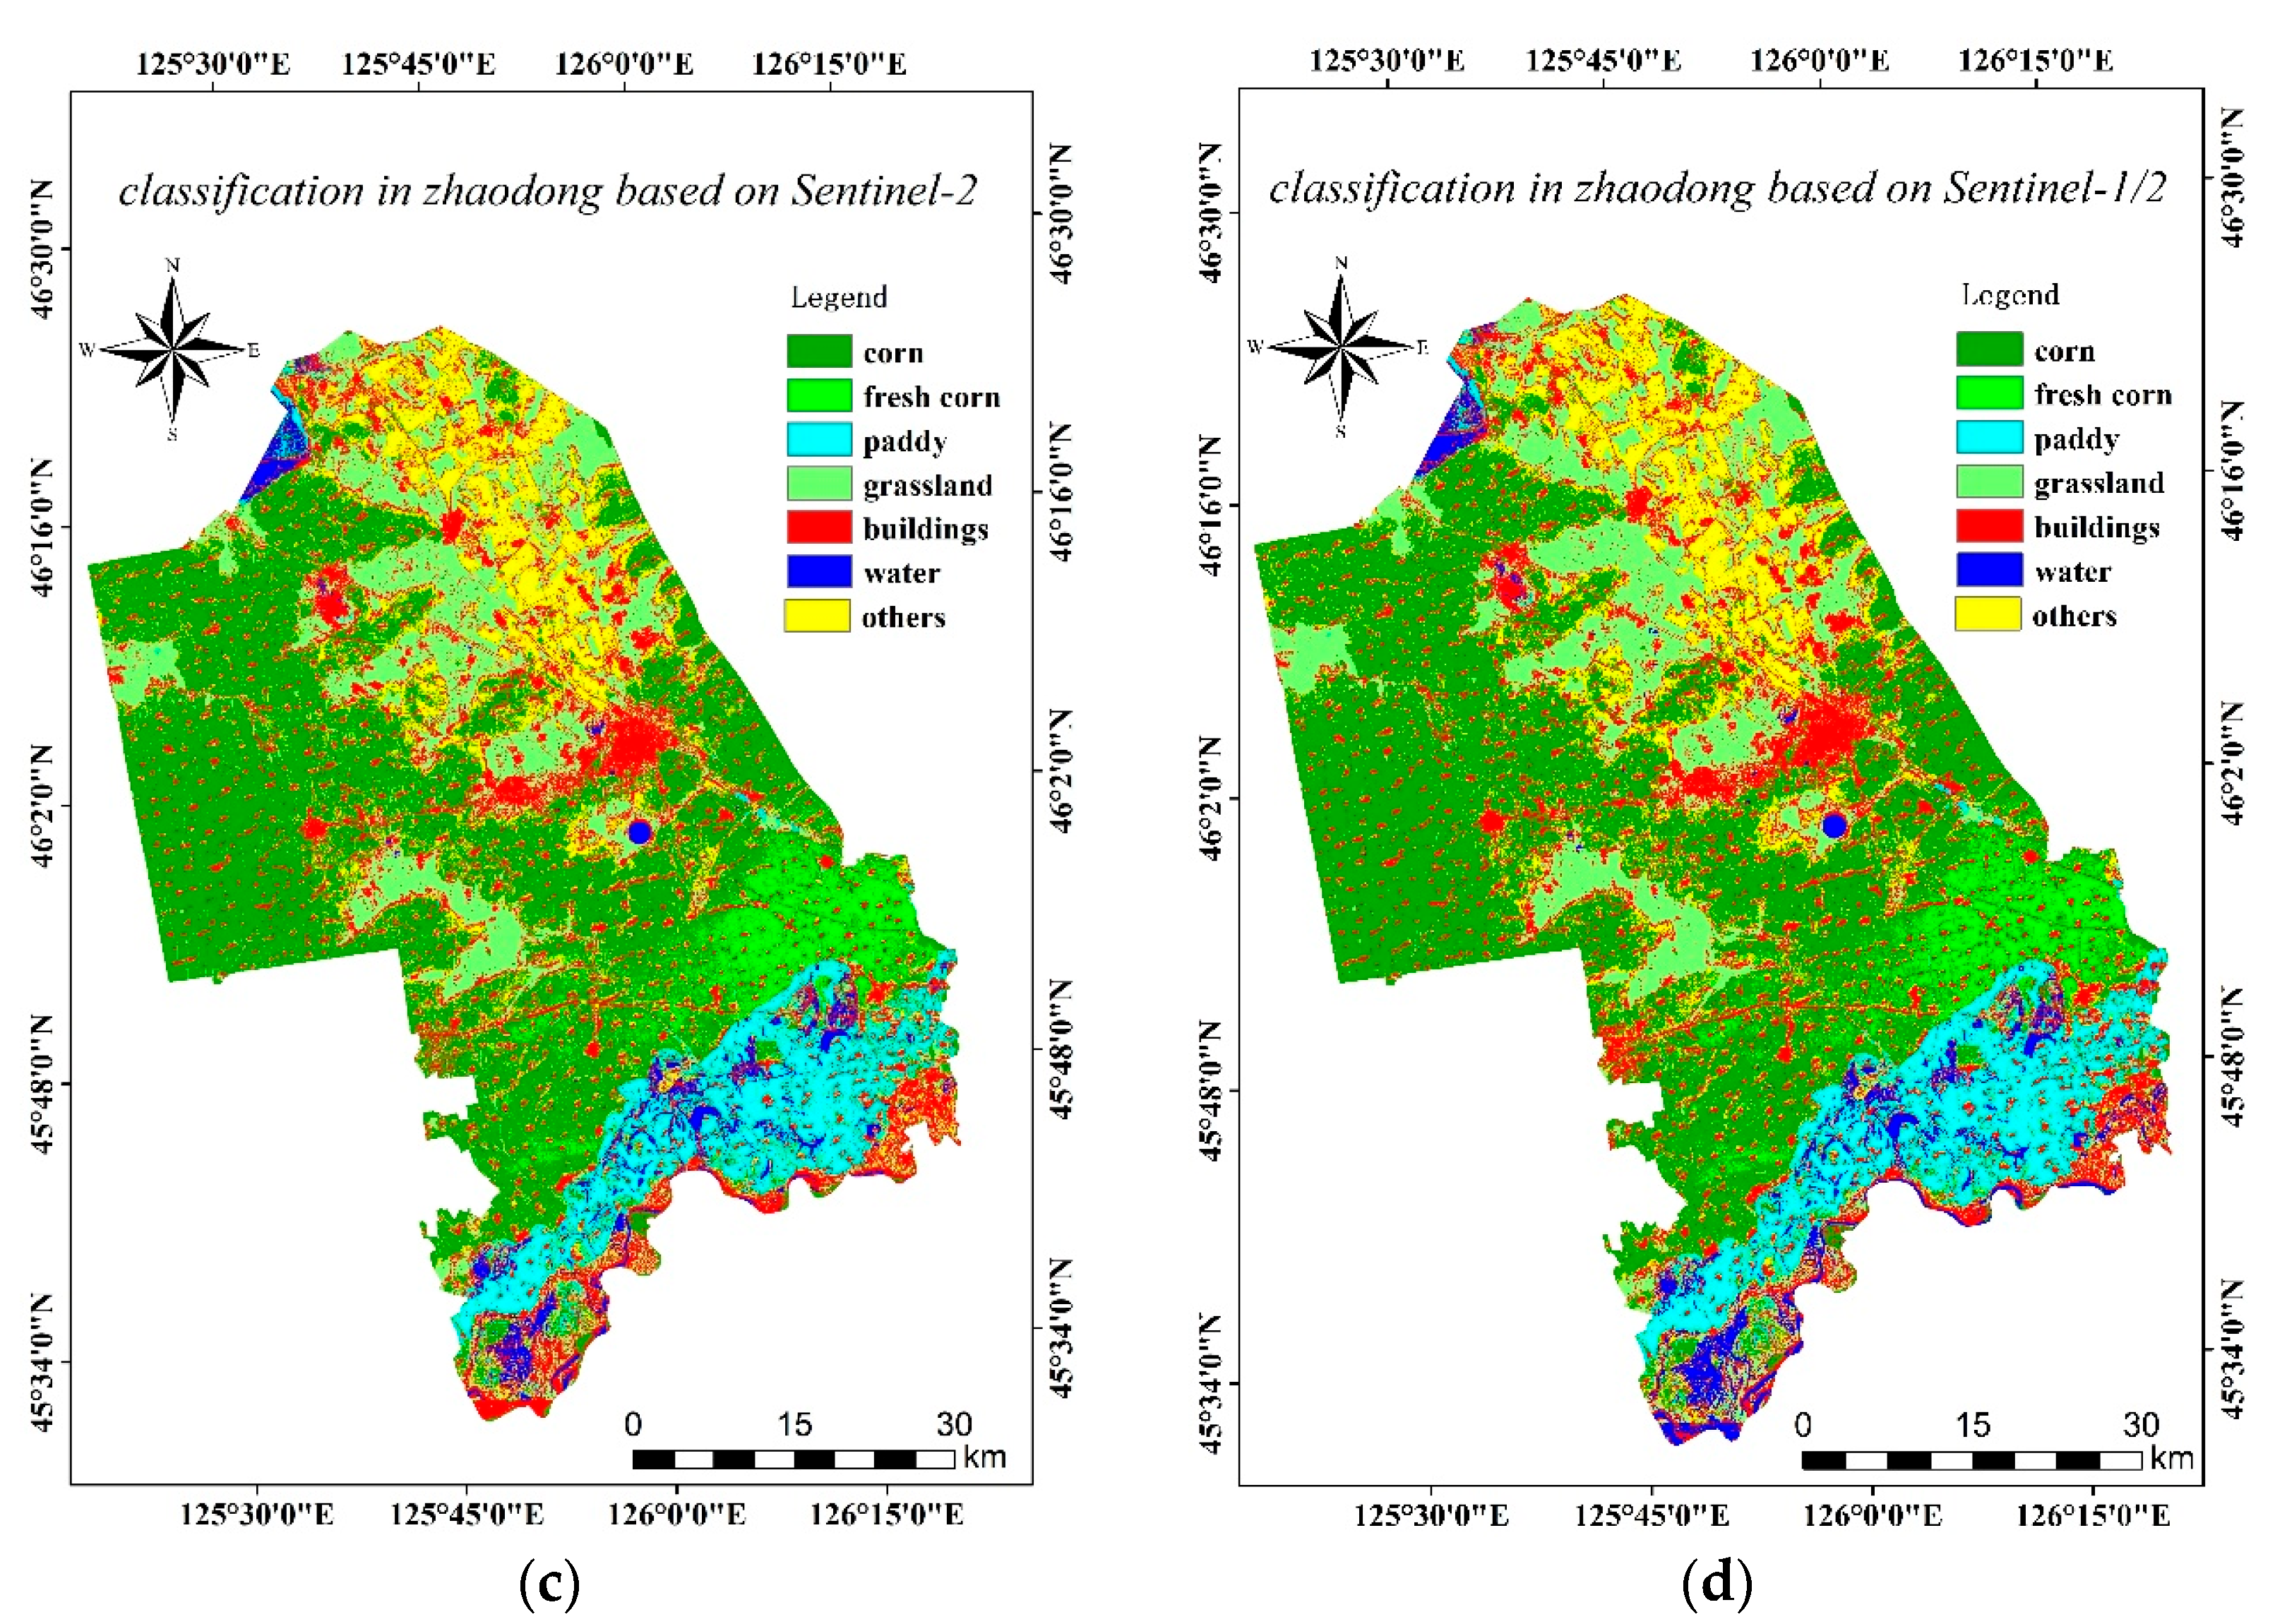
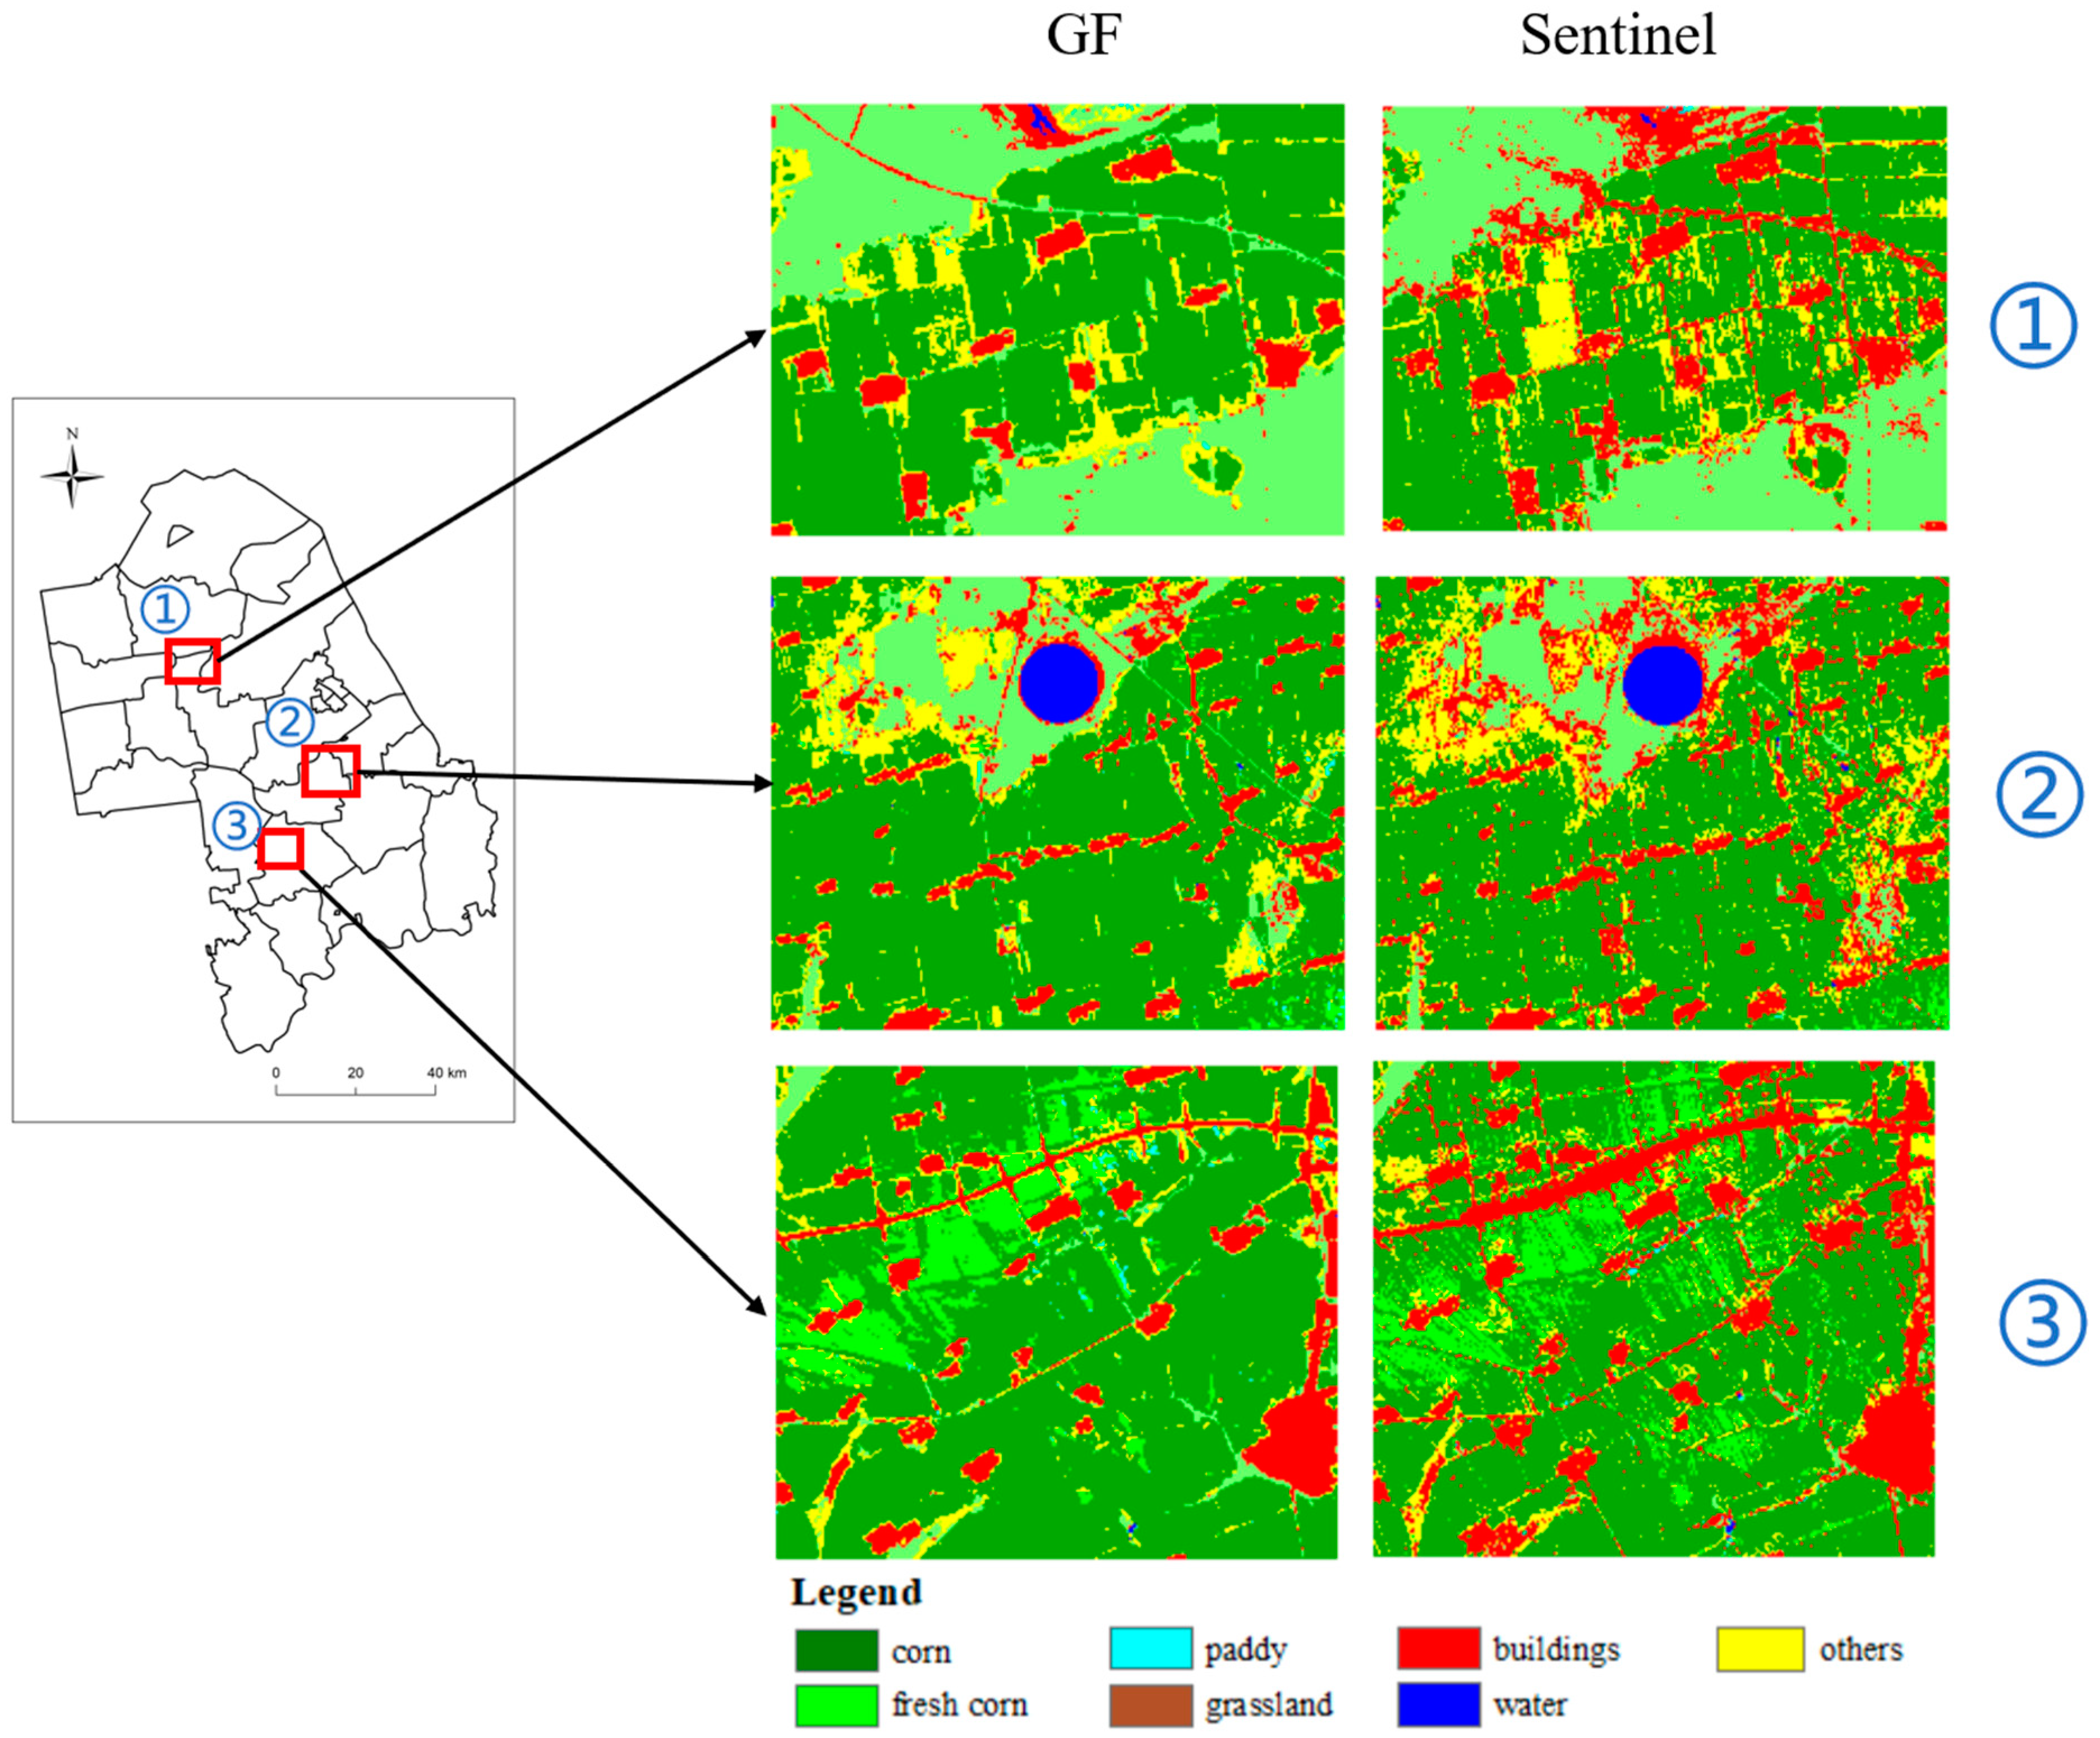
3.3. Comparison of Classification Accuracy between GF and Sentinel in Time Series Images Combined with Optical and SAR

Six classification scenes, S5, S6, S8, S9, S10, and S12, were designed to compare the classification accuracy of the time series combination of GF-6 WFV and GF-3 SAR images with Sentinel-2/1 images. The classification results are shown in Table 6.
As shown in Table 6, compared with Chinese GF-6/GF-3 images and Sentinel-1/2 images, the classification accuracy of GF-6/GF-3 images was better than that of Sentinel-1/2 images. In the comparison of classification scenes S5 and S9 (5,6,7-month), S6 and S10 (7,8,9-month), and S8 and S12 (5,6,7,8,9-month), the classification accuracy of GF images was higher than that of Sentinel images. S8 and S12 were the two scenes with the highest classification accuracy of the GF and Sentinel images, respectively. In the comparison of S8 and S12 classification scenes, the overall accuracy, Kappa coefficient, corn PA, and corn UA of Sentinel series images were lower by 5.05%, 0.0638, 2.90%, and 2.10%, respectively.
On the Songnen Plain in Northeast China, June, July, and August fall in the cloudy and rainy season, and optical images are easily affected by cloud cover, which makes them unusable. The GF-6 satellite has a shorter revisit period; therefore, it is easier to obtain cloud-free, high-quality images. SAR images cannot achieve the classification accuracy of optical images because of their few features, which leads to the classification accuracy of Sentinel series images being lower than that of Chinese GF series images. GF-6 WFV images have an advantage in time series image classification because of their high temporal resolution.
Figure 6 shows an enlarged view of the local area in Figure 4b,d. It shows the classification results of the two images in detail, with the classification results of GF time series images on the left and Sentinel images on the right. There were many misclassifications in Sentinel temporal images, and the classification results were messy. In comparison, there were fewer misclassifications in GF temporal images.
In the classification of remote sensing images of time series, the classification accuracy of images with high temporal resolution and low spatial resolution is higher than that of images with high spatial resolution and low temporal resolution.

4. Discussion

Any crop has its own specific growth cycle, and the growth state of crops in each period is various; therefore, the classification results of different growth periods are diverse. For a wide range of medium-resolution remote sensing classifications, a single remote sensing image can no longer meet the accuracy of ground object extraction [33,34]. First, this study verified the advantages of time series images in terms of classification accuracy compared with single temporal images. Taking experiments S1–S4 as an example, in the seedling stage of corn, the overall classification precision and extraction accuracy of corn were extremely low. The reason for this was that all plants, including corn, were in the germination state at the seedling stage, the difference between various vegetation was small, and the separability was not obvious. Therefore, the overall classification accuracy and extraction precision of corn were lower. In August, the total classification accuracy, Kappa coefficient, and extraction precision of corn all reached their highest values. In this period, corn reached a more vigorous state, and the separability between various vegetation types became more obvious; therefore, the classification effect was the best in milk maturity. By observing the periodic fluctuation curve of the NDVI, we found that July was the dividing line, and the change from May to July was large, while the change from July to September was small. Therefore, this paper examined the time series classification effects of May–July, July–September, and May–September. The results showed that the total accuracy and Kappa coefficient of the series combination in May–July were higher than those in July–September, while the extraction accuracy of corn was lower than that in July–September. The reason for this was that the growth state of each vegetation changed greatly from May to July, which contained more phenological information; therefore, the overall classification effect from May to July was better. In comparison, the difference between corn and other vegetation from July to September increased, and the differentiation was higher; therefore, the extraction effect of corn from July to September was better. From May to September, the classification effect of the full-cycle time series image combination was better than all the above classification results. This shows that the classification effect of multiple time series image combinations can greatly improve classification accuracy, and it is a significant way to classify large-scale crops by remote sensing.
In the study of the time series combination of corn, the optical image in June could not be collected because of cloud coverage. This problem is significant in the field of remote sensing [35,36,37,38]. In this paper, SAR images were used instead, and two series of images were selected, namely, GF-6/GF-3 and Sentinel-1/Sentinel-2. Through Experiments S7 and S8, it could be found that after adding SAR images in June, the overall classification accuracy, Kappa coefficient, and corn extraction accuracy improved to a certain extent. In the experiment of Sentinel-1/Sentinel-2 images, the optical images in July and August could not be used, and Sentinel-1SAR images were used instead. Through the experimental results of S11 and S12, it could be found that after adding SAR images, the overall classification accuracy, Kappa coefficient, and corn extraction accuracy were improved. These two groups of experiments prove that the polarization characteristics of SAR images can play an important role in time series image classification to improve the accuracy of classification. In the time series image classification experiment, when optical images could not be used in a certain period, SAR images could be used instead.
In comparison, Sentinel series data were used earlier, which are relatively mature data and are widely favored in the field of scientific research. Different remote sensing images have great differences in viewpoint, illumination, and resolution [39]. GF-6 WFV data have two additional red edge bands [40,41], which have certain advantages in vegetation monitoring. The experimental results of S5–S12 showed that the classification accuracy of the GF-6/GF-3 images was significantly higher than that of the Sentinel-1/Sentinel-2 images. SAR images were slightly worse than optical images in image classification because they did not have important bands, such as visible-light and near-infrared bands. In the comparison between S5 and S9, Sentinel 2 lacked optical images in July, GF-6 WFV lacked optical images in June, and GF-6 WFV optical images contained a longer time span and richer phenological information; therefore, GF6/GF3 images had a better classification effect. In the comparison between S6 and S10, S7 and S11, and S8 and S12, the classification accuracy of GF6/GF3 was higher than that of Sentinel-1/Sentinel-2. The possible reason for this was that the revisit period of the GF-6 WFV image is 4 days, and the revisit period of the Sentinel-2 binary star combination is 5 days. GF-6 makes it easier to obtain high-quality optical images; therefore, GF-6 WFV images have more advantages in time series image classification. In temporal image classification, the effect of high temporal resolution is greater than that of high spatial resolution.
SAR image is microwave imaging, without visible-light, near-infrared, and other important bands, and is fundamentally different from optical image, so it cannot be completely replaced. The experimental results in this paper also showed that in multi-time series images, if the number of SAR images introduced is large, the classification accuracy is lower. This shows that SAR image is limited in image classification. Therefore, in the face of cloud cover, cloud removal is the best way. At present, image cloud removal technology is not mature enough; there is still a long way to go. Cloud removal processing of satellite images will be important for crop classification now and in the future.
Multi-time series images will inevitably lead to an increase in the amount of data. This paper spent a lot of time and energy in the preprocessing stage of the images. In future research, Google Earth Engine and PIE-Engine cloud computing platforms can be used. This will reduce the workload of image preprocessing and improve efficiency.

5. Conclusions

Corn growing has five periods in Zhaodong (May–September). In terms of a single growth period, the classification accuracy in May was the lowest, while the classification accuracy in August was the highest. The classification accuracy can be greatly improved by using the time series combination of the whole growth stage. The overall accuracy, Kappa coefficient, corn PA, and corn UA were 93.37%, 0.9143, 89.39%, and 91.97%, respectively.
SAR polarization characteristics can improve the classification accuracy of time series images because SAR images are sensitive to the spatial characteristics of ground objects. In June, July, and August, the vacancy of optical images was compensated. In GF-6 and GF-3 images, the overall accuracy, Kappa coefficient, corn PA and improved accuracy were 0.30%, 0.035, and 4.16%, respectively, after adding GF-3 SAR images. In the Sentinel series images, the overall accuracy, Kappa coefficient, corn PA and improved accuracy were 1.79%, 0.0227, and 0.68%, respectively, after adding Sentinel-1 images, while corn UA only decreased by 0.11%. The results of the two kinds of image classification have proved that SAR image has a positive effect on multi-time series image classification.
The classification accuracy of the time series combination of Chinese GF-6 and GF-3 was higher than that of Sentinel-2 and Sentinel-1 images. The GF series was 5.05%, 0.0638%, 2.90%, and 2.10% higher than the Sentinel series in regard to 4 indices, total precision, Kappa coefficient, corn PA, and corn UA, respectively. This indicates that temporal resolution plays a more important role in the classification of multi-temporal images.
By studying the data of the GF and Sentinel series, this paper makes a more comprehensive contribution to the field of optical and SAR multi-temporal image classification. This study provides a valuable reference for crop classification with optical and SAR time series images.

Author Contributions

Methodology, C.L. and H.M.; validation, H.M., C.L., M.Z. and W.H.; investigation, Y.L.; resources, C.L. and Y.L.; writing—original draft preparation, H.M.; writing—review and editing, H.M.; supervision, C.L. and Y.G.; and funding acquisition, Y.L. and C.L. All authors have read and agreed to the published version of the manuscript.

Funding

This research was funded by the National Key Research and Development Plan Topics (2022YFC3802805) and the Youth Foundation of Beijing Academy of Agriculture and Forestry Sciences (QNJJ202232).

Institutional Review Board Statement

Not applicable.

Informed Consent Statement

Not applicable.

Data Availability Statement

Not applicable.

Conflicts of Interest

The authors declare no conflict of interest.

References

  1. Liu, X.; Yu, L.; Zhong, L.; Hao, P.; Wu, B.; Wang, H.; Yu, C.; Gong, P. Spatial-temporal patterns of features selected using random forests: A case study of corn and soybeans mapping in the USA. Int. J. Remote Sens. 2018, 40, 269–283. [Google Scholar] [CrossRef]
  2. Qiu, T.; Song, C.; Li, J. Deriving Annual Double-Season Cropland Phenology Using Landsat Imagery. Remote Sens. 2020, 12, 3275. [Google Scholar] [CrossRef]
  3. Jiang, L.; Yang, Y.; Shang, S. Remote Sensing-Based Assessment of the Water-Use Efficiency of Maize over a Large, Arid, Regional Irrigation District. Remote Sens. 2022, 14, 2035. [Google Scholar] [CrossRef]
  4. Orusa, T.; Orusa, R.; Viani, A.; Carella, E.; Borgogno Mondino, E. Geomatics and EO Data to Support Wildlife Diseases Assessment at Landscape Level: A Pilot Experience to Map Infectious Keratoconjunctivitis in Chamois and Phenological Trends in Aosta Valley (NW Italy). Remote Sens. 2020, 12, 3542. [Google Scholar] [CrossRef]
  5. Vaudour, E.; Noirot-Cosson, P.E.; Membrive, O. Early-season mapping of crops and cultural operations using very high spatial resolution Pleiades images. Int. J. Appl. Earth Obs. Geoinf. 2015, 42, 128–141. [Google Scholar] [CrossRef]
  6. Sreedhar, R.; Varshney, A.; Dhanya, M. Sugarcane crop classification using time series analysis of optical and SAR sentinel images: A deep learning approach. Remote Sens. Lett. 2022, 13, 812–821. [Google Scholar] [CrossRef]
  7. Xiao, X.; Lu, Y.; Huang, X.; Chen, T. Temporal Series Crop Classification Study in Rural China Based on Sentinel-1 SAR Data. IEEE J. Sel. Top. Appl. Earth Obs. Remote Sens. 2021, 14, 2769–2780. [Google Scholar] [CrossRef]
  8. Wang, X.; Qiu, P.; Li, Y.; Cha, M. Crop type identification based on Landsat remote sensing data in Kaikong River Basin, Xinjiang. Trans. Soc. Agric. Mach. 2019, 35, 180–188. [Google Scholar]
  9. Xiong, J.; Thenkabail, P.S.; Gumma, M.K.; Teluguntla, P.; Poehnelt, J.; Congalton, R.G.; Yadav, K.; Thau, D. Automated cropland mapping of continental Africa using Google Earth Engine cloud computing. ISPRS J. Photogramm. Remote Sens. 2017, 126, 225–244. [Google Scholar] [CrossRef]
  10. Inglada, J.; Vincent, A.; Arias, M.; Marais-Sicre, C. Improved Early Crop Type Identification by Joint Use of High Temporal Resolution SAR And Optical Image Time Series. Remote Sens. 2016, 8, 362. [Google Scholar] [CrossRef]
  11. Luo, C.; Liu, H.-J.; Lu, L.-P.; Liu, Z.-R.; Kong, F.-C.; Zhang, X.-L. Monthly composites from Sentinel-1 and Sentinel-2 images for regional major crop mapping with Google Earth Engine. J. Integr. Agric. 2021, 20, 1944–1957. [Google Scholar] [CrossRef]
  12. Skakun, S.; Kussul, N.; Shelestov, A.Y.; Lavreniuk, M.; Kussul, O. Efficiency Assessment of Multitemporal C-Band Radarsat-2 Intensity and Landsat-8 Surface Reflectance Satellite Imagery for Crop Classification in Ukraine. IEEE J. Sel. Top. Appl. Earth Obs. Remote Sens. 2016, 9, 3712–3719. [Google Scholar] [CrossRef]
  13. Sun, Y.; Li, Z.-L.; Luo, J.; Wu, T.; Liu, N. Farmland parcel-based crop classification in cloudy/rainy mountains using Sentinel-1 and Sentinel-2 based deep learning. Int. J. Remote Sens. 2022, 43, 1054–1073. [Google Scholar] [CrossRef]
  14. Zhang, Y. Calculation of radiative fluxes from the surface to top of atmosphere based on ISCCP and other global data sets: Refinements of the radiative transfer model and the input data. J. Geophys. Res. 2004, 109. [Google Scholar] [CrossRef]
  15. He, Z.; Hu, J.; Cai, Z.; Wang, W.; Hu, Q. Remote sensing recognition of Artemisia argyi using multi-temporal GF-1 and GF-6 satellite images. Trans. Chin. Soc. Agric. Eng. 2022, 38, 186–195. [Google Scholar]
  16. Orusa, T.; Cammareri, D.; Borgogno Mondino, E.B. A Possible Land Cover EAGLE Approach to Overcome Remote Sensing Limitations in the Alps Based on Sentinel-1 and Sentinel-2: The Case of Aosta Valley (NW Italy). Remote Sens. 2022, 15, 178. [Google Scholar] [CrossRef]
  17. Sun, Y.; Luo, J.; Wu, T.; Zhou, Y.; Liu, H.; Gao, L.; Dong, W.; Liu, W.; Yang, Y.; Hu, X.; et al. Synchronous Response Analysis of Features for Remote Sensing Crop Classification Based on Optical and SAR Time-Series Data. Sensors 2019, 19, 4227. [Google Scholar] [CrossRef]
  18. van Beijma, S.; Comber, A.; Lamb, A. Random forest classification of salt marsh vegetation habitats using quad-polarimetric airborne SAR, elevation and optical RS data. Remote Sens. Environ. 2014, 149, 118–129. [Google Scholar] [CrossRef]
  19. Liu, C.-A.; Chen, Z.-X.; Shao, Y.; Chen, J.-S.; Hasi, T.; Pan, H.-Z. Research advances of SAR remote sensing for agriculture applications: A review. J. Integr. Agric. 2019, 18, 506. [Google Scholar] [CrossRef]
  20. Orusa, T.; Cammareri, D.; Borgogno Mondino, E. A Scalable Earth Observation Service to Map Land Cover in Geomorphological Complex Areas beyond the Dynamic World: An Application in Aosta Valley (NW Italy). Appl. Sci. 2022, 13, 390. [Google Scholar] [CrossRef]
  21. Erinjery, J.J.; Singh, M.; Kent, R. Mapping and assessment of vegetation types in the tropical rainforests of the Western Ghats using multispectral Sentinel-2 and SAR Sentinel-1 satellite imagery. Remote Sens. Environ. 2018, 216, 345–354. [Google Scholar] [CrossRef]
  22. Shuai, G.; Zhang, J.; Basso, B.; Pan, Y.; Zhu, X.; Zhu, S.; Liu, H. Multi-temporal RADARSAT-2 polarimetric SAR for maize mapping supported by segmentations from high-resolution optical image. Int. J. Appl. Earth Obs. Geoinf. 2019, 74, 1–15. [Google Scholar] [CrossRef]
  23. Lee, C.; Chen, W.; Wang, Y.; Jack, M.C.; Wang, Y.; She, Y. Extraction of winter wheat planting area in county based on multi-source Sentinel data. Trans. Soc. Agric. Mach. 2021, 52, 207–215. [Google Scholar]
  24. Zhang, C.; Chen, C.; Xu, H.; Xue, L. Multi-source remote sensing crop recognition in cloudy and foggy areas based on XGBoost algorithm. Trans. Soc. Agric. Mach. 2022, 53, 149–156. [Google Scholar]
  25. Liu, Z.; Liu, Z.; Wan, W.; Hang, J.; Wong, J.; Zheng, M. Estimation of corn straw cover from SAR and optical remote sensing images. J. Remote Sens. 2021, 25, 1308–1323. [Google Scholar]
  26. Lee, L.; Tian, X.; Weng, Y. Land cover classification based on polarimetric SAR and optical image features. J. Southeast Univ. 2021, 51, 529–534. [Google Scholar]
  27. Cai, W.; Zhao, S.; Wang, Y.; Peng, F.; Heo, J.; Duan, Z. Estimation of Winter Wheat Residue Coverage Using Optical and SAR Remote Sensing Images. Remote Sens. 2019, 11, 1163. [Google Scholar] [CrossRef]
  28. Bai, Y.; Sun, G.; Li, Y.; Ma, P.; Li, G.; Zhang, Y. Comprehensively analyzing optical and polarimetric SAR features for land-use/land-cover classification and urban vegetation extraction in highly-dense urban area. Int. J. Appl. Earth Obs. Geoinf. 2021, 103, 102496. [Google Scholar] [CrossRef]
  29. Hasituya; Chen, Z.; Li, F.; Hongmei. Mapping Plastic-Mulched Farmland with C-Band Full Polarization SAR Remote Sensing Data. Remote Sens. 2017, 9, 1264. [Google Scholar] [CrossRef]
  30. Hou, H.; Ge, L.; Sun, X.; Hole, T.; Lou, W.; Qin, T.; Pore, F.; Yang, B.; Young, K. Application of surface matrix in the survey and evaluation of black land resources in China: Based on the survey of surface matrix in Baoqing area, Heilongjiang Province. J. Nat. Resour. 2022, 37, 2264–2276. [Google Scholar]
  31. Yang, H.; Zhao, H. Spatial-temporal characteristics of land and water resources matching under the change of cultivated land structure: A case study of Heilongjiang Province. J. Nat. Resour. 2022, 37, 2247–2263. [Google Scholar]
  32. Liang, J.; Zheng, Z.; Xia, S.; Zhang, T.; Don, Y. Crop identification and evaluation of red edge features of GF-6. J. Remote Sens. 2020, 24, 1168–1179. [Google Scholar]
  33. Cheng, G.; Xie, X.; Han, J.; Guo, L.; Xia, G.-S. Remote Sensing Image Scene Classification Meets Deep Learning: Challenges, Methods, Benchmarks, and Opportunities. IEEE J. Sel. Top. Appl. Earth Obs. Remote Sens. 2020, 13, 3735–3756. [Google Scholar] [CrossRef]
  34. Sonobe, R.; Yamaya, Y.; Tani, H.; Wang, X.; Kobayashi, N.; Mochizuki, K.-I. Mapping crop cover using multi-temporal Landsat 8 OLI imagery. Int. J. Remote Sens. 2017, 38, 4348–4361. [Google Scholar] [CrossRef]
  35. Liu, X.; Zhai, H.; Shen, Y.; Lou, B.; Jiang, C.; Li, T.; Hussain, S.B.; Shen, G. Large-Scale Crop Mapping from Multisource Remote Sensing Images in Google Earth Engine. IEEE J. Sel. Top. Appl. Earth Obs. Remote Sens. 2020, 13, 414–427. [Google Scholar] [CrossRef]
  36. Sonobe, R.; Yamaya, Y.; Tani, H.; Wang, X.; Kobayashi, N.; Mochizuki, K.-I. Assessing the suitability of data from Sentinel-1A and 2A for crop classification. GIScience Remote Sens. 2017, 54, 918–938. [Google Scholar] [CrossRef]
  37. Xie, L.; Zhang, H.; Li, H.; Wang, C. A unified framework for crop classification in southern China using fully polarimetric, dual polarimetric, and compact polarimetric SAR data. Int. J. Remote Sens. 2015, 36, 3798–3818. [Google Scholar] [CrossRef]
  38. Yang, X.; Sun, L.; Tang, X.; Ai, B.; Xu, H.; Wen, Z. An Improved Fmask Method for Cloud Detection in GF-6 WFV Based on Spectral-Contextual Information. Remote Sens. 2021, 13, 4936. [Google Scholar] [CrossRef]
  39. Chen, T.; Zhao, Y.; Guo, Y. Sparsity-regularized feature selection for multi-class remote sensing image classification. Neural Comput. Appl. 2019, 32, 6513–6521. [Google Scholar] [CrossRef]
  40. Kang, Y.; Meng, Q.; Liu, M.; Zou, Y.; Wang, X. Crop Classification Based on Red Edge Features Analysis of GF-6 WFV Data. Sensors 2021, 21, 4328. [Google Scholar] [CrossRef]
  41. Wang, C.; Zhang, X.; Shi, T.; Zhang, C.; Li, M. Classification of Medicinal Plants Astragalus Mongholicus Bunge and Sophora Flavescens Aiton Using GaoFen-6 and Multitemporal Sentinel-2 Data. IEEE Geosci. Remote Sens. Lett. 2022, 19, 1–5. [Google Scholar] [CrossRef]
Figure 1. Overview of the study area.
Land 12 00398 g001
Figure 2. NDVI variation curve of different vegetation types in Zhaodong.
Land 12 00398 g002
Figure 3. Workflow methodology of corn land extraction.
Land 12 00398 g003
Figure 4. Classification results based on optical and SAR remote sensing images (reference frame: WGS84/UTM51N). Note: Figure (a) shows the classification results of S7 with GF6 optical data, Figure (b) shows the classification results of S8 with GF6 optical data and GF-3 SAR, and Figure (c) shows the classification results of S11 with Sentinel-2 optical data. Figure (d) shows the classification results of S12 with Sentinel-2 optical data and Sentinel-1 SAR data.
Land 12 00398 g004aLand 12 00398 g004b
Figure 5. The variation of classification results between with using SAR images and not. Note: Figure (a) shows the accuracy comparison of GF images with SAR images and without SAR images. Figure (b) shows the accuracy comparison of Sentinel images with SAR images and without SAR images.
Land 12 00398 g005
Figure 6. Details of the GF and Sentinel image classification results (reference frame: WGS84/UTM51N).
Land 12 00398 g006
Table 1. Spectral parameters of Sentinel-2 images.
Wavelength BandSpatial ResolutionCenter Wavelength/nm
B2—Blue10 m490
B3—Green560
B4—Red665
B 8—Nir842
B5—Red edge20 m705
B6—Red edge740
B7—Edge of the Nir plateau783
B8a—Narrow Nir865
B11—Swir1610
B12—Swir2190
B1—Coastal aerosol60 m443
B9—Water Vapor945
Table 2. Image acquisition at each growth stage.
MayJuneJulyAugustSeptember
Corn growth periodSeedling stageJointing stageHeading stageMilk ripening stageMaturation stage
GF imagesGF-6GF-3GF-6GF-6GF-6
Sentinel imagesSentinel-2Sentinel-2Sentinel-1Sentinel-1Sentinel-2
Table 3. The formulae for different vegetation indices.
Index NameFormula
Normalized Differential Vegetation Index (NDVI) N D V I = ρ n i r ρ r ρ n i r + ρ r
Ratio Vegetation Index (RVI) R V I = ρ n i r ρ r
Differential Vegetation Index (DVI) D V I = ρ n i r ρ r
Chlorophyll Index (CIgreen) C I g r e e n = ρ n i r ρ g 1
Table 4. Classification scenes.
ScenesFeature CombinationDataAlgorithm
S1May + spectral characteristics (NDVI RVI DVI CIgreen  ρ b   ρ g ρ n i r 1 )GF6RF
S2July + spectral characteristics (NDVI RVI DVI CIgreen  ρ b   ρ g ρ n i r 1 )GF6RF
S3August + spectral features (NDVI RVI DVI CIgreen  ρ b   ρ g ρ n i r 1 )GF6RF
S4September + spectral characteristics (NDVI RVI DVI CIgreen  ρ b   ρ g ρ n i r 1 )GF6RF
S55,6,7 months + spectral characteristics (NDVI RVI DVI CIgreen  ρ b     ρ g   ρ n i r 1 ) + HH HVGF6/GF3RF
S67,8,9 months + spectral characteristics (NDVI RVI DVI CIgreen  ρ b     ρ g   ρ n i r 1 )GF6RF
S75,7,8,9 months + spectral characteristics (NDVI RVI DVI CIgreen  ρ b   ρ g   ρ n i r 1 )GF6RF
S85,6,7,8,9 months + spectral characteristics (NDVI RVI DVI CIgreen  ρ b     ρ g   ρ n i r 1 ) + HH HVGF6/GF3RF
S95,6,7 months + spectral characteristics (NDVI RVI DVI CIgreen  ρ b     ρ g   ρ n i r 1 ) + VV VHSentinel-1/2RF
S107,8,9 months + spectral characteristics (NDVI RVI DVI CIgreen  ρ b   ρ g   ρ n i r 1 ) + VV VHSentinel-1/2RF
S115,6,9 months + spectral characteristics (NDVI RVI DVI CIgreen  ρ b     ρ g   ρ n i r 1 )Sentinel-1RF
S125,6,7,8,9 months + spectral characteristics (NDVI RVI DVI CIgreen  ρ b     ρ g   ρ n i r 1 ) + VV VHSentinel-1/2RF
Note: ρ b represents the reflectivity of the blue band,   ρ g represents the green band, and ρ n i r 1 represents near-infrared band 1.
Table 5. Classification results at different growth stages based on GF3/GF6 images.
ScenesMonthsDataOverall Accuracy OA/%KappaCorn PA/%Corn UA/%
S15GF-678.610.725155.4252.68
S27GF-686.010.821082.4089.74
S38GF-689.160.859986.1091.72
S49GF-686.950.831281.9593.05
S55,6,7GF-6/391.100.885386.8385.86
S67,8,9GF-689.540.865489.2693.07
S75,7,8,9GF-693.090.910885.2392.69
S85,6,7,8,9GF-6/393.370.914389.3991.97
Table 6. Classification results of Chinese GF series and Sentinel series images.
ScenesMonthsDataOverall Accuracy/%KappaCorn PA/%Corn UA/%
S55,6,7GF-6/390.580.878684.6685.58
S67,8,9GF-689.540.865489.2693.07
S85,6,7,8,9GF-6/393.370.914389.3991.97
S95,6,7Sentinel-2/183.790.793175.6979.58
S107,8,9Sentinel-2/187.440.837386.8287.08
S125,6,7,8,9Sentinel-2/188.320.850586.4989.87
Disclaimer/Publisher’s Note: The statements, opinions and data contained in all publications are solely those of the individual author(s) and contributor(s) and not of MDPI and/or the editor(s). MDPI and/or the editor(s) disclaim responsibility for any injury to people or property resulting from any ideas, methods, instructions or products referred to in the content.

