Abstract
Land take and soil sealing imply land cover transitions that may possibly result in decreased capacity to resist landslides; hence, this study focuses on the relations between land-taking processes and landslide hazard by addressing the following research question: “To what extent do land-taking processes increase landslide hazard?” The impact of land take is assessed through a regression model which relates the level of landslide hazard to a set of land cover variables which include artificialized land; that is, land taken up through urbanization processes, and a set of covariates that represent land cover types grouped in accordance with the LEAC (land and ecosystem accounting) classification. This methodological approach is implemented into the spatial context of Sardinia, an insular Italian region, and shows that not only the amount of taken up artificialized land, but also other types of land covers, are likely to increase the magnitude of landslide hazard. A set of implications concerning planning policies related to land cover and land cover transitions are discussed in the concluding section, where policy recommendations are identified in order to mitigate the impacts of land cover transitions on landslide hazards.
1. Introduction
According to the European Environment Agency, “Land take is the process in which urban areas and sealed surfaces occupy agricultural, forest or other semi-natural and natural areas” [1] (p.117). “The most intense form of land take is soil sealing, which is an essentially irreversible process that leads to the destruction or covering of soils by buildings and other construction, and layers of completely or partly impermeable artificial material (asphalt, concrete, etc.). Soil sealing accompanies land take, but areas subject to land take are usually not entirely sealed” [2]. At the end of 2021, the European Commission approved the new European Union (EU) Soil Strategy for 2030, which highlights how healthy soils are essential for achieving the objectives of the European Green Deal concerning climate and biodiversity. The strategy defines a general framework and concrete measures to protect and restore soils to ensure their sustainable use [3]. One of the long-term objectives to be achieved by 2050 is to reach “no net land take” [3] (p. 3). The general framework of the strategy termed “land take hierarchy” concerns four consequential actions: avoid, reuse, minimize, and compensate. The first action, i.e., “avoid”, aims at preventing further land take as much as possible. If land take cannot be prevented, then the second action, i.e., “reuse”, should be implemented, with a view to reusing land that has already been urbanized or sealed; for example, through soil remediation or densification. If land take cannot be prevented and land cannot be reused, the third action should be looked at, to minimize the effects of land take by impermeabilizing land that is already in unfavorable conditions. If all the precedent actions cannot be taken, the fourth action provides for applying compensation and mitigation measures.
In relation to the EU-28 (which means the 27 EU Member States plus the United Kingdom), although land take decreased from 2000 to 2018, in the period 2012–2018 it reached the amount of 539 km2 per year; 78% of land take takes place in agricultural areas, such as arable lands and permanent crops (50.5%), pasture and mosaic farmland (27.2%), forests and transitional woodlands (14.3%), and grasslands (6%) [4]. The main causes of land take are to be attributed to expansion of industrial and commercial areas, and to enlargement of residential zones and construction sites [2]. In Italy, in the 2020–2021 period, land take took a value of 69.1 km2, corresponding to an average value of 19 hectares per day. Only a tiny fraction of this growth in artificial surfaces was compensated by the restoration of natural areas, which equaled 5.8 km2, due to change from consumed soil to unconsumed soil through to the recovery of building sites, areas, and surfaces in cases where “reversible” land take [5] took place.
Moreover, land-taking processes entail several problems, such as the loss of multifunctional and fertile soils, biodiversity degradation and loss of ecosystem services (ESs) [6,7,8]. ESs are defined as benefits provided by ecosystems to human beings [9]. Since 1970, when the term “ecosystem service” was coined [10], this theme has increasingly been studied and analyzed in conceptual terms [11,12], in terms of classification [9,13], and in relation to their assessment and mapping [14,15]. Moreover, ESs provide protection against hydrogeological hazards [16]. According to Notaro and Paletto [17], this protection can be direct or indirect, where the former concerns the defense against natural phenomena such as floods and landslides.
A landslide is defined as the movement of materials such as rock, soil, debris, and artificial fill downward and outward along a slope [18] when the forces of gravity exceed the slope resistance [19]. Moreover, although landslides occur primarily in mountainous areas, this phenomenon may happen in low-relief zones [20]. The United States Geological Survey (USGS) [20] identifies three types of landslide causes: geological, morphological, and human. Indeed, the drivers of landslides may be either natural, caused by the intrinsic properties of rocks and soils or by physical processes, such as heavy rains and seismic activity, or artificial when human activities bring about changes in slope stability, as happens through deforestation or excessive soil sealing [21].
From this perspective, landslides are strongly connected with land use and land cover dynamics [22] and, particularly, with human-driven processes [23]. Human-induced activities, such as land use/land cover changes, may alter vegetation structure and modify soil characteristics and hydrogeological processes [24,25]. Indeed, despite the slowness that characterized geological and geomorphological changes, land use/land cover changes can occur in a short period of time due to their high dynamicity [26,27]. Land use/land cover changes can influence landside events in terms of frequency and spatial configuration due to their potential negative impacts on hydrological and mechanical processes involving soils [28,29].
The relation between land use/land cover changes and landslides has been studied by various authors [23,30,31]. Hao et al. [23] investigated the extent to which the landslide disaster occurred in 2018 in Kerala, India, was influenced by land use/land cover changes through a comparison between land use/land cover changes before (2010) and after (2018) the disaster. Pisano et al. [30] investigated how land cover changes influenced landslide susceptibility in the past and how they might influence future events, by carrying out a landslide susceptibility analysis implemented through a spatial multi-criteria evaluation in relation to three past land cover maps (1954, 1981, and 2007) and three future scenarios (one in 2030 and two in 2050) in the Rivo Basin, Italy. Muñoz-Torrero Manchado et al. [31] studied the influence of deforestation and related agricultural activities on landslide susceptibility using remote-sensing techniques and free satellite data in Nepal.
However, although several authors have studied the relation between land use/land cover changes and landslide hazard, the relation between land-taking processes and landslide hazard is still under-researched. Therefore, this study aims at analyzing the relations between land-taking processes and landslide hazard in order to understand to what extent land-taking processes increase landslide hazard through a regression model that relates the level of landslide hazard to a set of land cover variables that includes artificialized land; that is, land taken up through urbanization processes, and a set of covariates that represent the land cover types associated with the LEAC (land and ecosystem accounting) classification. The methodological approach is implemented in the Sardinia Region, Italy.
The study is structured into six sections as follows. The second section describes the study area, the methodological approach used, and the input data for the regression model (landslide hazard, LEAC land cover groups, geological characteristics and elevation). The results are presented in the third section and discussed in the fourth section. The fifth section provides recommendations and implications for spatial planning policies stemming from the results, while the sixth section provides concluding remarks and future directions of the research.
2. Materials and Methods
This section is structured into three subsections. The study area is described in the first subsection. In the second subsection, the discrete-choice Logit model is used to estimate the relations between land-taking processes and landslide hazard. The third subsection describes input data for the regression model.
2.1. Study Area
In Italy, a sectoral planning tool termed PAI, an acronym of “piano di assetto idrogeologico” (whose word-for-word translation would be “hydrogeological setting plan”), must identify areas prone to natural hazards; i.e., both landslide and flood hazard, and define measures to reduce their magnitude and to prevent or mitigate their impacts. The PAI can be regarded as part of the broader river basin management plan envisaged by the Water Framework Directive (WFD) [32], and its responsibility lies with ad hoc established competent authorities. Accordingly, Italy has been divided into eight river basin districts [33,34], each having its own competent authority.
One of such seven districts coincides with Sardinia, an Italian island around 24,000 km2 in size and the second-largest island in the Mediterranean Sea Basin. Sardinia is further divided into seven subdistricts [35], one of which, the so-called “Coghinas-Mannu-Temo” subdistrict (hereafter, CMT), is the area chosen for this study (Figure 1).
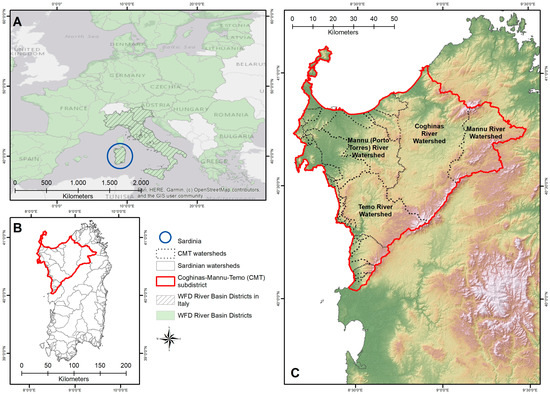
Figure 1.
The eight WFD river basin districts in Italy (panel A), Sardinian watersheds (panel B), and the Coghinas-Mannu-Temo subdistrict with its watersheds (panel C).
The reasons for choosing the Sardinian CMT subdistrict for this study are twofold. First, Sardinia is included in the CORINE Land Cover (CLC) inventory coordinated by the European Environment Agency under the Copernicus program of the EU; this makes it possible to retrieve a regularly updated series of land cover maps, of which the most recent one refers to the year 2018 [36]. Second, a comprehensive and detailed spatial assessment of landslide hazard and risk concerning the whole CMT was carried out and officially validated in 2014 [37] and it is publicly available from the regional geoportal.
Located to the north-west of Sardinia, with an area of 5575.5 km2, CMT stretches over more than one-fifth of the island and it comprises around forty watersheds, of which the largest and most important ones are the four ones from which its name originates, i.e., Coghinas River, Mannu River, Mannu River in Porto Torres, and Temo River (Figure 1, panel C). The prevailing morphology is hilly, heavily marked in the southern border by the Marghine-Goceano mountain chain and by the Mount Limbara rocky granitic massif to the east, with the exception of the Nurra coastal plain to the north-west and the smaller plains around the mouths of the rivers Coghinas and Temo (Figure 2, panel A). As in all of Sardinia, in CMT the climate is typically Mediterranean, mostly lower meso-Mediterranean, but with coastal areas included within the upper thermo-Mediterranean zone and mountain chains in the upper meso-Mediterranean [38] (Figure 2, panel B). As for vegetation, according to the study by Bacchetta et al. [39], more than 41% of the CMT host species belong to the Sardinian thermo-meso-Mediterranean cork tree series, while the Sardinian oak tree series and holm oak tree series occupy around 11% of the CMT each and the other vegetation series take lower percentages (Figure 2, panel C). Geological instability is diffuse in the study area, where landslide events have been recorded for decades: the Italian landslide inventory (IFFI [40,41]) has documented 398 landslide events occurring up to 2007 in the CMT. The most prominent category is that of diffuse falls or topples (228 events), followed by simple falls or topples (95 events); third comes diffuse superficial instability (42 events), followed by rotational or translational slides (16 events). Very small numbers concern the other categories; due to the geological and geo-lithological characteristics of the study area, no flow events have been reported in the study area (Figure 2, panel D).
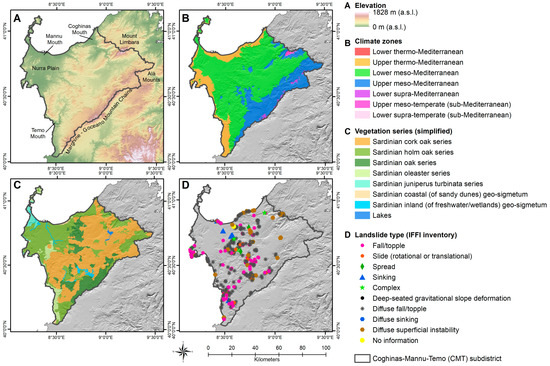
Figure 2.
Some features of the Coghinas-Mannu-Temo subdistrict: elevation (panel A); climate zones (panel B, based on [38]); simplified vegetation series (panel C, based on [39]); documented landslides events (panel D, based on data from the IFFI project [40]).
2.2. Regression Model
The relation between landslide hazard (LH) and the size of land taken up (L_TAKE) is assessed through a linear regression model that uses the LEAC land cover groups as explanatory variables, whose detailed definitions are given in Section 2.3. The covariate representing land take is one of the LEAC groups, namely the variable associated with the artificialized land LEAC group. Dependent and explanatory variables refer to the elements of a 300 m square grid that overlays the study area, and are measured as their percentage share of a grid cell. The model operationalizes as follows:
where the dependent variable and covariates are identified as shown below:
LH = α0 + α1L_TAKE + α2ARA + α3PMF + α4FOR + α5GRSH + α6DEPOQ + α7VOLSE + α8ELEV + α9HGLAGGED,
- LH is for landslide hazard;
- L_TAKE is for artificialized land or land take;
- ARA is for arable land;
- PMF is for pastures and mosaic farmland;
- FOR is for standing forests;
- GRSH is for natural grasslands, sclerophyllous vegetation, and heathlands;
- DEPOQ is for ground substrate characterized by quaternary deposits;
- VOLSE is for ground substrate characterized by volcanic sedimentary rocks;
- ELEV is for the average elevation of a grid element;
- HGLAGGED is the spatially lagged dependent variable that controls for spatial autocorrelation of LH.
The estimates of the coefficients of the multiple linear regression show the correlations between landslide hazard and the land covers of the LEAC taxonomy and, in particular, the interdependence of LH and the size of land take.
The use of a multiple linear regression is motivated by the fact that prior assumptions are not available as regards the functional form of the relations between dependent and explanatory variables, which is consistent with several studies aimed at identifying the interdependence between spatial variables [42,43,44,45]. From this point of view, a spatial phenomenon, related to n variables, represented by a surface in an n-dimensional space whose equation is unknown, can be approximately detected, in each of its points, by the tangent hyperplane. The linear equation estimated through the regression model, which relates dependent and explanatory variables, identifies the tangent hyperplane in a small neighborhood of a point of the surface, and in such neighborhood it represents an approximation of the unknown equation of the surface [46,47]. As a consequence, model (1) represents the trace of a hyperplane on a surface in a ten-dimensional space, which reports the correlations between LH and the nine covariates listed above.
The covariates DEPOQ and VOLSE control for the ground substrate, by considering if, and to what extent, landslide hazard is influenced by the conditions of the substrate, which in the study area is mainly featured by cohesive and compact rocks such as volcanic sedimentary successions (VOLSE) and, secondly, by deposits from the quaternary era (DEPOQ), i.e., loose incoherent materials. ELEV controls for the altitude impact on landslide hazard. If the estimates of their coefficients in (1) are significant, this will entail that substrate and elevation are likely to influence LH, at least to some extent. The magnitude of the coefficients will show the size of the impacts, in terms of increase or decrease in the landslide hazard measure.
The sign of ELEV is expected to be negative, since in the study area, on average, landslide hazard conditions are more frequent in lowlands rather than in mountainous locations, as further discussed in Section 3.3, whereas the expected signs of DEPOQ and VOLSE are positive and negative, respectively, since it is intuitively likely that LH will increase as long as the substrate incoherence and looseness increases, and the other way around.
The variable HGLAGGED represents the spatially lagged values of LH, and controls for spatial autocorrelation of the dependent variable in model (1). The HGLAGGED definition is based on the methodology implemented by Zoppi and Lai [48], which builds on Anselin’s studies [49,50].
Moreover, a p-value test is used to check the level of significance of the estimates of the coefficients of model (1).
2.3. Input Data for the Regression Model
The dependent variable and covariates needed to feed into the regression model (1) were calculated with reference to a 300 m vector square grid that covers all of the CMT subdistrict (Figure 3) and comprises a total of 62,231 cells, using three main input spatial datasets listed in Table 1.
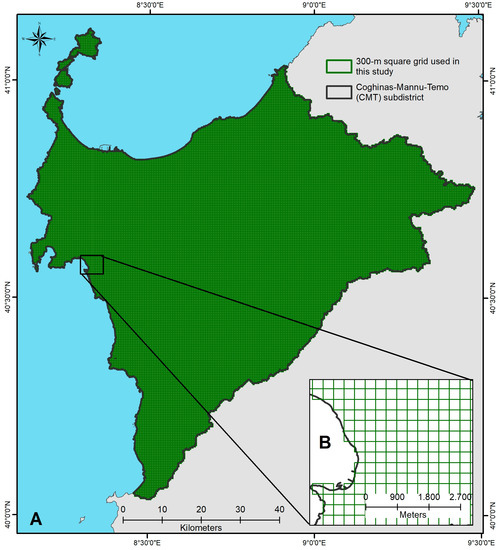
Figure 3.
The 300 m vector square grid used in this study: extent of the grid with reference to the Coghinas-Mannu-Temo subdistrict (panel A, no. of cells: 62,231), and detail (panel B).

Table 1.
Input datasets used to compute dependent and explanatory variables.
2.3.1. Landslide Hazard
In compliance with national law no. 183/1989, in Italy each competent authority for a WFD river basin district must approve, as part of the comprehensive river basin management plan, its PAI, which only focuses on landslide and flood risks in the district. The PAI has a dual character: on the one hand, it is a knowledge-oriented and regularly updated tool, which provides for the spatially explicit assessment of flood and landslide risks and hazards, as well as of exposures, hence vulnerable infrastructure, buildings, and land. On the other hand, it is a legally binding plan, which contains provisions that restrict land uses and land transformations in areas prone to landslide or flood hazard: the higher the hazard level, the stricter the restrictions.
The Sardinian Basin Competent Authority approved a first version of its PAI in 2004; since then, the assessment of the hazard level has continuously been updated to integrate new studies in previously non-analyzed areas, or to revise locally the hazard level when a new infrastructure that mitigates natural risks is realized. Accordingly, the landslide hazard map has been revised 42 times so far, and the flood hazard map 59 times.
Landslide hazard levels in the study area were assessed in a study commissioned by the Sardinian Basin Competent Authority in 2011, whose documents are publicly available on the institutional website [37]. The outcomes of the study were approved in 2014 and, as far as the spatially explicit assessment is concerned, integrated within the 36th updated revision of regional PAI spatial dataset available from the regional geoportal.
As per the methodology used in the PAI, landslide hazard (HL) classes range in the 0–4 interval, as follows: no hazard: HL = 0; moderate hazard: HL = 1; medium hazard: HL = 2; high hazard: HL = 3; very high hazard: HL = 4. For each cell in the 300 m square grid shown in Figure 3, the independent variable LH in model (1) was calculated as the percentage of the cell’s area having non-null landslide hazard (HL ≠ 0) in the vector data retrieved from the geoportal.
Moreover, LH’s spatially lagged variable (HGLAGGED), included in model (1) as a covariate, was calculated using GeoDA (version 1.20) [51], developed by Dr Luc Anselin and his team, based initially at the University of Illinois at Urbana-Champaign and currently at the Center for Spatial Data Science, University of Chicago, United States of America.
2.3.2. LEAC Land Cover Groups
The CORINE (acronym for “Coordination of Information on the Environment”) land cover is one of the several spatial datasets made available by the EU through the Copernicus Land Monitoring Services, covering a total of 39 countries, i.e., both members of the European Environment Agency and cooperating countries, and regularly updated every six years using a standardized nomenclature, hence allowing for consistent classifications and measures across time and space, and enabling time-series analyses.
In this study the 2018 CORINE Land Cover vector map (CLC2018) was used. The map provides information on land covers, i.e., on the biophysical characteristics of the Earth’s surface, through a hierarchical classification that comprises 44 classes at the third (and lower) level, 17 at the second level, five at the first level, with a minimum mapping unit equaling 25 hectares.
The CLC2018 was next reclassified so as to group the third-level land cover classes following the taxonomy used by the European Environment Agency for land cover accounts [52] and comprising eight groups. Information on how the reclassification was performed is provided in Table 2, whose last column lists the CLC classes that were assembled within a single LEAC group. For the purpose of this study, only five groups out of the eight listed in Table 2 were mapped because three (open space with little or no vegetation; transitional woodland and shrub; wetlands, water bodies and marine waters) are not relevant within CMT. Furthermore, the latter group was not relevant with respect to the aim of this study: indeed, the absence of any relationships between marine or inland waters and landslide hazards is quite straightforward. CLC classes listed in Table 2 that only contain one digit (for instance, “1.”) refer to first-level land covers and comprise all of the second- and third-level land covers that detail the first-level one (for instance, 1.1.1, 1.2.1, and so on); likewise, classes containing two digits (for instance, “2.2.”) refer to second-level land covers and comprise all of the third-level land covers that detail the second-level one (for instance, 2.2.1, 2.2.2, and so on). For instance, the “standing forests” group includes all of the sub-levels of the 3.1 class, which, in the study area, comprise three third-level land cover classes as follows: 3.1.1 (broad-leaved forests), 3.1.2 (coniferous forests), and 3.1.3 (mixed forests). More specific information on wood types and management can be found in another, and older, land use/land cover map produced in 2008 by the regional administration of Sardinia [53], which further details the CLC taxonomy up to the fifth level. According to this dataset, approximately 28% of the surface covered by the LEAC “standing forest” group in the study area was managed in 2009. Managed forests were almost completely made up of cork oak woods (27%), while negligible percentages concerned other types of managed woods, either broad-leaved (for instance, eucalyptus woods) or coniferous (for instance, pine woods, especially in coastal areas). While many cork oak woods are still managed for production purposes, especially in North-Eastern Sardinia [54], eucalypti and pine trees (both non-native species in the island) were planted mainly for swamp reclamation, slope stability, and erosion control in coastal dunes in the XX century; as of today, they are often unmanaged, to the extent that some have undergone a renaturalization process and have evolved into mixed forests, as a result of successional processes [55] and native species’ regaining their spaces.
Table 2.
LEAC groups and corresponding CLC classes.
Once a vector map of the LEAC groups was retrieved, for each cell in the 300 m square grid shown in Figure 3, the explanatory variables L_TAKE, ARA, PMF, FOR, and GRSH, in model (1) were calculated as the percentage of the cell occupied by LEAC groups listed in Table 2, respectively, as nos. 1, 2, 3, 4, and 6.
2.3.3. Geological Characteristics and Elevation (Control Data)
A 1:25,000 regional geological map of Sardinia was produced at the beginning of the year 2000 building upon geological data collected by the former regional agency for mines and quarries. The spatial dataset, available from the regional geoportal [56], identifies geological characters in compliance with the “CARG” national mapping program initiated in the 1980s by the Italian Geological Society. The taxonomy of the Sardinian geological map is hierarchically structured into five main classes and five levels ([57], pp. 49–108), and a simple reclassification was carried out in this study, whereby i., first-level classes only were considered and, ii., three main groups were retrieved by merging first-level classes. The three groups are as follows: i., quaternary deposits (also comprising lakes); ii., volcanic sedimentary successions; iii., intrusive complexes and metamorphic basements. Finally, for each cell in the 300 m square grid shown in Figure 3, the explanatory variables DEPOQ and VOLSE were calculated as the shares of the cell occupied, respectively, by quaternary deposits and by volcanic sedimentary successions. For any terrestrial cell in the grid, the share occupied by the third group is, fairly obviously, the difference between 100 and the sum of DEPOQ and VOLSE.
Elevation was retrieved from the 10 m resolution digital terrain model (DTM) available “off the shelf” from the regional geoportal [58]. The Sardinian DTM was produced in the early 2010s, based on elevation points and contour lines contained in the 1:10,000 regional technical map (CTR, acronym for the Italian “Carta Tecnica Regionale”). Because the production process was implemented in compliance with the national guidelines issued in 2009 [59], horizontal and vertical accuracy, though not explicitly stated in the DTM metadata, are as follows: horizontal tolerance: 2 m; vertical tolerance in open fields: 2 m; vertical tolerance in densely wooded areas (i.e., in areas where tree canopy cover is over 70% of the surface): ½ of the mean height of the trees. Next, for each cell in the 300 m square grid shown in Figure 3, the explanatory variable ELEV in model (1) was calculated as the average elevation in the cell.
3. Results
This section is organized as follows. The first and second subsections show the spatial framework of, respectively, landslide hazard and the LEAC groups across the study area. The following subsection presents the outcomes of the estimate of regression model (1) implemented into the spatial context identified in Section 2.2.
3.1. Landslide Hazard in the Study Area
As Table 3 and Figure 4, panel A, show, in the vast majority of CMT (i.e., 4476.42 km2, or 80.29% of the CMT land mass) the hazard level was assessed as null by the PAI, while around a fifth of the subdistrict is prone to landslides, mostly of medium (580.01 km2, or 10.40% of the CMT surface) or high severity (371.84 km2, or 6.67%); a very small share of the CMT features moderate landslide hazard (107.15 km2, or 1.92%) and a negligible one is characterized by very high hazard levels (39.80 km2, i.e., 0.71%). As for the 300 m grid, LH is greater than zero in 30,775 out of the total 62,231 300 m grid cells (Figure 4, panel B); hence, in nearly half of the cells, landslide hazard, of whichever level, affects a certain share of the cell.
Table 3.
Landslide hazard levels in the Coghinas-Mannu-Temo (CMT) subdistrict.
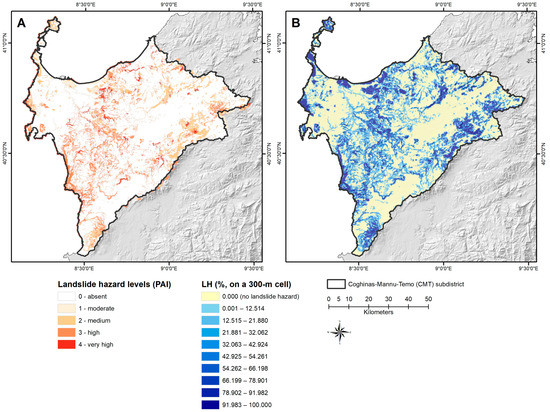
Figure 4.
Landslide hazard levels as assessed by the regional PAI in the Coghinas-Mannu-Temo subdistrict (panel A), and spatial distribution of the LH variable in the 300 m grid used in this study (panel B).
3.2. The Spatial Framework of the LEAC Groups
Three LEAC groups prevail in the CMT subdistrict, as shown in Table 4 and Figure 5, panel A: arable land and permanent crops (32.09%); pastures and mosaic farmland (26.68%); natural grasslands, sclerophyllous vegetation and heathlands (23.19%). Together, they make up 81.96% of the study area. Next come standing forests (14.98%), while artificialized land amounts to 2.37% of the study area, and a negligible share (0.69%) is that of waters, which are not listed in Table 4 because they were not relevant for this study.
Table 4.
LEAC groups as share of the Coghinas-Mannu-Temo subdistrict.
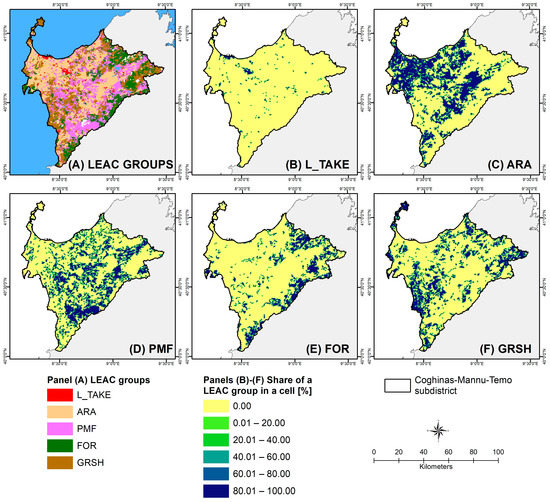
Figure 5.
Spatial distribution of land covers in CMT classed through the LEAC groups (panel A), and share of each LEAC group within the 300 m grid used in this study (panels B–F).
Panels B-F in Figure 5 show the spatial layout of the share of each LEAC group in the 300 m grid cells used within this study. Cells having non-null values of L_TAKE form small and spatially disarticulated bundles. Cells where a share of arable land and permanent crops (ARA) is present cluster especially along the main plains; however, they are spread across the subdistrict, except for the Asinara Island to the north and the mountain areas that delineate the borders of the watersheds. In the latter, clusters of cells hosting standing forests (FOR) are clearly visible in the map, while the Asinara Island is a hotspot for natural grasslands, sclerophyllous vegetation, and heathlands (GRSH), which also feature along the rugged western coast and are scattered across CMT. Finally, cells hosting pasture and mosaic farmland (PMF) are diffuse across the subdistrict, with the larger assemblage along the Marghine mountain chain to the southern border.
3.3. The Outcomes of the Regression Model
The strength and significance of correlations between the explanatory variables in model (1) were preliminarily assessed through the Pearson product–moment correlation coefficient; the outcomes of this assessment, which was carried out on the attribute table of the shapefile containing the 30,775 cells having non-null values of LH, are provided in Appendix A, Table A1. The strongest correlation is that between PMF and GRSH (−0.4033, p < 0.01), while |r| < 0.4 for the remaining couples of variables. The lack of strong correlations between the explanatory variables highlights the absence of issues of multicollinearity in model (1).
The estimates of the coefficients of DEPOL and VOLSE are significant and show the expected signs, since comparatively higher values of LH are associated with the incoherent and loose substrates that characterize quaternary deposits, and comparatively lower LH values are correlated with the solid and resistant substrates that feature volcanic sedimentary rocks.
Moreover, lower altitudes are associated with higher landslide hazard, and a decrease of 100 m is correlated with an increase of 1.8% in landslide hazard. This outcome may seem rather counterintuitive, since, in general, it is expected that landslide hazard increases with elevation, or the higher the altitude, the higher the probability that landslides may occur. The reason of this finding can be detected from the peculiar spatial taxonomy of landslide hazard in the study area, mapped in Figure 6, which shows the most relevant concentration of high-landslide-hazard cells in locations characterized by comparatively low and medium elevation.
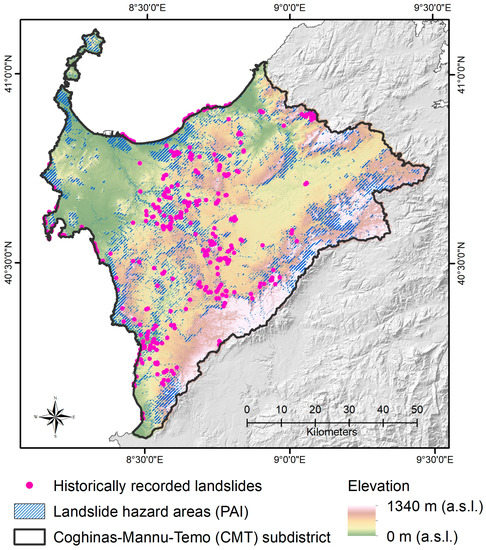
Figure 6.
Spatial overlay between historically recorded landslides, landslide hazard areas mapped in the PAI, and regional DTM.
Moreover, the spatially lagged variable shows a positive and significant sign, in terms of p-values, which shows an effective control of the spatial autocorrelation of the dependent variable.
That being so, since the estimates related to the control variables DEPOL, VOLSE, and ELEV are statistically significant and consistent with the expectations in terms of the expected signs, whereas the model offers an adequate control for spatial autocorrelation, the impacts of the LEAC covariates and, in particular, the influence of the land take variable on landslide hazard, identified by their estimated coefficients, are reliable and consequential.
The estimated coefficients of the five explanatory variables are significant at 1% and entail the following results, provided that everything else is equal.
Agricultural land, whether characterized by extensive or intensive production, is negatively associated with landslide hazard, showing comparatively low correlations, since, on average, a 10% increase in pastures and mosaic farmland or in arable land corresponds to a 0.7% decrease or to a 1% decrease in landslide hazard.
Positive correlations are shown by the coefficient of FOR, since 10% increases in FOR and GRSH are associated with 1.4% and 0.9% increases in LH, respectively. Increases in forests, natural grasslands, sclerophyllous vegetation, and heathlands are associated with higher values of LH, which entails that such land covers are likely to identify buffer zones with respect to areas characterized by relevant landslide hazard. The spatial contexts featured by these land covers are usually almost totally devoid of human settlements, which highlights a virtuous spatial organization, which aims at protecting urbanized areas from the negative impacts generated by landslides, by preserving natural forests and grasslands from land-taking processes.
All in all, crop production is not associated with increases in LH. On the other hand, forests are the LEAC group that reveals the most relevant positive correlation with landslide hazard, whereas natural grasslands, sclerophyllous vegetation, and heathlands are less relevant in terms of association with LH.
Finally, the regression model identifies the association of LH and L_TAKE as a relevant positive correlation; namely, a 10% increase in L_TAKE is associated with a 0.8% increase in LH. In other words, the higher the size of the land take-related covariate, the higher the size of areas characterized by relevant landslide hazard. This finding highlights that the spatial structure of the study area is characterized by artificialized areas intertwined with areas featured by relevant landslide hazard, or that land-taking processes have taken place in locations that should have been preserved free from urbanization processes due to the magnitude of landslide hazard. Table 5 reports the results of the estimate and relevant statistics of regression model (1).
Table 5.
Estimate of regression model (1).
4. Discussion
The mapping of landslide hazard in the study area is quite consistent with the taxonomies of similar spatial contexts described and discussed in the current literature. As described in Section 2, the CMT subdistrict features a hilly ground orography (the Marghine-Goceano Chain and the Mount Limbara), with widespread uphill and downhill stretches, and by a limited coastal plain (the Nurra). As described in Section 3.1, just about one-fifth of the study area is characterized by a more-or-less relevant landslide hazard which, nevertheless, has generated a relevant geological instability, demonstrated by nearly 400 events. Hilly spatial contexts intertwined with plain areas are often associated with limited zones characterized by relevant landslide hazard and by diffused geological instability, as demonstrated by the regional screening of landslide phenomena in the lowlands of Calabria, Southern Italy [60]. The European screening study by Jaedicke et al. [61] identifies the European hotspots concerning landslide hazard, based on the implementation of the models defined by the International Center for Geohazards (ICG) and the Joint Research Center of the European Commission (JRC), which are often located in hilly and plain areas, i.e., with morphological characteristics similar to the CTM subdistrict, sometimes featured by high levels of precipitation and seismic activity. The European screening is quite consistent with what was detected in the case of the landslide inventory implemented by Solís-Castillo et al. [62] as regards the Mexican tropical region of Sierra Costa, characterized by low precipitation rates and landslide hazard diffused over mountainous and plain zones. Analogous findings are shown, among many, in recent studies concerning the Freetown region in Sierra Leone [63], and the Whitsunday Region, located in North Queensland, Australia [64].
The mapping of the LEAC groups in the study area, featuring pastures and mosaic farmland, natural grasslands, sclerophyllous vegetation and heathlands, and arable land, is consistent with the spatial taxonomies reported in other studies concerning landslide hazard in hilly spatial contexts intertwined with plain areas. As in the case of the CTM subdistrict, important relations are identified between landslide hazard and farming production in hilly and plain zones by Rendon et al. [65], which are addressed by several policy tools, aimed at improving the quality of degraded ground and agrosystems, such as the Common agricultural policy [66], the strategy “Farm to Fork” [67] and the Biodiversity Strategy of the EU [68]. According to Borrelli et al. [69] and Panagos et al. [70], landslide hazard and related events in hilly spatial contexts intertwined with plain areas are mainly related to soil erosion phenomena, which should be addressed by increasing soil retention capacity [60], and the endowment of ecosystem services such as ground and superficial water resources quality and recharge, ground and underground biodiversity, and soil resilience to the impacts of climate change and of landslide events [71].
The outcomes of the regression model can be straightforwardly discussed in the theoretical and technical context of the current literature.
Negative correlations are associated with agricultural land, whether it is characterized by intensive or extensive crop farming. This is consistent with the results of several studies which relate the effectiveness of soil conservation practices based on agriculture. For example, Suci et al. [72] highlight the importance of crop farming and crop rotation in improving soil conservation conditions and landslide hazard mitigation in the rural area planning in the Indonesian Cidadap Subdistrict located in Western Java. Extensive and, wherever it is suitable, intensive crop farming are identified as effective approaches to recovering from scars generated by landslide-related events in Mount Elgon, Uganda [73], where such practices are implemented through the direct cooperation of local communities. The extensive mapping of rural areas’ exposure to landslide hazard in Central Italy developed by Santangelo et al. [74] shows the association of extensive and intensive crop farming to low-hazard areas as well.
The mapping of the quoted study by Santangelo et al. is consistent with the regression outcomes related to the covariates that identify forests (FOR), and natural grasslands, sclerophyllous vegetation, and heathlands (GRSH). Since the latter two LEAC groups characterize non-urbanized areas, it has to be put in evidence that a virtuous approach to land use planning brings together Central Italy and the Sardinian CMT subdistrict, since areas with relevant landslide hazards have been kept almost totally settlement-free.
The outcomes related to the DEPOQ covariate are consistent with the studies by Sasaky and Sugai concerning the Hachimantai region located in Northeastern Japan [75], and by Akumu et al. [76], where significant landslide hazard is correlated to inland wetlands, whereas coastal wetlands are associated with low LH, which brings together the CMT and the Central Italy coastal wetlands, as characterized by Santangelo et al. [74].
As for forests, woodlands, and shrubs, not only do they almost totally feature the non-urbanized areas of the CMT district, but also they act as spatial contexts whose management is crucial to implement planning policies aimed at decreasing the environmental risk associated with landslide hazard. The association of these LEAC groups with areas characterized by landslide hazard is consistent with their environmental protection function. This issue is widely addressed in the current literature. The enhancement and strengthening of forests and woodlands is basically related to the protection of primary forests, to forest recovery activities, to sustainable management of forests and woodlands, and to tree planting in spatial contexts characterized by different prevailing ecosystems, such as urban and agricultural areas, where these LEAC groups play a decisive role in mitigating the impact of landslide hazard [77]. FAO identifies forest sustainable management as the most important operational category to enhance economic, social, and environmental quality of rural areas, mainly because of its impact on improvement of crop production and productivity connected to protection from flood and landslide effects [78]. Forest and woodlands’ recovery and new arboreal plantations are particularly relevant for the definition and implementation of spatial planning policies since the assessment of their economic impact in terms of mitigation and adaptation to climate change is generally recognized as particularly effective in the medium and long runs, especially due to decrease in flood and landslide risk [79,80], as well as for biodiversity protection and enhancement [81,82,83].
Finally, the regression model shows that landslide hazard is associated with land take in significant and quantitatively relevant terms in the CMT subdistrict. This finding is supported by the fact that the other results of the regression are consistent with the outcomes of several studies available in the current literature, which implies that the definition and implementation of spatial planning policies aimed at addressing landslide hazard in the study area are almost entirely an issue of countering the ongoing land-taking processes and of deurbanizing at least a part of the areas located in landslide-prone zones. This is a key issue in the current scientific and technical debate (among many, [84,85,86,87]), and it is widely discussed in the fifth section.
5. Policy Implications
The results show a positive correlation between coefficient of FOR and landslide hazard due to virtuous spatial organization aimed at protecting urbanized areas and at preserving natural forests and grassland from land-taking processes. Forests have positive effects on reducing impacts of landslide. In shallow soils, deep-rooted trees and shrubs may reduce the occurrence of rapid landslide [88] by anchoring and stabilizing superficial soil layer to more sound substrates [89]. Moreover, trees may represent a physical barrier to contrast rocks and debris falls [90]. Therefore, spatial planning policies concerning forest and woodland recovery and plantations of deep-rooted trees and shrubs are particularly significant in order to decrease landslide hazard. From this perspective, two main policy implications can be identified as follows. First, forest management should consider the potential of forests and woodlands for landslide protection by restoring and protecting natural forests [91] and by maintaining forest cover. Health and vitality of forests are two key factors to reduce landslide hazard by strengthening rooting systems of tree in relation to climate change [89]. Secondly, spatial planning should localize forest in high-risk areas in order to support a virtuous spatial organization that locates human settlements and activities in zones characterized by low levels of landslide hazard [89].
The most prominent result is, however, the significant positive correlation concerning L_TAKE; therefore, as far as land covers and their effects on landslide hazard are concerned, controlling land-taking processes is the main road to mitigating the hazard. On this premise, three main groups of policy implications, respectively concerning land densification, land recycling, and strategic environmental assessment, can be identified as follows.
At the international level, governments are using different measures to reduce land-taking processes, such as policy targets [3], financial or fiscal incentives, and environmental assessment of spatial plan and projects [92]. On the other hand, as shown in the introduction, land-taking processes are steadily increasing; therefore, further measures are necessary in order to achieve the EU goal of “no net land take by 2050”. According to the EU Soil Strategy for 2030, Member States should integrate the actions defined in the “land take hierarchy”; that is, avoid, reuse, minimize, and compensate, into urban greening plans, and promote the reuse and the recycling of land and high-quality urban soil [3]. In particular, land recycling is defined as “the reuse of abandoned, vacant or underused land for redevelopment. It includes ‘grey recycling’ and ‘green recycling’. Grey recycling is when ‘grey’ urban objects, such as buildings or transport infrastructures, are built under redevelopment. Green recycling is when ‘green’ urban objects, such as green urban areas or sport facilities, are built” [93]. Moreover, land recycling includes three components: gray land recycling, green land recycling, and land densification.
As for land densification, it implies that land is developed within existing settlements so as to take advantage of existing infrastructure without using undeveloped land [93]. Therefore, national and regional administrations should promote land recycling strategies within regional plans, to be further downscaled at the local level through municipal masterplans where new development should be allowed only if its impacts on land take are negligible. Moreover, regional strategies should promote a compact urban model based on the land densification concept to reduce demand for undeveloped areas. However, this should not be regarded as a “one size fits all” solution, as local specificities need to be taken into account. Indeed, such measures have been found to be particularly effective in developed countries, whereas in Latin America and Sub-Saharan Africa, as well as in already hyper-dense Asian megacities, further urban densification can bring about negative effects in terms of inequality of spatial distribution and social conditions of the local communities [94].
With regard to land recycling, this is mainly supported through financial and regulatory tools. Concerning the former, financial support through publicly funded programs [95] and subsidies generated through impact fees, soil sealing fees, or improvement levies [96] are among the most common tools to promote land recycling. However, national and regional governments should diversify the set of fiscal tools that usher in creative and innovative ways to manage land uses effectively and efficiently. For example, the transfer of development rights can be used to direct development towards already taken up and well-serviced areas, rather than towards greenfield areas that are poorly connected in terms of transport, infrastructures, facilities, and services. As for regulatory tools, such as zoning schemes and land use regulations, these could successfully promote the participation of the private sector within land recycling projects. Furthermore, flexible and performance-based zoning regulations could be adopted within municipal masterplans [97]: these should pursue strict limits and constraints on land take, while allowing land uses that do not result in artificial land, hence in turn promoting mixed land uses where different functions coexist. However, because in Italy land use plans are drafted and approved by local municipalities independently of each other, monitoring and evaluating the provisions of existing municipal land use plans is necessary in order to understand the cumulative effects of land use regulations in adjacent cities and towns, and their consequences on land-taking processes. In this regard, in Sardinia, the regional administration can play a key role, since the regional planning office actively participates in the approval processes of regional and local plans with a view to ensuring their compliance with both regional planning laws and the regional landscape plan [98]. Due to the complexity of interests at stake, measures concerning land-take prevention and limitation, be they finance-based or regulation-based, call for active involvement of local communities and municipalities [99], and for effective vertical and horizontal cooperation between governments and other public bodies [100].
A third important policy implication concerns strategic environmental assessment (SEA), an appraisal planning tool that is mandatory in EU countries, which ensures that environmental considerations and sustainable-oriented goals are integrated into plan-making processes by assessing their likely effects on the environment, by considering reasonable and more sustainable alternatives, and by taking into account the mutual relations between the environment and the economic and social sectors [100,101]. Through the comparison of alternative land uses, the identification of areas that are more suitable for certain uses, and the evaluation of cumulative, direct, and indirect impacts of land-based investments, SEA can pave the way for the integration, within spatial plans, of measures aimed at preventing or minimizing land take.
In areas prone to landslide hazard (as well as in areas prone to flood hazard, which are not the object of this study), in Sardinia the PAI maps serve as a spatial reference for the PAI regulations, which restrict land uses and prevent land transformations depending on the magnitude of the hazard. In this way, the PAI provides a legally binding framework for municipal masterplans, whose zoning choices must comply with the PAI regulations, contrary to what has been reported in other countries [102], where new development in landslide hazard areas is not prohibited [103]. Hence, this higher-level regional planning tool contributes to limiting land-taking processes in fragile areas, while also providing relevant spatial information to planners in charge of drafting land use plans and appraising them through the SEA. Moreover, because the PAI maps are publicly available through the regional geoportal, they also contribute to raising local authorities’ and local communities’ awareness of landslide hazard and, by doing so, to granting transparency and legitimacy to restrictions that otherwise would be, in principle, quite conflictual.
6. Conclusions
In this study a novel methodological approach was proposed with a view to analyzing the relations between land-taking processes and landslide hazard in order to understand whether, and to what extent, land-take phenomena are associated with landslide hazard. The outcomes of this analysis were next used to define policy suggestions that, by preventing or minimizing land take, can help mitigating landslide hazard, therefore indirectly preventing the human and economic losses that might result from land mismanagement.
The methodological approach here proposed as a tool to support decision-making processes can be exported to other European contexts, since the CLC inventory is available for 39 European countries [36], among them the 27 EU Member States, provided that a detailed landslide hazard or landslide susceptibility spatial dataset is available, which is not the case for all of the EU Member States, as reported in a recent study by Mateos et al. [102].
Moreover, the methodological approach shows a certain degree of flexibility, allowing for the inclusion of further context-specific spatial or normative variables that might be appropriate or needed in other contexts. In our selected case study, the influence of two LEAC groups (open space with little or no vegetation; transitional woodland and shrub) on landslide hazard could not be assessed because they were not relevant in the study area, hence this might be a matter for future investigation in other contexts. In addition, the impact of specific land cover classes on landslide hazard was here not assessed due to the simplified classification of the LEAC taxonomy, where the 44 CORINE land covers are aggregated into eight groups. Future directions of the research might therefore include a more detailed analysis, where the LEAC groups are (completely or partly) replaced by the CLC classes, which might, however, result in a more complicated implementation of the model and interpretation of its results.
This study has analyzed the relations between land-taking processes and landslide hazards in a cross-section terms; therefore, dynamic issues, such as the evolution process of land covers or the development through time of different forms of urbanization are not within the scope of this work. However, these are relevant future directions related to the research work proposed in this article, which may entail the assessment of the dynamics of the relationship between landslide hazard and land-taking processes. This point is analyzed by Pisano et al. [30], who studied how land cover changes affect landslide hazard in relation to the years 1954, 1981, and 2007. The advantages in analyzing how land cover changes are correlated to landslide hazard are connected with the outstanding dynamicity that characterizes land cover change processes. Although different factors influence landslide hazard in the long run, such as geological and geomorphological phenomena, land covers are also characterized by short-term dynamics, which stresses the relevant added value which may be provided by a time-series-based contextualization of the cross-section assessment here implemented [104]. As regards the dynamic relationships between urbanization processes and landslide hazard, further important research directions are represented by the assessment of landslide phenomena in different cities and towns characterized by diversified urban morphologies, ranging from dense and compact urban fabrics to sparse and widespread urbanization, in order to define and implement planning policies and measures aimed at countering and mitigating landslide hazard.
Author Contributions
F.I., S.L, F.L. and C.Z. collaboratively designed this study. F.L. wrote Section 1. S.L. wrote Section 2.1, Section 2.3, Section 2.3.1, Section 2.3.2, Section 2.3.3, Section 3.1, Section 3.2 and Appendix A. C.Z. wrote Section 2.2, Section 3.3 and Section 4. F.I. and F.L. jointly wrote Section 5 and Section 6. All authors have read and agreed to the published version of the manuscript.
Funding
This study was carried out in the framework of the research project “Implementation and revision of the regional strategy for climate change adaptation (SRACC)—Macro-Action 2, Mainstreaming of the SRACC spatial framework: governance and environmental assessment” (2021–2023), funded by the Autonomous Region of Sardinia.
Institutional Review Board Statement
Ethical review and approval were not applicable, since this study does not involve humans or animals.
Informed Consent Statement
Not applicable.
Data Availability Statement
Data available upon request.
Conflicts of Interest
The authors declare no conflict of interest.
Appendix A
Table A1.
Correlations between the explanatory variables used in model (1): Pearson product–moment correlation coefficients and significance levels.
Table A1.
Correlations between the explanatory variables used in model (1): Pearson product–moment correlation coefficients and significance levels.
| L_TAKE | ARA | PMF | FOR | GRSH | DEPOQ | VOLSE | ELEV | HGLAGGED | |
|---|---|---|---|---|---|---|---|---|---|
| L_TAKE | −0.0541 | −0.0715 | −0.0798 | −0.1096 | 0.0614 | 0.0091 | −0.0893 | 0.0415 | |
| ARA | 0.0000 *** | −0.2600 | −0.2727 | −0.3633 | 0.2006 | 0.1491 | −0.3056 | −0.1751 | |
| PMF | 0.0000 *** | 0.0000 *** | −0.2750 | −0.4033 | 0.0118 | 0.1708 | −0.0034 | −0.1894 | |
| FOR | 0.0000 *** | 0.0000 *** | 0.0000 *** | −0.3118 | −0.0434 | −0.2723 | 0.3082 | 0.1759 | |
| GRSH | 0.0000 *** | 0.0000 *** | 0.0000 *** | 0.0000 *** | −0.1720 | −0.0159 | 0.0030 | 0.1699 | |
| DEPOQ | 0.0000 *** | 0.0000 *** | 0.0377 ** | 0.0000 *** | 0.0000 *** | −0.3042 | −0.2769 | 0.0186 | |
| VOLSE | (0.1085) | 0.0000 *** | 0.0000 *** | 0.0000 *** | 0.0052 *** | 0.0000 *** | −0.2143 | −0.2093 | |
| ELEV | 0.0000 *** | 0.0000 *** | (0.5523) | 0.0000 *** | (0.5982) | 0.0000 *** | 0.0000 *** | 0.0202 | |
| HGLAGGED | 0.0000 *** | 0.0000 *** | 0.0000 *** | 0.0000 *** | 0.0000 *** | 0.0011 *** | 0.0000 *** | 0.0004 *** |
Below the diagonal (italicized): p-values and significance levels: ***: p < 0.01; **: p < 0.05; *: p < 0.10; (): p > 0.10. n = 30,775; degrees of freedom = 30,773.
References
- European Environment Agency. The European Environment—State and Outlook 2020. Knowledge for Transition to a Sustainable Europe; Publications Office of the European Union: Luxembourg, 2019; ISBN 978-92-9480-090-9. Available online: https://op.europa.eu/en/publication-detail/-/publication/b312a176-1b69-11ea-8c1f-01aa75ed71a1/language-en (accessed on 17 January 2023).
- European Environment Agency. Land Take and Land Degradation in Functional Urban Areas, EEA Report n. 17/2021; Publications Office of the European Union: Luxembourg, 2021; ISBN 978-92-9480-465-5. Available online: https://www.eea.europa.eu/publications/land-take-and-land-degradation (accessed on 17 January 2023).
- European Commission. Communication from the Commission to the European Parliament, the Council, the European Economic and Social Committee and the Committee of the Regions. EU Soil Strategy for 2030, Reaping the Benefits of Healthy Soils for People, Food, Nature and Climate. 2021. Available online: https://eur-lex.europa.eu/legal-content/EN/TXT/?uri=CELEX%3A52021DC0699 (accessed on 17 January 2023).
- European Environment Agency. Indicator Assessment. Land Take in Europe. Available online: https://www.eea.europa.eu/data-and-maps/indicators/land-take-3/assessment (accessed on 17 January 2023).
- Munafò, M. (Ed.) Consumo di Suolo, Dinamiche Territoriali e Servizi Ecosistemici. Edizione 2022. Land-Take, Land Dynamics and Ecosystem Services. 2022 edition Report SNPA 32/22; 2022; ISBN 978-88-448-1124-2. Available online: https://www.snpambiente.it/wp-content/uploads/2022/07/Rapporto_consumo_di_suolo_2022.pdf (accessed on 17 January 2023).
- Gerten, C.; Fina, S.; Rusche, K. The sprawling planet: Simplifying the measurement of global urbanization trends. Front. Environ. Sci. 2019, 7, 140. [Google Scholar] [CrossRef]
- Seto, K.C.; Güneralp, B.; Hutyra, L.R. Global forecasts of urban expansion to 2030 and direct impacts on biodiversity and carbon pools. Proc. Natl. Acad. Sci. USA 2012, 109, 16083–16088. [Google Scholar] [CrossRef] [PubMed]
- Yuan, Y.J.; Chen, D.X.; Wu, S.H.; Mo, L.J.; Tong, G.J.; Yan, D.H. Urban sprawl decreases the value of ecosystem services and intensifies the supply scarcity of ecosystem services in China. Sci. Total Environ. 2019, 697, 134170. [Google Scholar] [CrossRef]
- Millennium Ecosystem Assessment. Ecosystems and Human Well-Being: Synthesis; Island Press: Washington, DC, USA, 2005; Available online: https://www.millenniumassessment.org/documents/document.356.aspx.pdf (accessed on 17 January 2023).
- Mooney, H.A.; Ehrlich, P.R. Ecosystem services: A fragmentary history. In Nature’s Services. Societal Dependence on Natural Ecosystems; Daily, G.C., Ed.; Island Press: Washington, DC, USA, 1997; pp. 11–19. [Google Scholar]
- Costanza, R. Ecosystem services: Multiple classification systems are needed. Biol. Conserv. 2008, 141, 350–352. [Google Scholar] [CrossRef]
- Holdren, J.P.; Ehrlich, P.R. Human Population and the Global Environment: Population Growth, Rising Per Capita Material Consumption, and Disruptive Technologies Have Made Civilization a Global Ecological Force. Am. Sci. 1974, 62, 282–292. Available online: http://www.jstor.org/stable/27844882 (accessed on 17 January 2023).
- Haines-Young, R.; Potschin, M.B. Common International Classification of Ecosystem Services (CICES) V5.1 and Guidance on the Application of the Revised Structure. 2018. Available online: https://cices.eu/content/uploads/sites/8/2018/01/Guidance-V51-01012018.pdf (accessed on 17 January 2023).
- Costanza, R.; d’Arge, R.; de Groot, R.; Farber, S.; Grasso, M.; Hannon, B.; Limburg, K.; Naeem, S.; Oneill, R.V.; Paruelo, J.; et al. The value of the world’s ecosystem services and natural capital. Nature 1997, 387, 253–260. [Google Scholar] [CrossRef]
- Isola, F.; Lai, S.; Leone, F.; Zoppi, C. Green Infrastructure and Regional Planning—An Operational Framework; FrancoAngeli: Milan, Italy, 2022; ISBN 9788835141402. [Google Scholar]
- Olschewski, R.; Bebi, P.; Teich, P.; Wissen Hayek, U.; Grêt-Regamey, A. Avalanche protection by forests—A choice experiment in the Swiss Alps. Forest Policy Econ. 2012, 17, 19–24. [Google Scholar] [CrossRef]
- Notaro, S.; Paletto, A. The economic valuation of natural hazards in mountain forests: An approach based on the replacement cost method. J. Forest Econ. 2012, 18, 318–328. [Google Scholar] [CrossRef]
- Cruden, D.M.; Varnes, D.J. Landslide types and processes. In Landslides: Investigation and Mitigation. Transportation Research Board Special Report 247; Turner, A.K., Schuster, R.L., Eds.; National Academy Press: Washington, DC, USA, 1996; pp. 36–75. [Google Scholar]
- Tanveer, I.; Jeffrey, R. Hazard Mitigation in Emergency Management; Butterworth-Heinemann: Oxford, UK, 2016; ISBN 978-0-12-420134-7. [Google Scholar]
- United State Geological Survey (USGS). Landslide Types and Processes. Fact Sheet 2004–3072. 2004. Available online: https://pubs.usgs.gov/fs/2004/3072/pdf/fs2004-3072.pdf (accessed on 17 January 2023).
- Huber, S.; Prokop, G.; Arrouays, D.; Banko, G.; Bispo, A.; Jones, R.J.A.; Kibblewhite, M.G.; Lexer, W.; Möller, A.; Rickson, R.J. (Eds.) Environmental Assessment of Soil for Monitoring. Volume I, Indicators & Criteria. EUR 23490 EN/1; Office for the Official Publications of the European Communities: Luxembourg, 2008; Available online: http://www.fsp-parrur.irenala.edu.mg/Data-FSP-PARRUR/Les%20activit%C3%A9s/IST/S%C3%A9minaires-Ecoles/Ecole%20th%C3%A9matique/ECOLE%20THEMATIQUE%20SOL_LRI-IRD/Ouvrages/Decline_in_Soil_Biodiversity.pdf (accessed on 17 January 2023).
- Meneses, B.M.; Pereira, S.; Reis, E. Effects of different land use and land cover data on the landslide susceptibility zonation of road networks. Nat. Hazards Earth Sys. 2019, 19, 471–487. [Google Scholar] [CrossRef]
- Hao, L.; van Westen, C.; Rajaneesh, A.; Sajinkumar, K.S.; Martha, T.R.; Jaiswal, P. Evaluating the relation between land use changes and the 2018 landslide disaster in Kerala, India. Catena 2022, 216, 106363. [Google Scholar] [CrossRef]
- Tasser, E.; Mader, M.; Tappeiner, U. Effects of land use in alpine grasslands on the probability of landslides. Basic Appl. Ecol. 2003, 4, 271–280. [Google Scholar] [CrossRef]
- Vuillez, C.; Tonini, M.; Sudmeier-Rieux, K.; Devkota, S.; Derron, M.H.; Jaboyedoff, M. Land use changes, landslides and roads in the Phewa Watershed, Western Nepal from 1979 to 2016. Appl. Geogr. 2018, 94, 30–40. [Google Scholar] [CrossRef]
- Wasowski, J.; Lamanna, C.; Casarano, D. Influence of land-use change and precipitation patterns on landslide activity in the Daunia Apennines, Italy. Q. J. Eng. Geol. Hydroge. 2010, 43, 387–401. [Google Scholar] [CrossRef]
- Reichenbach, P.; Busca, C.; Mondini, A.C.; Rossi, M. The influence of land use change on landslide susceptibility zonation: The Briga Catchment Test Site (Messina, Italy). Environ. Manag. 2014, 54, 1372–1384. [Google Scholar] [CrossRef] [PubMed]
- García-Ruiz, J.M. The effects of land uses on soil erosion in Spain: A review. Catena 2010, 81, 1–11. [Google Scholar] [CrossRef]
- Glade, T. Landslide occurrence as a response to land use change: A review of evidence from New Zealand. Catena 2003, 51, 297–314. [Google Scholar] [CrossRef]
- Pisano, L.; Zumpano, V.; Malek, Ž.; Rossokopf, C.M.; Parise, M. Variations in the susceptibility to landslides, as a consequence of land cover changes: A look to the past, and another towards the future. Sci. Total Environ. 2017, 601–602, 1147–1159. [Google Scholar] [CrossRef] [PubMed]
- Muñoz-Torrero Manchado, A.; Ballesteros-Cánovas, J.A.; Allen, S.; Stoffel, M. Deforestation controls landslide susceptibility in Far-Western Nepal. Catena 2022, 219, 106627. [Google Scholar] [CrossRef]
- European Parliament and European Council. Directive 2000/60/EC of the European Parliament and of the Council of 23 October 2000 Establishing a Framework for Community Action in the Field of Water Policy. Available online: https://eur-lex.europa.eu/legal-content/EN/TXT/?uri=celex%3A32000L0060 (accessed on 17 January 2023).
- Ministero dell’Ambiente e della Sicurezza Energetica. Autorità di Bacino. Ministry for the Environment and Energy Security. Competent Authorities for River Basin Districts. Available online: https://www.mite.gov.it/direttive/autorita-di-bacino (accessed on 17 January 2023).
- European Commission. Environment—Water—Italy. Available online: https://ec.europa.eu/environment/water/participation/map_mc/countries/italy_en.htm (accessed on 17 January 2023).
- Regione Autonoma della Sardegna, Assessorato Lavori Pubblici. Regional Administration of Sardinia, Office of Public Works. Piano Stralcio per l’Assetto Idrogeologico—Relazione Generale [Hydrogeological Setting Plan—General Report]. 2004. Available online: https://www.regione.sardegna.it/documenti/1_26_20060913170906.pdf (accessed on 17 January 2023).
- Copernicus Europe’s Eyes on Earth 2022. CORINE Land Cover. Available online: https://land.copernicus.eu/pan-european/corine-land-cover (accessed on 17 January 2023).
- Sardinian Basin Competent Authority. Studio di Dettaglio e Approfondimento del Quadro Conoscitivo della Pericolosità e del Rischio da Frana nel Sub Bacino n° 3 Coghinas–Mannu–Temo [Detailed Study of the Landslide Hazard and Risk in Sub-District no. 3 Coghinas-Mannu-Temo]. Available online: https://www.regione.sardegna.it/index.php?xsl=509&s=1&v=9&c=12097&tb=8374&st=13 (accessed on 17 January 2023).
- Canu, S.; Rosati, L.; Fiori, M.; Motroni, A.; Filigheddu, R.; Farris, E. Bioclimate map of Sardinia (Italy). J. Maps 2015, 11, 711–718. [Google Scholar] [CrossRef]
- Bacchetta, G.; Bagella, S.; Biondi, E.; Farris, E.; Filigheddu, R.; Mossa, L. Vegetazione Forestale e Serie di Vegetazione della Sardegna (con Rappresentazione Cartografica alla Scala 1:350.000). Forest Vegetation and Serial Vegetation of Sardinia (with a 1:350,000 Scale Map). Fitosociologia 2009, 46, 3–82. [Google Scholar]
- IFFI—Inventario dei Fenomeni Franosi in Italia. IFFI—Inventory of Landslides Events in Italy. Available online: https://www.progettoiffi.isprambiente.it (accessed on 17 January 2023).
- Cinus, S.; Demuru, S.; Deriu, M.; Farris, M.; Patteri, G.; Tilocca, G.; Martelli, R. Analisi del Dissesto da Frana in Sardegna. An Analysis of Landslide Phenomena in Sardinia. In Rapporto sulle Frane in Italia. APAT Rapporti no. 78/2007. Report on Landslides in Italy. APAT Reports no. 78/2007; Trigila, A., Ed.; APAT: Rome, Italy, 2007; pp. 651–681. Available online: https://www.isprambiente.gov.it/files/pubblicazioni/rapporti/rapporto-frane-2007/Capitolo_25_Sardegna.pdf (accessed on 17 January 2023).
- Cheshire, P.; Sheppard, S. On the price of land and the value of amenities. Econ. New Ser. 1995, 62, 247–267. [Google Scholar] [CrossRef]
- Stewart, P.A.; Libby, L.W. Determinants of farmland value: The case of DeKalb County, Illinois. Rev. Agr. Econ. 1998, 20, 80–95. [Google Scholar] [CrossRef]
- Sklenicka, P.; Molnarova, K.; Pixova, K.C.; Salek, M.E. Factors affecting farmlands in the Czech Republic. Land Use Policy 2013, 30, 130–136. [Google Scholar] [CrossRef]
- Zoppi, C.; Argiolas, M.; Lai, S. Factors influencing the value of houses: Estimates for the city of Cagliari, Italy. Land Use Policy 2015, 42, 367–380. [Google Scholar] [CrossRef]
- Byron, R.P.; Bera, A.K. Linearized estimation of nonlinear single equation functions. Int. Econ. Rev. 1983, 24, 237–248. [Google Scholar] [CrossRef]
- Wolman, A.L.; Couper, E.A. Potential consequences of linear approximation in economics. Econ. Q. 2003, 89, 51–67. [Google Scholar]
- Zoppi, C.; Lai, S. Land-taking processes: An interpretive study concerning an Italian region. Land Use Policy 2014, 36, 369–380. [Google Scholar] [CrossRef]
- Anselin, L. Spatial Econometrics: Methods and Models; Kluwer Academic Publishers: Dordrecht, The Netherlands, 1988. [Google Scholar]
- Anselin, L. Spatial Econometrics. In A Companion to Theoretical Econometrics. Spatial Econometrics; Baltagi, B.H., Ed.; Blackwell Publishing: Oxford, UK, 2003; pp. 310–330. [Google Scholar]
- Anselin, L.; Syabri, I.; Kho, Y. GeoDa: An introduction to spatial data analysis. Geogr. Anal. 2006, 38, 5–22. [Google Scholar] [CrossRef]
- European Environment Agency. Land Accounts for Europe 1990–2000: Towards Integrated Land and Ecosystem Accounting. European Environment Agency Report no. 11; Office for Official Publications of the European Communities: Luxembourg, 2006; Available online: http://www.eea.europa.eu/publications/eea_report_2006_11 (accessed on 17 January 2023).
- Regione Autonoma della Sardegna. Sardegna Geoportale. Carta dell’Uso del Suolo. Regional Administration of Sardinia. Sardinian Geoportal. Land Cover Map. Available online: https://www.sardegnageoportale.it/index.php?xsl=2420&s=40&v=9&c=14480&es=6603&na=1&n=100&esp=1&tb=14401 (accessed on 11 January 2022).
- Dettori, S.; Falqui, A.; Filigheddu, M.R.; Sedda, L. Performance di recenti imboschimenti con quercia da sughero in ex-coltivi. Growth performance of cork oak plantations recently established on farmlands in Sardinia, Italy. Forest 2006, 3, 327–338. [Google Scholar] [CrossRef]
- Bianchi, L.; Calamini, G.; Gregori, E.; Paci, M.; Pallanza, S.; Pierguidi, A.; Salbitano, F.; Tani, A.; Vedele, S. Valutazione degli effetti del rimboschimento in zone aride della Sardegna: Risultati preliminari sulla vegetazione. Evaluation of the effects of afforestation in Sardinian arid areas: Preliminary results on vegetation. L’Italia Forestale e Montana 2002, 4, 353–368. [Google Scholar]
- Regione Autonoma della Sardegna. Sardegna Geoportale. Carta Geologica di base della Sardegna in scala 1:25.000. 1:25,000 Geology Map of Sardinia. Available online: https://www.sardegnageoportale.it/index.php?xsl=2420&s=40&v=9&c=14479&es=6603&na=1&n=100&esp=1&tb=14401 (accessed on 11 January 2023).
- Regione Autonoma della Sardegna. Linee Guida per l’Adeguamento dei Piani Urbanistici Comunali al PPR e al PAI. Assetto ambientale. Bozza 2008. Guidelines for the Elaboration of Municipal Land-Use Plans Compliant with the Regional Landscape Plan and the Hydrogeological Setting Plan. Environmental Setting. 2008 Draft. Available online: https://www.sardegnaterritorio.it/documenti/6_83_20081007095546.zip (accessed on 11 January 2022).
- Regione Autonoma della Sardegna. Sardegna Geoportale. Modelli Digitali del Terreno e delle Superfici. Regional Administration of Sardinia. Sardinian Geoportal. Digital Terrain and Digital Surface Models. Available online: https://www.sardegnageoportale.it/areetematiche/modellidigitalidielevazione (accessed on 17 January 2023).
- Brovelli, M.; Crespi, M.; Cilloccu, F.; Dequal, S.; Lingua, A.M. Ortoimmagini 1:10000 e Modelli Altimetrici—Linee Guida; CISIS: Rome, Italy, 2009; 1:10,000 Orthoimages and Elevation Models—Guidelines; Available online: https://www.sardegnageoportale.it/index.php?xsl=2425&s=330919&v=2&c=14471&t=1&tb=14401 (accessed on 11 January 2022).
- Vennari, C.; Gariano, S.L.; Antronico, L.; Brunetti, M.T.; Iovine, G.; Peruccacci, S.; Terranova, O.; Guzzetti, F. Rainfall thresholds for shallow landslides occurrence in Calabria, Southern Italy. Nat. Hazards Earth Syst. Sci. Discuss. 2013, 1, 5141–5179. [Google Scholar] [CrossRef]
- Jaedicke, C.; Van Den Eeckhaut, M.; Nadim, F.; Hervás, J.; Kalsnes, B.; Vangelsten, B.V.; Smith, J.T.; Tofani, V.; Ciurean, R.; Winter, M.G.; et al. Identification of landslide hazard and risk ‘hotspots’ in Europe. Bull. Eng. Geol. Environ. 2014, 73, 325–339. [Google Scholar] [CrossRef]
- Solís-Castillo, B.; Mendoza, M.E.; Vázquez Castro, G.; Bocco, G. Landslide inventory map of the tropical dry Sierra Costa Region, Michoacán México. Phys. Geog. 2019, 40, 554–577. [Google Scholar] [CrossRef]
- Lahai, Y.A.; Anderson, K.F.E.; Jalloh, Y.; Rogers, I.; Kamara, M. A comparative geological, tectonic and geomorphological assessment of the Charlotte, Regent and Madina landslides, Western area, Sierra Leone. Geoenv. Dis. 2021, 8, 1–17. [Google Scholar] [CrossRef]
- Bradbury, T. Whitsunday Landslide Study—Landslide Susceptibility Investigation and Mapping; Cardno: Paget, Australia, 2019. Available online: https://www.whitsundayrc.qld.gov.au/downloads/file/367/08-whitsunday-landslide-study-2019 (accessed on 17 January 2023).
- Rendon, P.; Steinhoff-Knopp, B.; Burkhard, B. Linking ecosystem condition and ecosystem services: A methodological approach applied to European agroecosystems. Ecos. Serv. 2022, 53, 101387. [Google Scholar] [CrossRef]
- European Commission. The New Common Agricultural Policy: 2023–27. Available online: https://agriculture.ec.europa.eu/common-agricultural-policy/cap-overview/new-cap-2023-27_en#documents (accessed on 17 January 2023).
- European Commission. A Farm to Fork Strategy for a fair, healthy and environmentally-friendly food system. Communication from the Commission to the European Parliament, The Council, The European Economic and Social Committee and the Committee of the Regions (COM(2020) 381 Final). Available online: https://eur-lex.europa.eu/resource.html?uri=cellar:ea0f9f73-9ab2-11ea-9d2d-01aa75ed71a1.0001.02/DOC_1&format=PDF (accessed on 17 January 2023).
- European Commission. EU Biodiversity Strategy for 2030. Bringing Nature Back into Our Lives. Communication from the Commission to the European Parliament, the Council, the European Economic and Social Committee and the Committee of the Regions (COM(2020) 380 Final). Available online: https://eur-lex.europa.eu/resource.html?uri=cellar:a3c806a6-9ab3-11ea-9d2d-01aa75ed71a1.0001.02/DOC_1&format=PDF (accessed on 17 January 2023).
- Borrelli, P.; Robinson, D.A.; Panagos, P.; Lugatod, E.; Yang, J.E.; Alewella, C.; Wuepper, D.; Montanarella, L.; Ballabio, C. Land use and climate change impacts on global soil erosion by water (2015–2070). Proc. Natl. Sci. Acad. USA 2020, 117, 21994–22001. [Google Scholar] [CrossRef]
- Panagos, P.; Ballabio, C.; Himics, M.; Scarpa, S.; Matthews, F.; Bogonos, M.; Poesen, J.; Borrelli, P. Projections of soil loss by water erosion in Europe by 2050. Environ. Sci. Pol. 2021, 124, 380–392. [Google Scholar] [CrossRef]
- Lal, R. Soil conservation and ecosystem services. Int. Soil Water Conserv. Res. 2014, 2, 36–47. [Google Scholar] [CrossRef]
- Suchi, M.I.; Supriatna, S.; Rustanto, A. Vegetative conservation of landslide prone areas in the Cidadap Watershed Area, Sukabumi Regency. In The 4th Life and Environmental Sciences Academics Forum 2020: IOP Conference Series; Earth and Environmental Science; IOP Publishing: Bristol, UK, 2021; Volume 846, p. 012024. [Google Scholar] [CrossRef]
- Nakileza, B.R.; Majaliwa, M.J.; Wandera, A.; Nantumbwe, M.C. Enhancing resilience to landslide disaster risks through rehabilitation of slide scars by local communities in Mt Elgon, Uganda. J. Disaster Risk Stud. 2017, 9, 1–11. [Google Scholar] [CrossRef]
- Santangelo, M.; Marchesini, I.; Bucci, F.; Cardinali, M.; Cavalli, M.; Crema, S.; Marchi, L.; Alvioli, M.; Guzzetti, F. Exposure to landslides in rural areas in Central Italy. J. Maps 2021, 17, 124–132. [Google Scholar] [CrossRef]
- Sasaki, N.; Sugai, T. Distribution and development processes of wetlands on landslides in the Hachimantai volcanic group, NE Japan. Geogr. Rev. Jap. Ser. B 2015, 87, 103–114. [Google Scholar] [CrossRef]
- Akumu, C.E.; Henry, J.; Gala, T.; Dennis, S.; Reddy, C.; Teggene, F.; Haile, S.; Archer, R.S. Inland wetlands mapping and vulnerability assessment using an integrated geographic information system and remote sensing techniques. Global J. Environ. Sci. Manag. 2018, 4, 387–400. [Google Scholar] [CrossRef]
- Cariñanos, P.; Calaza, P.; Hiemstra, J.; Pearlmutter, D.; Vilhar, U. The role of urban and peri-urban forests in reducing risks and managing disasters. Unasylva 2018, 69, 53–58. Available online: https://www.researchgate.net/profile/Paloma-Carinanos/publication/324014447_The_role_of_urban_and_peri-urban_forests_in_reducing_risks_and_managing_disasters/links/5abcee9b45851584fa6e9702/The-role-of-urban-and-peri-urban-forests-in-reducing-risks-and-managing-disasters.pdf (accessed on 17 January 2023).
- FAO (Food and Agriculture Organization of the United Nations). Global Forest Resources Assessment 2020. Main Report; FAO: Rome, Italy, 2020. [Google Scholar] [CrossRef]
- Mansourian, S.; Doncheva, N.; Valchev, K.; Vallauri, D. Lessons Learnt from 20 Years of Floodplain Forest Restoration: The Lower Danube Landscape; WWF Field Series 2019—WWF France: Paris, France, 2019; Available online: https://wwfint.awsassets.panda.org/downloads/lessons_learnt_fromthe_lower_danube_landscape.pdf (accessed on 17 January 2023).
- de Groot, R.S.; Blignaut, J.; Van der Ploeg, S.; Aronson, J.; Elmqvist, T.; Farley, J. Benefits of investing in ecosystem restoration. Conserv. Biol. 2013, 27, 1286–1293. [Google Scholar] [CrossRef] [PubMed]
- Morecroft, M.D.; Duffield, S.; Harley, M.; Pearce-Higgins, J.W.; Stevens, N.; Wattsand, O.; Whitake, J. Measuring the success of climate change adaptation and mitigation in terrestrial ecosystems. Science 2019, 366, eaaw9256. [Google Scholar] [CrossRef]
- Watson, J.E.M.; Evans, T.; Venter, O.; Williams, B.; Tulloch, A.; Stewart, C.; Thompson, I.; Ray, J.C.; Murray, K.; Salazar, A.; et al. The exceptional value of intact forest ecosystems. Nat. Ecol. Evol. 2018, 2, 599–610. [Google Scholar] [CrossRef]
- Forest Europe. State of Europe’s Forests 2020; Ministerial Conference on the Protection of Forests in Europe: Bonn, Germany, 2020; Available online: https://foresteurope.org/wp-content/uploads/2016/08/SoEF_2020.pdf (accessed on 23 December 2022).
- Segoni, S.; Caleca, F. Definition of environmental indicators for a fast estimation of landslide risk at national scale. Land 2021, 10, 621. [Google Scholar] [CrossRef]
- Fiorini, L.; Zullo, F.; Marucci, A.; Romano, B. Land take and landscape loss: Effect of uncontrolled urbanization in Southern Italy. J. Urban Manag. 2019, 8, 42–56. [Google Scholar] [CrossRef]
- Shu, H.; Hürlimann, M.; Molowny-Horas, R.; González, M.; Pinyol, J.; Abancó, C.; Ma, J. Relation between land cover and landslide susceptibility in Val d’Aran, Pyrenees (Spain): Historical aspects, present situation and forward prediction. Sci. Total Environ. 2019, 693, 133557. [Google Scholar] [CrossRef]
- Garcia, R.A.C.; Oliveira, S.C.; Zêzere, J.L. Assessing population exposure for landslide risk analysis using dasymetric cartography. Nat. Hazard Earth Sys. 2016, 16, 2769–2782. [Google Scholar] [CrossRef]
- Sidle, R.C.; Ziegler, A.D.; Negishi, J.N.; Nik, A.R.; Siew, R.; Turkelboom, F. Erosion processes in steep terrain—Truths, myths, and uncertainties related to forest management in Southeast Asia. Forest. Ecol. Manag. 2006, 224, 199–225. [Google Scholar] [CrossRef]
- RECOFTC; FAO. Forests and Landslides. Available online: https://www.recoftc.org/sites/default/files/publications/resources/recoftc-0000049-0001-en.pdf (accessed on 17 January 2023).
- Guthrie, R.H.; Hockin, A.; Colquhoun, L.; Nagy, T.; Evans, S.G.; Ayles, C. An examination of controls on debris flow mobility: Evidence from coastal British Columbia. Geomorphology 2010, 114, 601–613. [Google Scholar] [CrossRef]
- Zhang, Y.; Shen, C.; Zhou, S.; Luo, X. Analysis of the influence of forests on landslides in the Bijie Area of Guizhou. Forests 2022, 13, 1136. [Google Scholar] [CrossRef]
- Schatz, E.-M.; Bovet, J.; Lieder, S.; Schroeter-Schlaack, C.; Strunz, S.; Marquard, E. Land take in environmental assessments: Recent advances and persisting challenges in selected EU countries. Land Use Policy 2021, 111, 105730. [Google Scholar] [CrossRef]
- European Environment Agency. Indicator Assessment. Land Recycling and Densification. Available online: https://www.eea.europa.eu/data-and-maps/indicators/land-recycling-and-densification/assessment-1 (accessed on 17 January 2023).
- Li, M.; Verburg, P.H.; van Vliet, J. Global trends and local variations in land take per person. Landsc. Urban Plan. 2022, 218, 104308. [Google Scholar] [CrossRef]
- Dull, M.; Wernstedt, K. Land recycling, community revitalization, and distributive politics: An analysis of EPA brownfields program support. Policy Stud. J. 2010, 38, 119–141. [Google Scholar] [CrossRef]
- Tobias, S.; Conen, F.; Duss, A.; Wenzel, L.M.; Buser, C.; Alewell, C. Soil sealing and unsealing: State of the art and examples. Land Degrad. Dev. 2018, 29, 2015–2024. [Google Scholar] [CrossRef]
- Voghera, A.; Giudice, B. Defining a social-ecological performance to prioritize compensatory actions for environmental regeneration. The experimentation of the environmental compensation plan. Sustain. Cities Soc. 2020, 61, 102357. [Google Scholar] [CrossRef]
- Zoppi, C.; Lai, S. Assessment of the regional landscape plan of Sardinia (Italy): A participatory-action-research case study type. Land Use Policy 2010, 27, 690–705. [Google Scholar] [CrossRef]
- Kovács, E.; Kelemen, K.; Kalóczkai, A.; Margóczi, K.; Pataki, G.; Gébert, J.; Málovics, G.; Balázs, B.; Roboz, A.; Krasznai Kovács, E.; et al. Understanding the links between ecosystem service trade-offs and conflicts in protected areas. Ecosyst. Serv. 2015, 12, 117–127. [Google Scholar] [CrossRef]
- Floris, M.; Zoppi, C. Ecosystem services and spatial planning: A study on the relationship between carbon sequestration and land-taking processes. Arch. Studi Urbani Reg. 2020, 127. [Google Scholar] [CrossRef]
- Organisation for Economic Cooperation and Development (OECD). Applying Strategic Environmental Assessment. Good Practice Guidance for Development Co-Operation. DAC Guidelines and Reference Series. OECD Publications. 2006. Available online: https://read.oecd-ilibrary.org/development/applying-strategic-environmental-assessment_9789264026582-en#page1 (accessed on 17 January 2023).
- Mateos, R.M.; López-Vinielles, J.; Poyiadji, E.; Tsagkas, D.; Sheehy, M.; Hadjicharalambous, K.; Liscák, P.; Podolski, L.; Laskowicz, I.; Iadanza, C.; et al. Integration of landslide hazard into urban planning across Europe. Landsc. Urban Plan. 2020, 196, 103740. [Google Scholar] [CrossRef]
- Bucała-Hrabia, A.; Kijowska-Strugała, M.; Śleszyński, P.; Rączkowska, Z.; Izdebski, W.; Malinowski, Z. Evaluating the use of the landslide database in spatial planning in mountain communes (the Polish Carpathians). Land Use Policy 2022, 112, 105842. [Google Scholar] [CrossRef]
- Promper, C.; Puissant, A.; Malet, J.-P.; Glade, T. Analysis of land cover changes in the past and the future as contribution to landslide risk scenario. Appl. Geogr. 2014, 53, 11–19. [Google Scholar] [CrossRef]


Disclaimer/Publisher’s Note: The statements, opinions and data contained in all publications are solely those of the individual author(s) and contributor(s) and not of MDPI and/or the editor(s). MDPI and/or the editor(s) disclaim responsibility for any injury to people or property resulting from any ideas, methods, instructions or products referred to in the content. |
© 2023 by the authors. Licensee MDPI, Basel, Switzerland. This article is an open access article distributed under the terms and conditions of the Creative Commons Attribution (CC BY) license (https://creativecommons.org/licenses/by/4.0/).