Article

Opportunities for Adaptation to Climate Change of Extensively Grazed Pastures in the Central Apennines (Italy)

1
Department of Agriculture, Food, Environment and Forestry (DAGRI), University of Florence, 50144 Florence, Italy
2
Unité Mixte de Recherche sur l’Écosystème Prairial (UREP), Université Clermont Auvergne, INRAE, VetAgro Sup, UREP, 63000 Clermont-Ferrand, France
3
Institute of BioEconomy, Italian National Research Council (IBE-CNR), 50019 Sesto Fiorentino, Italy
*
Author to whom correspondence should be addressed.
Land 2023, 12(2), 351; https://doi.org/10.3390/land12020351
Submission received: 29 December 2022 / Revised: 21 January 2023 / Accepted: 26 January 2023 / Published: 28 January 2023

Abstract

:
Future climate change is expected to significantly alter the growth of vegetation in grassland systems, in terms of length of the growing season, forage production, and climate-altering gas emissions. The main objective of this work was, therefore, to simulate the future impacts of foreseen climate change in the context of two pastoral systems in the central Italian Apennines and test different adaptation strategies to cope with these changes. The PaSim simulation model was, therefore, used for this purpose. After calibration by comparison with observed data of aboveground biomass (AGB) and leaf area index (LAI), simulations were able to produce various future outputs, such as length of growing season, AGB, and greenhouse gas (GHG) emissions, for two time windows (i.e., 2011–2040 and 2041–2070) using 14 global climate models (GCMs) for the generation of future climate data, according to RCP (Representative Concentration Pathways) 4.5 and 8.5 scenarios under business-as-usual management (BaU). As a result of increasing temperatures, the fertilizing effect of CO2, and a similar trend in water content between present and future, simulations showed a lengthening of the season (i.e., mean increase: +8.5 and 14 days under RCP4.5 and RCP8.5, respectively, for the period 2011–2040, +19 and 31.5 days under RCP4.5 and RCP8.5, respectively, for the period 2041–2070) and a rise in forage production (i.e., mean biomass peak increase of the two test sites under BaU: +53.7% and 62.75% for RCP4.5. and RCP8.5, respectively, in the 2011–2040 period, +115.3% and 176.9% in RCP4.5 and RCP8.5 in 2041–2070, respectively,). Subsequently, three different alternative management strategies were tested: a 20% rise in animal stocking rate (+20 GI), a 15% increase in grazing length (+15 GL), and a combination of these two management factors (+20 GI × 15 GL). Simulation results on alternative management strategies suggest that the favorable conditions for forage production could support the increase in animal stocking rate and grazing length of alternative management strategies (i.e., +20 GI, +15 GL, +20 GI × 15 GL). Under future projections, net ecosystem exchange (NEE) and nitrogen oxide (N2O) emissions decreased, whereas methane (CH4) rose. The simulated GHG future changes varied in magnitude according to the different adaptation strategies tested. The development and assessment of adaptation strategies for extensive pastures of the Central Apennines provide a basis for appropriate agricultural policy and optimal land management in response to the ongoing climate change.

1. Introduction

With an herbage production potential up to ~15 t DM ha−1 [1], grasslands contribute significantly to global food security by providing fodder for ruminants used in the production of protein-rich foods, such as meat and milk [2,3]. In Italy, grassland areas (i.e., permanent meadows and pastures) cover approximately 3.6 Mha [4], roughly 12% of the entire Italian territory, and are located mainly along the Alpine and Apennine mountain ranges and on the islands [5]. Differing in climate and land use, factors that influence productivity and botanical composition, Italian grasslands can be divided into three different biogeographic regions: Alpine, Apennine, and Mediterranean [6]. They are mostly large-scale rainfed pastoral systems, with permanent pastures dominant in the mountains and hilly areas and fodder crops also dominant in the Mediterranean region. Generally, these systems provide forage for only short periods of time during spring and summer, exhibiting great inter-annual variability in production [7,8]. With regard to mountain areas (i.e., Alps and Apennines), grasslands are often located in areas with nutrient-poor soils and/or extreme climate conditions that make vegetation growth, and consequently forage production, reliant on seasonal dynamics [9]. Focusing specifically on Apennine mountain pastures, forage quality is generally lower than in Alpine pasturelands [10], due mainly to the great variability in pedo-climatic conditions that can be found along the latitudinal gradient of Italy [11].
In addition to forage production, grasslands provide several other ecosystem services important for human well-being, such as water and nutrient regulation and protection from soil erosion [12,13,14,15,16]. Particularly important is the role that these systems can play in climate-changing emissions [17], as they can stock/emit carbon dioxide CO2 [18,19] and emit non-CO2 greenhouse gases, such as methane (CH4) and nitrous oxide (N2O) [20]. According to Guillaume et al. [21], soil organic C stock measured from surface to 50 cm depth in permanent grasslands is approximately 7 kg C m−2, and evidence from European grasslands shows that soil C sequestration rates can reach 0.77 g C m−2 yr−1 [22]. Compared with other ecosystems, grasslands are, in fact, an important store of C [23], and management (grazing in particular) is an important regulator of C and N fluxes [24]. Grasslands have the advantage of potentially acting as C and N sinks, compared with croplands, and can mitigate GHG emissions in livestock production systems, as C and N sequestration can offset GHG emissions [17,25,26].
Pastoral resources in the Apennines during the last decades have shown fragility in the face of changes induced by recent global warming. There was a shift in air temperature distribution towards warmer values in all seasons (especially for minimum temperature, while maximum temperature shows a more intense warming and a pronounced peak in summer) since the 1980s, with an acceleration in the 2000s [27], and it is projected to increase in the future [28]. In view of the expected increase in temperatures associated with a decrease in precipitation during the summer period, forage production is assumed to change in terms of quantity and quality [29,30]. Moreover, evolution of the distribution of species in herbaceous communities and changes in the botanical composition of semi-natural grasslands are highlighted [31]. In fact, rising temperatures and summer droughts tend to promote the predominance of thermophilic communities or species more adapted to xeric environments, which now grow in environments at lower altitudes, as was already observed in the Alps [32] and Apennines [33,34].
In this view, simulation models, through the reproduction of system biophysical processes, can help stakeholders in decision-making by assessing the impacts of climate change and/or testing different management strategies under current [35,36] or future scenarios [37,38,39,40,41]. In this context, appropriate management (e.g., stocking rate and grazing period) can preserve grassland biodiversity, maintain socio-ecological systems, and counteract the effects of climate change. On the basis of assessment of the previous literature, it can be said that a very small number of modeling exercises have examined the effect of foreseen climate changes on pasture production characteristics in the Apennine area [6], as almost all works have analyzed the effects on vegetation features and biodiversity, e.g., [42,43,44]. Therefore, the present research aims to analyze the expected effect of climatic changes mainly from an agronomic perspective, providing an approach that can be repeated in other contexts and that is aimed at evaluating the impacts on productive features of forage resources and the possible adaptation strategies of some of the main pasture management characteristics.
This perspective forms the basis for the design and implementation of this study initiated in 2020 on two pastoral farms in the Apennines territory of central Italy, based on field observations and model-based simulations. Modeling the performance of pastoral systems is helpful in defining management strategies that maximize pastoral production and minimize environmental impacts [45]. Field data support the modeling exercises by providing detailed on-farm information on the spatial and temporal variation of important canopy state variables, which are often difficult to obtain [46]. Simulation results under future climate change scenarios were the key tools for the design and assessment of the analytical framework concerning climate change adaptation strategies, pivotal factors for the conservation of grassland resources [47]. Based on the hypothesis that future climate change will significantly affect extensive grazing systems of the Central Apennines, the specific objectives of this study were: (1) to inform the modeling via calibration with field data; (2) to use the calibrated models to project the impacts of climate change; and (3) to assess a set of adaptation options for pastoral management identified locally.

2. Materials and Methods

The study was initially conducted by calibrating the grassland simulation model PaSim [48] with observed data collected on two specific farms in the Italian Apennines (Suite 1). The parameterization obtained was subsequently used, together with the climate models, to simulate the impacts of climate change on grasslands (Suite 2). In parallel, a sensitivity analysis was performed with specific attention to biomass production (Suite 3). Finally, on the basis of the results obtained in the impact analysis, possible adaptation strategies were identified and tested (Suite 4). A general outline of the methodology used can be seen in Figure 1.

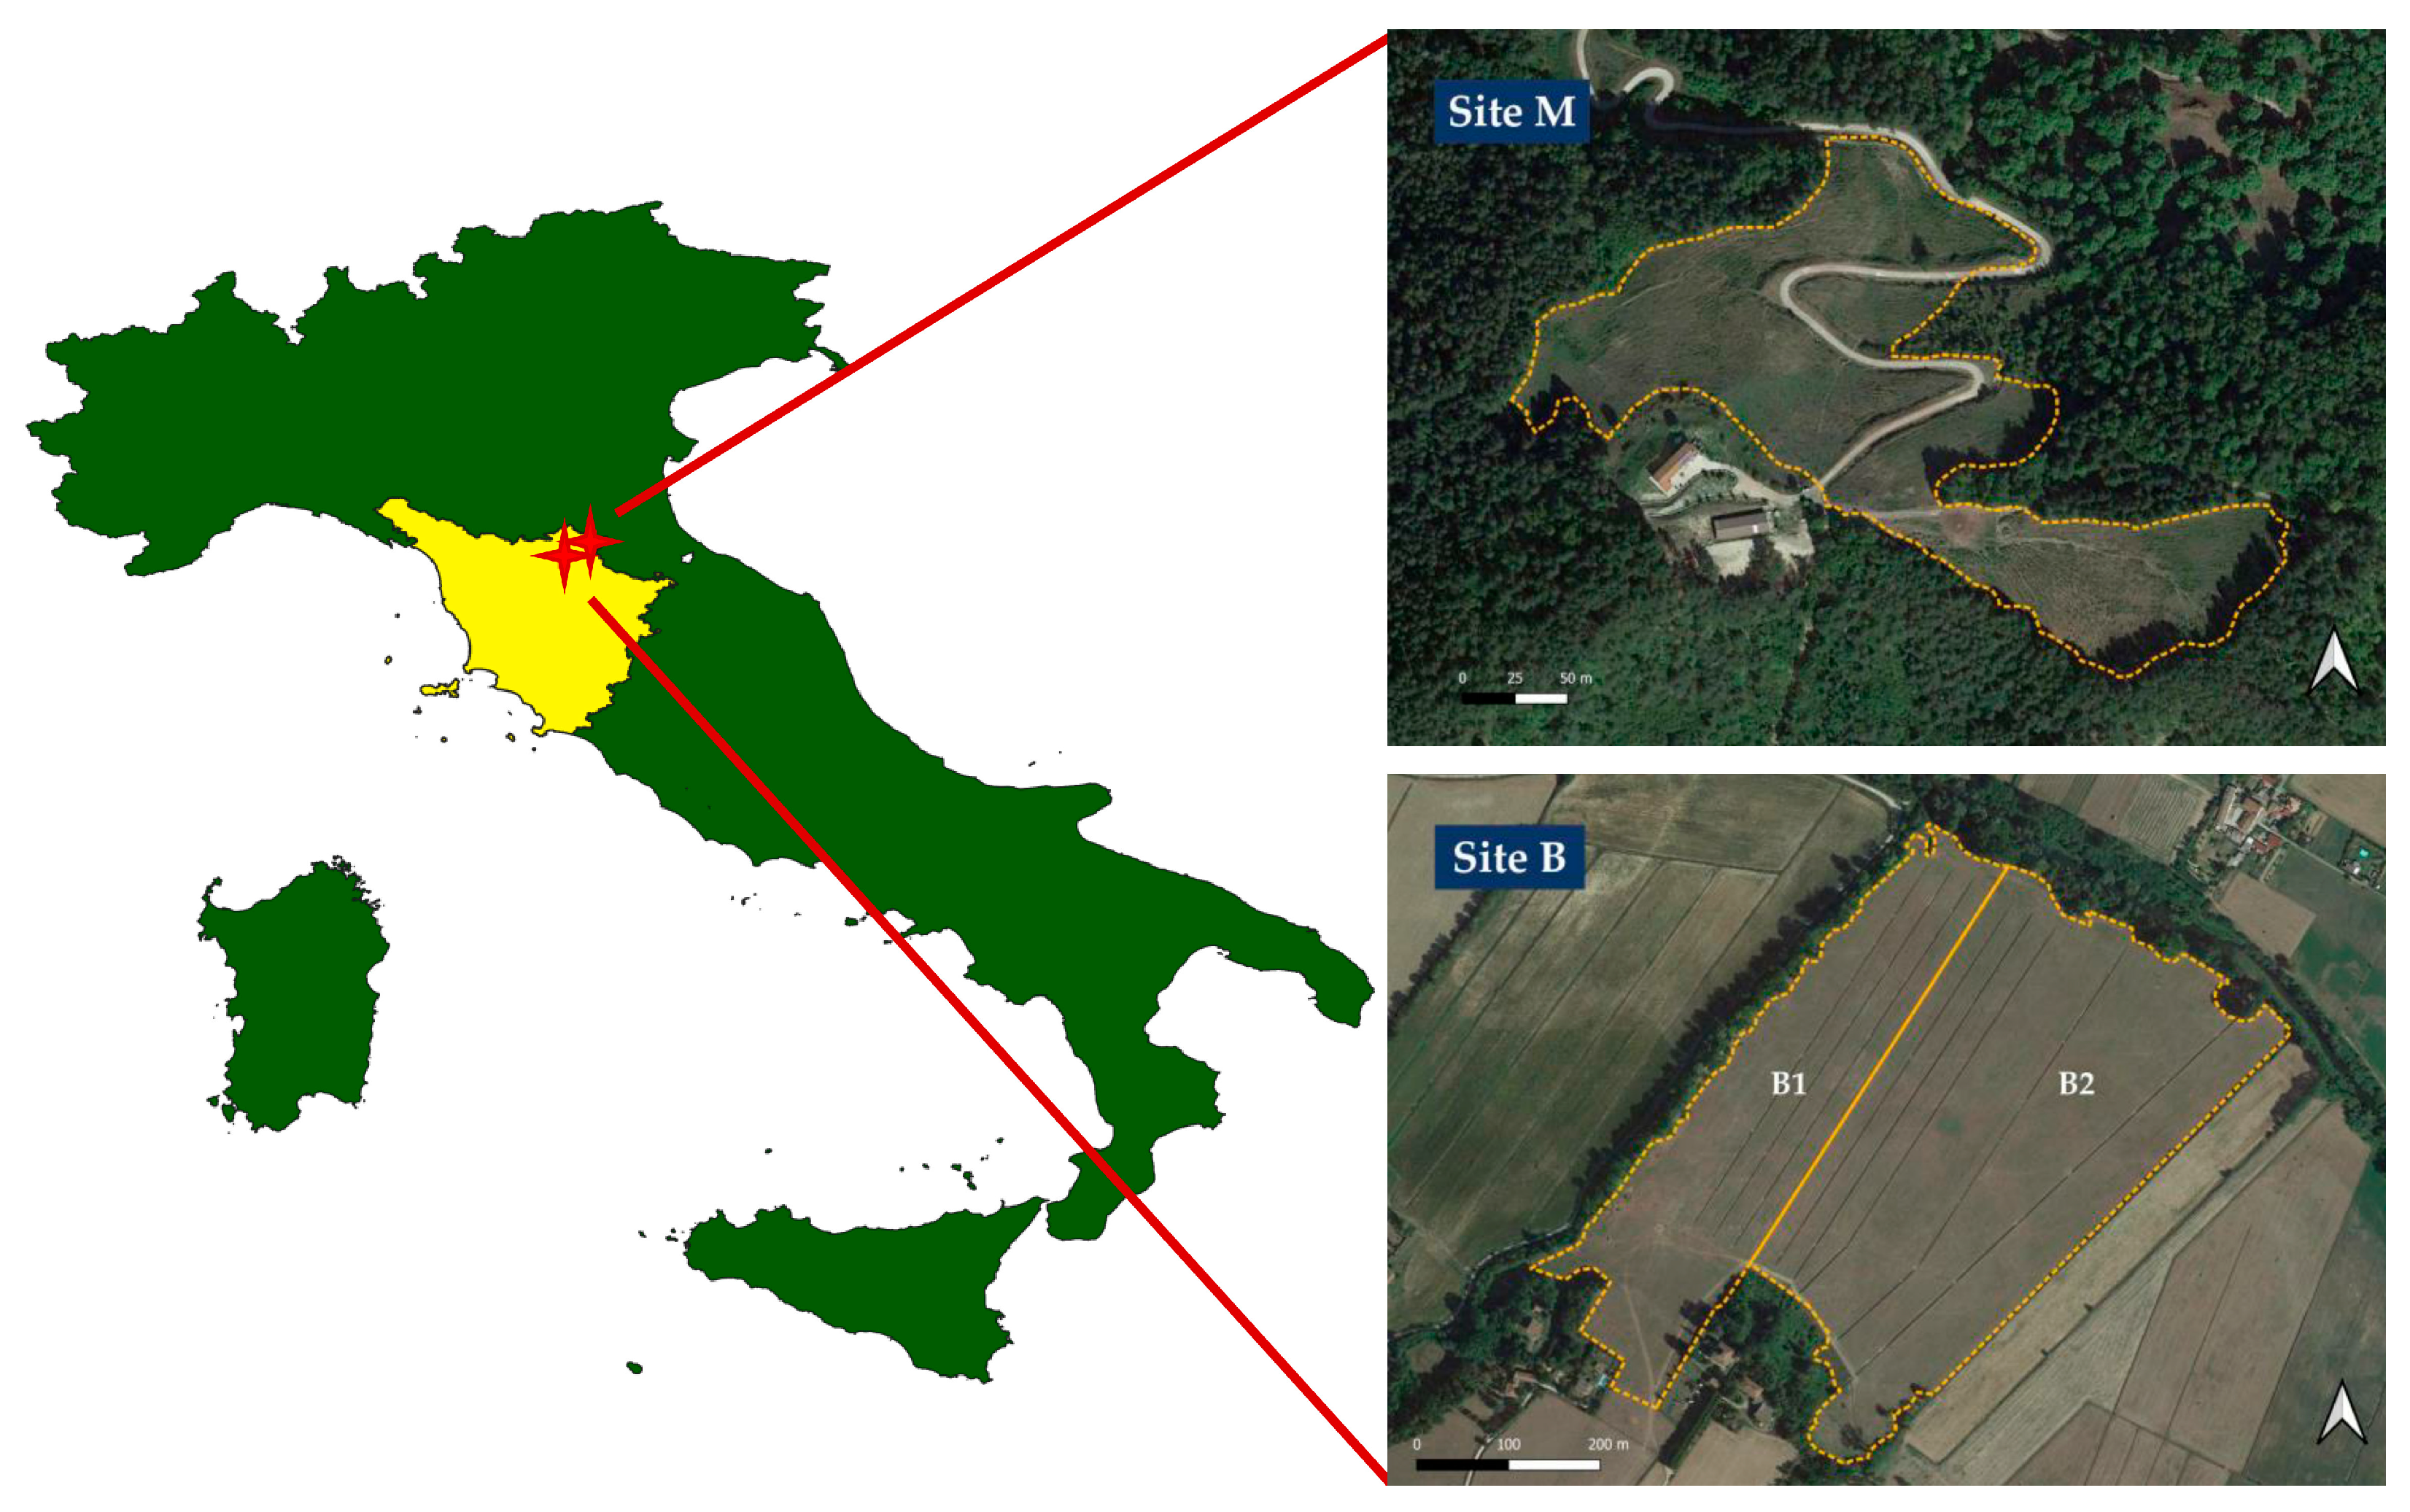
2.1. Study Sites, Experimental Layout, and Data Collection

The study considered two pastoral farms (Figure 2) located at different altitudes in the Tuscan Apennines (Table 1), both managed under continuous grazing system of Limousin cattle (Table 2).
The Marradi study site (M) covers more than 5 ha of upland sown pasture that tends towards a re-naturalization, usually grazed from May to July. The Borgo San Lorenzo study site (B) covers 30 ha of lowland sown pasture. For the purpose of the trial, Site B was divided in 2020 into two differently managed sub-areas, B1 (approx. 10 ha) and B2 (approx. 20 ha). Specifically, in sub-area B1 the pasture was grazed by Limousin cattle from April until the end of October, while sub-area B2 was managed under a mixed utilization: mowed in May and grazed from June until the end of October.
Samples of aboveground dry matter (DM) biomass (AGB, kg DM m−2) and measurements of leaf area index (LAI, m2 m−2) were collected during field surveys conducted in spring/summer (2020 and 2021) at both sites and used for the modeling work (Table S1). Field data were collected in 16 randomly arranged samples in an area of 1 m2 each (eight in M, four in B1, and four in B2). The sampling position was changed from time to time, taking care to choose areas that represented the general situation. The AccuPAR PAR/LAI Ceptometer Model LP-80 (Decagon Devices, 2017) was used to measure LAI in each plot.

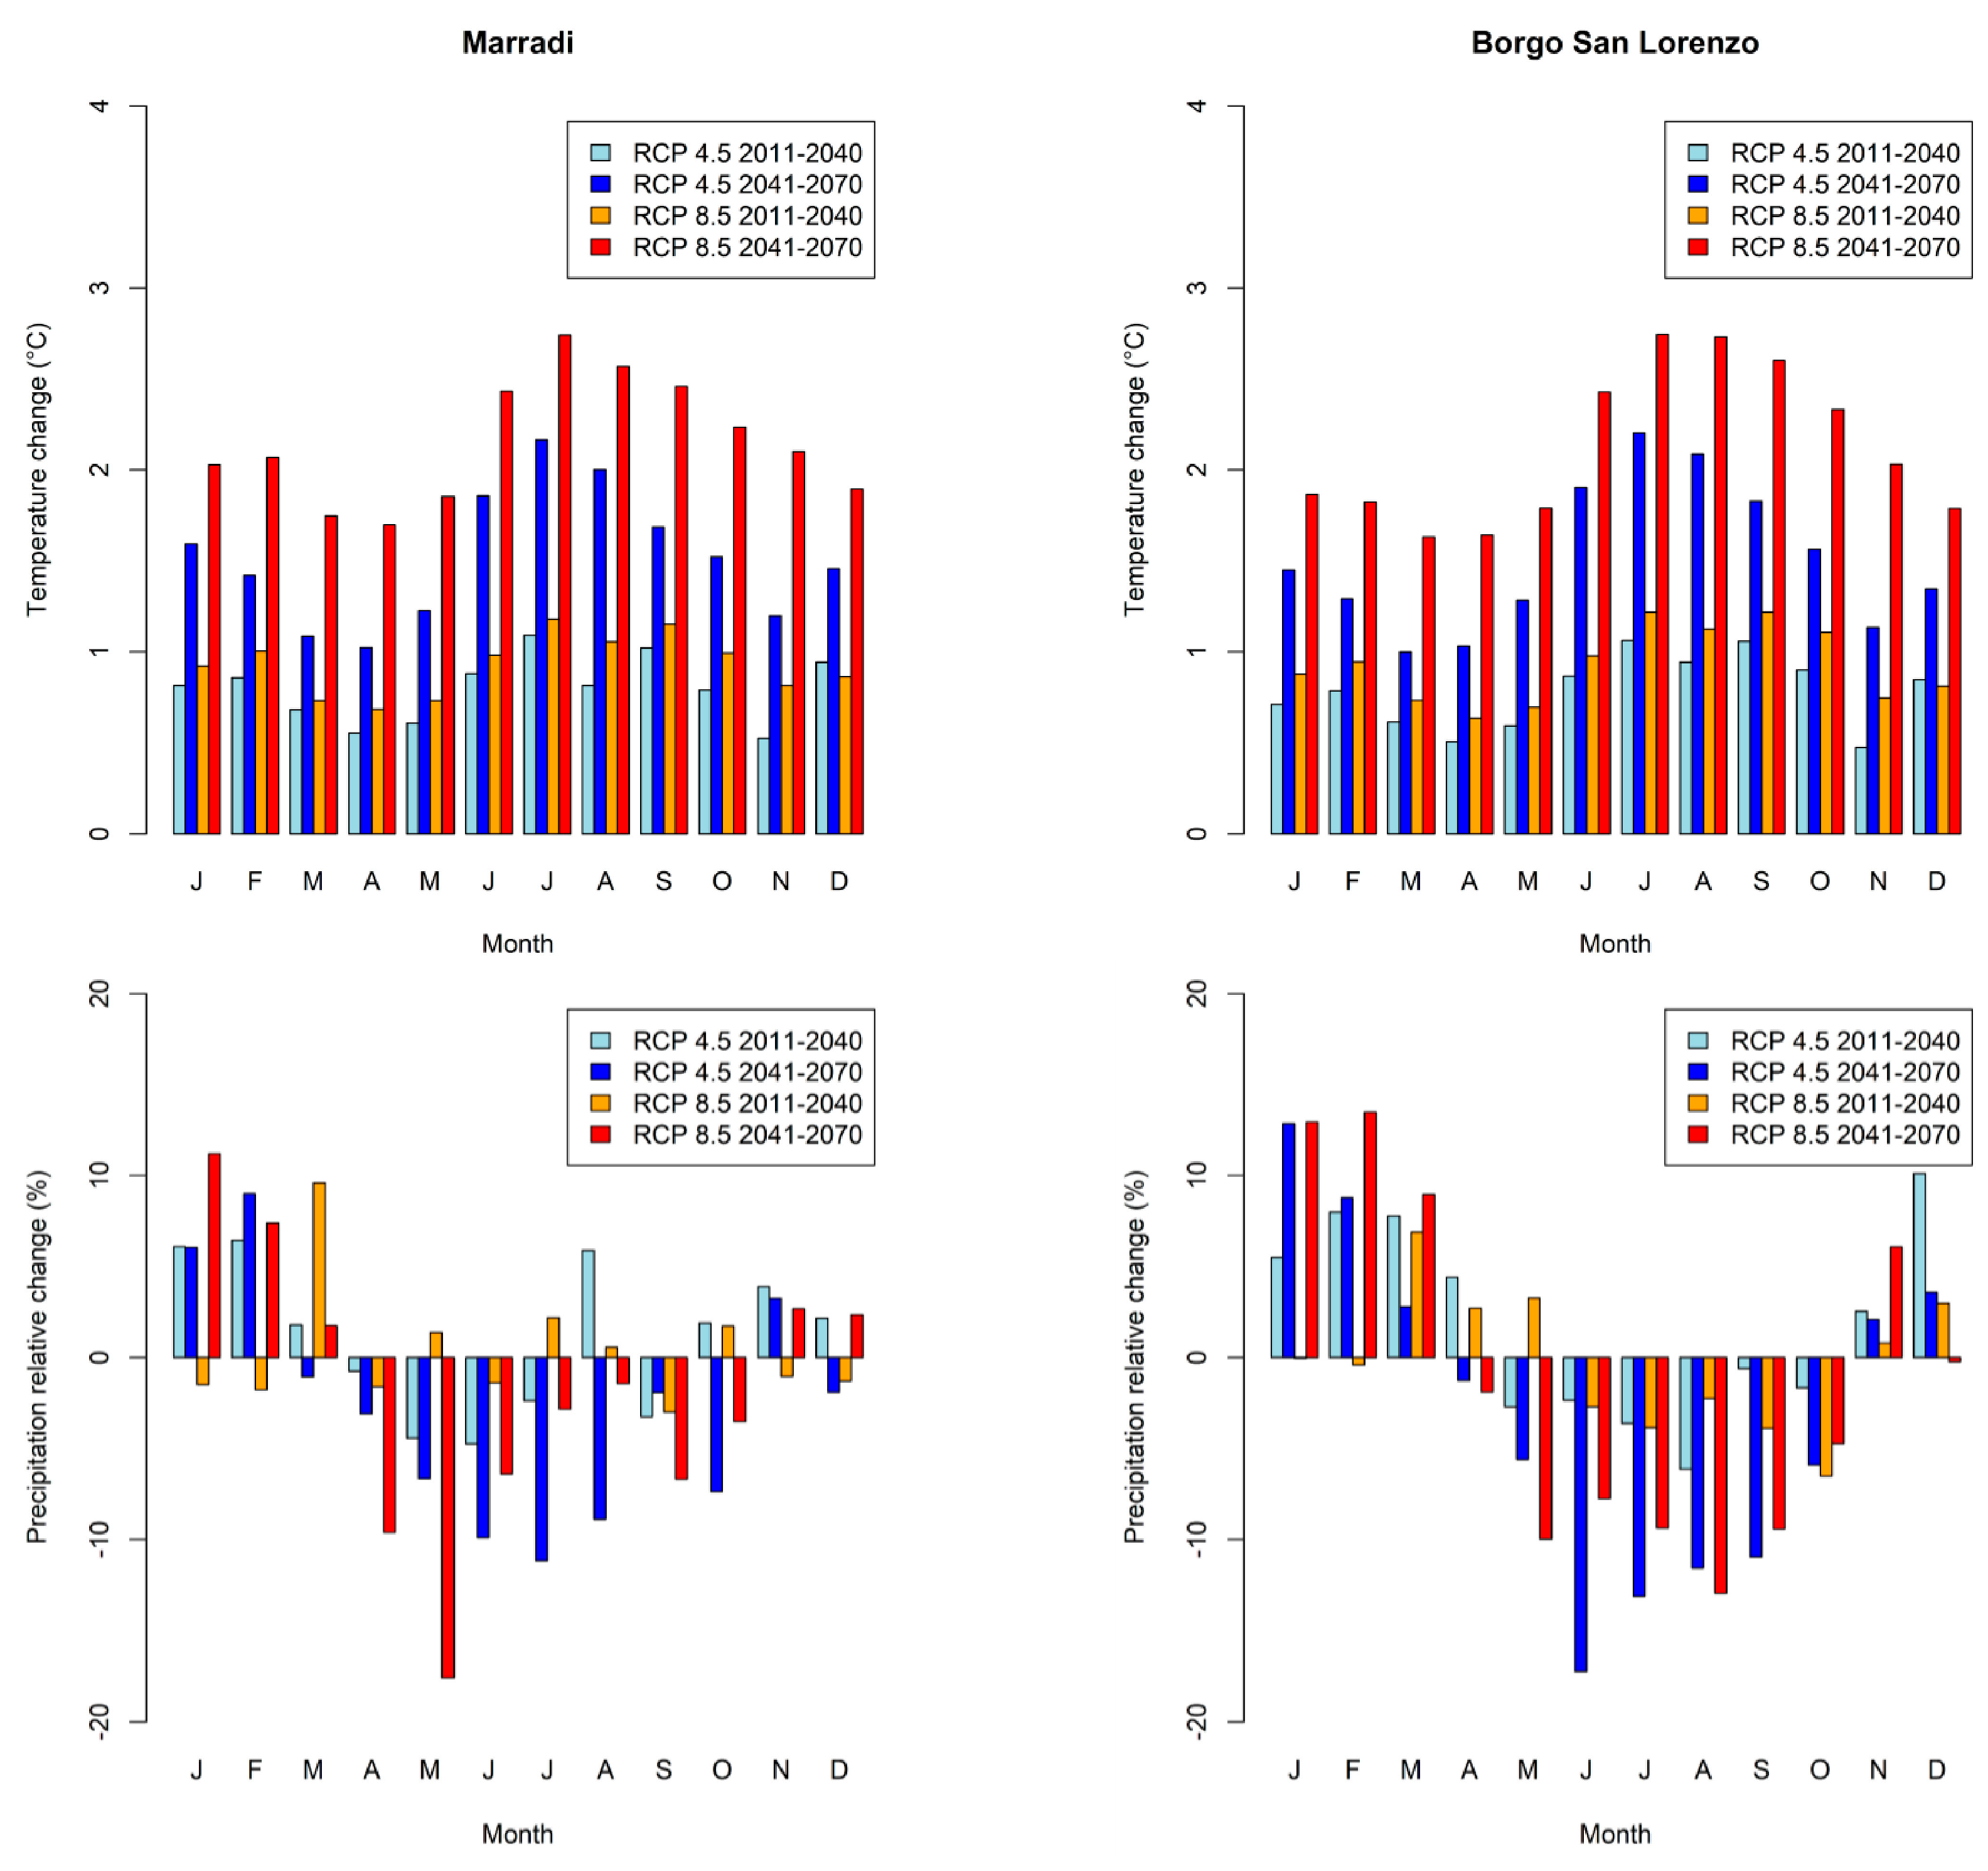
2.2. Climate Scenarios and Models

Daily-downscaled (bias-corrected) weather data were selected to map a broad range of climate outputs for impact modeling [49] (Table S2).
In order to take into account the uncertainties of the different climate models in the projected simulations [50], the outputs of an ensemble of models were considered for the modeling exercise under the future scenarios RCP4.5 (intermediate scenario) and RCP8.5 (extreme scenario). The climate change scenario ensemble included 14 members deriving from the combination of 14 Global Climate Models (GCMs) downscaled to six high-resolution (~0.12°) Regional Climate Models (RCMs) in the framework of the Med-CORDEX project [51]. Daily climate outputs (minimum and maximum temperatures and cumulative rainfall) obtained from the 14 GCMs (available at https://www.medcordex.eu/index.php/, accessed on 20 January 2023) were then bias-corrected over the study sites according to Cornes et al. (2018) and Lange (2019) [52,53] in order to drive the relevant simulations in future periods. Daily global radiation and relative humidity were retrieved from daily temperature according to Bristow-Campbell [54] and the FAO Irrigation and Drainage paper [55], respectively. CO2 annual concentrations (ppm) for past, current, and future projections were calculated from the IPCC report [56].

2.3. The Grassland Model

The Pasture Simulation model (PaSim) was chosen for this study because it can describe in detail the dynamic biogeochemical responses of a grassland system under altered climate and management. Originally developed by Riedo et al. [48], PaSim simulates the cycling of water, C, and N in grassland systems at a sub-daily time step (1/50th of a day) or, as in this work, at a daily time step. Microclimate, soil biophysics, vegetation, herbivores, and management practices are interacting modules. The simulations are not spatially resolved (e.g., inhomogeneity is not taken into account) and input/output data are assumed to be representative of the entire field. The assimilated photosynthetic C is dynamically allocated to a root and three shoot compartments (each composed of four age classes) or lost through animal metabolism (ecosystem respiration). Accumulated aboveground biomass is cut, grazed, or relocated to the litter pool. Management includes the application of organic and mineral N fertilizers, mowing, and grazing. Details on the model processes are provided in published articles [57,58,59,60,61], which have contributed to the recognition of PaSim as a suitable tool to reproduce biophysical and biogeochemical processes in managed grasslands and its inclusion in international modeling exercises [17,62].

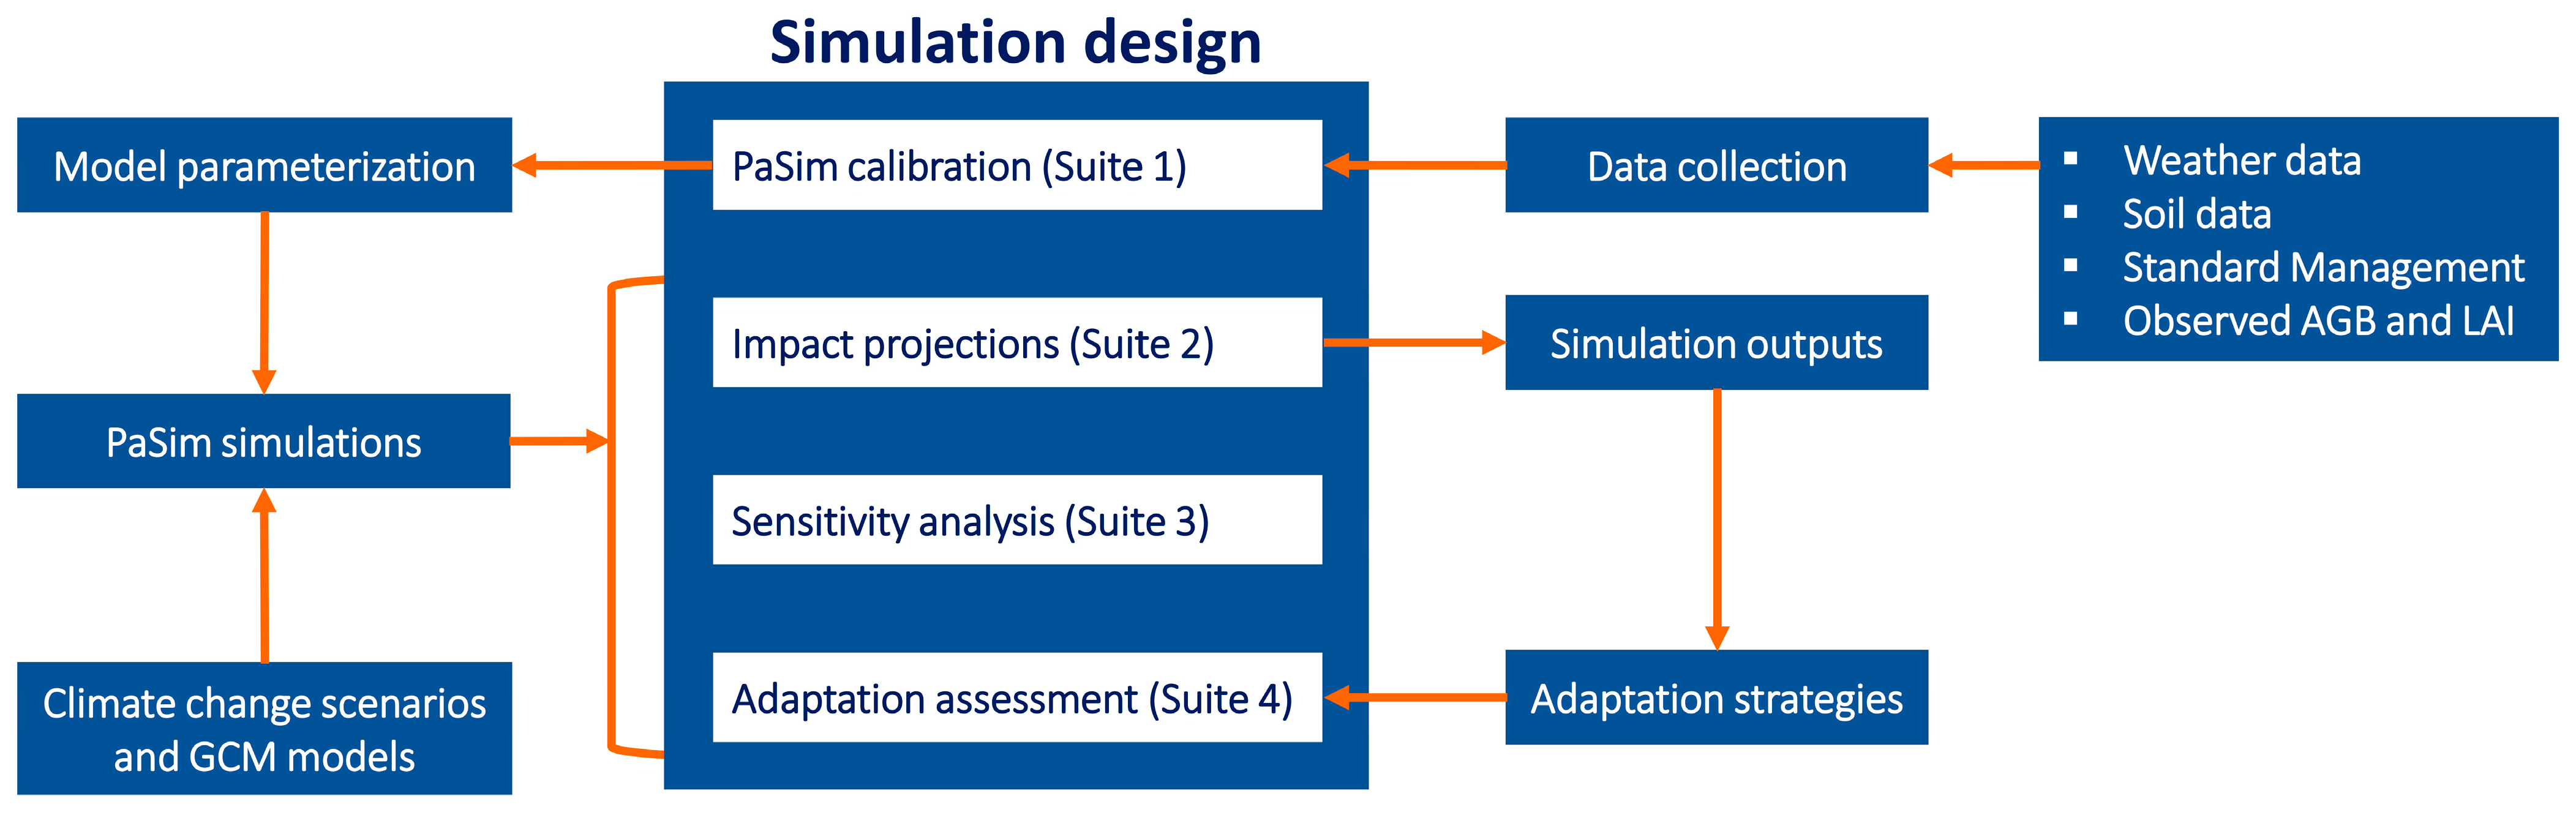
2.4. Simulation Design

The modeling work was performed in four simulation suites: Suite 1 with observational data (calibration), Suite 2 with projected climate change scenarios with CO2 fertilization effect (impact projections), Suite 3 with projected climate change scenarios without CO2 fertilization effect (sensitivity), and Suite 4 with modified management under projected climate change scenarios with CO2 fertilization effect (adaptation assessment).
For Suite 1, the simulations setup included weather, soil, vegetation variables and management implementation in the studied years (2020 and 2021). The weather variables included daily minimum and maximum air temperatures, precipitation, and solar radiation. Temperature, precipitation, and wind speed data for 2020 and 2021 were collected from the regional weather stations of Tuscany Region (SIR, Servizio Idrologico Regionale, https://www.sir.toscana.it/index.php, accessed on 20 January 2023) located near the study sites. Daily global solar radiation data were generated from the R package “sirad”, developed by Bojanowski et al. [63], based on the model of Bristow and Campbell [54]. The soil data were extracted from the SoilgridsTM dataset (https://soilgrids.org, accessed on 20 January 2023), described in Poggio et al. [64]. The actual management practices (grazing intensity and periods) are described in Table 2.
Model calibration was not applied separately to each site. The model was calibrated on all datasets to obtain more realistic and robust parameter values for application on a larger scale, as in Ma et al. [59]. The availability of detailed LAI and AGB data from two grassland sites offered the possibility of a genuine (multi-location and multi-output) calibration of the model, on the assumption that a unique calibration across sites is appropriate under these conditions. We assumed that a common set of eco-physiological model parameters can be established to simulate C3 grasslands (including grass, forb, and legume species) under contrasting climatic and management regimes (e.g., Site M represents hill situations, and Site B represents plain situations), while site-specific climatic and management conditions provide the local drivers of actual grassland biomass and foliage production.
In particular, PaSim calibration (Suite 1) was performed against LAI and AGB data collected in the years 2020 and 2021 by modifying the values of a set of parameters (Table S3) to which model sensitivity was determined in previous studies [58,59,60,61]. Parameter values were modified (with the generation of 1000 sets of values using the random Latin hypercube method) within their plausible ranges [48] to ensure satisfactory performance, which is a realistic representation of both outputs. The sets of parameter values resulting from the model calibration were used to compare the PaSim outputs (AGB and LAI) with the observations in each study site. The agreement between simulated and observed AGB and LAI was assessed by inspection of time-series plots (fluctuations of output variables over time) and numerically, through two performance metrics commonly used in model evaluation [65]: relative root mean square error (best, 0 ≤ RRMSE < +∞, worst) and coefficient of determination (worst, 0 ≤ R2 ≤ 1, best).
For Suites 2, 3, and 4, simulated pastoral outputs were obtained by forcing the calibrated PaSim with the downscaled (bias-corrected) daily weather data described in Section 2.2, Climate Scenarios and Models. Projected PaSim responses to climate change forcing options were calculated on changes in a set of agro-ecosystem outputs related to growing season length, fodder production, water cycle, and C-N fluxes (Table 3). At both sites, we assessed the sensitivity of the grassland model to climate change (RCP4.5 and RCP8.5 for the ongoing and mid-future periods) under business-as-usual (BaU) management (Suites 2 and 3) and alternative management scenarios (Suite 4).
For Suite 2 (impact projections) and Suite 4 (adaptation assessment), grassland modeling results were obtained with a climate forcing based on atmospheric CO2 concentration set at 363 ppm, on average, for the baseline scenario (near past: 1981–2010). In this way, the year 2010 was taken as the end of the time horizon used in this study to emulate the near-past climate, i.e., 30-year time span until the late 2000s, which includes the limit of the historical period (1765–2005) of the atmospheric observations used to drive the climate models [66]. Then, mean atmospheric CO2 concentrations were prescribed according to the selected RCPs (middle impact: 4.5; extreme impact: 8.5) and timeframes (ongoing: 2011–2040; mid-future: 2041–2070): 431 (ongoing) and 523 (mid-future) mean ppm under RCP4.5; and 438 (ongoing) and 613 (mid-future) mean ppm under RCP8.5. The results related to the pasture system obtained in Suite 2 were then used in the choice of the possible future adaptation strategies (e.g., increase or decrease in animal load and/or length of grazing season).
For Suite 3 (sensitivity), any fertilization effect from the additional CO2 emitted during the period from 2011 to 2070 was eliminated. What has been carried out here is, in effect, a test of the sensitivity of PaSim to alterations in weather inputs, this exercise being ultimately focused on understanding the grassland modeling process (not on assessing impacts of climate change and elevated CO2).
Table 3. Climate change impact metrics.
TypeOutputAcronymUnitDescription
DateGrowing season startGSsday of year (doy)Day after seven consecutive days with a mean air temperature ≥8 °C from 1 January onwards [67]
Growing season endGSeDay after seven consecutive days with a mean air temperature <8 °C from 1 July onwards [67]
Biomass peak dateBPdDay of the year with the highest value of aboveground biomass
CountGrowing season lengthGSdaysNumber of days between the GSs and GSe
AmountBiomass peakBPkg DM m−2Aboveground biomass value at the peak date
Aboveground biomassAGBkg DM m−2Aboveground biomass values
Net ecosystem exchangeNEEkg C m−2 yr−1C-N fluxes (annual balance)

(These include emissions from ecosystem respiration, RECO = plant + soil + animal respiration, as well as estimates of the plant production of organic compounds from atmospheric CO2 (GPP: gross primary production) and other system variables: NEE = RECO - GPP, enteric emissions of CH4 from grazing animals and N2O emissions from the N cycle)
MethaneCH4kg C m−2 yr−1
Nitrous oxideN2Okg N m−2 yr−1
Soil water contentSWCm3 m−3Annual mean of daily soil water content values (0.35-m topsoil). In Supplementary Materials.

3. Results

3.1. Climate Analysis

The monthly distribution of air temperatures at the two study sites (Figure 3), averaged from the outputs of 14 climate models, showed an overall increase in temperature towards the mid-future, similar for both sites, with the highest increases in summer (roughly +2.6 °C at both sites under the warmest scenario) and the lowest in autumn–winter (roughly +2.1 °C at both sites under the warmest scenario).
Analysis of simulated rainfall data (Figure 3) showed increases in the November-March period relative to the baseline in both scenarios and sites (Site M: +3.1% and +5.1%; Site B: +6.0% and +8.2%, for RCP4.5 and RCP8.5, respectively), while between April and October there was a sharp decrease in rainfall at both sites (−7.0% and −8.9% at M and −9.4% and −8.9% at B for RCP4.5 and RCP8.5, respectively).

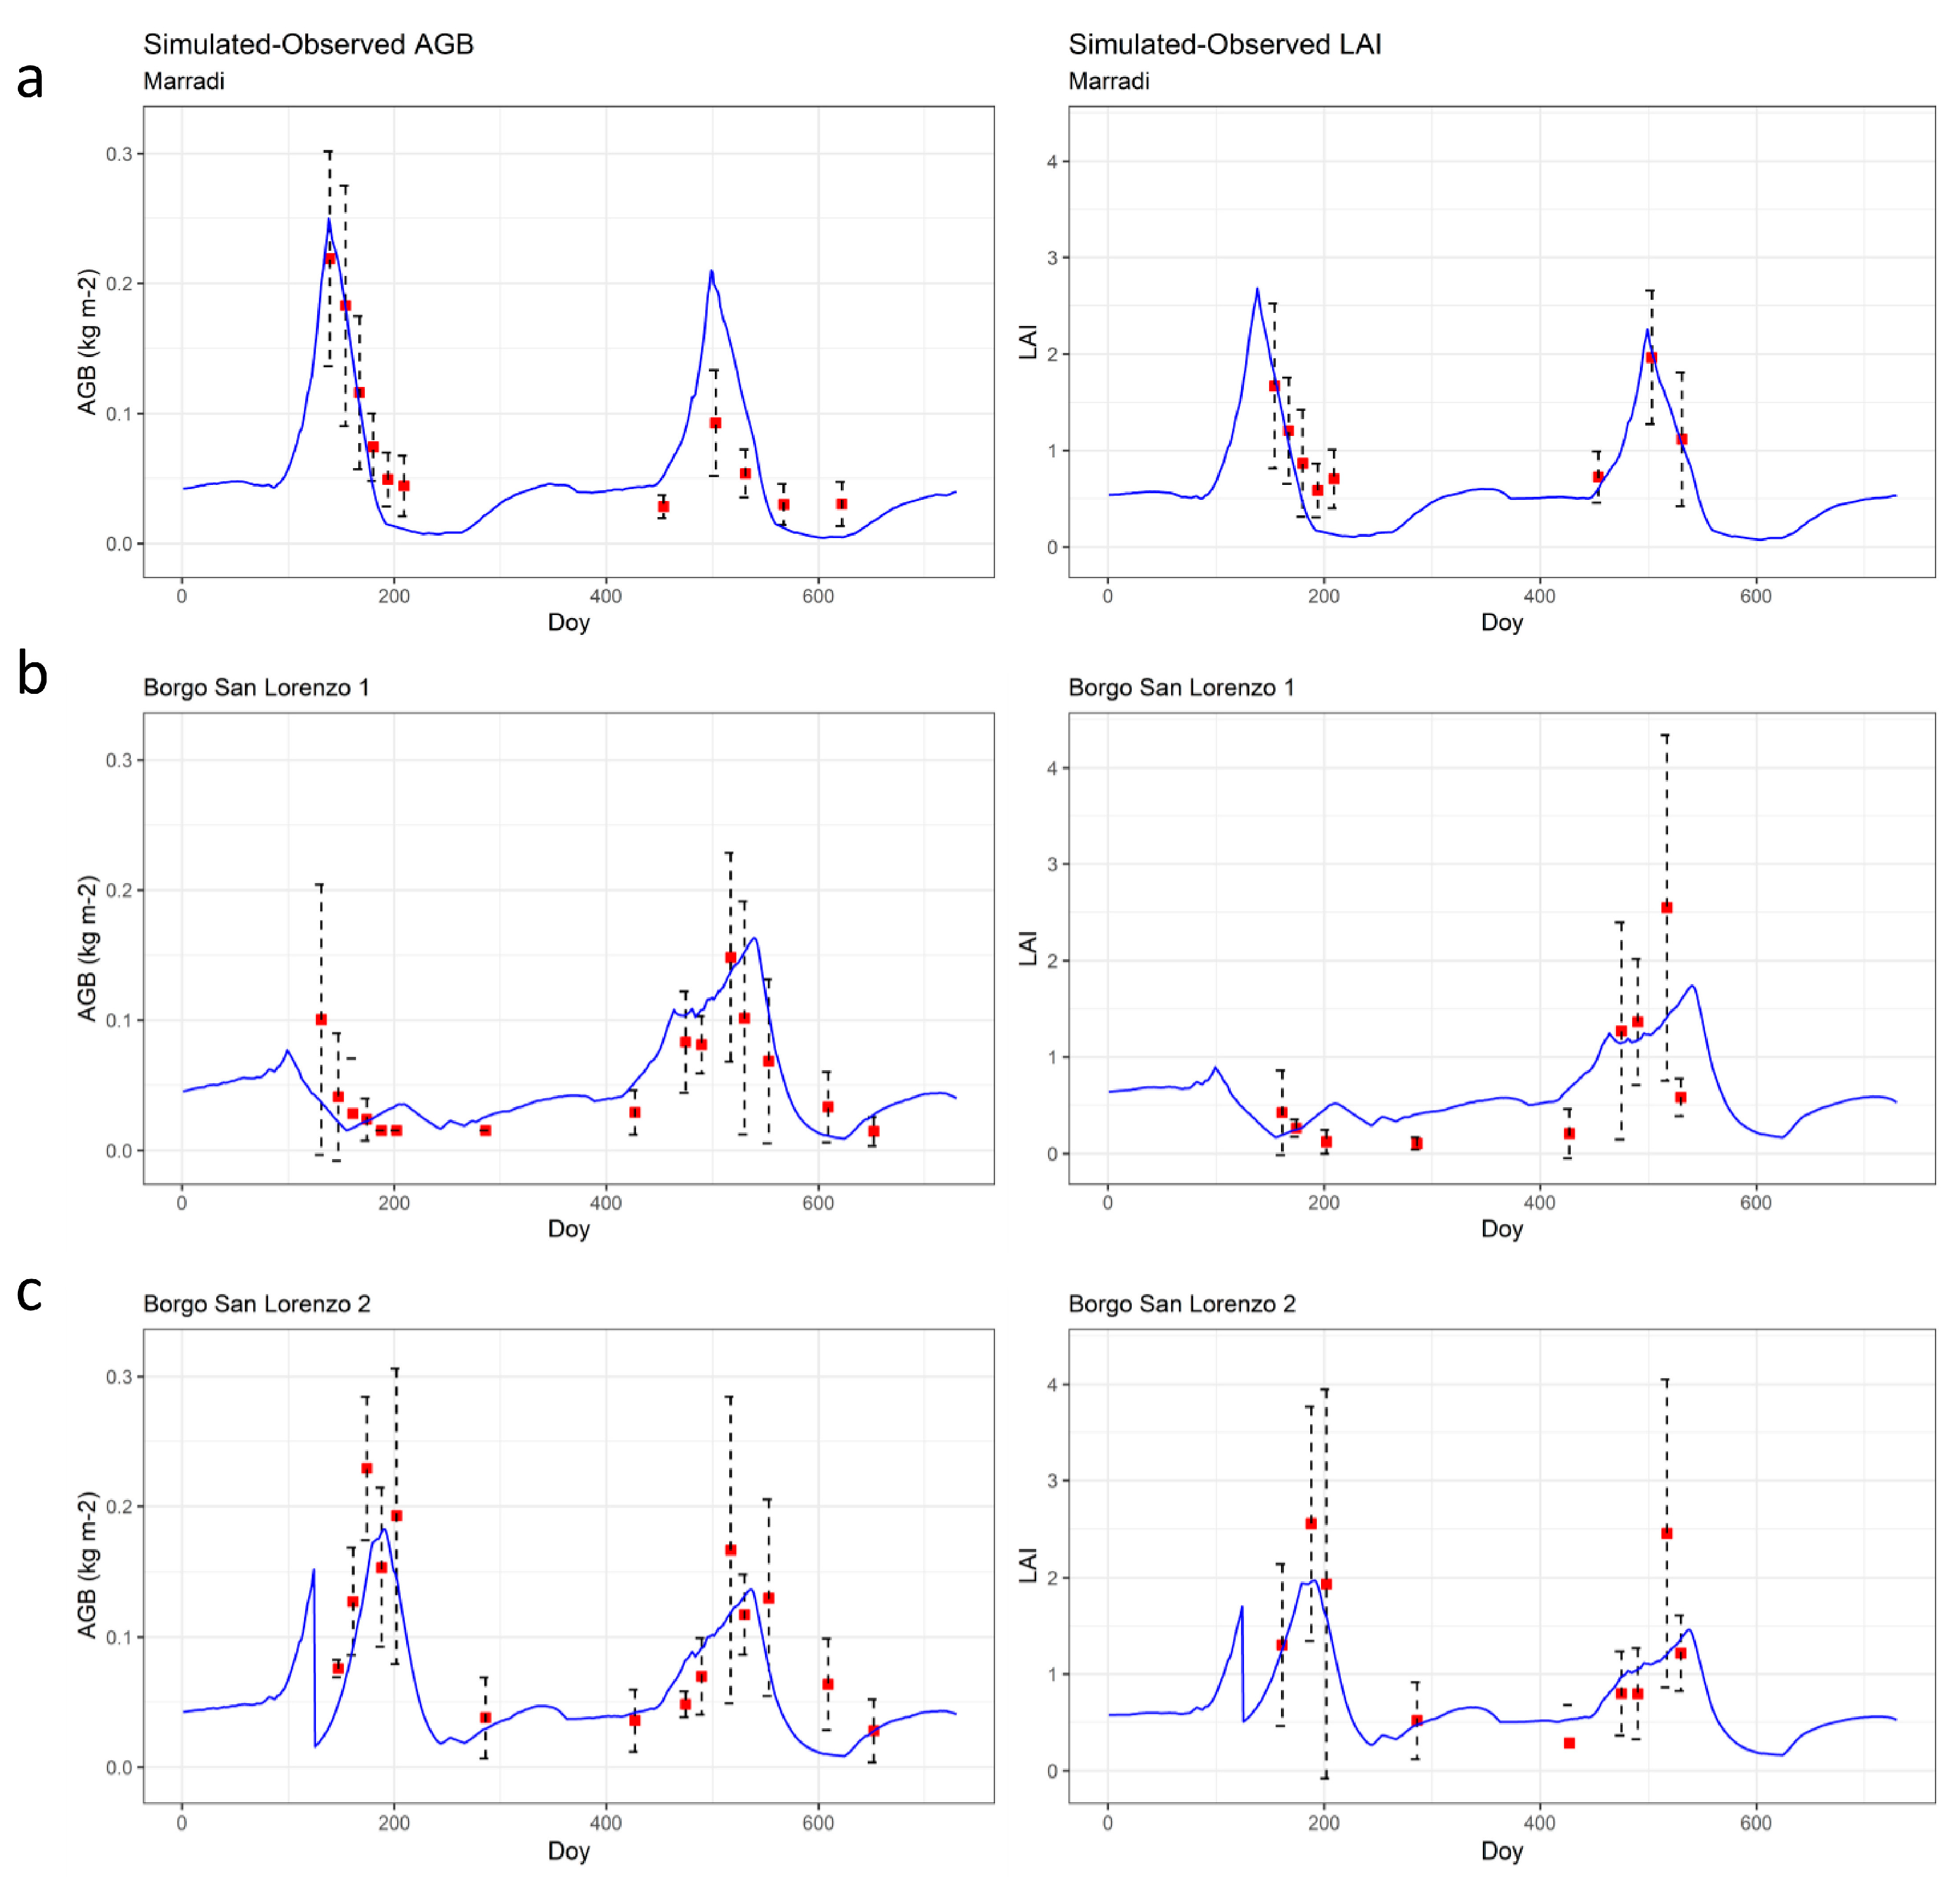
3.2. Suite 1 of Simulations: Evaluation of the Model against Observed Data

AGB simulations (Figure 4, Table 4) indicate that estimates substantially reflect patterns of vegetation dynamics (R2~0.70) although some departures from observed data are noted. The RRMSE values (<15%), in particular, suggest that the model has strong predictive ability for biomass production. This was also obtained with the LAI, with R2 < 0.50 only in sub-area B1 of Site B, where the RRMSE of ~25% was acceptable.

3.3. Suites 2, 3, and 4 of Simulations: Impacts of Future Scenarios, Sensitivity to Weather Inputs, and Adaptation Strategies
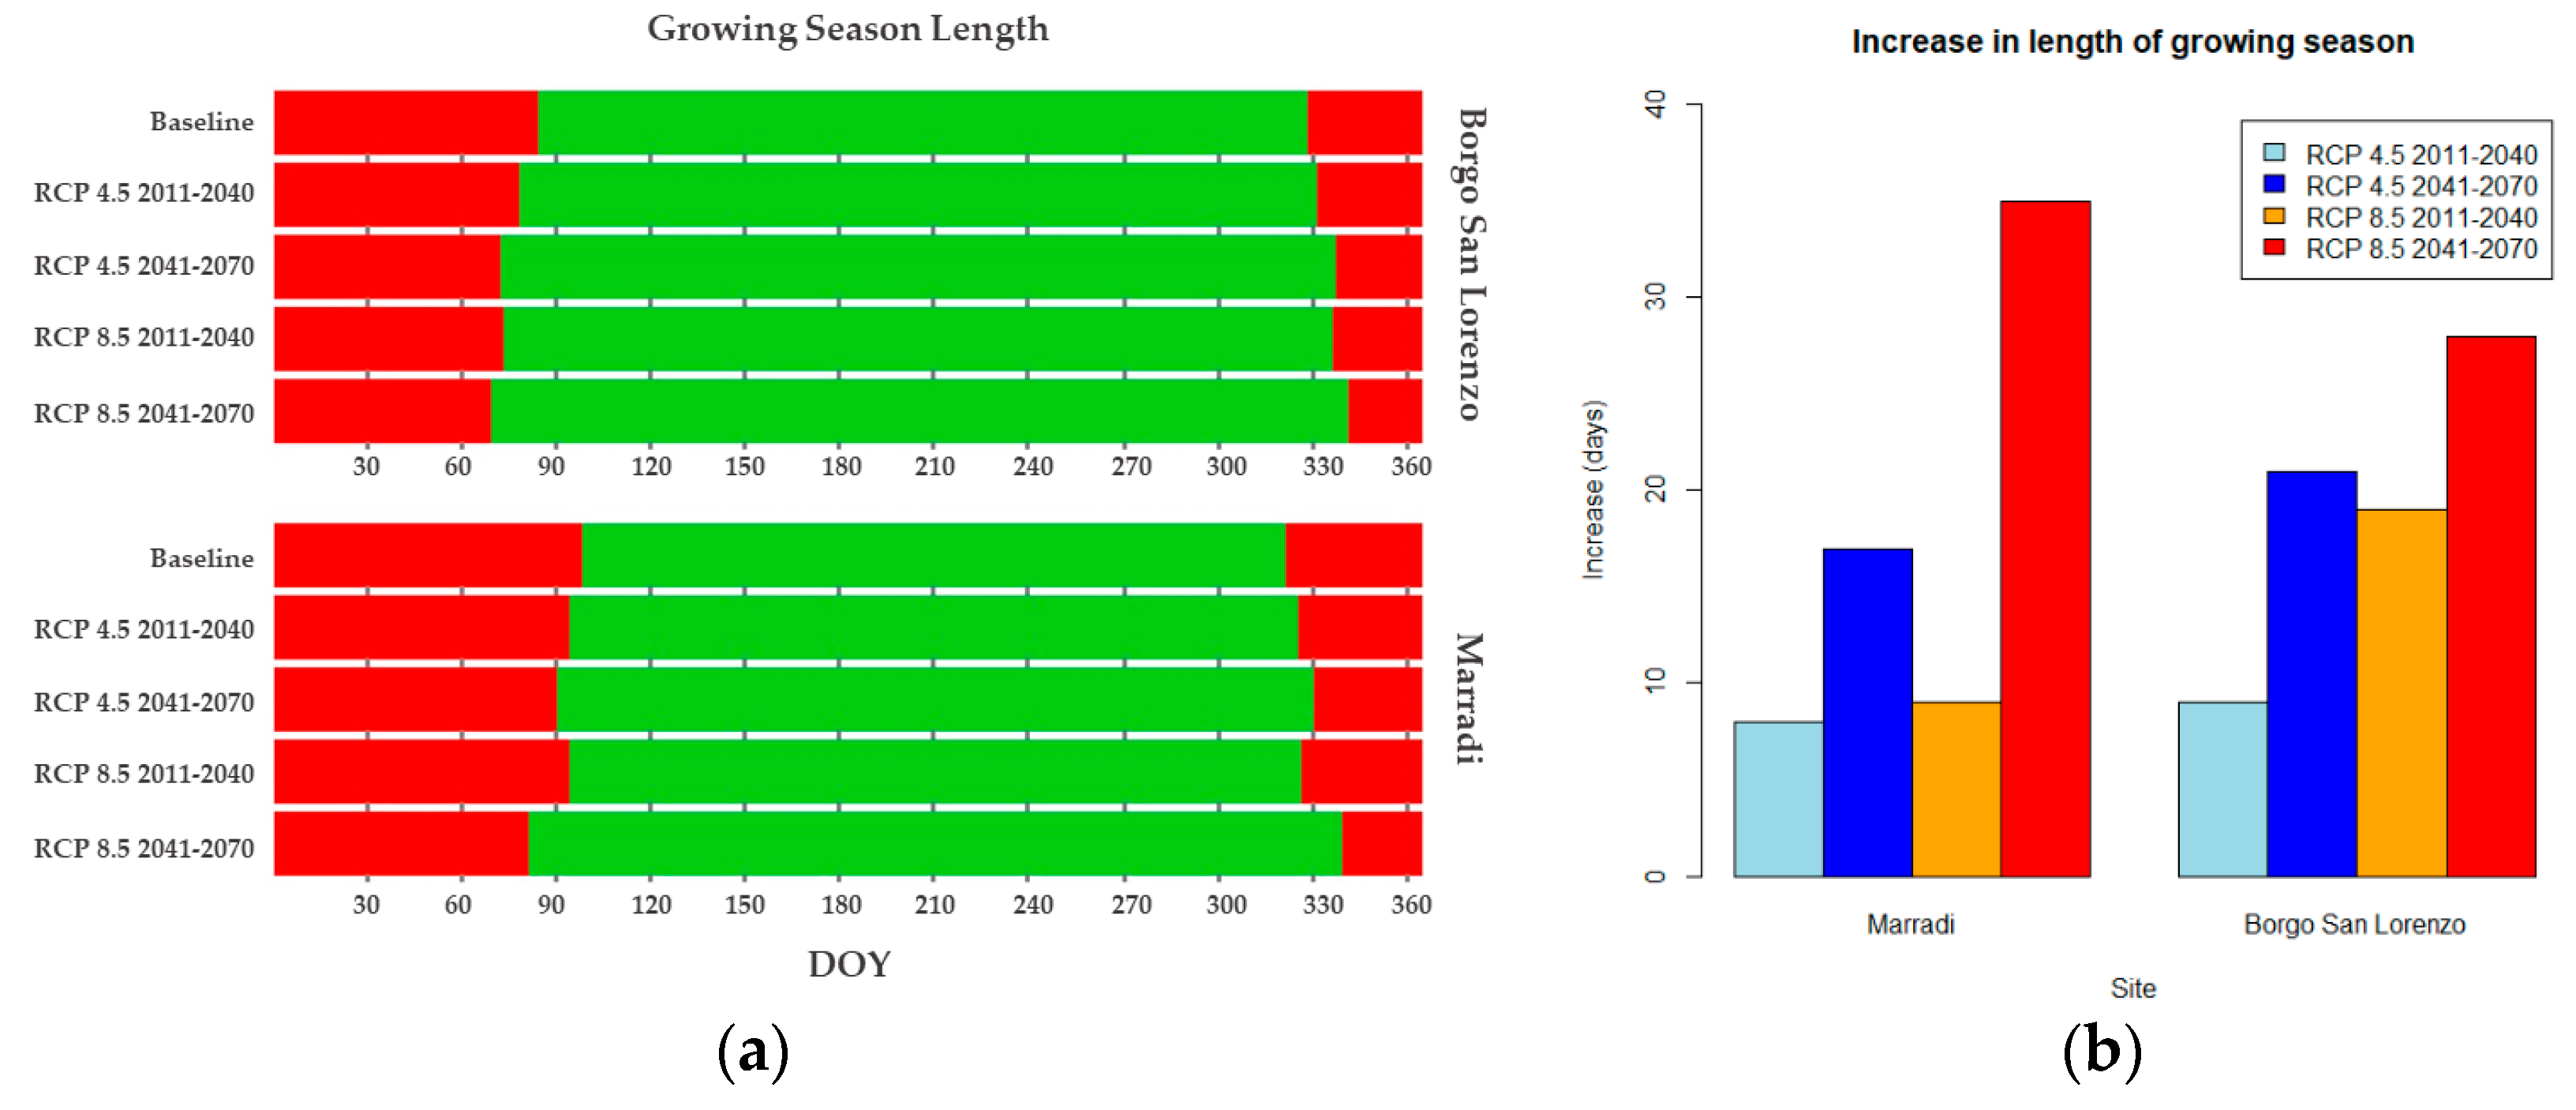
For both sites, we assessed the response of the grassland model to climate change (RCP4.5 and RCP8.5 for the ongoing and mid-future periods) with business-as-usual (BaU) management (Suite 2) and to different management options (Suite 4). Multi-year mean responses for growing season length (GS), biomass production (AGB), and biogeochemical (C-N fluxes) were calculated. Sensitivity analysis was performed without the CO2 fertilization (Suite 3) effect by observing future AGB trends over the season for the different RCPs and time periods.

3.4. Growing Season

Under the climate change scenarios, the estimated length of the growing season increases at both sites because optimal thermal conditions for vegetation growth occur earlier and later in the season. This leads to an earlier onset (GSs) and later end (GSe) of the growing season (GS) in both sites, especially in the mid-future (i.e., 2041–2070) (Figure 5). Specifically, for RCP4.5, GSs was advanced by 4 and 8 days, on average, in Site M and by 6 and 12 days in Site B for the periods 2011–2040 and 2041–2070, respectively. In addition, GSe was delayed by 3 and 9 days, on average, for the periods 2011–2040 and 2041–200, respectively, at Site M and by 4 and 9 days, on average, at Site B for the periods 2011–2040 and 2041–2070, respectively. The most pronounced differences from the baseline are visible for the RCP8.5 scenario. Earlier onsets of 4 and 17 days for Site M and 11 and 15 days for Site B under the periods 2011–2040 and 2041–2070, respectively, are accompanied by delays in GSe (5 and 18 days for Site M and 8 and 13 days for site B under the periods 2011–2040 and 2041–2070, respectively).

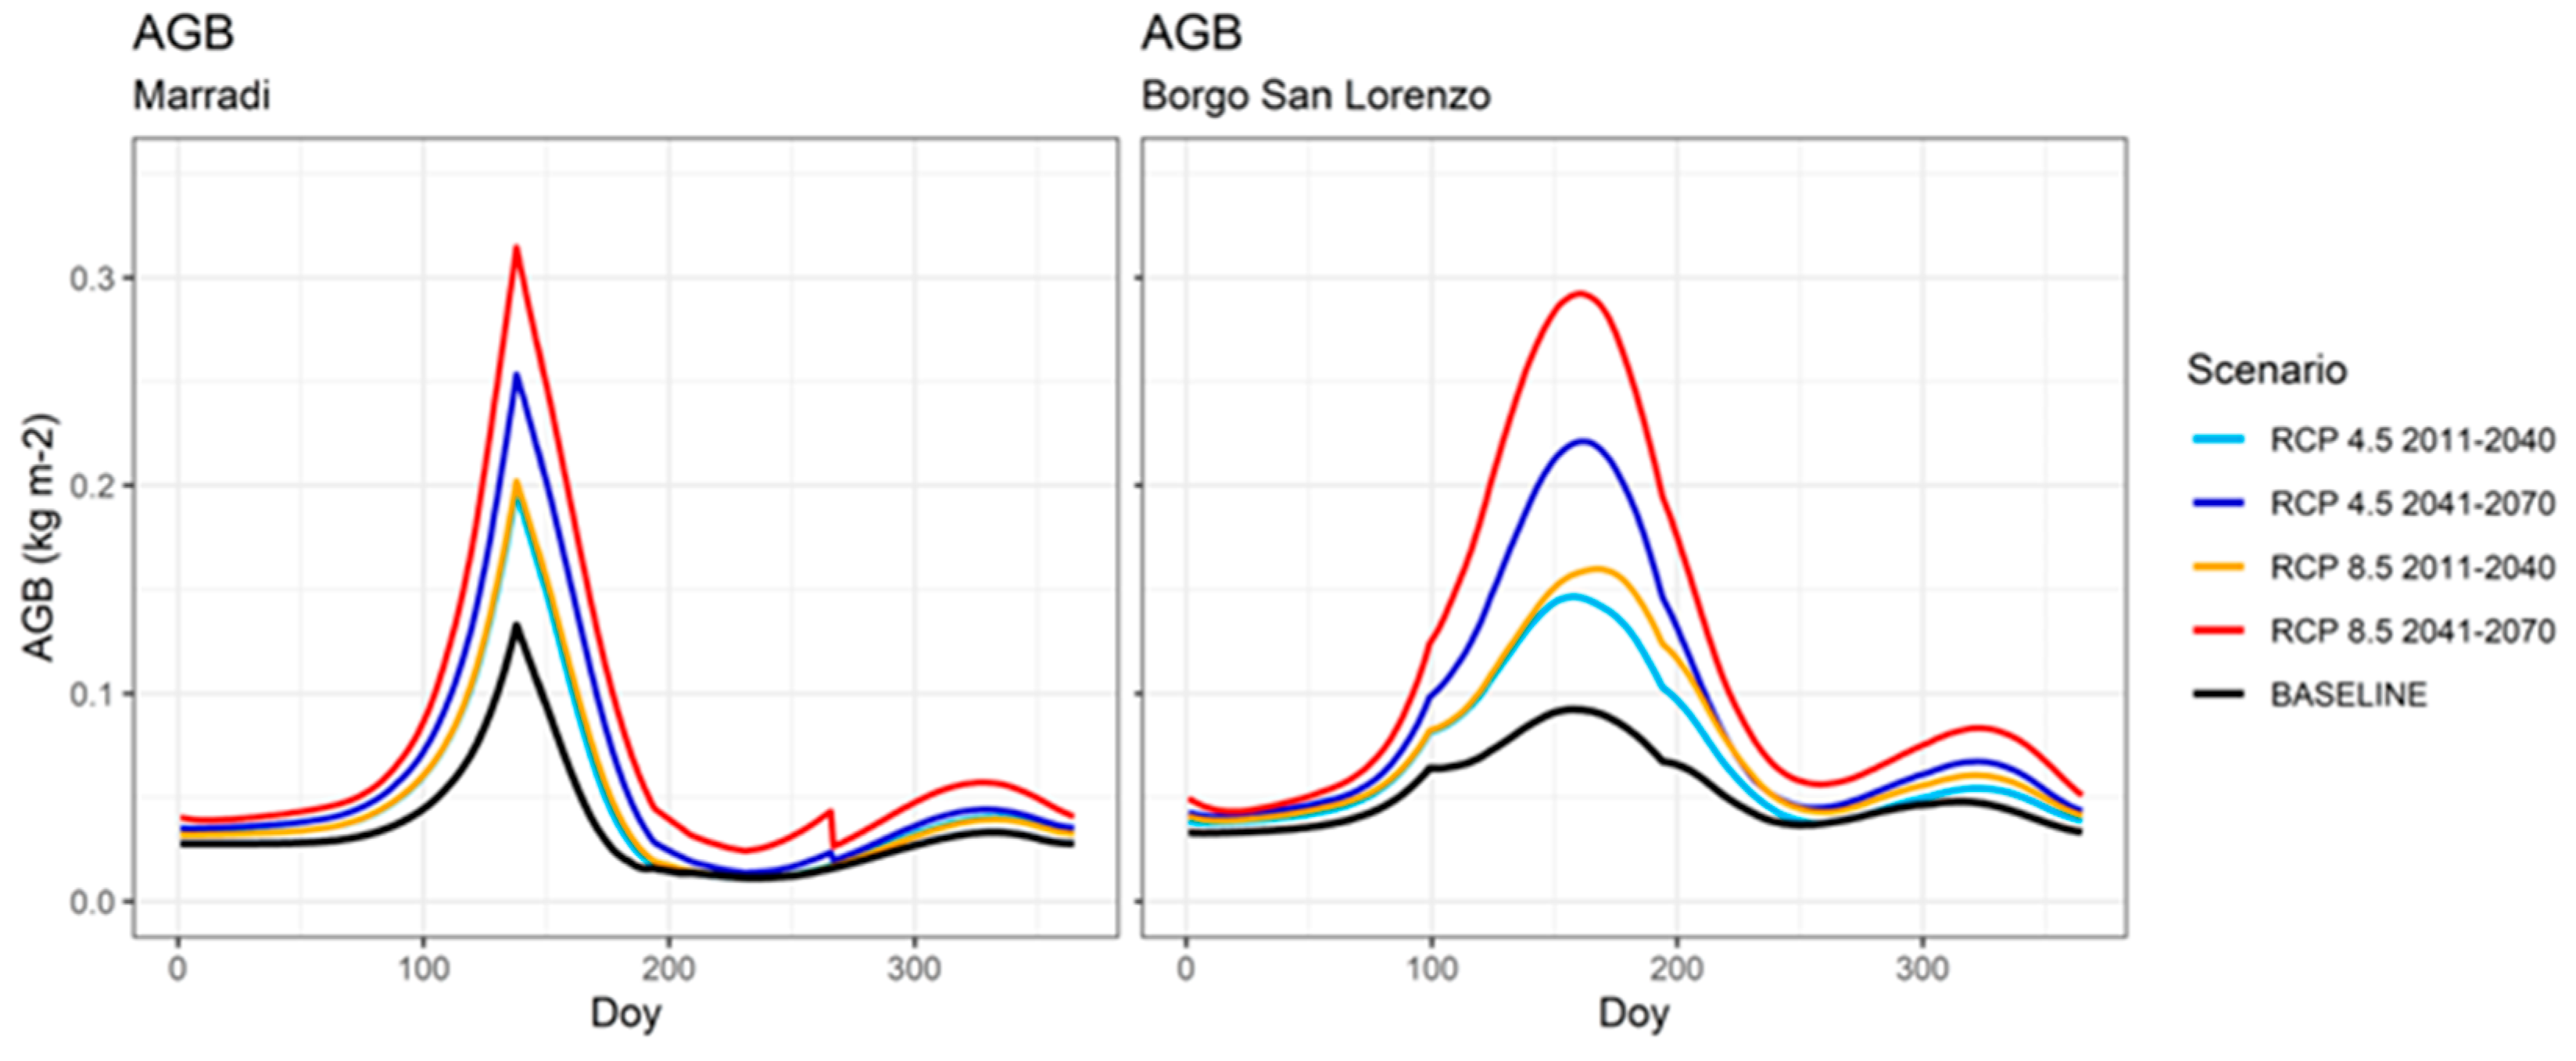
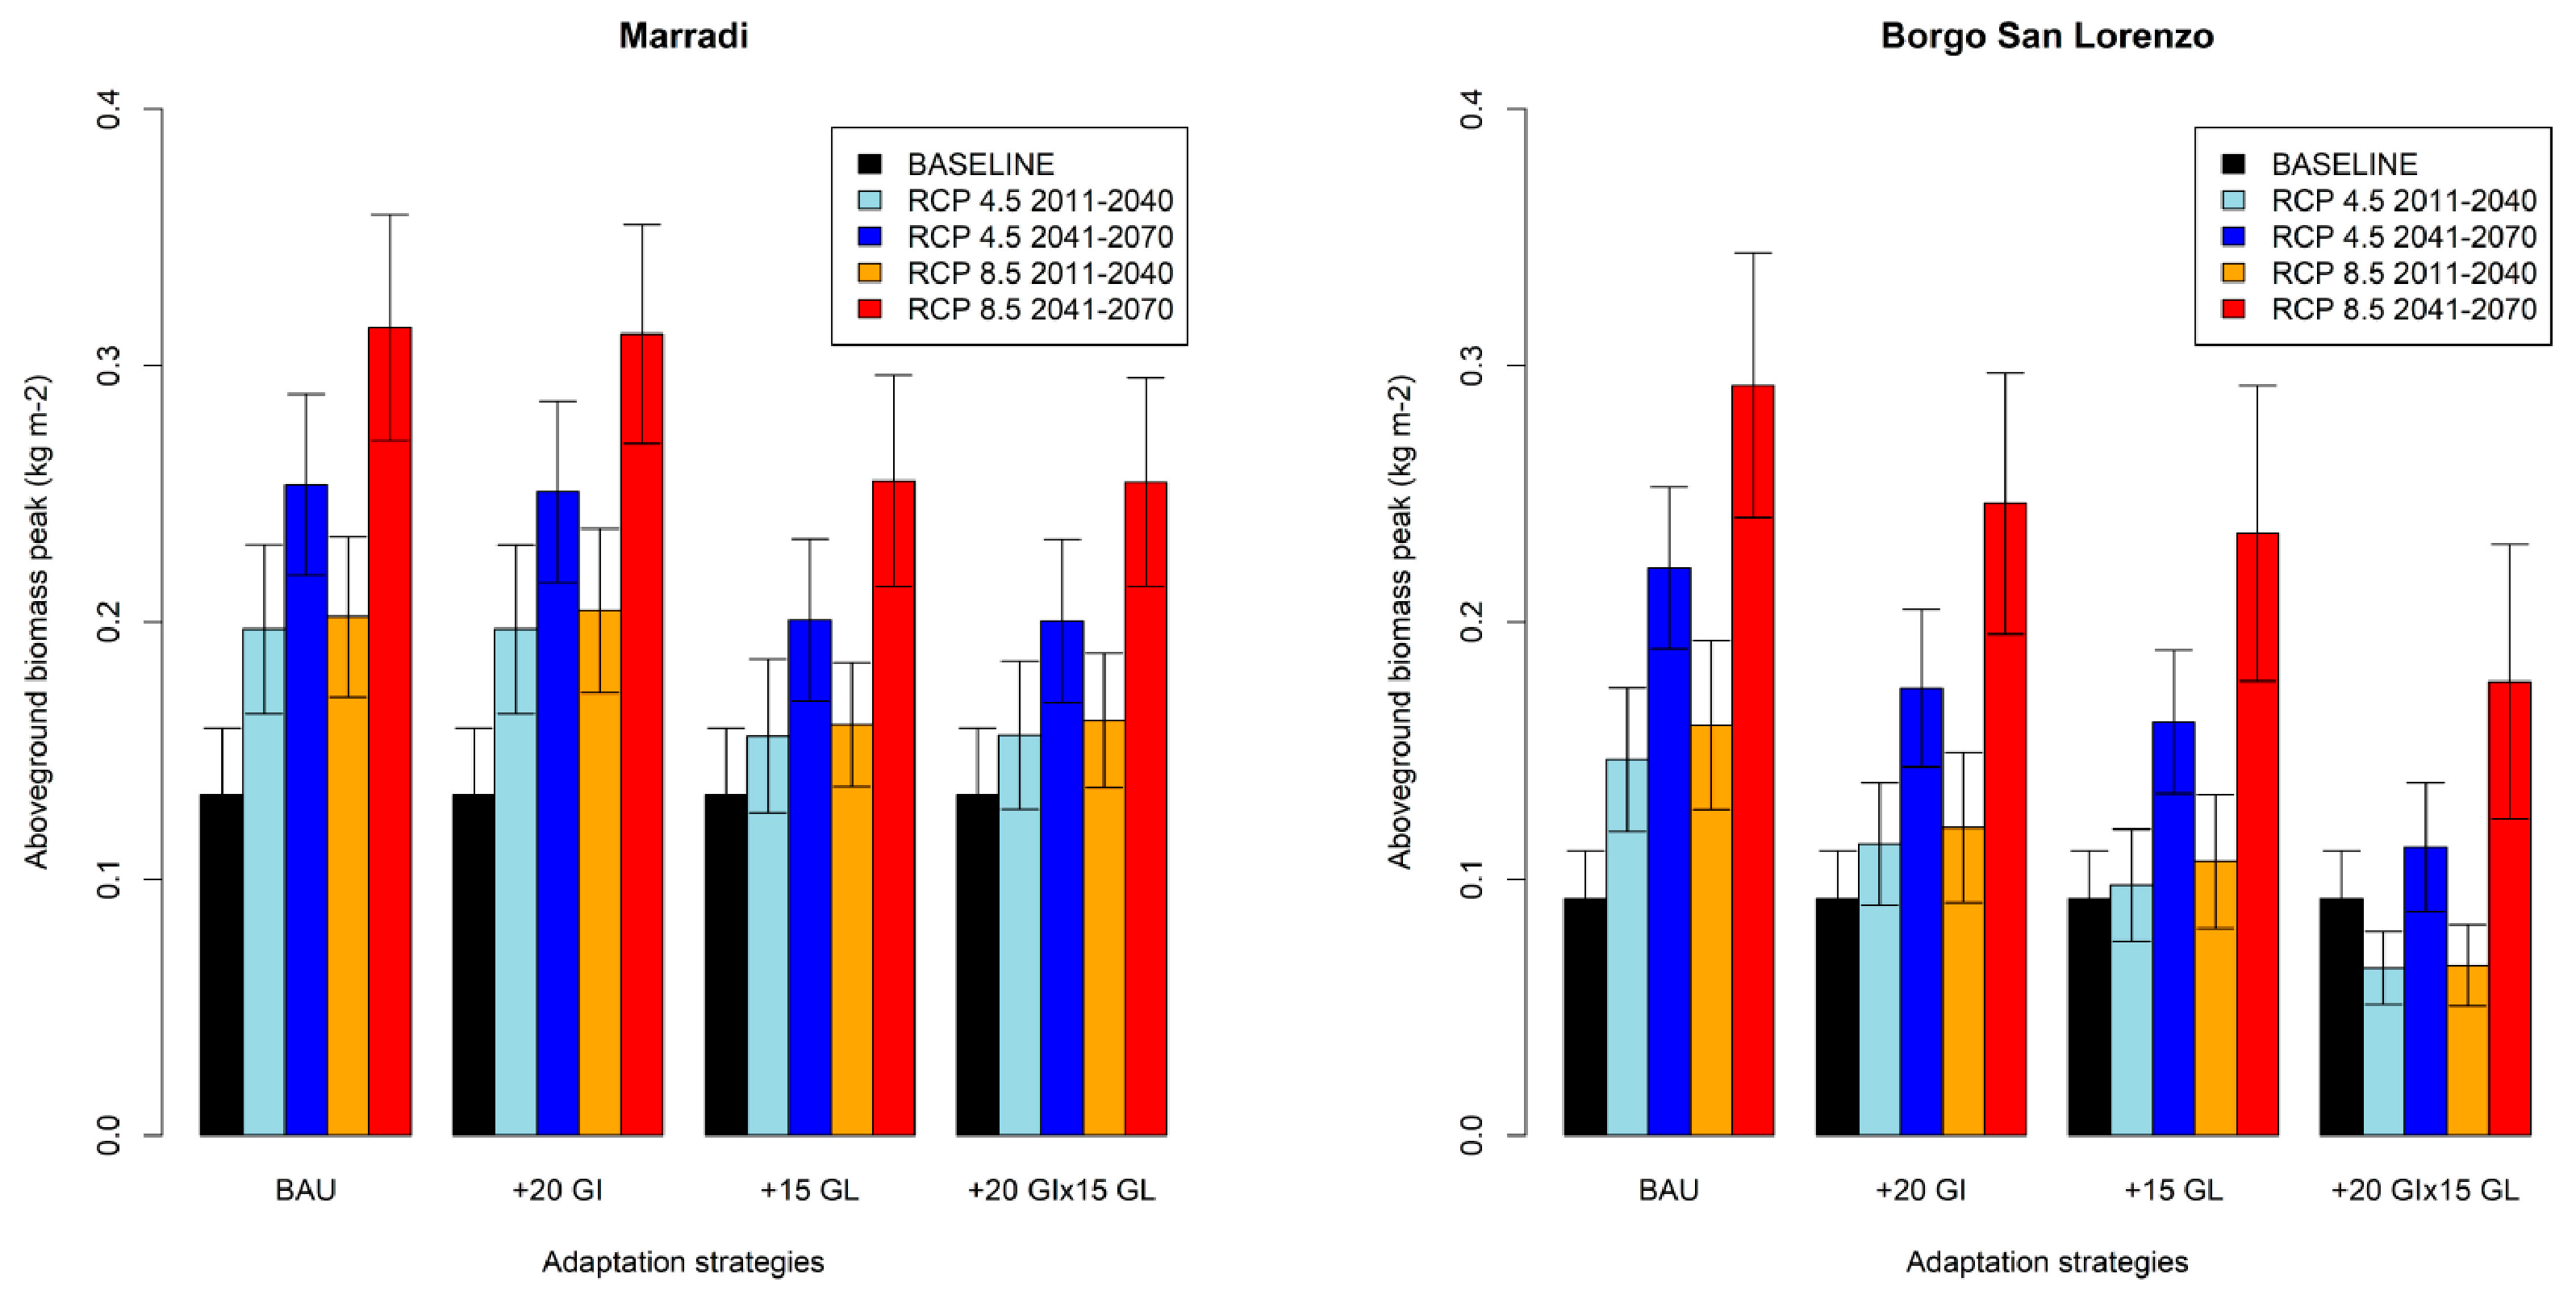
3.5. Aboveground Biomass

Figure 6 shows the AGB production patterns under BaU management in both sites for the baseline and future projections, while the AGB patterns obtained with all alternative management options can be found in the Supplementary Material (Figures S2–S5).
The main differences in AGB patterns among alternative management and climate scenarios were assessed from changes in peak biomass dates (BPd) and corresponding AGB values (BP), which strongly influence stakeholders’ and farmers’ decisions in choosing the most suitable periods for grazing.
With the baseline climate scenarios, PaSim reported peak biomass on days 138 (Site M) and 157 (Site B). With the future climate scenarios, the model indicated the same BPd at Site M (day 138) with both scenarios and time slices, as grazing starts on day 139, while Site B showed a general delay in BPd, specifically 1 to 5 days in RCP4.5 and 3 to 10 days in RCP8.5.
In the baseline scenarios, the peak biomass production (BP) is 0.13 (±0.03 standard deviation) kg DM m−2 at Site M and 0.09 (±0.02 standard deviation) kg DM m−2 at Site B. With the climate change patterns, PaSim estimated higher BP values with both RCP4.5 (by 48.4 and 90.8% at Site M and 58.9 and 139.7% at Site B, for 2011–2040 and 2041–2070, respectively) and RCP8.5 (by 52.1 and 136.9% at Site M and 73.4 and 216.8% at Site B, respectively), mainly due to the fertilizing role of CO2 in the selected emission scenarios and the absence of sensible water deficits simulated by PaSim (Figure S1). With respect to SWC, in fact, although the simulated patterns suggest that, with drier summer conditions, grassland growth may be limited by some water stress in the future, differences between the baseline and climate change scenarios are limited at both sites. In particular, no significant changes in SWC are evident during the spring period, when plant growth activity is the greatest.
To assess the effect of CO2 fertilization (Suite 3), we tested the same climate change scenarios using the mean baseline CO2 concentration (i.e., 363 ppm recorded, on average, during 1981–2010), showing that BP values under the baseline CO2 concentration did not increase to the same extent as observed for the future scenarios with higher CO2 concentration (Figure 7). Specifically, compared with the baseline, the BP increased by 24.8 and 29.5% at Site M and 10.5 and 16.5% at Site B for RCP4.5 (for 2011–2040 and 2041–2070, respectively) and by 25.2 and 50.0% at Site M and 15.4 and 27.0% at Site B for RCP8.5 (for 2011–2040 and 2041–2070, respectively).
Considering the results of Suite 2, alternative management practices (Suite 4) included: (1) livestock grazing intensity increased by 20% (i.e., +20 GI); (2) extension of the grazing period length by 15% (i.e., +15 GL), specifically 7 days earlier start and 7 days later end at Marradi, 16 days earlier start and 16 days later end at Borgo San Lorenzo; (3) combination of (1) and (2) (i.e., +20GI x 15GL). For the impact of adaptation strategies, the value of the peak biomass obtained with alternative management practices (i.e., BaU and adaptation management options) was compared with the peak biomass from business-as-usual (BaU) management under the projected scenarios (Figure 8).
According to model’s outputs, the aboveground peak (Figure 8) and the trends over the season (Figures S2–S5), obtained using the different adaptation strategies, show that future biomass availability will reach higher values when compared with the baseline, even by increasing the animal stocking rate (i.e., +20 GI) and/or the number of grazing days (i.e., +15 GL or +20 GI × 15 GL).

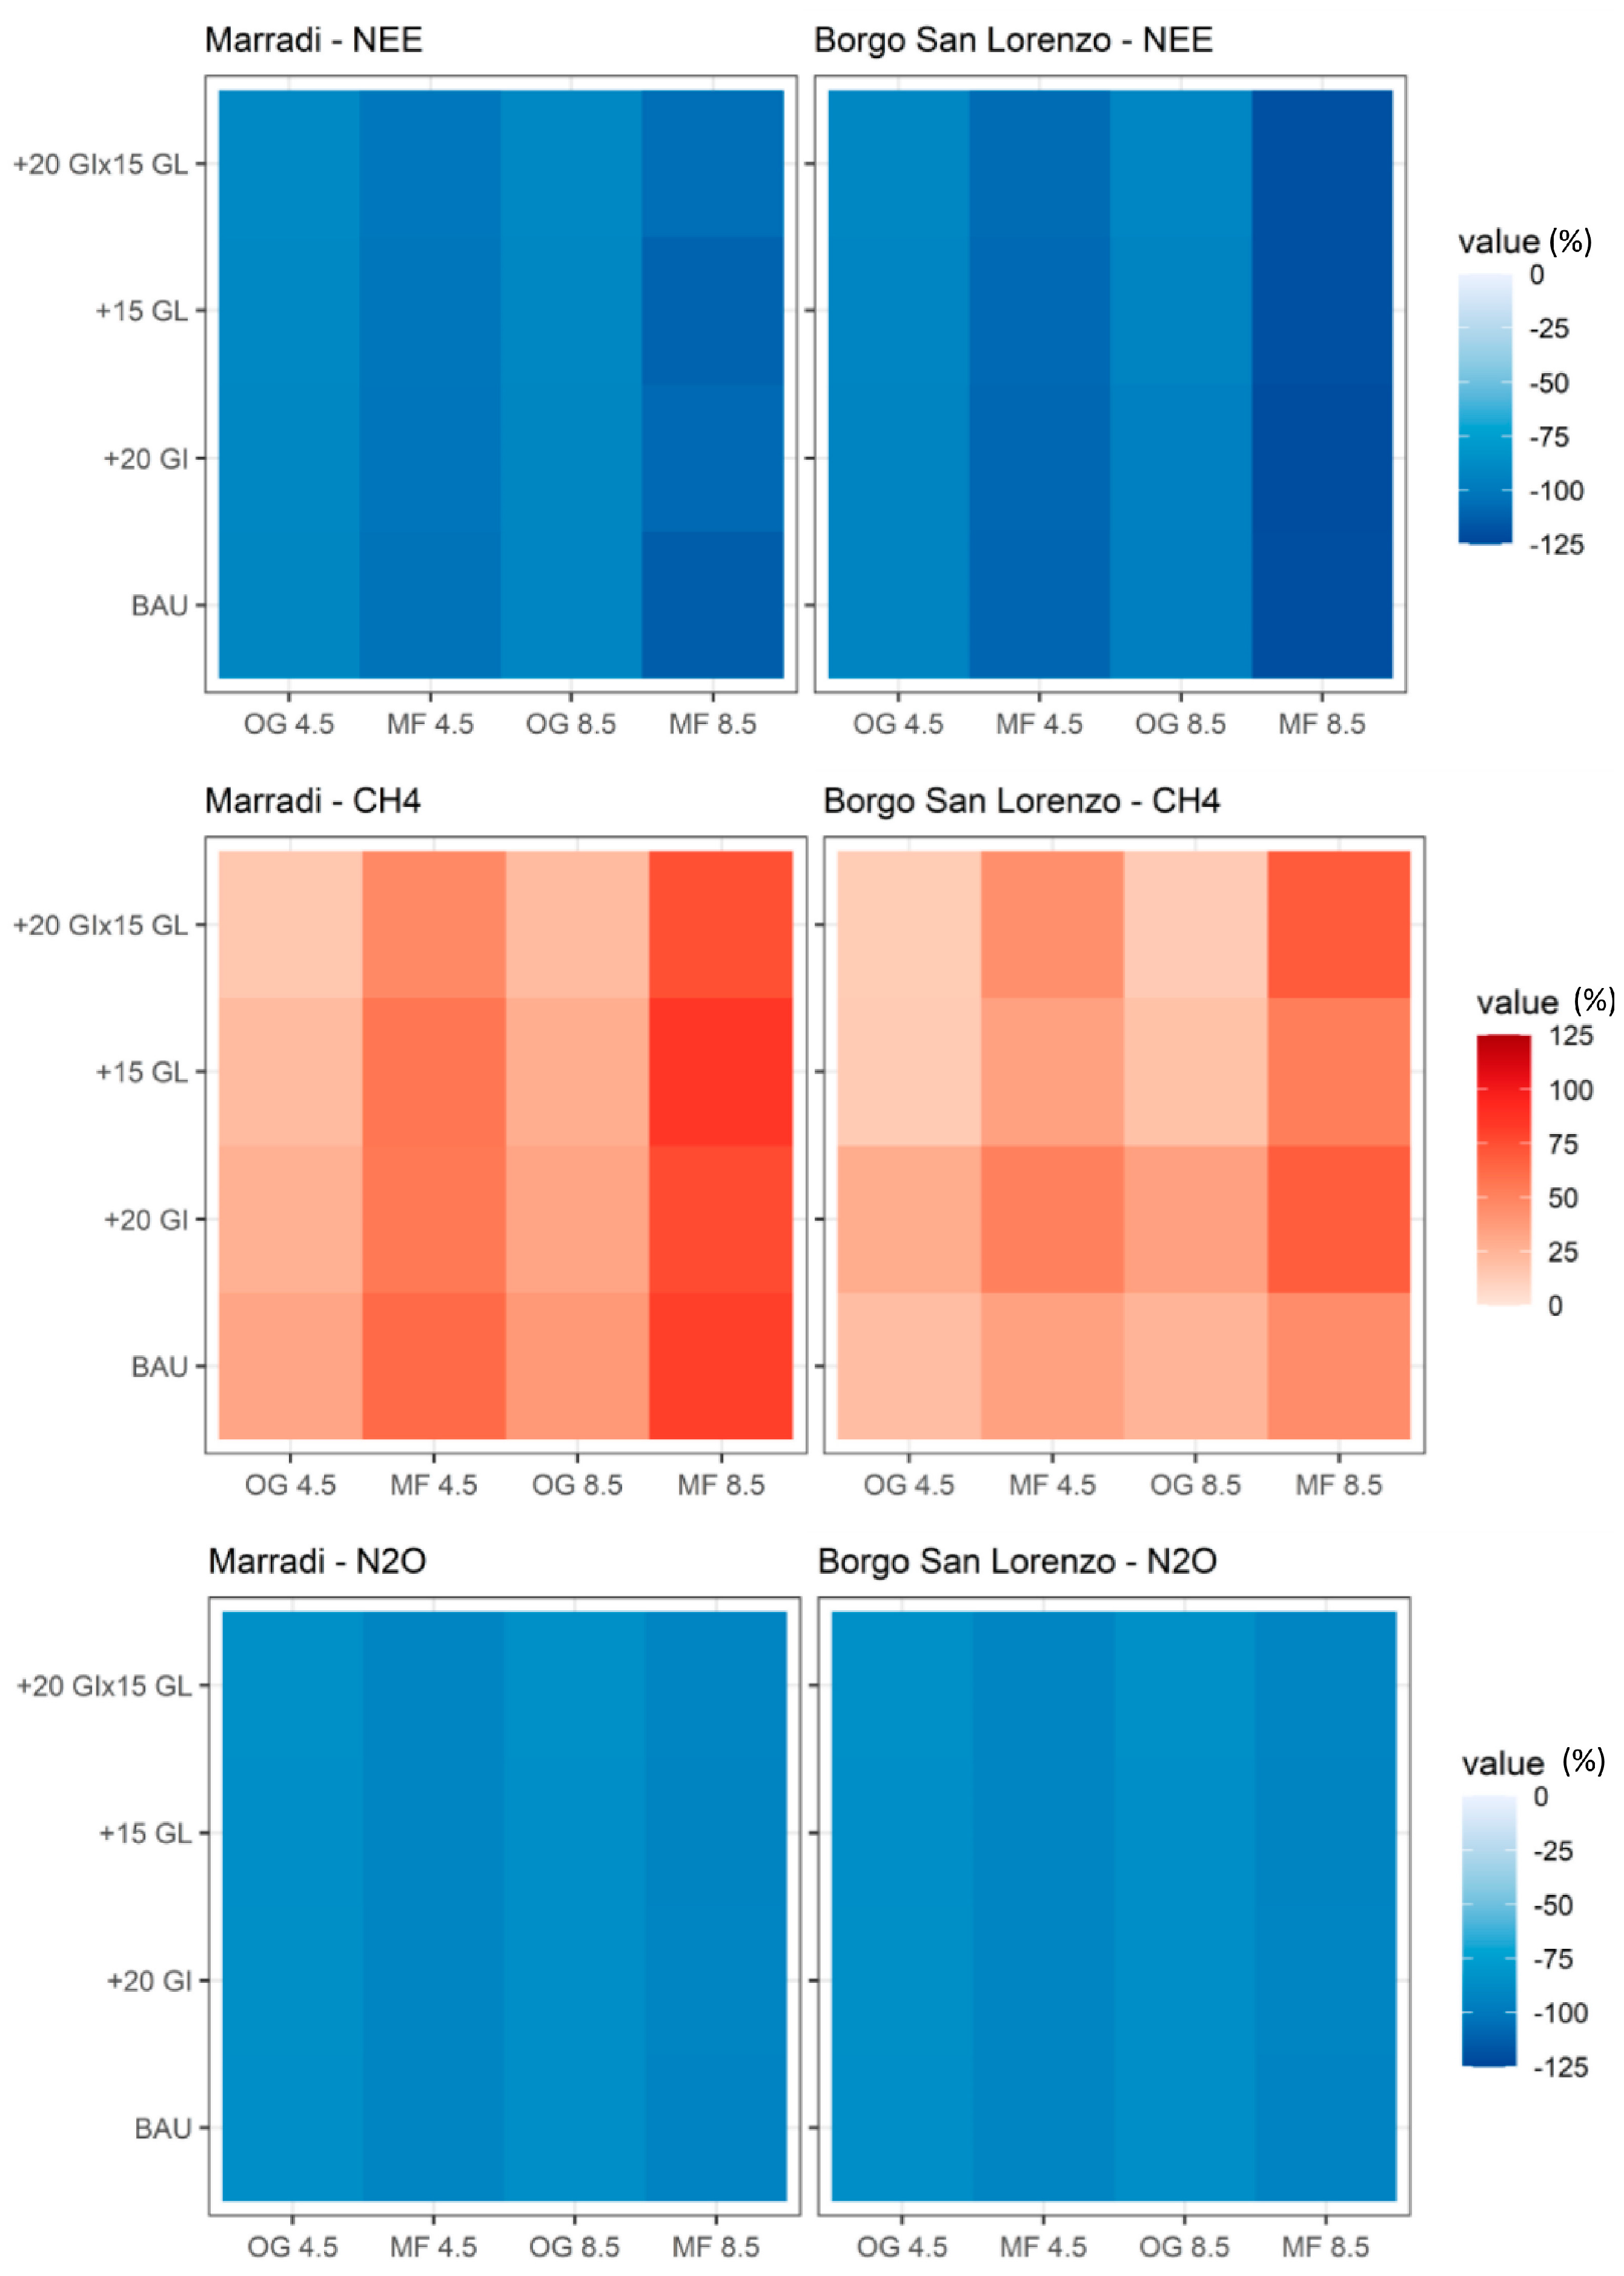
3.6. Carbon–nitrogen Fluxes

Under current climate and management conditions, PaSim shows limited non-CO2 emissions at both sites, i.e., ~2 g C m−2 yr−1 for CH4 and 4.6–4.7 g N m−2 yr−1 for N2O emissions, while the C exchanges reflect that both sites are sources of C (NEE ≥ 350 g C m−2 yr−1, Table 5).
Heatmaps of the % differences between current conditions (i.e., baseline climate and BaU management) and combinations of alternative climate and management scenarios allow the impact of altered climate and management changes on gas emissions at the two study sites to be assessed (Figure 9). For NEE, in particular, the PaSim heatmaps show overall trends towards C uptake (more negative NEE values) in both study sites by moving towards extreme climate conditions (i.e., RCP8.5 and time-frame 2041–2070), with all management options. This reflects the AGB pattern (Figure 6) resulting from a higher photosynthetic plant production from atmospheric CO2, even with increased animal respiration under the option of increased livestock density (GPP and RECO values in Table S4).
As for CH4 emissions, the PaSim heatmap indicates that emissions are higher with the warmest scenario and as livestock density increases (up to <100%). Finally, the N2O emissions estimated by PaSim tend to be lower under future climate and alternative management scenarios.

4. Discussion

4.1. Model Parameterisation

The great deal of fundamental research incorporated into the mechanistic PaSim model has ensured satisfactory estimates, which are also comparable to published grassland modeling studies [68,69]. This is relevant considering that simulations for grasslands are generally less accurate compared with arable crops [70] since large uncertainties in biomass and LAI measurements cause simulation of grassland vegetation dynamics to be difficult to perform [67,71].
This was obtained with calibrated parameter values (Table S3) that do not deviate substantially from those obtained in previous studies on continental and Mediterranean grasslands. For instance, the maximum specific leaf area, slam = 27.2 m2 kg−1, is similar to slam = 29 m2 kg−1 obtained in the Europe-wide calibration of Ma et al. [59]. Light-saturated leaf photosynthetic rates for reproductive (pmco2rep = 12.88 μmol C m−2 s−1) and vegetative (pmco2veg = 9.49 μmol C m−2 s−1) stages are similar to the values obtained for Mediterranean grasslands (pmco2rep = 14.0 μmol C m−2 s−1 and pmco2veg = 10.0 μmol C m−2 s−1) from Pulina et al. [60]. The root and shoot turnover rates at 20 °C, kturnrt20 = 0.0155 d−1 and kturnsh20 = 0.0468 d−1, respectively, exceed those estimated by Pulina et al. [60] for grasslands dominated by annual self-seeding plant species: 0.0144 d−1 and 0.0250 d−1, respectively. With the obtained calibration, the shoot turnover parameter dwindled to approximately 21 days (1/0.0144 d−1), which is lower than 40 days (1/0.0250 d−1), as in Pulina et al. [60]. In fact, perennial plants tend to invest mainly in long-lived and competitive adult individuals, and, consequently, shoot turnover tends to be faster in perennial plants than in annual species, as the former allocate more resources for new leaf growth to maximize photosynthetic efficiency [72].

4.2. Uncertainties in Climate Change Impacts and Adaptation Strategies

The adopted impact model was widely applied in various contexts [59,60,73,74], dealing with multifaceted territorial and vegetation structures and extreme weather conditions, which are often difficult to parameterize [75] due to the complex response of the vegetation growth with respect to critical thresholds (e.g., air temperatures, water requirements, and radiation use efficiency) for mixed plant communities [17]. In this study, PaSim represented the effects of climate change and management options on the timing and extent of the growing season and C-N fluxes, together with biomass production and peaks. The longer growing season length was due to the extension of the potential growing season in both spring and autumn, as already observed in grasslands during the last decades [76,77]. The mean plant growth trend simulated with the model (30-year means) mirrors the observed pattern of vegetation growth during the growing season, indicating that the overall pattern of response to elevated atmospheric CO2 concentration significantly stimulates leaf photosynthesis [78,79]. Sensitivity analysis performed in Suite 2 highlighted this fertilization effect of increased CO2 concentration simulated by PaSim; nevertheless, it must be underlined that similar trends of increased aboveground biomass in both future climate change scenarios and time periods are visible also with steady CO2 concentration (i.e., baseline concentration, 363 ppm), albeit to a lesser extent. In addition, although a down-regulation strategy can be useful to limit the effect of increased CO2 concentration on plant growth [80], it is worth emphasizing that the production increases projected for the mid-future (2041–2070) resulted in being particularly high when compared with a baseline that reflects a situation of the near past (period 1981–2010). When compared, instead, with the ongoing period (2011–2040), which reflects average aboveground biomass values similar to the present and to the calibration period, the increases are smaller, comparable to those found in other studies [81,82]. The CO2 positive effect is reflected in the higher C uptake estimated by PaSim as a result of increased productivity, also with higher stocking rates (i.e., higher C losses due to higher animal respiration), which confirms the increased worldwide productivity of grasslands exposed to increased CO2 [83].
PaSim estimated increasing CH4 emissions and decreasing N2O emissions with climate scenarios. The former logically reflects evidence that grasslands emit more CH4 at higher temperatures [84]. Although the latter does not reflect the direct effect of temperature on the enzymatic processes involved in N2O production, N2O emissions are controlled mainly by soil properties and current soil N levels [85], which may have been reduced with increased plant demand due to higher biomass production under climate scenarios. This increase in future biomass production, driven by the higher average annual GPP (gross primary production), also led to a consequent decrease in simulated NEE over the years.

4.3. Consequences for Grassland Sustainability

Herders depend on pasture and water resources for their livestock and are among the groups most vulnerable to climate change impacts in dry regions [39,86,87,88,89]. Although there are reasons to be concerned, some impacts of climate change are expected to be positive. Foreseen climate variability can be an opportunity for effective management, as actions could be timed to the most effective conditions, and climate change could be a motivation to develop a broader and more responsive and collaborative management paradigm. We showed that increases in plant productivity and longer growing seasons in central Italy may support more livestock and increase economic benefits. Rising air temperatures simulated by climatic models, combined with increasing concentrations of CO2 in the atmosphere in RCP4.5 and RCP8.5 scenarios, are expected to offer important opportunities in terms of forage production for livestock systems in central Italy. This is possible if future water availability is not a limiting factor, as stressed by various research studies on grassland potential production [90]. Indeed, as seen from the results of climatic models, precipitations are expected to decrease in the future, mostly in summer months but not particularly in spring. The availability of water in the soil, therefore, does not vary significantly over time and future climate change scenarios, as is visible from the soil water content simulated by PaSim (Figure S1). These trends on future pasture productivity are consistent with other studies, originating also from different geographical sectors. Already in the understanding of Rounsevell et al. [91], it seemed unlikely that climate change would have a negative impact on grasslands in England and Wales, while Riedo et al. [48] predicted a positive effect on grassland productivity in central Europe. Additionally, in the case of grasslands in the United States, pasture production is generally expected to increase under projected climate scenarios [92]. Moreover, Morales et al. [93] predicted an increase in grassland productivity in Europe, albeit with significant regional variability. In this regard, it should be emphasised that the impacts of climate change on grazing systems may be region-specific [94].
Adaptation strategies must face different and opposite effects on rangeland productivity, as already previously pointed out [95,96], and in some cases, it is foreseen that climate change can produce a positive effect, being able to support greater livestock numbers [97] and to lengthen the duration of the grazing season due to a higher herbage availability early in the year [98]. In our study, we provided clues for increasing stocking rates and extending grazing periods (mainly by putting animals out to pasture earlier) to take advantage of the change in seasonality and increased forage production compared with the baseline (1981–2010), especially in the mid-future (i.e., 2041–2070). The possibility of having an earlier vegetative recovery that prolongs the duration of the grazing season allows, along with the higher productivity assumed, an increase in animal density, and, in this way, a biomass intake more consistent with the forage availability. Consequently, these conditions allow a more efficient management of the resource [99] with less waste and a more adequate stocking rate, a factor that ensures less degradation of the pasture itself [100]. Results confirm these opportunities also comparing mid-future aboveground biomass under adaptation strategies (peak and trend, Figure 8 and Figures S2–S5) with those of the ongoing period under BaU (i.e., 2011–2040), which is the condition most similar to the one of calibration. In this view, it is, however, important to emphasize that in the simulation of adaptation strategies, the model does not specifically consider the role of increased animal stocking rate and/or duration of the grazing season on soil compaction, a condition that may disadvantage forage quality, vegetation regrowth, and biodiversity [101,102]. In addition, warming and altered rainfall patterns may reduce the forage quality and palatability of Italian grasslands [6]. Indeed, climatic changes, as well as land-use changes, have already strongly modified the botanical composition, species distribution, and size of grasslands in the central Italian massifs since the 1950s [43]. The observed floral, ecological, and structural variations confirm that grassland ecosystems in mountainous environments in Italy have undergone a process of thermophilization, with an evolutionary trend towards more nutrient-demanding vegetation [34,42]. Variations in vegetation composition in response to increased competition for environmental factors indicate, at higher altitudes, less displacement of plant species from higher slopes as well as dispersal of species from south-facing to north-facing slopes, with greater presence of grass- and shrub-dominated communities replacing rare and cold-tolerant species [103]. This reflects the narrower thermal niche of mountain plant species, which makes short-term adaptation/acclimation more difficult [104]. As a narrow thermal niche prevents plant species from adapting quickly to high altitudes, site elevation explains the response of species richness to warming [105]. Indeed, although changes in species cover and plant community composition indicate an accelerated transformation to more heat-demanding vegetation, this colonization process may occur at a slower rate than the continued decline of cryophilic species, favoring periods of accelerated species decline [106].
The analyses performed in this study identified the possible impacts of climate change on a typical grazing system of the Apennines in Central Italy, highlighting future trends of different system characteristics, such as length of the growing season, pasture productivity, soil water conditions, and gas emissions, as well as possible alternative management strategies in a context of future climate change. In fact, the results obtained in this study highlight the potential of employing specific models for simulating the behavior of pastoral resources under actual utilization and different future scenarios (i.e., RCP4.5 and RCP8.5), testing adaptation management options. In this sense, the study has produced a significant step forward compared with previous studies that analyzed climate change impacts on Apennine grasslands, mainly with regard to the botanical evolution of the plant communities, by providing insights on future agronomic conditions and possible adaptation strategies. The modeling approach used has, thus, been demonstrated to be a useful tool to support the management decisions that breeders will have to make in the near future.

5. Conclusions

The results of this study represent a step forward in the knowledge of the impacts of future climate change on a typical pasture system in the central Apennines. Specifically, this study fills a lack of information on future grassland development, as well as providing detailed information on the length of the growing season, GHG emissions, water conditions, and the effectiveness of different adaptation strategies in response to the increase in forage production simulated by PaSim in future scenarios. In particular, the analysis of adaptation strategies investigated possible management changes to cope with climate change impacts, providing useful indications to stakeholders and policy-makers for appropriate agricultural policy and optimal land management strategies for ongoing climate change.
However, while modeling approaches capture distinct aspects of the adaptive process, they have done so in relative isolation from the use of other technological supports (e.g., remote sensing and precision farming) and participatory approaches, without producing improved unified representations. As well, management options to sustain grassland ecosystems under global change are many and need to be tested for their ability to maintain or enhance resource values in the future. Social impact assessment studies are, thus, needed to examine how the impacts, i.e., the effects of climatic anomalies on the performance of Apennine pastures, propagate through the socio-economic and political systems. This type of integrated approach, which would include the potential for adaptation and adjustment to climate pressure, would reflect the reality of pastoral communities much better than the modeling used and raises fruitful research questions regarding the vulnerability of Apennine territories and their adaptive capacity.

Supplementary Materials

The following supporting information can be downloaded at: https://www.mdpi.com/article/10.3390/land12020351/s1, Table S1: Aboveground dry matter biomass (AGB) and leaf area index (LAI) collected in 2020 and 2021 in the two study-sites (sample mean and standard deviation of eight sub-samples in Marradi and four sub-samples in Borgo San Lorenzo); Table S2: Climate models used in this study, an indication of their origin (institute), version, realisation and frequency. The suffixes i and p of each realisation (r) indicate the initialisation and physics indices, respectively; Table S3: Summary of the PaSim parameters considered for the calibration; Table S4: Simulated flux components (30-year mean) from the two study-sites for the baseline (1981–2010) and climate scenarios (RCP4.5 and RCP8.5) under different management options, estimated using PaSim (GPP: gross primary production; RECO: ecosystem respiration; NEE: net ecosystem exchange). +20 GI represent a 20% rise in animal stocking rate, 15 GL a 15% increase in grazing length and +20 GI × 15 GL a combination of these two management factors. RCP4.5 and 8.5 are the different Representatives Concentration Pathways used in the simulations; Figure S1: Daily simulation (30-year mean) of 0.35-m soil water content (SWC) with PaSim for baseline and climate-change scenarios under business-as-usual management at both study-sites. RCP4.5 and 8.5 are the different Representatives Concentration Pathways used in the simulations; Figure S2: Daily simulation (30-year mean) of aboveground biomass (AGB) with PaSim for climate-change scenarios under different adaptation strategies at Marradi site for 2011–2040 period. +20 GI represent a 20% rise in animal stocking rate, 15 GL a 15% increase in grazing length and +20 GI × 15 GL a combination of these two management factors. RCP4.5 and 8.5 are the different Representatives Concentration Pathways used in the simulations; Figure S3: Daily simulation (30-year mean) of aboveground biomass (AGB) with PaSim for climate-change scenarios under different adaptation strategies at Marradi site for 2041–2070 period. +20 GI represent a 20% rise in animal stocking rate, 15 GL a 15% increase in grazing length and +20 GI × 15 GL a combination of these two management factors. RCP4.5 and 8.5 are the different Representatives Concentration Pathways used in the simulations; Figure S4: Daily simulation (30-year mean) of aboveground biomass (AGB) with PaSim for climate-change scenarios under different adaptation strategies at Borgo San Lorenzo site for 2011–2040 period. +20 GI represent a 20% rise in animal stocking rate, 15 GL a 15% increase in grazing length and +20 GI × 15 GL a combination of these two management factors. RCP4.5 and 8.5 are the different Representatives Concentration Pathways used in the simulations; Figure S5: Daily simulation (30-year mean) of aboveground biomass (AGB) with PaSim for climate-change scenarios under different adaptation strategies at Borgo San Lorenzo site for 2041–2070 period. +20 GI represent a 20% rise in animal stocking rate, 15 GL a 15% increase in grazing length and +20 GI × 15 GL a combination of these two management factors. RCP4.5 and 8.5 are the different Representatives Concentration Pathways used in the simulations.

Author Contributions

Conceptualization, G.B. and E.B.; methodology, G.B., E.B., R.M. and S.C.-A.; software, R.M. and G.B.; validation, E.B., G.A., M.M. and C.D.; formal analysis, R.M. and E.B.; investigation, G.A., C.D., N.S., E.B., S.C.-A. and M.M.; resources, G.A. and N.S.; data curation, C.D., G.A. and N.S.; writing—original draft preparation, G.B. and E.B.; writing—review and editing, G.A., M.M., C.D., S.C.-A. and N.S.; visualization, E.B. and G.B.; supervision, R.M., G.A., G.B. and M.M.; project administration, C.D. and G.B.; funding acquisition, G.A., C.D. and G.B. All authors have read and agreed to the published version of the manuscript.

Funding

The study was developed in the framework of E.B.’s Ph.D. thesis, supported by the VISTOCK project, funded by GAL-START Mugello (Tuscany Region), grant number 853175. It falls within the thematic area of the French government IDEX-ISITE initiative (reference: 16-IDEX-0001; project CAP 20-25).

Data Availability Statement

Not applicable.

Acknowledgments

We thank the farms involved in the study for their practical support.

Conflicts of Interest

The authors declare no conflict of interest.

References

  1. Dillon, P. The Evolution of Grassland in the European Union in Terms of Utilisation, Productivity, Food Security and the Importance of Adoption of Technical Innovations in Increasing Sustainability of Pasture-Based Ruminant Production Systems. Grassl. Sci. Eur. 2018, 23, 3–15. [Google Scholar]
  2. Mara, F.P.O. The Role of Grasslands in Food Security and Climate Change. Ann. Bot. 2012, 210, 1263–1270. [Google Scholar] [CrossRef] [Green Version]
  3. Barbour, R.; Young, R.H.; Wilkinson, J.M. Production of Meat and Milk from Grass in the United Kingdom. Agronomy 2022, 12, 914. [Google Scholar] [CrossRef]
  4. ISTAT. Available online: Http://Dati.Istat.It/Index.Aspx?Queryid=33704 (accessed on 5 December 2022).
  5. Burrascano, S.; Caccianiga, M.; Gigante, D. Dry Grasslands Habitat Types in Italy. 2010. Bulletin of European Dry Grassland Group. Available online: https://air.unimi.it/handle/2434/155321 (accessed on 20 January 2023).
  6. Dibari, C.; Pulina, A.; Argenti, G.; Aglietti, C.; Bindi, M.; Moriondo, M.; Mula, L.; Pasqui, M.; Seddaiu, G.; Roggero, P.P. Climate Change Impacts on the Alpine, Continental and Mediterranean Grassland Systems of Italy: A Review. Ital. J. Agron. 2021, 16, 1843. [Google Scholar] [CrossRef]
  7. Cavallero, A.; Aceto, P.; Gorlier, A.; Lombardi, G.; Lonati, M.; Martinasso, B.; Tagliatori, C. I Tipi Pastorali Delle Alpi Piemontesi; Alberto Perdisa Editore: Bologna, Italy, 2007. (In Italian) [Google Scholar]
  8. Argenti, G.; Bottai, L.; Chiesi, M.; Maselli, F.; Staglianò, N.; Targetti, S. Analisi e Valutazione Di Pascoli Montani Attraverso l’integrazione Di Dati Multispettrali e Ausiliari. Riv. Ital. Telerilevamento 2011, 43, 45–57. (In Italian) [Google Scholar]
  9. Orlandi, S.; Probo, M.; Sitzia, T.; Trentanovi, G.; Garbarino, M.; Lombardi, G.; Lonati, M. Environmental and Land Use Determinants of Grassland Patch Diversity in the Western and Eastern Alps under Agro-Pastoral Abandonment. Biodivers. Conserv. 2016, 25, 275–293. [Google Scholar] [CrossRef]
  10. Targetti, S.; Messeri, A.; Staglianò, N.; Argenti, G. Leaf Functional Traits for the Assessment of Succession Following Management in Semi-Natural Grasslands: A Case Study in the North Apennines, Italy. Appl. Veg. Sci. 2013, 16, 325–332. [Google Scholar] [CrossRef]
  11. Metzger, M.J.; Bunce, R.G.H.; Jongman, R.H.G.; Mücher, C.A.; Watkins, J.W. A Climatic Stratification of the Environment of Europe. Glob. Ecol. Biogeogr. 2005, 14, 549–563. [Google Scholar] [CrossRef]
  12. Bengtsson, J.; Bullock, J.M.; Egoh, B.; Everson, C.; Everson, T.; O’Connor, T.; O’Farrell, P.J.; Smith, H.G.; Lindborg, R. Grasslands—More Important for Ecosystem Services than You Might Think. Ecosphere 2019, 10, e02582. [Google Scholar] [CrossRef]
  13. Hao, R.; Yu, D.; Liu, Y.; Liu, Y.; Qiao, J.; Wang, X.; Du, J. Impacts of Changes in Climate and Landscape Pattern on Ecosystem Services. Sci. Total Environ. 2017, 579, 718–728. [Google Scholar] [CrossRef]
  14. Ponzetta, M.P.; Cervasio, F.; Crocetti, C.; Messeri, A.; Argenti, G. Habitat Improvements with Wildlife Purposes in a Grazed Area on the Apennine Mountains. Ital. J. Agron. 2010, 5, 233–238. [Google Scholar] [CrossRef]
  15. Tamburini, G.; Aguilera, G.; Öckinger, E. Grasslands Enhance Ecosystem Service Multifunctionality above and Below-Ground in Agricultural Landscapes. J. Appl. Ecol. 2022, 3061–3071. [Google Scholar] [CrossRef]
  16. Wepking, C.; Mackin, H.C.; Raff, Z.; Shrestha, D.; Orfanou, A.; Booth, E.G.; Kucharik, C.J.; Gratton, C.; Jackson, R.D. Perennial Grassland Agriculture Restores Critical Ecosystem Functions in the U.S. Upper Midwest. Front. Sustain. Food Syst. 2022, 6, 1010280. [Google Scholar] [CrossRef]
  17. Sándor, R.; Ehrhardt, F.; Brilli, L.; Carozzi, M.; Recous, S.; Smith, P.; Snow, V.; Soussana, J.F.; Dorich, C.D.; Fuchs, K.; et al. The Use of Biogeochemical Models to Evaluate Mitigation of Greenhouse Gas Emissions from Managed Grasslands. Sci. Total Environ. 2018, 642, 292–306. [Google Scholar] [CrossRef] [Green Version]
  18. Smith, P.; Martino, D.; Cai, Z.; Gwary, D.; Janzen, H.; Kumar, P.; McCarl, B.; Ogle, S.; O’Mara, F.; Rice, C.; et al. Greenhouse Gas Mitigation in Agriculture. Philos. Trans. R. Soc. B Biol. Sci. 2008, 363, 789–813. [Google Scholar] [CrossRef] [Green Version]
  19. Oates, L.G.; Jackson, R.D. Livestock Management Strategy Affects Net Ecosystem Carbon Balance of Subhumid Pasture. Rangel. Ecol. Manag. 2014, 67, 19–29. [Google Scholar] [CrossRef]
  20. Franzluebbers, A.J. Cattle Grazing Effects on the Environment: Greenhouse Gas Emissions and Carbon Footprint; Elsevier Inc.: Cambridge, MA, USA, 2020; ISBN 9780128144749. [Google Scholar]
  21. Guillaume, T.; Makowski, D.; Libohova, Z.; Elfouki, S.; Fontana, M.; Leifeld, J.; Bragazza, L.; Sinaj, S. Geoderma Carbon Storage in Agricultural Topsoils and Subsoils Is Promoted by Including Temporary Grasslands into the Crop Rotation. Geoderma 2022, 422, 115937. [Google Scholar] [CrossRef]
  22. Soussana, J.F.; Tallec, T.; Blanfort, V. Mitigating the Greenhouse Gas Balance of Ruminant Production Systems through Carbon Sequestration in Grasslands. Anim. Int. J. Anim. Biosci. 2010, 4, 334–350. [Google Scholar] [CrossRef] [Green Version]
  23. Dass, P.; Houlton, B.Z.; Wang, Y.; Warlind, D. Grasslands May Be More Reliable Carbon Sinks than Forests in California. Environ. Res. Lett. 2018, 13, 074027. [Google Scholar] [CrossRef]
  24. Steinfeld, H.; Wassenaar, T. The Role of Livestock Production in Carbon and Nitrogen Cycles. Annu. Rev. Environ. Resour. 2007, 32, 271–296. [Google Scholar] [CrossRef] [Green Version]
  25. Hortnagl, L.; Barthel, M.; Buchmann, N.; Eugster, W.; Butterbach-bahl, K.; Eugenio, D.; Zeeman, M.; Lu, H.; Kiese, R.; Bahn, M.; et al. Greenhouse Gas Fluxes over Managed Grasslands in Central Europe S. Glob. Chang. Biol. 2018, 24, 1843–1872. [Google Scholar] [CrossRef] [PubMed] [Green Version]
  26. Soussana, J.F.; Allard, V.; Pilegaard, K.; Ambus, P.; Amman, C.; Campbell, C.; Raschi, A.; Baronti, S.; Rees, R.M.; Skiba, U.; et al. Full Accounting of the Greenhouse Gas (CO2, N2O, CH4) Budget of Nine European Grassland Sites. Agric. Ecosyst. Environ. 2007, 121, 121–134. [Google Scholar] [CrossRef]
  27. Toreti, A.; Desiato, F. Temperature Trend over Italy from 1961 to 2004. Theor. Appl. Climatol. 2008, 91, 51–58. [Google Scholar] [CrossRef]
  28. Tomozeiu, R.; Pasqui, M.; Quaresima, S. Future Changes of Air Temperature over Italian Agricultural Areas: A Statistical Downscaling Technique Applied to 2021–2050 and 2071–2100 Periods. Meteorol. Atmos. Phys. 2018, 130, 543–563. [Google Scholar] [CrossRef]
  29. Scocco, P.; Piermarteri, K.; Malfatti, A.; Tardella, F.M.; Catorci, A. Increase of Drought Stress Negatively Affects the Sustainability of Extensive Sheep Farming in Sub-Mediterranean Climate. J. Arid Environ. 2016, 128, 50–58. [Google Scholar] [CrossRef]
  30. Chelli, S.; Wellstein, C.; Campetella, G.; Canullo, R.; Tonin, R.; Zerbe, S.; Gerdol, R. Climate Change Response of Vegetation across Climatic Zones in Italy. Clim. Res. 2017, 71, 249–262. [Google Scholar] [CrossRef] [Green Version]
  31. Petriccione, B.; Bricca, A. Thirty Years of Ecological Research at the Gran Sasso d’Italia LTER Site: Climate Change in Action. Nat. Conserv. 2019, 34, 9–39. [Google Scholar] [CrossRef]
  32. Dibari, C.; Costafreda-Aumedes, S.; Argenti, G.; Bindi, M.; Carotenuto, F.; Moriondo, M.; Padovan, G.; Pardini, A.; Staglianò, N.; Vagnoli, C.; et al. Expected Changes to Alpine Pastures in Extent and Composition under Future Climate Conditions. Agronomy 2020, 10, 926. [Google Scholar] [CrossRef]
  33. Stanisci, A.; Frate, L.; Morra Di Cella, U.; Pelino, G.; Petey, M.; Siniscalco, C.; Carranza, M.L. Short-Term Signals of Climate Change in Italian Summit Vegetation: Observations at Two GLORIA Sites. Plant Biosyst. 2016, 150, 227–235. [Google Scholar] [CrossRef] [Green Version]
  34. Evangelista, A.; Frate, L.; Carranza, M.L.; Attorre, F.; Pelino, G.; Stanisci, A. Changes in Composition, Ecology and Structure of High-Mountain Vegetation: A Re-Visitation Study over 42 Years. AoB Plants 2016, 8, 1–11. [Google Scholar] [CrossRef] [Green Version]
  35. Bebeley, J.F.; Kamara, A.Y.; Jibrin, J.M.; Akinseye, F.M.; Tofa, A.I.; Adam, A.M. Evaluation and Application of the CROPGRO-Soybean Model for Determining Optimum Sowing Windows of Soybean in the Nigeria Savannas. Sci. Rep. 2022, 12, 6747. [Google Scholar] [CrossRef] [PubMed]
  36. Kamilaris, C.; Dewhurst, R.J.; Sykes, A.J.; Alexander, P. Modelling Alternative Management Scenarios of Economic and Environmental Sustainability of Beef Fi Nishing Systems. J. Clean. Prod. 2020, 253, 119888. [Google Scholar] [CrossRef]
  37. Fullman, T.J.; Bunting, E.L.; Kiker, G.A.; Southworth, J. Predicting Shifts in Large Herbivore Distributions under Climate Change and Management Using a Spatially-Explicit Ecosystem Model. Ecol. Modell. 2017, 352, 1–18. [Google Scholar] [CrossRef]
  38. Kalaugher, E.; Beukes, P.; Bornman, J.F.; Clark, A.; Campbell, D.I. Modelling Farm-Level Adaptation of Temperate, Pasture-Based Dairy Farms to Climate Change. Agric. Syst. 2017, 153, 53–68. [Google Scholar] [CrossRef]
  39. Moore, A.D.; Ghahramani, A. Climate Change and Broadacre Livestock Production across Southern Australia. 3. Adaptation Options via Livestock Genetic Improvement. Anim. Prod. Sci. 2014, 54, 111–124. [Google Scholar] [CrossRef] [Green Version]
  40. Snow, V.O.; Rotz, C.A.; Moore, A.D.; Martin-Clouaire, R.; Johnson, I.R.; Hutchings, N.J.; Eckard, R.J. The Challenges–and Some Solutions–to Process-Based Modelling of Grazed Agricultural Systems. Environ. Model. Softw. 2014, 62, 420–436. [Google Scholar] [CrossRef]
  41. Ma, L.; Derner, J.D.; Harmel, R.D.; Tatarko, J.; Moore, A.D.; Rotz, C.A.; Augustine, D.J.; Boone, R.B.; Coughenour, M.B.; Beukes, P.C.; et al. Application of Grazing Land Models in Ecosystem Management: Current Status and next Frontiers. Adv. Agron. 2019, 158, 173–215. [Google Scholar] [CrossRef]
  42. Ferrarini, A.; Alatalo, J.M.; Gervasoni, D.; Foggi, B. Exploring the Compass of Potential Changes Induced by Climate Warming in Plant Communities. Ecol. Complex. 2017, 29, 1–9. [Google Scholar] [CrossRef]
  43. Frate, L.; Carranza, M.L.; Evangelista, A.; Stinca, A.; Schaminée, J.H.J.; Stanisci, A. Climate and Land Use Change Impacts on Mediterranean High-Mountain Vegetation in the Apennines since the 1950s. Plant Ecol. Divers. 2018, 11, 85–96. [Google Scholar] [CrossRef]
  44. Dibari, C.; Argenti, G.; Catolfi, F.; Moriondo, M.; Staglianò, N.; Bindi, M. Pastoral Suitability Driven by Future Climate Change along the Apennines. Ital. J. Agron. 2015, 10, 109–116. [Google Scholar] [CrossRef] [Green Version]
  45. Vigan, A.; Lasseur, J.; Benoit, M.; Mouillot, F.; Eugène, M.; Mansard, L.; Vigne, M.; Lecomte, P.; Dutilly, C. Evaluating Livestock Mobility as a Strategy for Climate Change Mitigation: Combining Models to Address the Specificities of Pastoral Systems. Agric. Ecosyst. Environ. 2017, 242, 89–101. [Google Scholar] [CrossRef]
  46. Insua, J.R.; Utsumi, S.A.; Basso, B. Estimation of Spatial and Temporal Variability of Pasture Growth and Digestibility in Grazing Rotations Coupling Unmanned Aerial Vehicle (UAV) with Crop Simulation Models. PLoS ONE 2019, 14, e0212773. [Google Scholar] [CrossRef]
  47. Gao, Q.Z.; Li, Y.; Xu, H.M.; Wan, Y.F.; Jiangcun, W. zha Adaptation Strategies of Climate Variability Impacts on Alpine Grassland Ecosystems in Tibetan Plateau. Mitig. Adapt. Strateg. Glob. Chang. 2014, 19, 199–209. [Google Scholar] [CrossRef]
  48. Riedo, M.; Grub, A.; Rosset, M. A Pasture Simulation Model for Dry Matter Production, and Fluxes of Carbon, Nitrogen, Water and Energy. Ecol. Model. 1998, 105, 141–183. [Google Scholar] [CrossRef]
  49. Wilcke, R.A.I.; Bärring, L. Selecting Regional Climate Scenarios for Impact Modelling Studies. Environ. Model. Softw. 2016, 78, 191–201. [Google Scholar] [CrossRef] [Green Version]
  50. Pierce, D.W.; Barnett, T.P.; Santer, B.D.; Gleckler, P.J. Selecting Global Climate Models for Regional Climate Change Studies. Proc. Natl. Acad. Sci. USA 2009, 106. [Google Scholar] [CrossRef] [Green Version]
  51. Ruti, P.M.; Somot, S.; Giorgi, F.; Dubois, C.; Flaounas, E.; Obermann, A.; Dell’Aquila, A.; Pisacane, G.; Harzallah, A.; Lombardi, E.; et al. Med-CORDEX Initiative for Mediterranean Climate Studies. Bull. Am. Meteorol. Soc. 2016, 97, 1187–1208. [Google Scholar] [CrossRef] [Green Version]
  52. Cornes, R.C.; van der Schrier, G.; van den Besselaar, E.J.M.; Jones, P.D. An Ensemble Version of the E-OBS Temperature and Precipitation Data Sets. J. Geophys. Res. Atmos. 2018, 123, 9391–9409. [Google Scholar] [CrossRef] [Green Version]
  53. Lange, S. Trend-Preserving Bias Adjustment and Statistical Downscaling with ISIMIP3BASD (v1.0). Geosci. Model Dev. 2019, 12, 3055–3070. [Google Scholar] [CrossRef] [Green Version]
  54. Bristow, K.L.; Campbell, G.S. On the Relationship between Incoming Solar Radiation and Daily Maximum and Minimum Temperature. Agric. For. Meteorol. 1984, 31, 159–166. [Google Scholar] [CrossRef]
  55. Allen, R.G.; Pereira, L.S.; Raes, D.; Smith, M. FAO Irrigation and Drainage Paper No. 56 - Crop Evapotranspiration. Rome Food Agric. Organ. United Nations 1998, 56, e156. [Google Scholar]
  56. IPCC Annex III: Tables of Historical and Projected Well-Mixed Greenhouse Gas Mixing Ratios and Effective Radiative Forcing of All Climate Forcers. In Climate Change 2021: The Physical Science Basis. Contribution of Wor; Dentener, F.J.; Hall, B.; Smith, C. (Eds.) Cambridge University Press: Cambridge, UK; New York, NY, USA, 2021; pp. 2139–2152. [Google Scholar]
  57. Graux, A.I.; Bellocchi, G.; Lardy, R.; Soussana, J.F. Ensemble Modelling of Climate Change Risks and Opportunities for Managed Grasslands in France. Agric. For. Meteorol. 2013, 170, 114–131. [Google Scholar] [CrossRef]
  58. Touhami, H.B.; Lardy, R.; Barra, V.; Bellocchi, G. Screening Parameters in the Pasture Simulation Model Using the Morris Method. Ecol. Modell. 2013, 266, 42–57. [Google Scholar] [CrossRef]
  59. Ma, S.; Lardy, R.; Graux, A.I.; Ben Touhami, H.; Klumpp, K.; Martin, R.; Bellocchi, G. Regional-Scale Analysis of Carbon and Water Cycles on Managed Grassland Systems. Environ. Model. Softw. 2015, 72, 356–371. [Google Scholar] [CrossRef]
  60. Pulina, A.; Lai, R.; Salis, L.; Seddaiu, G.; Roggero, P.P.; Bellocchi, G. Modelling Pasture Production and Soil Temperature, Water and Carbon Fluxes in Mediterranean Grassland Systems with the Pasture Simulation Model. Grass Forage Sci. 2018, 73, 272–283. [Google Scholar] [CrossRef] [Green Version]
  61. Sándor, R.; Picon-Cochard, C.; Martin, R.; Louault, F.; Klumpp, K.; Borras, D.; Bellocchi, G. Plant Acclimation to Temperature: Developments in the Pasture Simulation Model. Field Crop. Res. 2018, 222, 238–255. [Google Scholar] [CrossRef]
  62. Ehrhardt, F.; Soussana, J.F.; Bellocchi, G.; Grace, P.; McAuliffe, R.; Recous, S.; Sándor, R.; Smith, P.; Snow, V.; de Antoni Migliorati, M.; et al. Assessing Uncertainties in Crop and Pasture Ensemble Model Simulations of Productivity and N2O Emissions. Glob. Chang. Biol. 2018, 24, e603–e616. [Google Scholar] [CrossRef] [Green Version]
  63. Bojanowski, J.S.; Donatelli, M.; Skidmore, A.K.; Vrieling, A. An Auto-Calibration Procedure for Empirical Solar Radiation Models. Environ. Model. Softw. 2013, 49, 118–128. [Google Scholar] [CrossRef]
  64. Poggio, L.; De Sousa, L.M.; Batjes, N.H.; Heuvelink, G.B.M.; Kempen, B.; Ribeiro, E.; Rossiter, D. SoilGrids 2.0: Producing Soil Information for the Globe with Quantified Spatial Uncertainty. Soil 2021, 7, 217–240. [Google Scholar] [CrossRef]
  65. Richter, K.; Atzberger, C.; Hank, T.B.; Mauser, W. Derivation of Biophysical Variables from Earth Observation Data: Validation and Statistical Measures. J. Appl. Remote Sens. 2012, 6, 063557-1. [Google Scholar] [CrossRef]
  66. Meinshausen, M.; Smith, S.J.; Calvin, K.; Daniel, J.S.; Kainuma, M.L.T.; Lamarque, J.; Matsumoto, K.; Montzka, S.A.; Raper, S.C.B.; Riahi, K.; et al. The RCP Greenhouse Gas Concentrations and Their Extensions from 1765 to 2300. Clim. Chang. 2011, 109, 213–241. [Google Scholar] [CrossRef] [Green Version]
  67. Movedi, E.; Bellocchi, G.; Argenti, G.; Paleari, L.; Vesely, F.; Staglianò, N.; Dibari, C.; Confalonieri, R. Development of Generic Crop Models for Simulation of Multi-Species Plant Communities in Mown Grasslands. Ecol. Modell. 2019, 401, 111–128. [Google Scholar] [CrossRef]
  68. Sándor, R.; Barcza, Z.; Acutis, M.; Doro, L.; Hidy, D.; Köchy, M.; Minet, J.; Lellei-Kovács, E.; Ma, S.; Perego, A.; et al. Multi-Model Simulation of Soil Temperature, Soil Water Content and Biomass in Euro-Mediterranean Grasslands: Uncertainties and Ensemble Performance. Eur. J. Agron. 2017, 88, 22–40. [Google Scholar] [CrossRef]
  69. Schucknecht, A.; Seo, B.; Krämer, A.; Asam, S.; Atzberger, C.; Kiese, R. Estimating Dry Biomass and Plant Nitrogen Concentration in Pre-Alpine Grasslands with Low-Cost UAS-Borne Multispectral Data-a Comparison of Sensors, Algorithms, and Predictor Sets. Biogeosciences 2022, 19, 2699–2727. [Google Scholar] [CrossRef]
  70. Kollas, C.; Kersebaum, K.C.; Nendel, C.; Manevski, K.; Müller, C.; Palosuo, T.; Armas-Herrera, C.M.; Beaudoin, N.; Bindi, M.; Charfeddine, M.; et al. Crop Rotation Modelling-A European Model Intercomparison. Eur. J. Agron. 2015, 70, 98–111. [Google Scholar] [CrossRef]
  71. Vuichard, N.; Soussana, J.F.; Ciais, P.; Viovy, N.; Ammann, C.; Calanca, P.; Clifton-Brown, J.; Fuhrer, J.; Jones, M.; Martin, C. Estimating the Greenhouse Gas Fluxes of European Grasslands with a Process-Based Model: 1. Model Evaluation from in Situ Measurements. Glob. Biogeochem. Cycles 2007, 21. [Google Scholar] [CrossRef] [Green Version]
  72. Schippers, P.; Van Groenendael, J.M.; Vleeshouwers, L.M.; Hunt, R. Herbaceous Plant Strategies in Disturbed Habitats. Oikos 2001, 95, 198–210. [Google Scholar] [CrossRef]
  73. Fuchs, K.; Merbold, L.; Buchmann, N.; Bellocchi, G.; Bindi, M.; Brilli, L.; Conant, R.T.; Dorich, C.D.; Ehrhardt, F.; Fitton, N.; et al. Evaluating the Potential of Legumes to Mitigate N2O Emissions From Permanent Grassland Using Process-Based Models. Glob. Biogeochem. Cycles 2020, 34, e2020GB006561. [Google Scholar] [CrossRef]
  74. Vital, J.A.; Gaurut, M.; Lardy, R.; Viovy, N.; Soussana, J.F.; Bellocchi, G.; Martin, R. High-Performance Computing for Climate Change Impact Studies with the Pasture Simulation Model. Comput. Electron. Agric. 2013, 98, 131–135. [Google Scholar] [CrossRef]
  75. Wang, Z.; Ma, Y.; Zhang, Y.; Shang, J. Review of Remote Sensing Applications in Grassland Monitoring. Remote Sens. 2022, 14, 2903. [Google Scholar] [CrossRef]
  76. Bellini, E.; Moriondo, M.; Dibari, C.; Leolini, L.; Staglianò, N.; Stendardi, L.; Filippa, G.; Galvagno, M.; Argenti, G. Impacts of Climate Change on European Grassland Phenology: A 20-Year Analysis of MODIS Satellite Data. Remote Sens. 2023, 15, 218. [Google Scholar] [CrossRef]
  77. Ren, S.; Vitasse, Y.; Chen, X.; Peichl, M.; An, S. Assessing the Relative Importance of Sunshine, Temperature, Precipitation, and Spring Phenology in Regulating Leaf Senescence Timing of Herbaceous Species in China. Agric. For. Meteorol. 2022, 313, 108770. [Google Scholar] [CrossRef]
  78. Ellsworth, D.S.; Reich, P.B.; Naumburg, E.S.; Koch, G.W.; Kubiske, M.E.; Smith, S.D. Photosynthesis, Carboxylation and Leaf Nitrogen Responses of 16 Species to Elevated PCO2 across Four Free-Air CO2 Enrichment Experiments in Forest, Grassland and Desert. Glob. Chang. Biol. 2004, 10, 2121–2138. [Google Scholar] [CrossRef]
  79. Ainsworth, E.A.; Long, S.P. What Have We Learned from 15 Years of Free-Air CO2 Enrichment (FACE)? A Meta-Analytic Review of the Responses of Photosynthesis, Canopy Properties and Plant Production to Rising CO2. New Phytol. 2005, 165, 351–372. [Google Scholar] [CrossRef] [PubMed]
  80. Ainsworth, E.A.; Rogers, A. The Response of Photosynthesis and Stomatal Conductance to Rising [CO2]: Mechanisms and Environmental Interactions. Plant Cell Environ. 2007, 30, 258–270. [Google Scholar] [CrossRef]
  81. Shrestha, S.; Abdalla, M.; Hennessy, T.; Forristal, D.; Jones, M.B. Irish Farms under Climate Change - Is There a Regional Variation on Farm Responses? J. Agric. Sci. 2015, 153, 385–398. [Google Scholar] [CrossRef]
  82. Zarrineh, N.; Abbaspour, K.C.; Holzkämper, A. Integrated Assessment of Climate Change Impacts on Multiple Ecosystem Services in Western Switzerland. Sci. Total Environ. 2020, 708, 135212. [Google Scholar] [CrossRef] [PubMed]
  83. Chang, J.; Ciais, P.; Gasser, T.; Smith, P.; Herrero, M.; Havlík, P.; Obersteiner, M.; Guenet, B.; Goll, D.S.; Li, W.; et al. Climate Warming from Managed Grasslands Cancels the Cooling Effect of Carbon Sinks in Sparsely Grazed and Natural Grasslands. Nat. Commun. 2021, 12, 118. [Google Scholar] [CrossRef] [PubMed]
  84. Zhu, Y.; Purdy, K.J.; Eyice, Ö.; Shen, L.; Harpenslager, S.F.; Yvon-Durocher, G.; Dumbrell, A.J.; Trimmer, M. Disproportionate Increase in Freshwater Methane Emissions Induced by Experimental Warming. Nat. Clim. Chang. 2020, 10, 685–690. [Google Scholar] [CrossRef]
  85. Butterbach-Bahl, K.; Baggs, E.M.; Dannenmann, M.; Kiese, R.; Zechmeister-Boltenstern, S. Nitrous Oxide Emissions from Soils: How Well Do We Understand the Processes and Their Controls? Philos. Trans. R. Soc. B Biol. Sci. 2013, 368, 20130122. [Google Scholar] [CrossRef]
  86. Cullen, B.R.; Johnson, I.R.; Eckard, R.J.; Lodge, G.M.; Walker, R.J.; Rawnsley, R.P.; McCaskillF, M.R. Climate Change Effects on Pasture Systems in South-Eastern Australia. Crop Pasture Sci. 2009, 60, 933–942. [Google Scholar] [CrossRef]
  87. Parton, W.J.; Ojima, D.S.; Cole, C.V.; Schimel, D.S. A General Model for Soil Organic Matter Dynamics: Sensitivity to Litter Chemistry, Texture and Management. Quant. Model. Soil Form. Process. Proc. Symp. Minneapolis 1994, 39, 147–167. [Google Scholar] [CrossRef] [Green Version]
  88. Murphy, K.L.; Burke, I.C.; Vinton, M.A.; Lauenroth, W.K.; Aguiar, M.R.; Wedin, D.A.; Virginia, R.A.; Lowe, P.N. Regional Analysis of Litter Quality in the Central Grassland Region of North America. J. Veg. Sci. 2002, 13, 395–402. [Google Scholar] [CrossRef]
  89. Ouled Belgacem, A.; Louhaichi, M. The Vulnerability of Native Rangeland Plant Species to Global Climate Change in the West Asia and North African Regions. Clim. Chang. 2013, 119, 451–463. [Google Scholar] [CrossRef] [Green Version]
  90. He, P.; Ma, X.; Sun, Z.; Han, Z.; Ma, S.; Xiaoyu, M. Compound Drought Constrains Gross Primary Productivity in Chinese Grasslands. Environ. Res. Lett. 2022, 17, 104054. [Google Scholar] [CrossRef]
  91. Rounsevell, M.D.A.; Brignall, A.P.; Siddons, P.A. Potential Climate Change Effects on the Distribution of Agricultural Grassland in England and Wales. Soil Use Manag. 1996, 12, 44–51. [Google Scholar] [CrossRef]
  92. Edmonds, J.A.; Rosenberg, N.J. Climate Change Impacts for the Conterminous USA: An Integrated Assessment Summary. Clim. Chang. Impacts Conterminous USA Integr. Assess. 2005, 151–162. [Google Scholar] [CrossRef]
  93. Morales, P.; Hickler, T.; Rowell, D.P.; Smith, B.; Sykes, M.T. Changes in European Ecosystem Productivity and Carbon Balance Driven by Regional Climate Model Output. Glob. Chang. Biol. 2007, 13, 108–122. [Google Scholar] [CrossRef]
  94. Harrison, M.T.; Cullen, B.R.; Armstrong, D. Management Options for Dairy Farms under Climate Change: Effects of Intensification, Adaptation and Simplification on Pastures, Milk Production and Profitability. Agric. Syst 2017, 155, 19–32. [Google Scholar] [CrossRef]
  95. Joyce, L.A.; Briske, D.D.; Brown, J.R.; Polley, H.W.; McCarl, B.A.; Bailey, D.W. Climate Change and North American Rangelands: Assessment of Mitigation and Adaptation Strategies. Rangel. Ecol. Manag. 2013, 66, 512–528. [Google Scholar] [CrossRef] [Green Version]
  96. Cheng, M.; Mccarl, B.; Fei, C. Climate Change and Livestock Production: A Literature Review. Atmosphere 2022, 13, 140. [Google Scholar] [CrossRef]
  97. Briske, D.D.; Joyce, L.A.; Polley, H.W.; Brown, J.R.; Wolter, K.; Morgan, J.A.; McCarl, B.A.; Bailey, D.W. Climate-Change Adaptation on Rangelands: Linking Regional Exposure with Diverse Adaptive Capacity. Front. Ecol. Environ. 2015, 13, 249–256. [Google Scholar] [CrossRef] [PubMed] [Green Version]
  98. Hristov, A.N.; Degaetano, A.T.; Rotz, C.A.; Hoberg, E.; Skinner, R.H.; Felix, T.; Li, H.; Patterson, P.H.; Roth, G.; Hall, M.; et al. Climate Change Effects on Livestock in the Northeast US and Strategies for Adaptation. Clim. Chang. 2018, 146, 33–45. [Google Scholar] [CrossRef]
  99. Xu, C.; Liu, H.; Williams, A.P.; Yin, Y.; Wu, X. Trends toward an Earlier Peak of the Growing Season in Northern Hemisphere Mid-Latitudes. Glob. Chang. Biol. 2016, 22, 2852–2860. [Google Scholar] [CrossRef] [PubMed]
  100. Allen, V.G.; Batello, C.; Berretta, E.J.; Hodgson, J.; Kothmann, M.; Li, X.; McIvor, J.; Milne, J.; Morris, C.; Peeters, A.; et al. An International Terminology for Grazing Lands and Grazing Animals. Grass Forage Sci. 2011, 66, 2–28. [Google Scholar] [CrossRef]
  101. Li, W.; Cao, W.; Wang, J.; Li, X.; Xu, C.; Shi, S. Effects of Grazing Regime on Vegetation Structure, Productivity, Soil Quality, Carbon and Nitrogen Storage of Alpine Meadow on the Qinghai-Tibetan Plateau. Ecol. Eng. 2017, 98, 123–133. [Google Scholar] [CrossRef]
  102. Liu, J.; Isbell, F.; Ma, Q.; Chen, Y.; Xing, F.; Sun, W.; Wang, L.; Li, J.; Wang, Y.; Hou, F.; et al. Overgrazing, Not Haying, Decreases Grassland Topsoil Organic Carbon by Decreasing Plant Species Richness along an Aridity Gradient in Northern China. Agric. Ecosyst. Environ. 2022, 332, 107935. [Google Scholar] [CrossRef]
  103. Porro, F.; Tomaselli, M.; Abeli, T.; Gandini, M.; Gualmini, M.; Orsenigo, S.; Petraglia, A.; Rossi, G.; Carbognani, M. Could Plant Diversity Metrics Explain Climate-Driven Vegetation Changes on Mountain Summits of the GLORIA Network? Biodivers. Conserv. 2019, 28, 3575–3596. [Google Scholar] [CrossRef]
  104. Löffler, J.; Pape, R. Thermal Niche Predictors of Alpine Plant Species. Ecology 2020, 101, e02891. [Google Scholar] [CrossRef] [Green Version]
  105. Piseddu, F.; Bellocchi, G.; Picon-Cochard, C. Mowing and Warming Effects on Grassland Species Richness and Harvested Biomass: Meta-Analyses. Agron. Sustain. Dev. 2021, 41, 74. [Google Scholar] [CrossRef]
  106. Lamprecht, A.; Semenchuk, P.R.; Steinbauer, K.; Winkler, M.; Pauli, H. Climate Change Leads to Accelerated Transformation of High-Elevation Vegetation in the Central Alps. New Phytol. 2018, 220, 447–459. [Google Scholar] [CrossRef] [PubMed]
Figure 1. Workflow of the methodology applied in this study. PaSim is the grassland simulation model used for the analysis.
Land 12 00351 g001
Figure 2. Aerial view of the study sites of Marradi (M, left) and Borgo San Lorenzo (B, right). Satellite images of the sites were obtained from Google Earth.
Land 12 00351 g002
Figure 3. Absolute change (°C) in monthly mean air temperature (top graphs) and relative change (%) of monthly cumulated rainfall (bottom graphs) generated in the two study sites with the RCM ensemble (14 models) for two climate scenarios (RCP4.5, RCP8.5) and two periods–2011–2040 (ongoing) and 2041–2070 (mid-future)—over the baseline period 1981–2010 (near past).
Land 12 00351 g003
Figure 4. Simulated (blue line) and observed (red square dots) patterns of aboveground biomass (AGB) and leaf area index (LAI) at Sites M (a), B1 (b), and B2 (c) for the period 2020–2021.
Land 12 00351 g004
Figure 5. Estimated durations (30-year mean values) of vegetation growing seasons (green bars) for baseline and climate change scenarios under business-as-usual management at both study sites (a). On the right, increases of growing season length compared with the baseline (b).
Land 12 00351 g005
Figure 6. Daily simulation (30-year mean) of aboveground biomass (AGB) with PaSim for baseline and climate change scenarios under business-as-usual management at both study sites.
Land 12 00351 g006
Figure 7. Daily simulation (30-year mean) of aboveground biomass (AGB) with PaSim for baseline and climate change scenarios (no CO2 fertilization) under business-as-usual management at both study sites.
Land 12 00351 g007
Figure 8. Changes in peak aboveground biomass (kg DM m−2) among business-as-usual management (BaU) under the baseline climate (black histogram) and all alternative management options under RCP4.5 (cyan and blue histograms) and RCP8.5 (orange and red histograms) in both sites as provided by PaSim. Vertical bars are standard deviations.
Land 12 00351 g008
Figure 9. Heatmap visualization of the relative differences (%) of the three main greenhouse gas emissions (NEE: net ecosystem exchange; CH4: methane; and N2O: nitrous oxide), estimated using PaSim, for alternative management and climate change scenarios compared with current climate and management in the two study sites. OG: ongoing period, MF: mid-future period, 4.5: RCP4.5, 8.5: RCP8.5, GI: grazing intensity; and GL: grazing length, 20: +20%, 15: +15%.
Land 12 00351 g009
Table 1. Description of the study sites.
DescriptionUnitSite M
(Marradi)
Site B
(Borgo San Lorenzo)
Location
Latitude (WGS84)degree N44.08°43.95°
Longitude (WGS84)degree E11.63°11.35°
Elevationm a.s.l.600200
Climate
Mean annual temperature 1°C12.413.4
Mean annual precipitation 2mm1330990
Soil 3
Depthm11
Clay%3737
Silt%4236
Sand%2127
Total organic carbong kg−133.623.5
Total nitrogeng kg−13.02.5
Soil pH-6.67.4
Bulk densityg cm−31.291.44
Saturated soil water contentm3 m−30.520.51
Field capacitym3 m−30.360.35
Wilting pointm3 m−30.210.21
Dominant vegetation-Dactylis glomerata, Lolium sp., Festuca arundinacea, Phleum pratense, and Onobrychis viciifolia, with other minor forbs and a large presence in some sectors of shrubs, such as Rubus ulmifolius.Lolium sp., Dactylis glomerata, Trifolium pratense, Trifolium repens, Lotus corniculatus, and Festuca arundinacea, with other minor forbs.
1 Site M: mean of 2016, 2017, and 2020; Site B: mean of 1951–2020. 2 Site M: mean of 2001–2020; Site B: mean of 2001–2020. Data collected from regional weather stations of Tuscany Region (SIR, Servizio Idrologico Regionale, https://www.sir.toscana.it/index.php, accessed on 20 January 2023). Distance from sites <10 km. 3 1 m soil profile mean.
Table 2. Management of the two study sites. Livestock Standard Unit (LSU) refers to a dairy cow producing 3000 kg of milk per year, without additional concentrated feed (EC, 2008).
ManagementUnitSite M (Marradi)Site B (Borgo San Lorenzo)
B1B2
202020212020202120202021
Surfaceha5.4102010
Cutday of year-- -125-
Grazing perioddays of year (start, end)139–244 a; 244–267 b135–176 a; 176–276 b100–180 a; 186–300 b100–145 a; 145–306 b180–186 a; 186–300 b110–145 a; 145–306 b
Stocking rateLSU ha−1 d−14.0 a; 3.4 b3.3 a; 2.0 b2.9 a; 1.0 b1.5 a; 1.0 b0.9; 1.2 b
a and b represent two distinctive grazing periods during the season in terms of stocking rate.
Table 4. Model performance for the two study sites (M: Marradi; B: Borgo San Lorenzo, sub-areas B1 and B2) based on two performance metrics: R2, coefficient of determination of the linear regression between estimates and observations; and RRMSE (%), Relative Root Mean Square Error. AGB: aboveground biomass; LAI: Leaf Area Index.
OutputSite MSite B
R2RRMSEB1B2
R2RRMSER2RRMSE
AGB0.7614.90.6613.50.6810.0
LAI0.969.60.4724.50.7112.6
Table 5. C-N emissions (NEE: net ecosystem CO2 exchange; CH4: methane; and N2O: nitrous oxide) from the two study sites (baseline climate), estimated (30-year mean with standard deviation) using PaSim. The estimated components of the C budget (GPP: gross primary production; RECO: ecosystem respiration) can be found in Supplementary Material (Table S4).
SiteNEECH4N2O
g C m−2 yr−1g N m−2 yr−1
Site M381.3 ± 245.62.2 ± 0.34.6 ± 3.4
Site B350.1 ± 236.11.8 ± 0.24.7 ± 3.2
Disclaimer/Publisher’s Note: The statements, opinions and data contained in all publications are solely those of the individual author(s) and contributor(s) and not of MDPI and/or the editor(s). MDPI and/or the editor(s) disclaim responsibility for any injury to people or property resulting from any ideas, methods, instructions or products referred to in the content.

