Abstract
Permafrost in northeast China, which is at the southern edge of the high-latitude permafrost belt in Eurasia, is extremely sensitive to climate warming. However, the distribution of permafrost in the region in recent years has been poorly studied, and there is a lack of understanding of the relative importance of environmental factors affecting the region. Based on observed ground surface temperature (GST) data, this study quantifies changes in the permafrost area in northeast China from 1982 to 2020 using a surface frost number model, and the influencing factors are identified based on dominance analysis and spatial correlation analysis. The results suggest that the permafrost in northeast China during the observation period underwent degradation with a degradation rate of 0.33 × 10⁴ km2/a. In addition, the permafrost degradation also exhibited altitudinal and latitudinal zonality. Permafrost degradation under typical grassland, deciduous forest, and savannah cover was more significant than that under evergreen forest, mixed forest, and shrubbery cover. As revealed by the dominance analysis results, the annual average snow cover, annual average snow depth and annual average normalized difference vegetation index (NDVI) had the largest contributions to the variance of the permafrost area in northeast China, accounting for 88.3% of the total variance contribution of the six influencing factors. The spatial correlation results reveal that areas with a significantly increased NDVI and significantly reduced snow depth and snow cover were coincident with areas with significantly degraded permafrost. Hence, the snow cover, snow depth, and NDVI were found to have the greatest influence on the permafrost distribution in northeast China. The results of this study evidently increase the understanding of the changing permafrost in northeast China, providing important knowledge about permafrost for researchers and the related community.
1. Introduction
Permafrost is a rock or soil that exists for two years or more at a temperature below 0 °C [1]. Permafrost, a product of material and heat exchange between the lithosphere and the atmosphere under the combined influence of the temperature, hydrology, soil type, vegetation cover, snow cover, and human activities, is sensitive to changes in the external environment [2]. In recent decades, in line with the overall trend of global warming, surface warming in cold regions has intensified, leading to the widespread degradation of permafrost worldwide [3]. The degradation of permafrost may lead to a reduction in the water storage capacity in the active layer and the reduction of nutrients in the soil [4]. Permafrost degradation can also increase the instability and accelerate the decomposition of soil organic matter in wetlands, which can affect the growth of vegetation in the upper layer of the permafrost and even affect the role of vegetation in regulating climate and hydrological-cycle processes [5]. Guo et al. [6] found that with the degradation of the permafrost in the Greater Khingan Mountains, the moisture content of the permafrost soil decreased; this resulted in the reduction or disappearance of hygrophytes, which were gradually replaced by mesophytes and xerophytes. It was suggested that this may greatly weaken the protection and growth of permafrost and hence further accelerate permafrost degradation [7]. Furthermore, with the continuation of global warming, permafrost degradation may promote the decomposition of soil organic matter to CO2 and CH4, which will further affect the permafrost region and even global climate change [8]. In addition, as permafrost provides an important substrate for transportation and construction in cold regions [9], the study of the changes in the distribution of permafrost has profound practical significance for the protection of ecological and environmental security, along with economic activities and living conditions.
Research on the zoning of permafrost in China began in the 1950s [10]. Permafrost distribution maps at that time were mostly made via the manual analysis of field measurements, such as temperature recordings and borehole data. Xin et al. [11] collated data from previous investigations in the northeast permafrost zone, systematically summarized the distribution characteristics of this zone, and delineated the southern boundary of the zone. Via extensive fieldwork, Lu et al. [10] described the historical evolution of permafrost and its formation in the permafrost zone of northeast China’s Greater Khingan Mountains and Lesser Khingan Mountains.
With the rapid development of 3S (Global Positioning System, Geographic Information System, and Remote Sensing) technology, researchers began to study the permafrost distribution by establishing spatial distribution models [12,13]. In 1983, Nelson and Frederick proposed an air temperature frost number model to estimate the distribution of permafrost at high latitudes by finding the ratio of the freezing index and the melting index based on air temperature data, and then introduced a snow cover correction factor into the model to obtain a surface frost number model (SFNM) [14]. Lü et al. [15] applied the SFNM to the permafrost zone in northeast China based on climate elements and snow-depth data, and the study showed that the estimation results of the frost number model could basically reflect the zoning conditions of permafrost in northeast China. Nan et al. [16] rederived a SFNM using the Stefan formula for calculating freezing and melting depths, and a modified SFNM model including more detailed soil thermal properties description. It was found that the distribution of permafrost could be better estimated by adjusting this soil thermal properties description. Ran et al. [17] applied a SFNM to analyze the spatial distribution of permafrost and the surface thermal state in the permafrost region of China, and the results showed that the 0 °C annual average ground temperature isotherm and the surface frost number isotherm are consistent with the southern lower boundary of permafrost in China. Although SFNM may be limited by remote sensing data and the influence of model parameters, good results were obtained in estimating the permafrost distribution over a large area using the model.
The permafrost zone in northeast China is located in the middle and high latitudes of the Northern Hemisphere and is the second-largest permafrost zone in China. The zone represents the southern edge of the Eurasian permafrost belt [18], where the permafrost endowment conditions are fragile and thermally unstable, and the permafrost is therefore more sensitive to climate change [19]. Guo et al. [20] combined theoretical and mathematical models to delineate the southern boundary of the present-day permafrost natural geography, which oscillates north-south between 0 ± 1 °C on the axis of the 0 °C annual average temperature contour and has shifted 100–150 km northward compared with the last ice age maximum. Xie [21] inferred that the southern boundary of permafrost in northeastern China during the Late Pleistocene was basically comparable to the modern annual average temperature isotherm of 6–10 °C, and the southern boundary of modern permafrost was comparable to the annual average temperature isotherm of 0 °C. The southern boundary of Holocene permafrost was pushed southward by two latitudes compared with the southern boundary of modern permafrost. Zhou et al. [22] proposed that the southern boundary of permafrost geophysics in northeast China is in general agreement with the −5 °C annual average temperature isotherm. He et al. [23] demonstrated that permafrost degradation in northeast China in recent decades has been significantly affected by climate warming and human activities (e.g., the heat emitted by the China-Russia Crude Oil Pipeline, CRCOP, caused the rapid degradation of permafrost along the route and created thawed areas of various sizes around the pipeline [24]). They also found that the permafrost degradation in the Greater Khingan Mountains has mainly manifested as a thickening of the active layer, an increase in the temperature, a reduction of the permafrost thickness, an expansion of the thaw zone, the disappearance of permafrost islands, and the northward shift of the southern permafrost boundary.
Zhang et al. [25] investigated permafrost degradation and its associated environmental impacts in the northeast China permafrost zone from the 1950s to the 2010s using meteorological stations and reanalysis data. They found that the southern limit of permafrost in northeastern China shifted northward by 0.1° to 1.1° in latitude with an average elevation rise of 160.5 m. They also found that the permafrost degradation exhibited significant altitudinal and latitudinal zonation. Zhan et al. [26] studied the permafrost distribution in northeast China from 1900 to 2017 and found that the total permafrost area decreased by 22.66 × 10⁴ km2 and the permafrost boundary shifted northward with significant degradation. Lu et al. [10] concluded that the northward shift of the southern boundary of permafrost in the Greater Khingan Mountains and Lesser Khingan Mountains has been mainly influenced by global warming and direct human activities (e.g., the large-scale destruction of forest resources in the Greater Khingan Mountains and the construction of infrastructure such as railroads, buildings, and heating plants which changed the heat exchange conditions between the ground and the atmosphere, accelerated the ground surface temperature increase, and caused the rapid degradation of permafrost [27]). They also found that the northward shift of the southern boundary of permafrost in the Hulunbuir Plateau and Songnen Plain areas is respectively related to long-term drought and the destruction of forest vegetation.
Zhou et al. [28] analyzed the relationship between permafrost and the snow and air temperature in northeast China during the first half of winter; they found that the active layer temperature did not change much under a certain snow depth due to the insulating effect of the snow. They also demonstrated that the temperature of the soil under the snow cover was more influenced by the air temperature with the decrease of the snow thickness. Chang et al. [29] found that vegetation affects the hydrothermal turnover process in the underlying permafrost mainly by reflecting and scattering solar radiation by different vegetation types, blocking wind and snow, and water absorption and retention by ground-hugging vegetation and plant roots. Precipitation can influence the soil water content in permafrost areas [30], thereby increasing the soil moisture and temperature in the active layer and leading to permafrost degradation. Surface soil water can affect the thermal state of permafrost by responding to climate change [31]. Furthermore, changes in the surface soil water affect vegetation growth and proceed to affect the preservation of permafrost [32].
The studies reviewed previously lacked a quantitative analysis of the degree of influence of environmental factors on the distribution of permafrost in northeast China and the correlation between environmental factors and the change in the permafrost distribution in spatiotemporal terms. Therefore, in this study, six categories of influencing factors (the annual average snow depth, annual average snow cover, annual average normalized difference vegetation index (NDVI), annual average solar radiation, annual average precipitation, and annual average 0–7 cm soil water) were selected and used to analyze the magnitude of their effects on the change of the permafrost distribution in northeast China. In the analysis, 0 cm ground surface temperature (GST) data from 104 weather stations in the frozen ground region of northeast China from 1982 to 2020 were used to estimate the permafrost distribution in the region over the past 39 years using a SFNM. The spatiotemporal relationships between the permafrost distribution and its influencing factors were then investigated to provide scientific support for the environmental management and protection of the regional permafrost, as well to provide further evidence for climate change research.
2. Materials and Methods
2.1. Study Area
The study area is located in northeast China (38°43′34″ N–53°33′28″ N, 115°31′37″ E–135°05′08″ E) (Figure 1a) and mainly consists of continuous permafrost, continuous island permafrost, sparse island permafrost, and seasonal frozen ground (Figure 1b) [33]. The permafrost is mainly distributed in the Greater Khingan Mountains and Lesser Khingan Mountains, the northern part of the Songnen Plain and within the regional high mountains (e.g., the Changbai Mountains) [10]. The permafrost in this zone is relatively thin and warm compared to high-altitude and Arctic permafrost [25]. The annual average temperature of the permafrost is mainly between −1.5 and 0 °C, although it can reach as low as −4.2 °C, and the average thickness of the permafrost is around 1.5 m. The permafrost in northeast China is cooler in low-altitude areas than in high-altitude areas [33]. The average thickness of the active layer is between 2.5 and 3 m [34]. The average altitude of the study region is 452.7 m, and the main terrain is a plain with a few high-altitude mountains on the north and south sides [26]. There are numerous rivers throughout the study area. In addition, due to the influence of high and low pressure and monsoon alternation between inland areas and the sea, the region has a long dry winter and a short, hot and humid summer, with a low average annual temperature and a large annual temperature range, as well as a continental monsoon climate [18]. Northeast China represents the main forested area in China with rich vegetation cover types and complex structures [29] (Figure 1c) which, together with wetlands and permafrost, interact to form a unique geographical and ecological landscape.
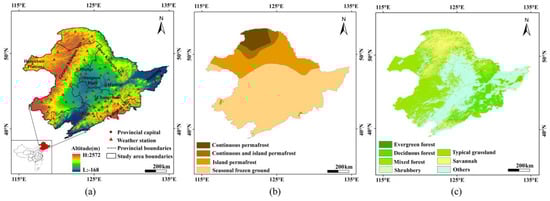
Figure 1.
Location of the study area and the distribution of weather stations (a), permafrost distribution (b), and the type of vegetation cover (c), in the frozen ground region of northeast China.
2.2. Data
The 0 cm GST data observed at 104 weather stations were obtained from the Daily Values of China Surface Climate Data Dataset (V3.0) of the National Meteorological Science Data Center (http://data.cma.cn/ accessed on 8 September 2021). To ensure the accuracy of the modelled estimates of the permafrost distribution, permafrost distribution maps for 1998 and 2000 [35,36] obtained from the National Qinghai-Tibet Plateau Scientific Data Center (http://data.tpdc.ac.cn/zh-hans/ accessed on 9 March 2022) were used for comparison and validation. A permafrost map of China for 1998 was obtained by geometric correction and digitization applied to the 1988 map of Snow Ice and Frozen Ground in China (1:4,000,000) [26]. The permafrost map for 2000 was obtained from a model estimation that integrated several existing frozen ground maps. The permafrost distribution maps for these two years respectively reflect the distributions of permafrost in the 1980s and 2000s.
The annual average snow depth, annual average snow cover, annual average solar radiation, annual average precipitation and annual average 0–7 cm soil water for the same period were obtained from the ERA5-Land Monthly Averaged-ECMWF Climate Reanalysis dataset, extracted from the Google Earth Engine (GEE) (https://developers.google.com/earth-engine/ accessed on 21 April 2022). This data set is a monthly averaged subset of the full ERA5-Land dataset post-processed by ECMWF, with a spatial resolution of about 0.1° × 0.1°. The annual average NDVI for the same period was obtained from the NOAA CDR AVHRR NDVI (V5) dataset from the GEE (https://developers.google.com/earth-engine/ accessed on 21 April 2022). This dataset had a spatial resolution of 0.05° × 0.05°. Data on the six influencing factors were downloaded and averaged using the GEE platform. To eliminate any discrepancy caused by inconsistent spatial resolution, the influencing factor data were all resampled to 5 km × 5 km-resolution raster images with the same image element size as the permafrost raster data.
The digital elevation model (DEM) data and vegetation cover type data used for this study were obtained from NASA (https://www.ncei.noaa.gov/ accessed on 16 January 2022). The elevation data used were sourced from the ASTER DEM dataset, and had a spatial resolution of 30 m. The vegetation cover type data used were sourced from the MCD12Q1 product from the MODIS data set and had a spatial resolution of 500 m. Compared with the NOAA CDR AVHRR NDVI (V5) dataset, these data have higher precision and more accurately reflect the degree of permafrost degradation under different vegetation cover types. This product includes five different vegetation cover classification schemes, including the IGBP global vegetation classification scheme. Six vegetation cover types from the IGBP scheme were used, i.e., evergreen forest, deciduous forest, mixed forest, shrubbery, typical grassland, savannah, and others (including cropland, water bodies, and urban and built-up lands) (Figure 1c). Soil data were obtained using the Harmonized World Soil Database v 1.2 (https://www.fao.org/soils-portal accessed on 19 September 2022) published by the Food and Agriculture Organization of the United States (FAO). Soil texture was classified according to the United States Department of Agriculture (USDA), and soil types were classified as silty clay loam (SICL), loamy sandy (LS), sandy clay (SAC), clay loam (CL), silty clay (SIC), sandy clay loam (SACL), loam(L) and sandy loam (SL).
2.3. Methods
2.3.1. Surface Frost Number Model
The SFNM uses the ratio of freezing index and thawing index to delimit the boundary of permafrost [16,37]. The freezing number (F), parameter E, ground freezing index (GFI), and ground thawing index (GTI) were calculated as follows:
where the freezing number F = 0.5 is used as the dividing line between permafrost and seasonal frozen ground, with F < 0.5 indicating seasonal frozen ground and F > 0.5 indicating permafrost [15,16,26]. The E is an empirical value for estimating the status of frozen ground [38]. Values of E ranging from 0.5 to 1.5 [16] were initially used and the E value was determined from the existing frozen ground map. The GFI and GTI values were calculated using cumulative values of GST below/above 0 °C over days or months (using units of °C d or °C mon). The freezing index was calculated from 1 July to 30 June of the following year, and the thawing index was calculated from 1 January to 31 December of each year [39]. is the monthly mean temperature (GST) in the ith month and is the number of days in the ith month. and represent months.
2.3.2. Ordinary Kriging Interpolation Method
The ordinary kriging interpolation method is a method for the unbiased optimal estimation of regionalized variables in a finite region based on variance function theory and structural analysis [40]. The annual freezing index and annual thawing index were obtained using the daily 0 cm GST data of 104 weather stations. The freezing number (F) of the 104 weather stations was calculated by the SFNM, and the value of the F was interpolated as the Z-value of the weather station point data in ArcGIS. The interpolated raster image was divided into permafrost (F > 0.5) and seasonal frozen ground (F < 0.5) according to the dividing value (F = 0.5) to obtain the spatial distribution of the permafrost extent, i.e.,
where is the estimated value at the estimated position (xo, yo), n is the number of actual observations used to estimate the value of , λi is a weighting coefficient that uses a weighted sum of data from all known positions on the space to estimate the value of an unknown position. It is not the reciprocal of the distance of neighboring positions, but the optimal set of coefficients that can satisfy the minimum difference between the estimated value and the true value at the position (xo, yo), and zi is the observed value at a known position (xo, yo).
2.3.3. Permafrost Change Rate
In this study, the permafrost change rate method was used to quantify the spatial variability of permafrost [31]. For the interpolation of weather station data by the freezing number (F), the output image element size was set to 500 m × 500 m. The interpolated raster image was divided into permafrost (F > 0.5) and seasonal frozen ground (F < 0.5) according to the dividing value (F = 0.5), and the binarized distribution of permafrost (0) and seasonal frozen ground (1) was obtained by reclassification. The permafrost (0) was extracted by attributes and converted to points element by element. A grid with a resolution of 5 km × 5 km, consistent with the extent of the study area, was created, and the grid and point data were overlaid, counted, and transformed to obtain quantitative permafrost distribution data (the value range was 0–100).
2.3.4. Slope Trend Analysis Method
Using the slope trend analysis method [41], time-series trends (slopes) were calculated image by image using MATLAB programming to analyze the spatial trends of the permafrost distribution and their influencing factors. The spatial correlations between permafrost and the influencing factors were calculated image by image using MATLAB programming. The parameter Slope is defined as
where Xi denotes the raster image of permafrost or the influencing factors in year i, i is the value of the year to be analyzed (1–39), and n is the total number of years in the study period (i.e., 39). Slope is the gradient of the image element regression equation. If slope > 0, it means that the trend of change is increasing, while the opposite means that it is decreasing.
2.3.5. Kappa Coefficient
The overall accuracy (OA) and kappa coefficient (K) were used to evaluate the consistency of the estimation results with the existing frozen ground map of China [42,43]. OA is the ratio of the number of correctly classified pixels to the total number of pixels in the sample. K is used to measure the consistency of the simulated result map with the existing frozen ground map.
where n is the total number of pixels, s is the total number of correctly classified pixels, a0 is the total number of existing frozen ground map pixels with permafrost, a1 is the total number of simulated result pixels with permafrost, b0 is the total number of pixels of seasonal frozen ground in the existing frozen ground map, and b1 is the total number of pixels of seasonal frozen ground in the simulated result. Landis et al. [44] divided K values into six groups to indicate different levels of consistency, i.e., K < 0 Very Poor, 0 < K ≤ 0.2 Slight, 0.2 < K ≤ 0.4 Fair, 0.4 < K ≤ 0.6 Moderate, 0.6 < K ≤ 0.8 Substantial, and 0.8 < K ≤ 1 Almost Perfect.
3. Results
3.1. Permafrost Distribution Estimation and Accuracy Verification
The permafrost distributions in the 1980s (i.e., 1980 to 1989) and 2000s (i.e., 2000 to 2009) were estimated (to ensure the consistency of the comparison time, additional permafrost distributions were estimated for 1980 and 1981) and compared with the existing permafrost distribution maps. The estimation results for E = 0.8 are shown in Figure 2; the estimation accuracy of this E value was high. The OA values of the 1980s and 2000s were 0.96 and 0.95, and the K values were 0.94 and 0.93, respectively. Differences between the estimated results and the existing permafrost distribution maps appeared mainly near the boundary of permafrost and seasonal frozen ground.
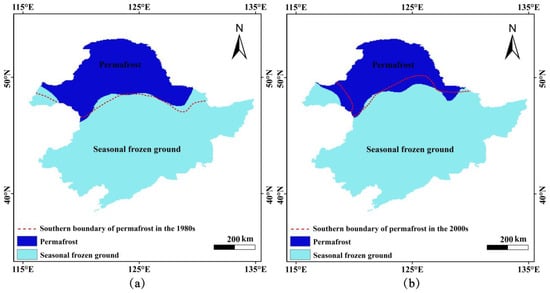
Figure 2.
The spatial differences between the estimated permafrost distribution (blue shading) and the existing permafrost distribution map (north of the red line) in the (a) 1980s and (b) 2000s.
In this study, the SFNM was applied to estimate the distribution of permafrost (i.e., F > 0.5) in northeast China from 1982 to 2020. The study period was divided into four-time intervals (i.e., 1982 to 1990, 1991 to 2000, 2001 to 2010, and 2011 to 2020) to demonstrate the decadal differences in permafrost distribution changes in northeast China (calculated using the average values of the freezing and thawing indices for the time interval; see Figure 3). The results suggest that the permafrost in northeast China shows a general trend of degradation. The permafrost area was 55.95 × 10⁴ km2 from 1982 to 1990, but it decreased to 36.91 × 10⁴ km2 from 2011 to 2020. Moreover, the permafrost was found to be mainly distributed in the high latitude areas in the northern part of the Greater Khingan Mountains and Lesser Khingan Mountains and the Songnen Plain, and the southern boundary (i.e., F = 0.5) of the permafrost was found to exhibit a characteristic dome shape.
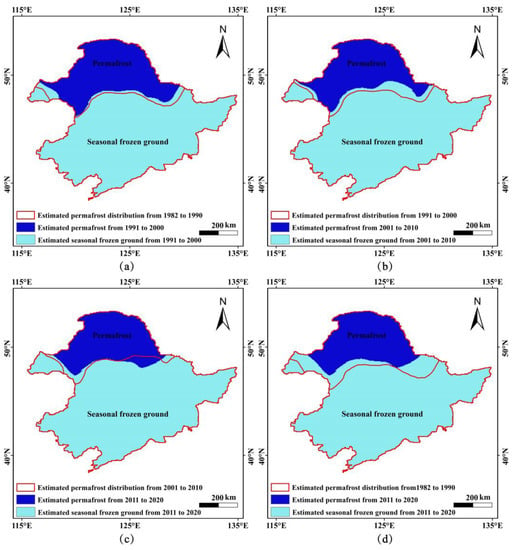
Figure 3.
The estimated permafrost distributions (F > 0.5) and decadal differences in northeast China from 1982 to 2020. (a) 1982 to 1990 and 1991 to 2000; (b) 1991 to 2000 and 2001 to 2010; (c) 2001 to 2010 and 2011 to 2020; (d) 1982 to 1990 and 2011 to 2020.
3.2. Spatiotemporal Variations of Permafrost
3.2.1. Temporal Variation Characteristics of Permafrost
From a temporal perspective, the area of permafrost in northeast China was found to exhibit an overall degradation trend with a degradation rate of 0.33 × 10⁴ km2/a (Figure 4a). The permafrost area was the largest in 1983 (8.01 × 10⁵ km2) and the smallest in 2007 (2.91 × 10⁵ km2).
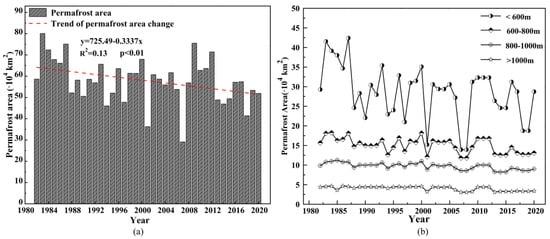
Figure 4.
(a) The variation of the permafrost area (significant at the p < 0.01 level, with a 95% confidence level) and (b) the variation characteristics at different altitudes.
In addition, permafrost degradation in northeast China showed altitudinal zonality (Figure 4b). Zhang et al. [25] demonstrated that the average altitude of permafrost in northeast China increased from 677.9 to 886.2 m from the 1950s to the 2010s, and the permafrost degradation rate in high mountainous areas (above 1000 m elevation) was slower than that in plains. To further analyze the magnitude of the annual change of the permafrost area in different altitude ranges, the elevation ranges were divided into four intervals: <600 m, 600 to 800 m, 800 to 1000 m, and >1000 m. The results show that the annual change of the permafrost area below 600 m in altitude was the most noticeable, while the area of permafrost above 1000 m in altitude was relatively stable.
3.2.2. Spatial Variation Characteristics of Permafrost
Spatially, the northeast China permafrost is part of the Xinganling-Baikal (Xing-Bei)-type permafrost, which is generally at the southern edge of the permafrost zone in the middle and high latitudes of the Eurasian continent, mainly in the northern part of the Greater Khingan Mountains and Lesser Khingan Mountains and the Songnen Plain, and is a transitional type of high-latitude and high-altitude permafrost [33].
In this study, permafrost changes were analyzed using the permafrost change rate [31]. The results suggest that about 50.3% of the permafrost in northeast China demonstrated decreasing trends over the 39-year study period, and the areas where a decrease occurred were located between 45° N and 51° N; the change trend of permafrost north of 45° N gradually decreased with the increase of the latitude. The rates of change of permafrost ranged from −3.036%/a to 1.275%/a (Figure 5a). The rates of change were higher in the central part of the Greater Khingan Mountains and Hulunbuir Plateau.
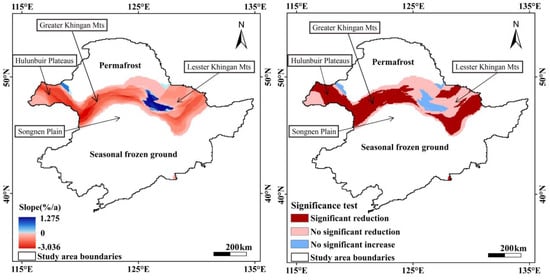
Figure 5.
(a) The variation trend of permafrost in northeast China and (b) the results of an applied significance test.
The significance test results (Figure 5b) reveal that the statistically significant degradation of permafrost in northeast China accounted for 54.8% of the total degraded area (p < 0.05). Areas demonstrating significant declines were found to be mainly distributed north of the central Greater Khingan Mountains and eastern Hulunbuir Plateaus, the northwestern Songnen Plain and southern Lesser Khingan Mountains. The permafrost in the Songnen Plain and the northeast part of the Hulunbuir Plateau increased slightly, but the increasing trend was not significant. The distribution of permafrost in other areas was relatively stable. In general, the degradation trend of permafrost to the west of 125° E was more significant than that to the east.
The spatial variation characteristics of permafrost under different vegetation cover types were also analyzed. The results suggest that the degradation trend of permafrost was different under different vegetation cover types (Table 1). The effects of vegetation cover associated with significant increases of areas of permafrost undergoing degradation, from greatest to least, were ranked as follows: typical grassland > deciduous forest > savanna > mixed forest > evergreen forest > shrubbery. This is mainly because there are abundant plant species and many forest types in the Greater Khingan Mountains forest area, and different forest types have differences in albedo, cover, and root water absorption capacity [45]. This makes the ground temperature different under various forest types, which in turn leads to different degrees of permafrost degradation.

Table 1.
The spatial variation characteristics of permafrost in different vegetation cover types (Note: Significance is at the p < 0.05 level. Others is not a vegetation cover type and does not participate in the calculation).
3.3. Analysis of the Influencing Factors of Permafrost Change
3.3.1. Variation Characteristics of the Influencing Factors
In addition to the three-way zonal factors (i.e. longitude, latitude and altitude), other environmental factors also have an influence on the distribution of permafrost [2]. The complex natural environment of the frozen ground region of northeast China had formed the distribution characteristics of permafrost in the region. In this study, factors such as snow, vegetation cover, solar radiation, precipitation, and soil water were considered, to investigate their influences on permafrost area changes in northeast China. First, the temporal trends of the annual average snow depth, annual snow cover, annual average NDVI, annual average solar radiation, annual average precipitation, and annual average 0–7 cm soil water content were analyzed over the range of permafrost distribution changes in northeast China from 1982 to 2020 (i.e., the region of the changing permafrost distribution in Figure 5a). As a whole, the annual average snow depth and annual average snow cover showed a decreasing trend in line with the change trend of permafrost area. The annual average NDVI, annual average solar radiation, annual average precipitation, annual average 0–7 cm soil water and permafrost area showed the opposite trend of increasing. Among them, the decreasing trend of annual average snow cover was the most significant, with a rate of 0.21%/a (p < 0.01), and the decreasing trend of annual average snow depth was less significant than that of annual average snow cover, with a rate of 0.05 cm/a (p < 0.05). The annual average NDVI, annual average solar radiation, annual average precipitation and annual average 0–7 cm soil water for the same period increased at 0.003/10a (p < 0.05), 0.08 × 10⁵·J·m−2/a (p < 0.05), 1.94 mm/a (p < 0.1), and 0.0002 m3·m−3/a (p < 0.1), respectively (Figure 6).
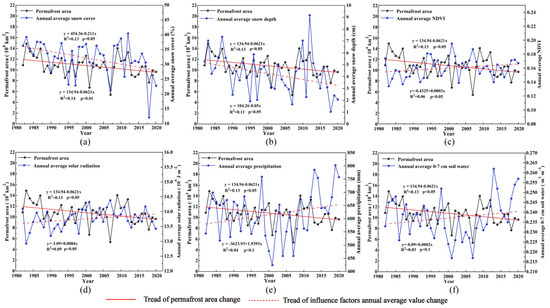
Figure 6.
Time trends of influencing factors: (a) annual average snow cover; (b) annual average snow depth; (c) annual average NDVI; (d) annual average solar radiation; (e) annual average precipitation; (f) annual average 0–7 cm soil water content.
Spatially, the annual average snow cover (Figure 7a) and the annual average snow depth (Figure 7b) were both found to exhibit decreasing trends (i.e., 1 July of this year to 1 July of the following year is a snow year, and the annual average value is calculated element by element). The overall decreasing trend of the annual average snow cover was consistent with that of the annual average snow depth, and both areas of significant reduction were mainly concentrated in the northern part of the Songnen Plain.
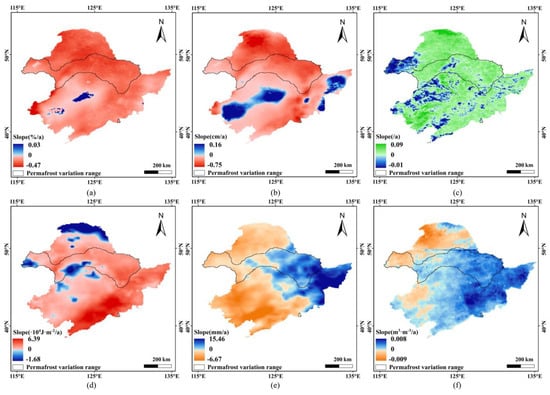
Figure 7.
The spatial distributions of trends in the permafrost influencing factors: (a) annual average snow cover; (b) annual average snow depth; (c) annual average NDVI; (d) annual average solar radiation; (e) annual average precipitation; (f) annual average 0–7 cm soil water content.
The annual average NDVI (Figure 7c) and the annual average solar radiation (Figure 7d) showed overall increasing trends. However, the annual average NDVI in the Hulunbuir Plateau region showed a relatively obvious decreasing trend (p < 0.05), which was probably due to a decrease in annual precipitation and high intensity grazing utilization [46].
The annual average precipitation (Figure 7e) exhibited east-west differences in terms of the spatial distribution. The annual average precipitation decreased to the west of 123° E and increased to the east of 123° E, and the increasing trend was greater than the decreasing trend. The overall tendency of the annual average 0–7 cm soil water content presented an increasing trend (Figure 7f), and the decreasing trend was mainly concentrated in the Hulunbuir Plateau and the northern part of the Greater Khingan Mountains.
3.3.2. Spatiotemporal Correlation Analysis of Permafrost and its Influencing Factors
The current phase of climate warming started in the beginning of the XIXth century, although there was a short cooling period in the sixties and the seventies [47]. Walther et al. [48] demonstrated the significant occurrence of global warming since 1976. Han et al. [49] found a later/earlier trend of snow onset/snow ablation from northeast China to central Mongolia, which may lead to higher global surface temperatures (GSTs) [50] that are detrimental to permafrost development. Guo et al. [51] showed that there was a significant positive correlation between the rise in NDVI and the rise in ground surface temperature in northeast China from 1981 to 2014. Vegetation in the cold season has an insulating effect by blocking the downward transfer of cold air, reducing heat loss from the soil, and slowing down the cooling and freezing of the soil [2]. In addition, in tundra an increase in GST may lead to more long/productive active season and thus to enhanced vegetation growth. Thus, the mechanism of interaction between vegetation and permafrost is complex. Solar radiation is the total heat input to the atmosphere and the ground surface. Daut et al. [52] found a strong linear relationship between solar radiation and the GST, with an increase in solar radiation leading to a concomitant increase in the GST, which may accelerate the degradation of permafrost. Long-term trends in precipitation reveal a significant increase in northern and central Asia [53]. Precipitation can increase the soil water content, enhance the thermal conductivity of soil, and increase the ground surface heat transfer and latent heat of soil melting, which may lead to higher temperatures in the active and permafrost layers [54]. In addition, fully water-saturated soils conduct cold waves more efficiently in winter than in summer. Thus, the effect of water transfer in the soil on the thermal system is more complex.
To explore the effects of different influencing factors on the change of the permafrost area with time, a correlation analysis was performed using the Pearson correlation analysis method [55] (i.e., calculations based on the data in Figure 6). The results showed that the correlation coefficients of annual average snow depth and annual average snow cover with the permafrost area were all greater than 0.6, showing a significant positive correlation (p < 0.00001). The annual average NDVI and annual average solar radiation with the permafrost area showed significant negative correlations, but the correlation significance and correlation coefficient of annual average solar radiation with the permafrost area were lower than those of annual average NDVI. The correlation significance of annual average precipitation and annual average 0–7 cm soil water with the permafrost area were lower, both with p > 0.1. The absolute values of the resulting correlation coefficients, from greatest to least, were ranked as follows: annual average snow cover (0.689) > annual average snow depth (0.648) > annual average NDVI (0.643) > annual average solar radiation (0.374) > annual average precipitation (0.134) > annual average soil water (0.125) (Figure 8).
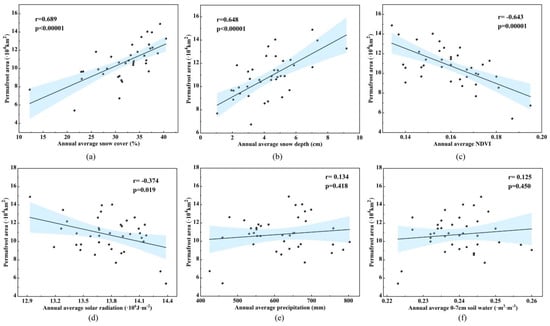
Figure 8.
Pearson correlation coefficients: (a) permafrost and annual average snow cover; (b) permafrost and annual average snow depth; (c) permafrost and annual average NDVI; (d) permafrost and annual average solar radiation; (e) permafrost and annual average precipitation; (f) permafrost and annual average 0–7 cm soil water content.
In addition, the degrees of the contribution of the six explanatory variables (the six influencing factors) to the variation of the explanatory variable (the permafrost area) were explored using dominance analysis [56] (Table 2). The results showed that the annual average snow cover was completely dominant over the annual average snow depth, annual average NDVI, annual average solar radiation, annual average precipitation, and annual average 0–7 cm soil water. There was an overall dominance of annual average NDVI and annual average snow depth, and annual average NDVI was generally dominant over annual average snow depth. The annual average snow depth and annual average NDVI were completely dominant over the annual average solar radiation, annual average precipitation, and annual average 0–7 cm soil water. The contributions of the annual average snow depth, annual average snow cover, and annual average NDVI to the variance in the permafrost area were respectively found to be 0.159, 0.222, and 0.161, accounting for 88.3% of the total contribution, i.e., among the influencing factors of permafrost, snow and vegetation have the greatest impact.
Table 2.
The contributions of the influencing factors to the variance of the permafrost area (Note: K denotes the number of predictor variables included in the sub-model; X1: annual average snow depth; X2: annual average snow cover; X3: annual average NDVI; X4: annual average solar radiation; X5: annual average precipitation; X6: annual average 0–7 cm soil water).
The spatial correlations between the temporal trends of the permafrost area and its influencing factors were examined pixel by pixel. The results show that the correlations between the permafrost changes in northeast China and the spatial variations of the trends of the six influencing factors over the study period were different.
The annual average snow cover (Figure 9a) and annual average snow depth (Figure 9b) in the Hulunbuir Plateau, the central part of the Greater Khingan Mountains and the southern part of the Lesser Khingan Mountains were basically consistent with the significantly degraded permafrost regions (p < 0.05). The area with correlation coefficients less than −0.5 accounted for 38.2% of the total change area and was mainly distributed in the central part of the Greater Khingan Mountains, the northeastern part of the Songnen Plain and the southern part of the Lesser Khingan Mountains (Figure 9c).
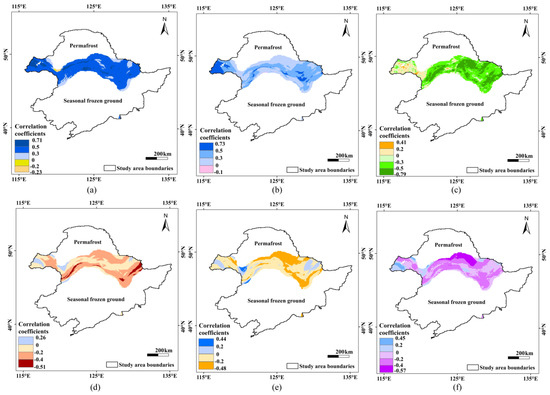
Figure 9.
The spatial distributions of the correlation coefficients between permafrost changes and its influencing factors: (a) annual average snow cover; (b) annual average snow depth; (c) annual average NDVI; (d) annual average solar radiation; (e) annual average precipitation; (f) annual average 0–7 cm soil water content.
The area with an increased solar radiation variation trend was roughly the same as the area with permafrost degradation. The area with a significant negative correlation between the two accounted for 8.73% of the total area of permafrost change (p < 0.05) and was mainly located in the central part of the Greater Khingan Mountains and the southern part of the Lesser Khingan Mountains (Figure 9d).
The trends in precipitation and the 0–7 cm soil water content (Figure 9e,f) were basically consistent with the distribution of permafrost changes. The two were positively correlated with permafrost, accounting for 16.18% and 13.65%, respectively. In the Hulunbuir Plateau and the central part of the Greater Khingan Mountains, most areas were negatively correlated with the permafrost area. Significant negative correlations accounted for 4.68% and 9.41% (p < 0.05) of the total area of permafrost change, which was mainly located in the northeast Songnen Plain.
4. Discussion
4.1. The Surface Frost Number Model and Permafrost
As a result of the uneven distribution of weather stations in high latitudes, it is difficult to manually monitor the permafrost distribution over large areas, which poses a great challenge to the monitoring of permafrost distribution in northeast China. However, a SFNM is a simple model with few input parameters that are easy to obtain and an effective way to estimate permafrost distribution [31]. The SFNM can be used to improve the accuracy of permafrost distribution estimation by adjusting the parameter E [16].
In this study, the estimated permafrost distribution was compared with the existing permafrost distribution maps, and it was found that the estimation was better for E = 0.8. Gao et al. [31] used an E-value of 1.0 to estimate the distribution of permafrost in the Mongolian Plateau, and Nan et al. [16] used E-values of 0.94 and 0.99 to estimate the distribution of permafrost in the western Tibetan Plateau. The E-values from these previous studies were all higher than the E-values used in this study, probably because the E-value is primarily a soil-related parameter [38] and the physical properties of the soil differ from region to region. The area of the inaccurate estimation of the permafrost distribution in this study was found to be mainly located at the southern boundary of permafrost in northeast China, which may be related to the inadequate consideration of soil properties as well as environmental effects.
By estimating the permafrost distribution in northeast China from 1982 to 2020, it was found that the southern boundary of permafrost shifted northward and degraded significantly with a degradation rate of 0.33 × 10⁴ km2/a. Zhang et al. [25] used the geographically weighted regression (GWR) model to estimate the distribution of permafrost in the frozen ground region of northeast China from 1950s to 2010s. They found that the degradation of continuous permafrost, discontinuous permafrost, and island permafrost was more pronounced than that of sparse island permafrost, with a permafrost degradation rate of 0.36 × 10⁴ km2/a. Li et al. [57] combined the top of permafrost (TTOP) model with GWR to estimate the permafrost distribution in the frozen ground region of northeast China from 1961 to 2020, in which the permafrost degraded by 9.57 × 10⁴ km2 during the 29 years from 1961 to 1990, with a degradation rate of 0.33 × 10⁴ km2/a. Zhang et al. [58] compared the differences between SFNM and TTOP in estimating the permafrost distribution in the frozen ground region of northeast China from 2001 to 2018 and found that there was no significant difference between the two models. The above findings are generally consistent with the conclusions reached in this study and further confirm that SFNM is an effective method for estimating permafrost distribution in northeast China.
However, after analyzing the spatial trend changes of permafrost in northeast China from 1982 to 2020 and testing for significance, it was found that a small amount of permafrost in southern Heilongjiang Province, China (near the Qiqihar weather station) exhibited a non-significant increasing tread. Wang et al. [59] analyzed the soil temperature trends of 15 national weather stations in Heilongjiang Province, China, during the growing season (May–September) from 1965 to 2020, and found that the soil temperature at the Qiqihar weather station during the growing season showed an increasing trend, but the trend was not significant. Li et al. [60] found that southern Heilongjiang Province, China, experienced rare spring low temperatures and very heavy snowstorms in 2010 with extremely slow increases in the ground temperature, and significant temperature decreases in the spring of 2013. Ban et al. [61] found that the temperature in southern Heilongjiang Province, China, in 2017–2018 was 2.2 °C lower than that during the same period of the previous year, which was the third-lowest temperature since 1981, after 2000 and 2012. Therefore, it is inferred that extreme weather decreases the ground temperature during the cold season and attenuates the non-significant increase in the ground temperature during the warm season in the southern part of Heilongjiang Province, China, resulting in a corresponding non-significant increase in permafrost.
In addition, the results of this study showed that permafrost levels below 600 m in altitude were actively changing, and those above 1000 m in altitude were relatively stable. We thought that this may be related to the different soil structure in different altitude ranges. As can be seen from Table 3, the distribution area of loam (L) and clay loam (CL) above 1000 m in altitude accounts for a larger proportion, 82.64%. The proportion of the distribution area of loam (L) and clay loam (CL) with altitude below 1000 m was smaller, and the sand content of the soil was higher. Different soil structures mean that their degree of slabbing and pore conditions are different. High soil viscosity, poor permeability and low temperature variation are conducive to permafrost development. On the contrary, high soil sand content leads to high soil thermal conductivity, which is not conducive to permafrost development [62]. Therefore, we thought that the different soil structure at different altitudes was one of the reasons for the large variations in the respective areas of permafrost at low altitudes.
Table 3.
Soil structure in different altitude ranges.
4.2. Influencing Factors
The effect of the snow on the shallow ground temperature under certain conditions greatly exceeds the effect of vegetation [63]. Cui et al. [2] demonstrated that snow keeps winter temperatures cool and isolates the soil from external conditions. Therefore, the thinner the snow cover, the higher the degree to which the soil stays frozen. However, the results obtained in this study indicate that a decrease in the snow depth and snow thickness did not result in an increase in the permafrost area, which may be due to a shorter annual freezing cycle caused by a shorter snow duration, which affects the impact of winter snow on permafrost [49]. In addition, the effect of a particular snow depth and its presence time on permafrost still needs further discussion in the future.
Sun et al. [64] showed that the surface ground temperature of permafrost under a forest floor with higher vegetation cover at the same elevation is lower, which is favorable to the development of permafrost. In contrast, the results of Guo et al. [51] are generally consistent with the conclusions reached in this study, namely that permafrost degradation increases with the increase of the NDVI. The reason for these two different perspectives may be that vegetation blocks cold air from reaching the ground in winter, resulting in higher GSTs. In addition, soil temperatures vary under different vegetation cover types, which may bring about different degrees of permafrost degradation. The annual average surface temperature of the soil increases by 1 to 2 °C due to the presence of moss layers and shrubs [65]. Chen et al. [66] showed that the forest type changed after deforestation in the Greater Khingan Mountains. A change from an evergreen coniferous forest to a coniferous and broad-leaved mixed forest was found to result in an increase in the average ground temperature of about 5 °C and an increase in the maximum seasonal melt depth of about 10–20 cm. In addition, aspen (deciduous forest) and grassland had better soil drainage with average summer ground temperatures of 10–12 °C and 8–10 °C, respectively, while dwarf black spruce (evergreen forest) was found to have poor drainage with ground temperatures of about 3 °C [67]. Poor drainage conditions are favorable to the growth of mosses, thus, forming an anaerobic environment that can promote the accumulation of organic matter on the soil surface and the development of a peat layer. The organic matter and peat layer can slow down the heating of the ground surface by solar radiation in summer, while in winter the ground heat is greatly dissipated due to the increase in thermal conductivity after freezing. When the heat release in winter is greater than the heat absorption in summer, the annual average GST of the soil shows a decreasing trend, which is very favorable to the formation, preservation, or development of permafrost [68]. The significant reduction in the area of permafrost under savanna and typical grasslands may be attributed to the significant reduction in solar radiation interception due to grassland degradation and thus the increase in the ground temperature [69]. The above findings are generally consistent with the conclusions reached in this study.
Precipitation and soil water affect permafrost development mainly by changing the dry and wet conditions of the soil [2]. The infiltration of precipitation can lead to an increase in soil water, which in turn increases the thermal conductivity of the soil and is detrimental to permafrost development [54]. However, if most of the precipitation becomes surface runoff, the development of permafrost will be favored [70]. Thus, environmental factors have a complex influence on the presence and development of permafrost and are highly dependent on the bio-geomorphic context of the area under consideration.
4.3. Limitations and Prospects
The SFNM has some good applications for the estimation of the permafrost distribution in northeast China [15,26]. However, as the model only considers the effect of the temperature and while the E-value can be adjusted to increase the accuracy, it still produces errors in the estimation. The F-value is the key to determining the permafrost and seasonal frozen ground boundaries. However, the F-value used in this study is a theoretical value derived from equations, which may differ from the actual F-value, and further investigation of the actual F-value is needed in the future to improve the accuracy of the model. Meanwhile, this study chose to estimate the permafrost distribution by weather station data and using an ordinary kriging interpolation method, which may produce large errors in local areas; more accurate interpolation methods should be further used to estimate the permafrost distribution in the future. The spatial resolution of the influence factor data was low, which could not reflect the relationships between the permafrost distribution and the influencing factors on a small scale. In the future, higher-resolution influence factor data should be used to analyze their influence on permafrost distribution.
5. Conclusions
Permafrost in the northeast China is an important part of the high-latitude permafrost in the northern Hemisphere. In this research, a SFNM was used to estimate the permafrost distribution in northeast China in the period of 1982 to 2020 and the spatiotemporal variations of permafrost were quantified. The estimated permafrost distribution was compared with existing permafrost distribution maps, and the comparison results showed a high precision of the estimation results, respectively; this indicates that the SFNM achieved good results in estimating the permafrost distribution in northeast China. According to the modeling results of the permafrost distribution from 1982 to 2020, the permafrost in northeast China exhibited a degradation trend. In addition, there was a small amount of non-significant increase in permafrost in the northeast region of the Songnen Plain, which we thought was related to the extreme cold weather. The permafrost degradation in northeast China presented obvious latitudinal zonality. Meanwhile, this research analyzed the spatiotemporal relationships between permafrost area changes and six types of environmental factors (the annual average snow depth, annual average snow cover, annual average NDVI, annual average solar radiation, annual average precipitation, and the annual average 0–7 cm soil water) within the range of permafrost area changes. The results of a dominance analysis and spatial correlation analysis showed that, among the six influencing factors, snow and NDVI had the highest spatial and temporal correlation with the permafrost degradation in northeast China. In addition, permafrost degradation was more significant in typical grassland, deciduous forest, and savannah vegetation cover types than in mixed forest, evergreen forest, and shrubbery. Therefore, snow and vegetation had the greatest influence on the change of permafrost area in northeast China. This finding increased the understanding of the influence of environmental factors on the change of permafrost in northeast China and provided an important scientific basis for the rational development and protection of the ecosystem in northeast China under climate warming conditions.
Author Contributions
Conceptualization, D.Y. and D.Z.; methodology, D.Y. and D.Z.; software, D.Y.; validation, D.Y. and M.L.; formal analysis, D.Y.; investigation, M.L. and S.Z.; resources, D.Z.; data curation, D.Z. and M.L.; writing—original draft preparation, D.Y.; writing—review and editing, D.Y., D.Z. and M.L.; supervision, M.L.; funding acquisition, M.L. All authors have read and agreed to the published version of the manuscript.
Funding
This research was funded by the Excellent Young Scholars Program of Natural Science Foundation of Heilongjiang Province [grant number: YQ2022D009], National Natural Science Foundation of China [grant number: 41901072] and the Joint Key Program of the NSFC and Heilongjiang Province of China [grant number: U20A2082].
Data Availability Statement
The data presented in this study are available on request from the corresponding website. http://data.cma.cn/ accessed on 8 September 2021. https://www.ncei.noaa.gov/ accessed on 16 January 2022. http://data.tpdc.ac.cn/zh-hans/ accessed on 9 March 2022. https://developers.google.com/earth-engine/ accessed on 21 April 2022. https://www.fao.org/soils-portal accessed on 19 September 2022.
Acknowledgments
We would like to thank the anonymous reviewers for their constructive comments; we also thank the National Tibetan Plateau Data Center for providing relevant data for this study and the support of Harbin Normal University Graduate Academic Forum.
Conflicts of Interest
The authors declare that there are no real or perceived conflict of interest involved in the submission and/or publication of this manuscript.
References
- Dobinski, W. Permafrost. Earth-Sci. Rev. 2011, 108, 158–169. [Google Scholar] [CrossRef]
- Cui, Y.; Sheng, Y.; Zhang, Z. Influence of Environmental Factors on Distribution and Development of Xing’an-Baikal Permafrost. J. Jilin Univ. (Earth Sci. Ed.) 2021, 51, 1427–1440. [Google Scholar] [CrossRef]
- Streletskiy, D.; Anisimov, O.; Vasiliev, A. Permafrost Degradation//Snow and Ice-Related Hazards, Risks, and Disasters; Haeberli, W., Whiteman, C., Eds.; Elsevier: Amsterdam, The Netherlands, 2014; pp. 303–344. [Google Scholar] [CrossRef]
- Qin, Y.; Lei, H.; Yang, D.; Gao, B.; Wang, Y.; Cong, Z.; Fan, W. Long-term change in the depth of seasonally frozen ground and its ecohydrological impacts in the Qilian Mountains, northeastern Tibetan Plateau. J. Hydrol. 2016, 542, 204–221. [Google Scholar] [CrossRef]
- Che, L.; Cheng, M.; Xing, L.; Cui, Y.; Wan, L. Effects of permafrost degradation on soil organic matter turnover and plant growth. Catena 2022, 208, 105721. [Google Scholar] [CrossRef]
- Guo, J.; Han, F.; Hu, Y. Ecological characteristics of vegetation and their responses to permafrost degradation in the north slope of Great Khingan Mountain valley of northeast China. Acta Ecol. Sin. 2017, 37, 6552–6561. [Google Scholar] [CrossRef]
- Camill, P.; Clark, J.S. Long-term perspectives on lagged ecosystem responses to climate change: Permafrost in boreal peatlands and the grassland/woodland boundary. Ecosystems 2000, 3, 534–544. [Google Scholar] [CrossRef]
- AminiTabrizi, R.; Wilson, R.M.; Fudyma, J.D.; Hodgkins, S.B.; Heyman, H.M.; Rich, V.I.; Saleska, S.R.; Chanton, J.P.; Tfaily, M.M. Controls on soil organic matter degradation and subsequent greenhouse gas emissions across a permafrost thaw gradient in Northern Sweden. Front. Earth Sci. 2020, 8, 557961. [Google Scholar] [CrossRef]
- Hjort, J.; Streletskiy, D.; Doré, G.; Wu, Q.; Bjella, K.; Luoto, M. Impacts of permafrost degradation on infrastructure. Nat. Rev. Earth Environ. 2022, 3, 24–38. [Google Scholar] [CrossRef]
- Lu, G.; Weng, B.; Guo, D. Geographical southern limit of permafrost in Northeastern China. J. Glaciol. Geocryol. 1993, 15, 214–218. [Google Scholar]
- Xin, K.; Ren, Q. Distribution of permafrost in Northeast China. Geol. Knowl. 1956, 10, 15–18. [Google Scholar]
- Heginbottom, J.A. Permafrost mapping: A review. Prog. Phys. Geogr. 2002, 26, 623–642. [Google Scholar] [CrossRef]
- Zhang, X.; Nan, Z.; Wu, J.; Du, E.; Wang, T.; You, Y. Mountain permafrost distribution modeling using Multivariate Adaptive Regression Spline (MARS) in the Wenquan area over the Qinghai-Tibet Plateau. Sci. Cold Arid. Reg. 2012, 4, 361–370. [Google Scholar] [CrossRef]
- Nelson, F.E. Permafrost distribution in central Canada: Applications of a climate-based predictive model. Ann. Assoc. Am. Geogr. 1986, 76, 550–569. [Google Scholar] [CrossRef]
- Lü, J.; Li, X.; Hu, Y.; Wang, X.; Sun, J. Application of frost number model in Northeast China pepmafrost regionalization. Yingyong Shengtai Xuebao 2008, 19, 2271–2276. [Google Scholar]
- Nan, Z.; Li, S.; Cheng, G.; Huang, P. Surface frost number model and its application to the Tibetan plateau. J. Glaciol. Geocryol. 2012, 34, 89–95. [Google Scholar]
- Ran, Y.; Li, X.; Jin, R.; Guo, J. Remote sensing of the mean annual surface temperature and surface frost number for mapping permafrost in China. Arct. Antarct. Alp. Res. 2015, 47, 255–265. [Google Scholar] [CrossRef]
- Wei, Z.; Jin, H.; Zhang, J.; Yu, S.; Han, X.; Ji, Y.; He, R.; Chang, X. Prediction of permafrost changes in Northeastern China under a changing climate. Sci. China Earth Sci. 2011, 54, 924–935. [Google Scholar] [CrossRef]
- Chen, S.; Zang, S.; Sun, L. Permafrost degradation in Northeast China and its environmental effects: Present situation and prospect. J. Glaciol. Geocryol. 2018, 40, 298–306. [Google Scholar] [CrossRef]
- Guo, D.; Wang, S.; Lu, G.; Dan, J. Division of Permafrost Regions in Daxiao Hinggan Ling Northeast China. J. Glaciol. Geocryol. 1981, 3, 1–9. [Google Scholar]
- Xie, Y. Climatic Condition in the Formation and Evolution of Permafrost in Northeast China. J. Glaciol. Geocryol. 1985, 7, 323–330. [Google Scholar]
- Zhou, Y.; Wang, Y.; Gao, X.; Yue, H. Ground Temperature, Permafrost Distribution and Climate Warming in Northeastern China. J. Glaciol. Geocryol. 1996, S1, 9. [Google Scholar]
- He, R.; Jin, H.; Chang, X.; Lv, L.; Yu, S.; Yang, S.; Wang, S.; Sun, G. Degradation of permafrost in the northern part of northeastern China: Present state and causal analysis. J. Glaciol. Geocryol. 2009, 31, 829–834. [Google Scholar] [CrossRef]
- Wang, F.; Li, G.; Ma, W.; Wu, Q.; Serban, M.; Vera, S.; Alexandr, F.; Jiang, N.; Wang, B. Pipeline–permafrost interaction monitoring system along the China–Russia crude oil pipeline. Eng. Geol. 2019, 254, 113–125. [Google Scholar] [CrossRef]
- Zhang, Z.; Wu, Q.; Hou, M.; Tai, B.; An, Y. Permafrost change in Northeast China in the 1950s–2010s. Adv. Clim. Chang. Res. 2021, 12, 18–28. [Google Scholar] [CrossRef]
- Zhan, D.; Man, H.; Zang, S.; Li, M. Simulation of frozen ground distribution in northeast China based on a surface frost number model. J. Geogr. Sci. 2022, 32, 1581–1600. [Google Scholar] [CrossRef]
- Zhou, M.; Yu, X.; Feng, L. Analysis on the driving force of the permafrost degeneration in Daxinganling. J. Arid Land Resour. Environ. 2002, 4, 44–47. [Google Scholar] [CrossRef]
- Zhou, X.; Zhao, C.; Li, N.; Liu, M.; Cui, Y.; Ao, X. Influence of snow and temperature on the depth of frozen soil in winter half year in Northeast China. J. Glaciol. Geocryol. 2021, 43, 1027–1039. [Google Scholar] [CrossRef]
- Chang, X.; Jin, H.; Wang, Y.; Zhang, Y.; Zhou, G.; Che, F.; Zhao, Y. Influences of vegetation on permafrost: A review. Acta Ecol. Sin. 2012, 32, 7981–7990. [Google Scholar] [CrossRef]
- Zhu, X.; Wu, T.; Zhao, L.; Yang, C.; Zhang, H.; Xie, C.; Li, R.; Wang, W.; Hu, G.; Ni, J. Exploring the contribution of precipitation to water within the active layer during the thawing period in the permafrost regions of central Qinghai-Tibet Plateau by stable isotopic tracing. Sci. Total Environ. 2019, 661, 630–644. [Google Scholar] [CrossRef]
- Gao, H.; Sa, C.; Meng, F.; Luo, M.; Wang, M.; Zhang, H. Temporal and spatial characteristics of permafrost on Mongolian Plateau from 2003 to 2019. J. Arid Land Resour. Environ. 2022, 36, 99–106. [Google Scholar] [CrossRef]
- Chen, S.; Zang, S.; Sun, L. Dynamic Variation of Soil Moisture and Impact in Permafrost Regions in Northeast China. Res. Soil Water Conserv. 2020, 27, 113–118. [Google Scholar] [CrossRef]
- Li, X.; Cheng, G.; Jin, H.; Kang, E.; Che, T.; Jin, R.; Wu, L.; Nan, Z.; Wang, J.; Shen, Y. Cryospheric change in China. Glob. Planet. Chang. 2008, 62, 210–218. [Google Scholar] [CrossRef]
- Liu, J.; Hayakawa, N.; Lu, M.; Dong, S.; Yuan, J. Winter streamflow, ground temperature and active-layer thickness in northeast China. Permafr. Periglac. Process. 2003, 14, 11–18. [Google Scholar] [CrossRef]
- Shi, Y.; Mi, D. Distribution map of frozen ground in China based on Map of Snow, Ice and Frozen Ground in China. Natl. Tibet. Plateau Data Cent. 2013. [Google Scholar] [CrossRef]
- Ran, Y.; Li, X.; Cheng, G.; Zhang, T.; Wu, Q.; Jin, H.; Jin, R. Distribution of permafrost in China: An overview of existing permafrost maps. Permafr. Periglac. Process. 2012, 23, 322–333. [Google Scholar] [CrossRef]
- Nelson, F.E.; Outcalt, S.I. A computational method for prediction and regionalization of permafrost. Arct. Antarct. Alp. Res. 1987, 19, 279–288. [Google Scholar] [CrossRef]
- Hu, J.; Zhao, S.; Nan, Z.; Wu, X.; Sun, X.; Cheng, G. An effective approach for mapping permafrost in a large area using subregion maps and satellite data. Permafr. Periglac. Process. 2020, 31, 548–560. [Google Scholar] [CrossRef]
- Luo, D.; Jin, H.; Marchenko, S.S.; Romanovsky, V.E. Difference between near-surface air, land surface and ground surface temperatures and their influences on the frozen ground on the Qinghai-Tibet Plateau. Geoderma 2018, 312, 74–85. [Google Scholar] [CrossRef]
- Le, N.D.; Zidek, J.V. Statistical Analysis of Environmental Space-Time Processes; Springer: Berlin/Heidelberg, Germany, 2006. [Google Scholar]
- Zhang, X.; Zang, S.; Sun, L. Spatial-temporal variation characteristics of snow cover days in Northeast China in the past 40 years and their relationship with climatic factors. Adv. Earth Sci. 2018, 33, 958–968. [Google Scholar] [CrossRef]
- Cohen, J. A coefficient of agreement for nominal scales. Educ. Psychol. Meas. 1960, 20, 37–46. [Google Scholar] [CrossRef]
- Shi, Y.; Niu, F.; Yang, C.; Che, T.; Lin, Z.; Luo, J. Permafrost presence/absence mapping of the Qinghai-Tibet Plateau based on multi-source remote sensing data. Remote Sens. 2018, 10, 309. [Google Scholar] [CrossRef]
- Landis, J.R.; Koch, G.G. The measurement of observer agreement for categorical data. Biometrics 1977, 33, 159–174. [Google Scholar] [CrossRef] [PubMed]
- Chang, X.; Jin, H.; Yu, S.; Sun, H.; He, R.; Luo, D.; Sun, G.; Lu, L. Influence of vegetation on frozen ground temperatures the forested area in the Da Xing’anling Mountains, Northeastern China. Shengtai Xuebao/Acta Ecol. Sin. 2011, 31, 5138–5147. [Google Scholar]
- Zan, G.; Sun, T. Vegetation cover change on Hulun Buir grassland. For. Resour. Wanagement 2011, 1, 44–48. [Google Scholar] [CrossRef]
- Le Roy Ladurie, E. Climate and Its History. Rev. BNF 2010, 36, 5–11. [Google Scholar] [CrossRef]
- Walther, G.; Post, E.; Convey, P.; Menzel, A.; Parmesan, C.; Beebee, T.J.; Fromentin, J.; HoeghGuldberg, O.; Bairlein, F. Ecological responses to recent climate change. Nature 2002, 416, 389–395. [Google Scholar] [CrossRef] [PubMed]
- Han, L.; Tsunekawa, A.; Tsubo, M.; He, C.; Shen, M. Spatial variations in snow cover and seasonally frozen ground over northern China and Mongolia, 1988–2010. Glob. Planet. Chang. 2014, 116, 139–148. [Google Scholar] [CrossRef]
- Ling, F.; Zhang, T. Impact of the timing and duration of seasonal snow cover on the active layer and permafrost in the Alaskan Arctic. Permafr. Periglac. Process. 2003, 14, 141–150. [Google Scholar] [CrossRef]
- Guo, J.; Hu, Y.; Xiong, Z.; Yan, X.; Li, C.; Bu, R. Variations in growing-season NDVI and its response to permafrost degradation in Northeast China. Sustainability 2017, 9, 551. [Google Scholar] [CrossRef]
- Daut, I.; Yusoff, M.I.; Ibrahim, S.; Irwanto, M.; Nsurface, G. Relationship between the solar radiation and surface temperature in Perlis. Adv. Mater. Res. 2012, 512–515, 143–147. [Google Scholar] [CrossRef]
- Alexander, L.V.; Zhang, X.; Peterson, T.C.; Caesar, J.; Gleason, B.; Klein Tank, A.; Haylock, M.; Collins, D.; Trewin, B.; Rahimzadeh, F. Global observed changes in daily climate extremes of temperature and precipitation. J. Geophys. Res. Atmos. 2006, 111, 1042–1063. [Google Scholar] [CrossRef]
- Slater, A.G.; Lawrence, D.M. Diagnosing present and future permafrost from climate models. J. Clim. 2013, 26, 5608–5623. [Google Scholar] [CrossRef]
- Benesty, J.; Chen, J.; Huang, Y.; Cohen, I. Pearson correlation coefficient. In Noise Reduction in Speech Processing; Springer: Berlin/Heidelberg, Germany, 2009; pp. 1–4. [Google Scholar]
- Ma, J.; Tian, F.; Chen, L. Relative importance analysis of debris flow factors based on dominance analysis: A case study of the Bailongjiang Basin in China. J. Lanzhou Univ. (Nat. Sci.) 2014, 50, 722–727. [Google Scholar] [CrossRef]
- Li, X.; Jin, H.; Sun, L.; Wang, H.; Huang, Y.; He, R.; Chang, X.; Yu, S.; Zang, S. TTOP-model-based maps of permafrost distribution in Northeast China for 1961–2020. Permafr. Periglac. Process. 2022, 33, 425–435. [Google Scholar] [CrossRef]
- Zhang, Y.; Zang, S.; Li, M.; Shen, X.; Lin, Y. Spatial Distribution of Permafrost in the Xing’an Mountains of Northeast China from 2001 to 2018. Land 2021, 10, 1127. [Google Scholar] [CrossRef]
- Wang, H.; Liu, B. Change Characteristics of Surface Temperature in Growing Season in Hei long jiang Province in Recent 47 Years. Prot. For. Sci. Technol. 2016, 12, 5. [Google Scholar] [CrossRef]
- Li, S.; Wang, P.; Chen, L.; Jiang, L.; Wang, L.; Gong, L. Variation features and prediction of the topsoil (0–20 cm) ground temperature of spring in Heilongjiang Province. J. Glaciol. Geocryol. 2014, 36, 8. [Google Scholar] [CrossRef]
- Ban, J.; Li, Y.; Zhao, J.; Sun, M. Cause Analysis of Temperature Anomaly in Heilongjiang Province in Winter of 2017-2018. Heilongjiang Meteorol. 2019, 36, 14–17. [Google Scholar] [CrossRef]
- Shur, Y.L.; Jorgenson, M.T. Patterns of permafrost formation and degradation in relation to climate and ecosystems. Permafr. Periglac. Process. 2007, 18, 7–19. [Google Scholar] [CrossRef]
- Jin, X.; Jin, H.; Iwahana, G.; Marchenko, S.S.; Luo, D.; Li, X.; Liang, S. Impacts of climate-induced permafrost degradation on vegetation: A review. Adv. Clim. Chang. Res. 2021, 12, 29–47. [Google Scholar] [CrossRef]
- Sun, G.; Yu, S.; Wang, H. Causes, south borderline and subareas of permafrost in Da Hinggan mountains and Xiao Hinggan Mountains. Sci. Geogr. Sin. 2007, 27, 68. [Google Scholar] [CrossRef]
- Kudryavtsev, V.; Garagulya, L.; Melamed, V. Fundamentals of Frost Forecasting in Geological Engineering Investigations (Osnovy Merzlotnogo Prognoza pri Inzhenerno-Geologicheskikh Issledovaniyakh); Cold Regions Research and Engineering Lab Hanover NH: Hanover, Germany, 1977. [Google Scholar]
- Chen, Y.; Yin, Y. Impacts of forest industry development in the Da Xing’anling Mountains on the seasonally thawed layer overlying permafrost. In Proceedings of the 5th Chinese Conference on Glaciology and Geocryology, Gansu Culture Press, Lanzhou, China, 18 August 1996. [Google Scholar]
- Luthin, J.; Guymon, G. Soil moisture-vegetation-temperature relationships in central Alaska. J. Hydrol. 1974, 23, 233–246. [Google Scholar] [CrossRef]
- Goodrich, L. Some results of a numerical study of ground thermal regimes. In Proceedings of the 3rd International Conference on Permafrost, Edmonton, AB, Canada, 10 July 1978. [Google Scholar]
- Zhang, H.; Fan, J.; Gao, D.; Liu, Y.; Du, H. Effect of Decreasing the Interception of Solar Illuminance by Vegetation on Ground Temperature in Degraded Grasslands. Sustainability 2022, 14, 4488. [Google Scholar] [CrossRef]
- Boike, J.; Roth, K.; Overduin, P.P. Thermal and hydrologic dynamics of the active layer at a continuous permafrost site (Taymyr Peninsula, Siberia). Water Resour. Res. 1998, 34, 355–363. [Google Scholar] [CrossRef]
Disclaimer/Publisher’s Note: The statements, opinions and data contained in all publications are solely those of the individual author(s) and contributor(s) and not of MDPI and/or the editor(s). MDPI and/or the editor(s) disclaim responsibility for any injury to people or property resulting from any ideas, methods, instructions or products referred to in the content. |
© 2023 by the authors. Licensee MDPI, Basel, Switzerland. This article is an open access article distributed under the terms and conditions of the Creative Commons Attribution (CC BY) license (https://creativecommons.org/licenses/by/4.0/).