Abstract
Brownfields are a real problem which affects the urban appearance of cities and the quality of life of their inhabitants. In Romania, industrial areas were mainly concentrated on the outskirts of large cities, in the immediate vicinity of residential areas. With the closing of factories and the additional population of the big cities, there was a need for expansion of residential areas with a social-economic function. This paper proposes a case study from the classical surveying measurement equipment (GNSS—Global Navigation Satellite System and TS—Total Station) for land use planning of brownfield regeneration projects. The chosen area is in the northwest part of Romania, in Cluj-Napoca, where a former brick factory was closed, leaving behind unaesthetic and unused land. In this paper, it is suggested that a better understanding of the way in which UAV—Unmanned Aerial Vehicle—aerial photogrammetry can contribute to providing information for the design and development of this area. In addition, this study confirms the advantages of effective and practical use of the obtained geospatial information for the design of a residential complex in the studied area, a complex proposed as a sustainable alternative to the former industrial area. Observation and analysis of the differences between the two topo-geodetic works were carried out with the help of UAV technology, such as GNSS—Global Navigation Satellite System and TS—Total Station technology, respectively, to create a topographic plan, level curves, and 3D models made of the building in the study area.
1. Introduction
1.1. Brownfields Approach, in the Context of Urban Development
There are several definitions of the term “brownfield site”. The most common ones define this term as a “potential real estate expansion, a redevelopment of an area, or a former industrial area whose reuse may be complicated by the potential presence of a dangerous substance, pollutant, or contaminant” [1], Depending on the area of Europe that we are studying, we can find significant differences in the understanding of the meaning of brownfields identified in Europe and its regions [2].
There are also common characteristics, including the fact that the need to change the environment in big cities, in post-industrial areas, is linked to spatial arrangements and the need to gain land for the development of residential areas, based on demographics, and the expansion of these cities.
It therefore becomes natural that any existing piece of land is useful for the development of new residential areas and, as such, fetches a high price on the real estate market. The urban environment is described and defined in different forms. In any situation, if we refer to recent urban developments, there are common concerns regarding the resistance of the urban environment [3]. Any urban settlement is in constant need of development, but it has always been a challenge to develop them in a controlled and healthy way [4].
Although there are many benefits to the redevelopment and reuse of brownfield sites [5,6,7,8,9], these redevelopment efforts are dependent on the profit potential of private investors, so they are undertaken at a much lower rate than is desirable from a social point of view; even when government incentives work in the market, these investments are dependent on conjunctures related to the need for real estate in the respective area [10]. In most brownfields in the former communist countries, for the restoration and reproduction of the urban circuit area, residential complexes or various commercial centers were chosen as the design solution, to the detriment of socio-cultural buildings, schools, universities, parks, and green spaces, precisely because of these permanent needs for immediate investment profit.
The construction of commercial centers and residential projects is associated with transformation of the urban fabric. These facilities are built both in undeveloped areas such as greenfield investments and in degraded areas that have lost their existing utility functions (brownfield investments), provided that potential investors manage to capitalize on the urban potential of the site [11].
Previous research and studies in the specialized literature have mainly focused on the study of urban planning, sustainable development, and decision-making methods for the restoration, rehabilitation, and sustainable development of former brownfields. These models have been applied to selected regions using various analytical tools [12]. Recent approaches to urban planning and territorial systematization include the active participation and involvement of the resident population in the area, in making decisions regarding the regeneration and further development of the regional urban landscape [13].
1.2. UAV-UAS (Unmanned Aerial Vehicle-Unmanned Aerial System)
Related to UAV-UAS (Unmanned Aerial Vehicle-Unmanned Aerial System) technology, recent studies have focused on the influence of flight height and image sensor quality on the quality of UAS-Unmanned Aerial System orthophotos for cadastral purposes, starting, mostly from ground control points (GCP) determined with the help of Real-Time Kinematic GNSS technology (Global Navigation Satellite Systems), points that were used for the orthorectification and georeferencing of the images resulting from the drone flight [14]. The world of geodesy (in general, land surveying) uses various techniques to collect data. The most modern ones use LIDAR (Light Detection and Ranging) technology including laser scanning [15,16], drone flights and photogrammetry planes [17,18], topographic total stations [19], and other techniques that belong to remote sensing and mobile mapping. Although photogrammetry technology is not new [20], the evolution of aircraft in recent years, the ability to render drones of the commercial circuit (these drones being initially dedicated to the military field), the evolution of software for post-processing, and analysis of real networks has advanced significantly in recent years [21].
Studies have been made demonstrating that a large image overlap, as well as a cross-flight pattern, increases the accuracy and completeness of automatically delineated walls. These studies also analyzed the influence of the number of ground control points (GCP) used in Unmanned Aerial Vehicle (UAV) flights on the accuracy of the determination of cadastral boundaries [22]. Certain studies [22] have also included the possibility of extracting information on boundaries, using a UAV (Unmanned Aerial Vehicle) algorithm called gpb contour detection (globalized probability of boundary), an algorithm based on texture, color, and brightness of pixels from RGB images taken with a multispectral UAV (Unmanned Aerial Vehicle) camera. This procedure is extremely useful because it eliminates part of the human interpretation error and uses the concept of unsupervised image classification, which has long been used in remote sensing.
Regarding focal length configuration, previous research demonstrates that focal length can be corrected during the bundle block adjustment with a good acquisition configuration [23]. The effect of the internal temperature of the photo sensor at the time of taking the images was also studied, reaching the conclusion that when this variation is not taken into consideration and one camera calibration is given for the whole dataset, an important degradation of accuracy can occur, mainly in altimetry. The same study also analyzed the influence of the flight altitude, and the number of ground control points (GCP) in direct relation to the flight direction, to analyze the accuracy of determining the control points (CP) [24]. It was concluded following the comparative studies that in a situation where checkpoints (CP) indicate high absolute accuracy of an orthophoto, the reliability of reconstructed scene objects varies, particularly in adverse conditions, taking into consideration large variations in the height component.
Another challenge that was considered in recent studies [25] was related to the relationship between the increased volume of data collected in the field with the help of more and more performing sensors, and the need to process this information as quickly as possible, sometimes in near-real-time. This analysis was carried out considering the fact that the data sets collected are becoming larger and larger (5–6 GB for an orthoimage); in this context, there is also the need to develop hardware and software processing capabilities. At this moment in hardware development, it is concluded that for users who have normal processing capabilities, an increasing amount of sensor data may already result in data processing difficulties, mainly regarding time, which do not really allow linking them to near-real-time systems.
Different meteorological conditions were taken into account in the performance of drone flights [26]. Wind is only one of the factors. Comparative studies were also carried out between the accuracy of determinations from aerial photogrammetry and that from terrestrial photogrammetry. It was demonstrated that terrestrial photogrammetry combined with aerial photogrammetry is very effective to perform a visibility analysis [26].
It can be concluded that the main advantage of using a UAS—Unmanned Aerial System for geodetic topography remains the ability to collect a large amount of data in a short period of time compared to classic topography methods, through non-invasive methods which are much safer, because they do not require the effective presence of the operator in places with potential danger on the construction site. The information can therefore be retrieved from a certain distance [27]. However, there are also disadvantages related to the precision of the determinations, but these are the subject of a discussion in the dedicated chapter.
There are previous studies of landslides and subsidence in newly built areas conducted with the help of UAV (unmanned aerial vehicle) technology; these studies were based on the comparison of the results obtained from the drone flight with those obtained through the GNSS (Global Navigation Satellite System) technology. The conclusion of these studies was that the results obtained with the drone align within acceptable tolerances (1–3 cm) with those obtained by the other procedures [28]. Despite the increasing use of new technologies, total stations remain an essential tool for many monitoring projects, such as those that investigate land and buildings, because they offer the possibility of immediate field verification of retrieved coordinates, starting from national geodetic networks [28].
1.3. The Main Purpose of the Study
The main purpose of this study paper is to highlight the way in which the topographic and photogrammetric methods (UAV—Unmanned Aerial Vehicle) used by land surveying specialists can help to restore former brownfields located in the perimeter of big cities and the reproduction of these areas in the urban planning circuit. The idea behind this study starts from the desire to demonstrate to the potential beneficiaries that, despite the known limitations, the recent evolution of photogrammetric flights offers a sufficiently good precision of the subsequent determination of the points in relation to the allocated time.
To achieve this goal, a comparative approach to the topographic methods (the so-called “classical methods”) and photogrammetric methods was chosen; the use of both methods resulted in the generation of a topographic plan necessary for the design of a complex residential complex, as well as for the restoration of the industrial area in the perimeter of the former brownfields in the studied area.
In addition, following the case study, other deliverables useful for the design activity were generated: DEM—Digital Elevation Model, level curves, volume calculation, and georeferenced orthophoto image.
2. Materials and Methods
2.1. Study Area
Geographical Description
The municipality of Cluj-Napoca is located in Romania in the central area of Transylvania, with an administrative area of 179.5 km2 and a built-up area of about 36 km2. Located in the connecting area between the Apuseni Mountains, the Someșan Plateau, and the Transylvanian Plain, the city is placed at the intersection of the 46°46′ N parallel with the 23°36′ E meridian.
The studied area occupies a former industrial area in the city of Cluj Napoca, on an area of approximately 5.5 hectares, located in the northeast area of the city, close to the exit towards the city of Dej (Figure 1).
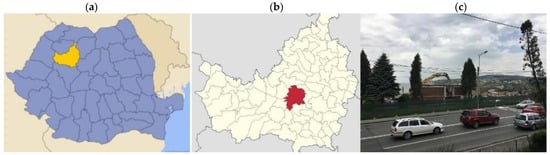
Figure 1.
From left to right: location of Cluj county in Romania (a), location of Cluj city within Cluj county (b), image with the studied area (c).
2.2. Equipment Used
2.2.1. TS-Total Station
For the measurements in this project, a Leica TCR405 total station was used, with an angular precision of 5″ and the possibility to measure reflector less up to 250 m [29].
The coordinates of an unknown point could be determined using the total station and using a point with known coordinates as a landmark. The two points and the station must form direct lines of sight to each other.
The measurement error was of the order of millimeters, considering the fact that this project only included targeting points at short distances (<150 m).
The topographic equipment used can be seen in Figure 2.
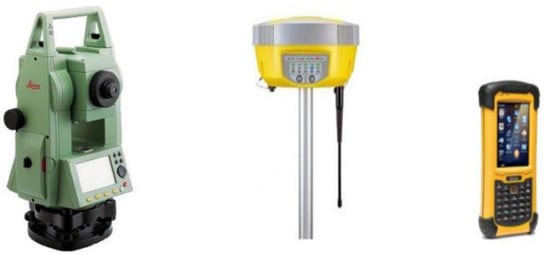
Figure 2.
Classic equipment (TS + GNSS) used for field measurements.
2.2.2. GNSS (Global Satellite Navigation Satellite System)
GNSS—Global Satellite Navigation Satellite System technology finds its applicability, especially in the realization of support networks, due to advantages such as flexibility in network design and point selection, high precision, and low costs. The use of technology in Romania is facilitated by the recent implementation of the ROMPOS system and the continuous development of the National Network of Permanent GNSS Stations (RN-SGP) by the National Agency for Cadastre and Real Estate Advertising [30].
To determine the coordinates of the ground control points (GGP), a Geomax Zenith 10 GNSS system and the Getac controller was used [31]. Geomax Zenith 10 GNSS is a dual-frequency GPS (Global Positioning System) + GLONASS (GLObal’naia NAvigaționnaia Sputnikovaia Sistema—Russian satellite system) device, with real-time RTK capabilities that is capable of very accurate determinations. For the determination in real-time with centimetric precision of the coordinates of the points, it must receive corrections from fixed terrestrial stations. These corrections were received with the help of the GSM modem that was connected to the internet to receive the RTK (Real Time Kinematics) corrections from the permanent station, ROMPOS (Romanian Positioning System), in Romania. The GSM modules work with GSM internet cards from local mobile operators.
Thus, before performing the measurements using the UAV-Unmanned Aerial Vehicle system, 6 control points on the land were identified and materialized, as follows in the Table 1 and Figure 3.

Table 1.
List of GCP (Ground Control Points) coordinates. Coordinate System: Romania, Stereo 70.
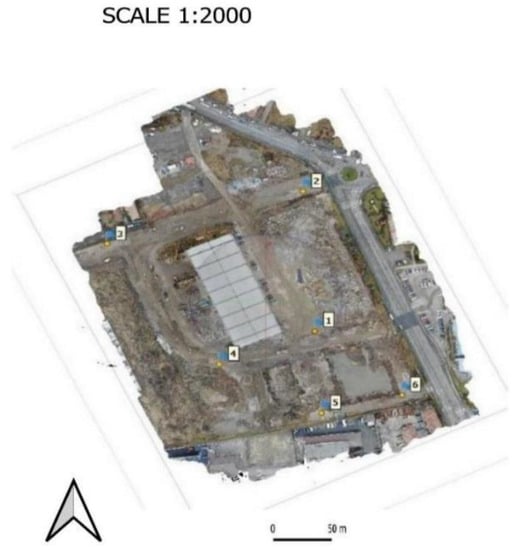
Figure 3.
Location of the ground control points (GCP) necessary to perform the flight.
To retrieve the data later correctly from the drone flight, it was necessary to make certain measurements in the field, which were made with the GNSS—Global Navigation Satellite System equipment, GEOMAX ZENITH 10, produced by GEOMAX AG, Widnau, Switzerland. (Figure 4). The specialized literature provides a minimum number of 3 GCP on an area of up to 5 acres (20 h) [22,23,24,25,26].
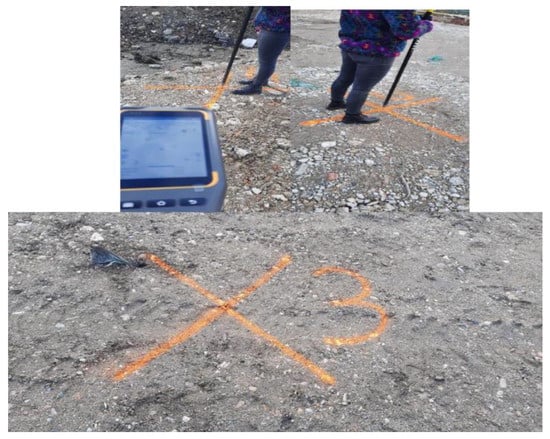
Figure 4.
Placement of photogrammetric ground control points (GCP) in the studied area.
An optimal location of GCP provides for a number of 6–8, which should not be located in a line and should cover the entire area, with at least one point located inside towards the middle of the area. These factors were taken into account in the decision of the number of GCP and their location in the study area. The points were materialized on the ground, and 20 control points (CP) were strategically placed to check significant details in the study area. A check of them was performed (comparison between the coordinates generated by the UAV-Unmanned Aerial Vehicle flight through ortho and the coordinates determined by GNSS-Global Navigation Satellite System).
2.2.3. Drone (Unmanned Aerial Vehicle)
To perform the comparative observations, a DJI MAVIC 2 ENTERPRISE drone produced by DJI, Shenzen, China, was used, with the following constructive technical characteristics:
- Adjustable parameters for emissivity and reflective surfaces;
- 12 MP 1/2.3″ CMOS camera;
- Dynamic zoom: 2× Optical and 3× Digital;
- Data analysis using GPS Timestamping.
The Mavic 2 Enterprise, produced by DJI, Shenzen, China, features a 24 mm camera with a 1/2.3″ 12 MP sensor. It can capture video images up to UHD 4K video resolution at 30 fps. Due to the aerodynamic design of the Mavic 2’s low-drag body, Enterprise can reach speeds of up to 70 km/h and its four-cell LiPo battery provides up to 31 min of flight time. The Mavic 2 Enterprise supports the same OcuSync 2.0 video transmission system [32].
For the comparative study, a single image acquisition flight was performed (Figure 5). The drone was used at an average speed of 45 km/h, took 386 images, and had an image overlap of 75–80%. The duration of the flight was approximately 25 min. This flight was carried out in accordance with the national legislation in the field. Taking into account the fact that the flight falls under the “open flight” category according to the legislation, that the weight of the drone did not exceed 25 kg, that it did not fly at an altitude higher than 120 m, it did not fly above crowds of people, and the pilot permanently maintained a visual line of sight with the drone (VLOS), it was allowed to fly freely, without prior notification of the authorities in the field (Autoritatea Aeronautica Civila Romana—Civil Aeronautics Romanian Authority).
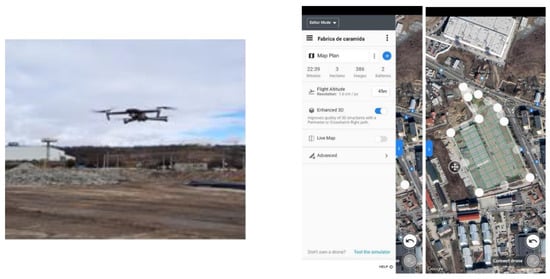
Figure 5.
The UAV—Unmanned Aerial Vehicle used for measurements and the flight plan of the designed mission.
3. Results
3.1. Results Following Measurements Using Classic Technology
The points determined with the total station (TS) were the subject of office and field work (Figure 6) that involved days of measurements and office calculations. This included the verification and compensation of points from the existing national geodetic network in the area, the density of points by the method of planimetric travel, and complex calculations. After processing the network, with the help of geodetic formulas, in Excel software, an error between 2 mm and 1.2 cm from the planimetric point of view and between 3 mm and 1.5 cm from the level point of view resulted.
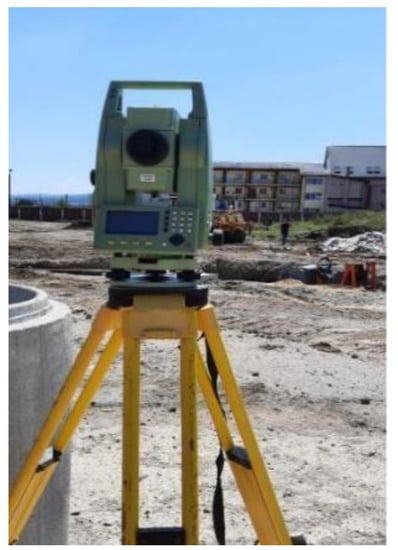
Figure 6.
Total station during field measurements.
It also resulted in an angular non-closure between 7 and 9 s (angles measured in the centesimal system). For the complete processing of the network, Annex C and Annex D can be consulted. To create the topographical plan using first the classic technology, the field study started by measuring the boundaries of the building and the elevation of the road using the GNSS—Global Navigation Satellite System; the measurement of the construction was made using the total station (TS).
After downloading the data from the field equipment, the topographic plan was created in AutoCAD, and the neighboring cadastral contours were taken from E-terra [33], the digital database of the National Agency for Real Estate Cadastre and Publicity (ANCPI). This plan can be found in Figure 7. Since not all the details in the plan are visible at the scale shown in the Figure 7. (1:2000) it is found at the corresponding scale in ANNEX A.
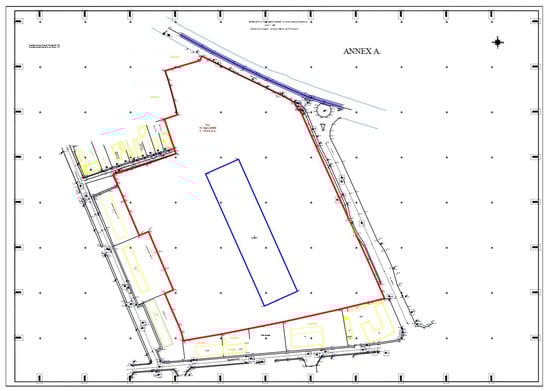
Figure 7.
The topographic plan made following TS (Total Station) and GNSS (Global Navigation Satellite System) measurements and observations.
3.2. Results Following Measurements Using UAV Technology
The first step in making a topographical plan using UAV technology is to plan the flight in the DroneDeploy application [34]. The flight settings were made at an altitude of 45 m; the application estimated that the flight would be approximately 25 min and that 386 images would be taken; the measured surface was also specified as to how many batteries would be needed to complete the flight. The next step (exemplified in Figure 8) was the actual flight: the drone was assembled and connected to the DroneDeploy application, the right location for the takeoff and landing of the drone was chosen, and the flight was started.
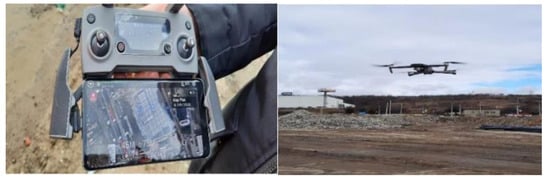
Figure 8.
The drone flight, images from the spot.
The overlap of the photos was in the range of 75–80%, and related to the GSD (Ground Sampling Distance), a GSD of 1.7 cm/pixel was obtained after processing the photos with the help of Agisoft Metashape and extracting the final processing report. A flight height of 45 m was chosen to take into account the following aspects:
- -
- The UAV (Unmanned Aerial Vehicle) has a medium resolution camera (12 megapixels), and despite the fact that it has 4× lossless zoom (including 2× optical zoom), the required quality of the photos would not have been obtained in a flight at a higher altitude.
- -
- A lower flight altitude would have put the drone at risk since the respective area is populated and adjacent to tall trees, medium-height buildings, and cranes for construction sites in the area.
3.3. Realization of the 3D Model
To create the 3D model of the terrain, we used the Agisoft Metashape Professional program, version 1.7.5. After uploading the pictures taken from the drone flight and aligning the reps made with the GNSS, the commands “Align Photos”, “Build Dense Cloud”, “Build Mesh”, “Build Texture”, “Build Tiled Model”, “Build DEM”, and finally “Build Orthomosaic” were used [35]. The first step is exemplified in Figure 9.
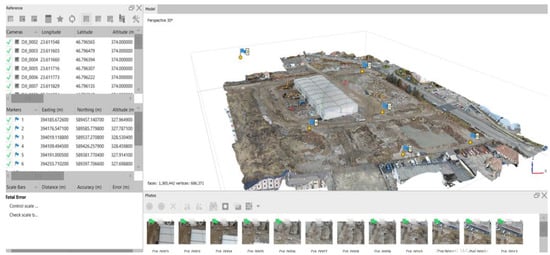
Figure 9.
The 3D model, work stages.
3.4. Realization of the Topographical Plan
To extract the coordinates from Agisoft Metashape in AutoCAD, cross-sectional profiles were made on the entire surface of the building (this can be seen in Figure 10), but also on the points of interest such as the construction, the road, and two deep pits.
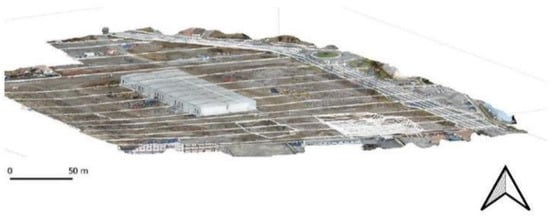
Figure 10.
Transverse profiles superimposed on the 3D model.
After entering these profiles in AutoCAD, a topographical plan was created, which can be found in the Figure 11 and at the appropriate scale and visible in ANNEX B.
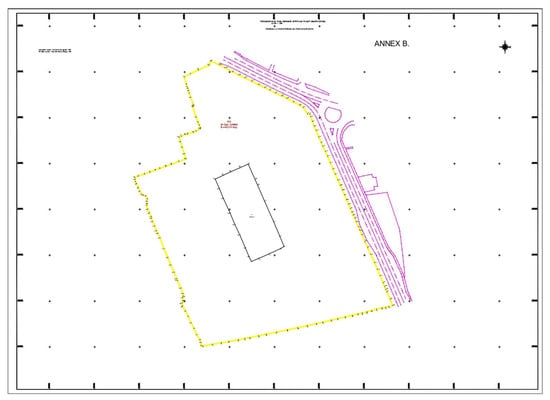
Figure 11.
Topographical plan from the drone.
It should be stated that at the time of the drone flight, the materialization of the boundary on the western side of the building (the fence) had been demolished, so that the overlap and the establishment of the coordinate differences refer, in the present study, ex-clusively to the eastern, northern, and southern boundaries, and to the other relevant topographical details existing in the field (road edge, roundabout limit, existing building limit, etc.).
3.5. Results Obtained
In the Figure 12, the property limits can be seen measured in both cases, with red through the classic technology and yellow through the UAV—Unmanned Aerial Vehicle technology. Following the comparison between the two topographic plans, it is immediately noticeable that there are very large differences on the western boundary; this is due to the fact that the respective boundary is not delimited by a fence, making it difficult to estimate where the property boundary is.
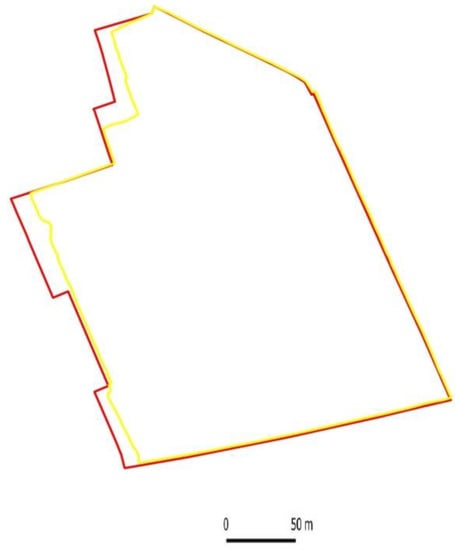
Figure 12.
Superimposition in coordinates of determined property limits. Yellow line—The limit determined after the vectorization on the orthophoto plane generated after the UAV flight. Red line—The limit determined after classic measurements (TS—Total Station + GNSS—Global Navigation Satellite System).
This is easily observable in Figure 12.
The information related to the boundaries (figured in yellow color), as well as information related to obtaining the topographic plan with the help of the UAV (Unmanned Aerial Vehicle), was generated using the DTM-Digital Terrain Model and ortho which resulted from the processing of the photogrammetric flight. The topographic plan generated using ortho and DTM-Digital Terrain Model can be seen by consulting ANNEX C.
The road: The differences between GNSS-CP measured points were measured (Global Navigation Satellites System-Control Points) on certain sections of the road and the results were between 0.08–0.13 m. An example can be seen in Figure 13a. Regarding the differences between the measurements, the materialized limit of the roundabout was observed at a difference of 13 cm between the limit determined by GNSS-Global Navigation Satellite System and TS—Total Station measurements and the vectorized limit from the orthophoto image generated with the help of the UAV-Unmanned Aerial Vehicle flight (Figure 13b).
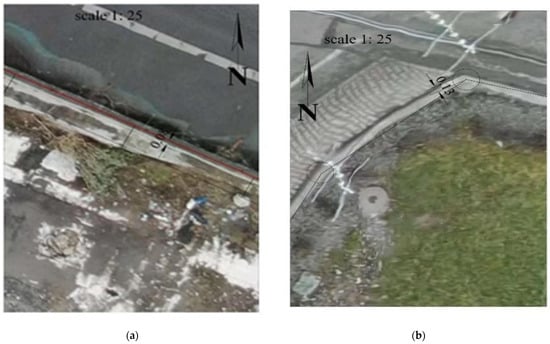
Figure 13.
The differences between classic measurements and those obtained after the UAV—Unmanned Aerial Vehicle flight (road detail) (a); The differences between the classic measurements Control Points (CP) and those (b) obtained after the UAV flight (roundabout edge detail).
3.6. Volumetric Study
Having already made the flight plan, the observations obtained from the UAV—Unmanned Aerial Vehicle flights were used to obtain data regarding a certain hole inside the study area. To find out the amount of material needed to fill that pit, coordinates were extracted from Agisoft Metashape in AutoCAD, cross profiles were made, and the top and bottom contours of the pit were drawn (Figure 14). This is particularly useful in the case of a brownfield area because most of the time, the systematization and restoration of this area, the return of the area to the circuit of housing, or urbanization begins with the leveling of the land.
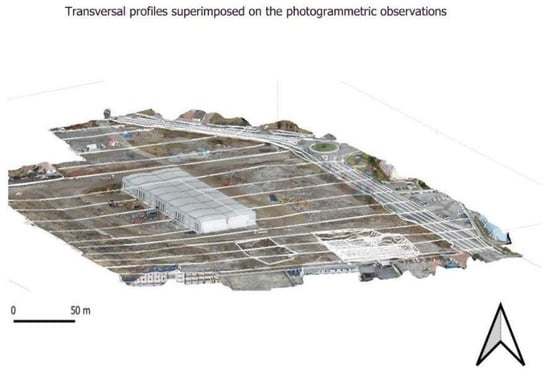
Figure 14.
Transversal profiles superimposed on the Unmanned Aerial Vehicle (UAV) observations.
The volume calculation can also be performed through Agisoft Metashape, but the authors wanted to present an alternative comparative method of performing the volume calculation through extracting the coordinates obtained by comparing the coordinates generated by the DTM (Digital Terrain Model) in Agisoft Metashape and exporting them in AutoCAD and TopoLT software. Thus, profiles were extracted from the measurements made with the total station and superimposed on the profiles generated from the Unmanned Aerial Vehicle (UAV) flight (after processing).
For creating level curves, both at the top and at the bottom (Figure 15), as well as for the generation of the 3D model, the TopoLT software was used (software produced by the Romanian company 3D Space), version 14.0 [36].
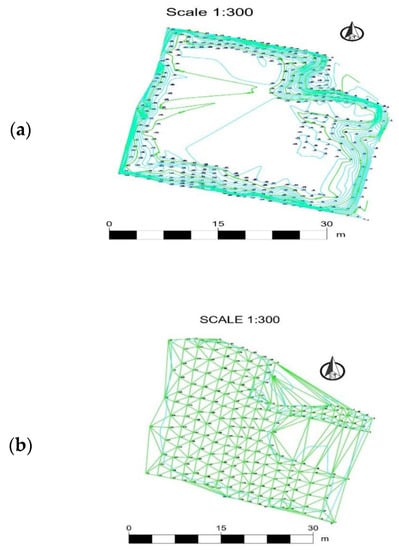
Figure 15.
Network 3D model upper part (a) and lower part (b).
After overlapping the two models, also with the help of the TopoLT program, the volume of the hole was obtained. This overlay is shown in the Figure 16. Following the calculations, the determined volume was 633.51 m3. Based on these data, the beneficiary can calculate how much material he needs to fill it, or if necessary later, how much more needs to be dug.
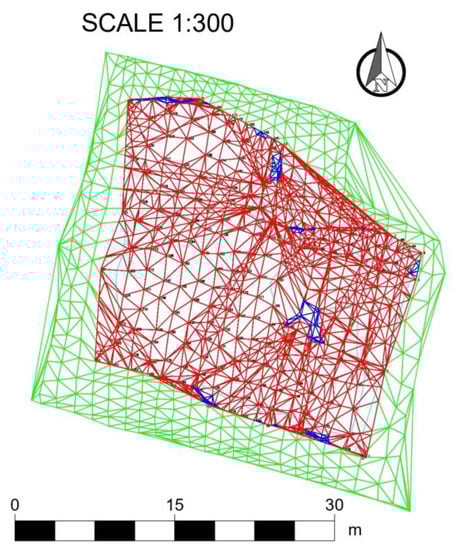
Figure 16.
The 2 upper (green) and lower (red) 3D models for volume calculation.
It should be mentioned that the flight was carried out after the beneficiary had stored some quantities of excavated soil in the area for which the volume calculation is carried out. Thus, the profiles from the initial area (measured with TS—Total Station) were superimposed on the profiles generated after the excavation and the UAV (Unmanned Aerial Vehicle) flight, and the difference in volume was determined. This difference is depicted in blue in Figure 17.
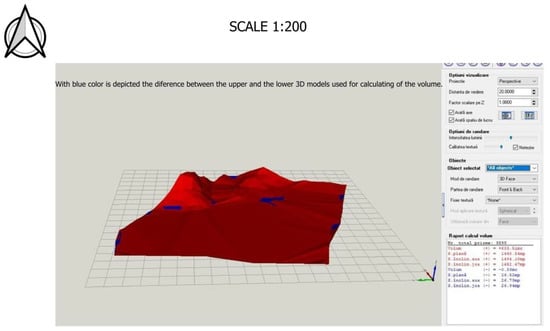
Figure 17.
3D model—volume calculation interface in the used software.
Following the introduction and comparison of the data, a volume difference of 0.83 cubic meters, and differences of 26.52 square meters on the flat surface, 26.75 square meters on the upward-sloping surface, and 26.94 square meters on the downward-sloping surface resulted. This difference in volume is more visible if the elevation polylines generated in green (for the upper part) and those generated in red (for the lower part) are compared. The difference is depicted in blue in Figure 17.
4. Discussion
Through this comparative study, a comparative approach was proposed to the way in which work methods and topographical equipment, as well as photogrammetric ones (UAV—Unmanned Aerial Vehicles), can contribute to the revitalization of areas located in former brownfields and former industrial areas. It should be mentioned that both the topographic equipment and the UAV (Unmanned Aerial Vehicles) used are part of the entry level-medium category, from the point of view of costs. However, the results obtained allowed the generation of extremely valuable deliverables for those responsible later for the restoration of the study area.
First, following the photogrammetric flight and the processing of this flight, an orthorectified image was obtained, with an average error of 8 cm compared to the detail points (road edge, property boundary edge, roundabout edge) measured by using GNSS (Global Navigation Satellite System) + TS (Total Station) technology. It is necessary to underline that (as is stated in this article) the points determined with the total station were the subject of office and field work that involved days of office measurements and calculations. This included the verification and compensation of points from the existing national geodetic network in the area, the density of points by the method of planimetric travel, and complex calculations.
Normally, it is not an error that allows the use of this orthophoto-rectified image as a support for the design of constructive details on the studied area, but it must be taken into account that only one flight was performed (there was not enough time for several flights, as the study area was a construction site in progress and there was a need to quickly clear the area).
However, the specialized literature [22,23,24,25,26] and the experience in this field show us that a planimetric error of 1–2 cm and a level error of 2–3 cm can be obtained following the UAV—Unmanned Aerial Vehicle flight and subsequent processing.
Also, a DEM of the study area was obtained, which proved useful in the preliminary information of the architects, regarding the challenges related to the elevation, which must be considered for the design of the restoration of the former brownfield area. This was valid despite the error in determining the points mentioned above. The generated 3D model respected the existing relief and level curves in the area.
Previous research and studies in the specialized literature have mainly focused on the study of urban planning, sustainable development, and decision-making methods for the restoration, rehabilitation, and sustainable development of former brownfields. This applied study aimed to highlight methods of solving one of the most difficult challenges that appear in the restoration of these areas, namely, the topographical measurements, and determination of the constructive characteristics of the existing buildings, all this in a non-invasive, fast, and cost-effective way. The area presented in this work is a former brownfield area, an industrial area inside one of the largest cities in Romania. This area has been derelict for about 15 years, with the cessation of the former industrial activity in the former brick factory (Figure 18).
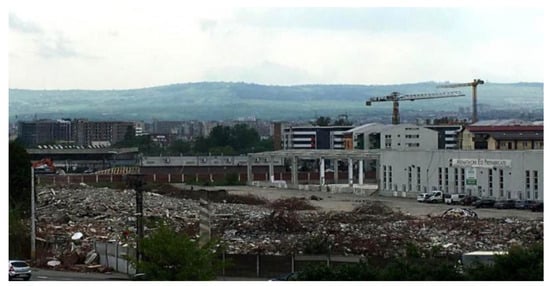
Figure 18.
Panoramic image from the studied area, before the start of the rehabilitation and rendering process in the urban circuit of the city [37].
This study area was chosen as an example of a successful model, considering that at the time of the completion of this work, there is a project to restore the area which is already being put on the ground by a private investor. This project involves the first stage of real estate with commercial spaces on the ground floor, a spa center, and an aparthotel, plus a school. In the middle of the complex, a green sub-zone with a sports field and a bicycle path is proposed. It has to be mentioned that the authors do not have a direct contribution to the design and rendering shown in Figure 19, but all these activities were carried out starting from the initial design of the regeneration study, in which the data were taken by the authors from the field and presented in this case. In addition, the initial clearing and leveling of the work area, as well as the demolition of the buildings, was carried out based on the topographical and photogrammetric study carried out. The presented images and the regeneration project appear in the paper only as a finality of the study, as a result that only indirectly belongs to the authors. An extract from the area restoration project and from the renderings of the studied area can be seen in the figure below:
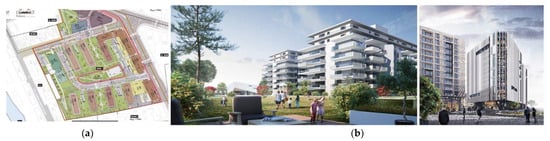
Figure 19.
Extract from the restoration plan of area (a) and from the renderings of the proposed area (b) [38].
The contributions of photogrammetry and land surveying to civil engineering and construction have been known for many years. Although these contributions have been known for a certain time, private beneficiaries from certain countries (including the country where the study area is located, in the case of Romania) hesitate to use the results of UAV (Unmanned Aerial Vehicle) flights, claiming their certain lack of precision.
Our study, applied to a sensitive area of the city of Cluj-Napoca, the city with the fastest economic development and expansion in Romania (according to EUROSTAT—European Institute of Statistics) [39], starts from the rigorous verification of the geodetic network, by means agreed upon by the most conservative among the beneficiaries (total station). Therefore, data agreed as accurate by all surveyors are compared, eliminating the argument that ground control points determined with the help of GNSS are subject to errors inherent in RTK determinations (especially in terms of elevation). Therefore, it starts from a hypothesis in which the classical topography part is carried out almost didactically, by compensating the geodetic network, to determine the support points with millimeter precision. The idea of the “best scenario” is used for the classic determinations of the points with the total station and the “worst scenario” for the determinations of the control points (CP) with the help of the UAV flight. The “worst case scenario” means that the control points on the ground (both checkpoints and GCP) were determined by the RTK (Real Time Kinematic) method and not statically, from at least two vectors, only one flight, only nadir and not oblique images were taken; aerial photogrammetry was exclusively used, and it was not compared with the classical one. The obtained results by UAV (Unmanned Aerial Vehicle) are extremely useful for the subsequent process of design, construction drawing, and actual construction. Although the operation of UAVs (Unmanned Aerial Vehicles) could also present certain risks, especially in the case of fully autonomous flights, these risks can be avoided by making flights announced in advance. They have the advantages of sustainability, the fact that they are non-invasive on the details built in the area, and that they are much faster to perform and process (if the appropriate hardware technique is available).
5. Conclusions
UAV—Unmanned Aerial Vehicle technology helps to create a topographic plan for design, offering speed and much more detail needed for architecture planning, both from the studied area and from the bordering area (in comparison, other methods need more time, and offer fewer details and similar precision, in the case of multiple flights).These UAV (Unmanned Aerial Vehicle) flights are extremely effective because they convey to the architect the vision of the area, trees, neighboring buildings, and the content of the neighboring buildings, giving him the facility to architecturally integrate the whole complex into the area.
This study aimed to demonstrate that modern UAV (Unmanned Aerial Vehicle) technology offers the possibility to help in the regeneration of brownfield areas, by generating topographic plans, DEM (Digital Elevation Models), and longitudinal profiles, necessary for the design activity and computer simulation of the final projects and urban regeneration. The original approach consisted of the comparative study of an ideal case for measurements with the total topographic station with a basic case from a photogrammetric point of view, in which the UAV (Unmanned Aerial Vehicle) technology had minimal checks of the GCP coordinates (Ground Control Points) and the condition of a single flight. The goal was to demonstrate the hypothesis that, even in these conditions, the results generated by the UAV (Unmanned Aerial Vehicle) flight can be used with acceptable precision for the urban design and regeneration activity required for this case study.
Data obtained in this way made it possible to create profiles, DTM, orthoimages, and volume calculations to present the actual use of a small, urbanized area, including areas where former industrialization changed the form of use. The authors propose the replication of this comparative application study in other similar areas with the help of superior technology (Global Navigation Satellite System + Total Stations + Unmanned Aerial System + 3D SCANNING + terrestrial photogrammetry), for the development of a good practice model that will offer specialists in the field of terrestrial measurements the correct approach and cost-effective method for brownfield-type areas.
Author Contributions
S.M.N., M.V.B., V.M.R., R.G., I.S.V., R.B. and A.T.R. have contributed equally to the work. All authors have read and agreed to the published version of the manuscript.
Funding
This research benefited from funding from the TUCN Development Program.
Data Availability Statement
The data presented in this study are available on request from the corresponding author.
Conflicts of Interest
The authors declare no conflict of interest.
References
- Environmental Protection Agency. Summary of the Small Business Liability Relief and Brownfields Revitalization Act. Available online: https://www.epa.gov/brownfields/summary-small-business-liabilityrelief-and-brownfields-revitalization-act (accessed on 21 November 2022).
- Gregorová, B.; Hronček, P.; Tometzová, D.; Molokáč, M.; Čech, V. Transforming Brownfields as Tourism Destinations and Their Sustainability on the Example of Slovakia. Sustainability 2020, 12, 10569. [Google Scholar] [CrossRef]
- Yagci, E.; Nunes da Silva, F. The Future of Post-Industrial Landscapes in East Lisbon: The Braço de Prata Neighborhood. Sustainability 2021, 13, 4461. [Google Scholar] [CrossRef]
- Hyka, I.; Hysa, A.; Dervishi, S.; Solomun, M.K.; Kuriqi, A.; Vishwakarma, D.K.; Sestras, P. Spatiotemporal Dynamics of Landscape Transformation in Western Balkans’ Metropolitan Areas. Land 2022, 11, 1892. [Google Scholar] [CrossRef]
- De Sousa, C.; Wu, C.; Westphal, L. Assessing the Effect of Publicly Assisted Brownfield Redevelopment on Surrounding Property Values. Econ. Dev. Q. 2009, 23, 95–110. [Google Scholar] [CrossRef]
- Haninger, K.; Ma, L.; Timmins, C. The Value of Brownfield Remediation. J. Assoc. Environment. Resour. Econ. 2017, 4, 197–241. [Google Scholar] [CrossRef]
- Kiel, K.A.; Williams, M. The Impact of Superfund Sites on Local Property Values: Are All Sites the Same? J. Urban Econ. 2007, 61, 170–192. [Google Scholar]
- McClusky, J.J.; Rausser, G.C. HazardousWaste Sites and Housing Appreciation Rates. J. Environ. Econ. Manag. 2003, 45, 166–176. [Google Scholar] [CrossRef]
- Jackson, T. Environmental Contamination and Industrial Real Estate Prices. J. Real Estate Res. 2002, 23, 179–200. [Google Scholar] [CrossRef]
- Trouw, M.; Weiler, S.; Silverstein, J. Brownfield Development: Uncertainty, Asymmetric Information, and Risk Premium. Sustainability 2020, 12, 2046. [Google Scholar] [CrossRef]
- Blazy, R.; Łabuz, R. Spatial Distribution and Land Development Parameters of Shopping Centers Based on GIS Analysis: A Case Study on Kraków, Poland. Sustainability 2022, 14, 7539. [Google Scholar] [CrossRef]
- Vojvodíková, B.; Fojtík, R.; Tichá, I. Design and Verification of a Simple Approach to Brownfields Categorization. Sustainability 2021, 13, 11206. [Google Scholar] [CrossRef]
- Goussios, D.; Faraslis, I. Integrated Remote Sensing and 3D GIS Methodology to Strengthen Public Participation and Identify Cultural Resources. Land 2022, 11, 1657. [Google Scholar] [CrossRef]
- Sertić, H.; Paar, R.; Tomić, H.; Ravlić, F. Influence of Flight Height and Image Sensor on the Quality of the UAS Orthophotos for Cadastral Survey Purposes. Land 2022, 11, 1250. [Google Scholar] [CrossRef]
- Sanhudo, L.; Ramos, N.M.M.; Martins, J.P.; Almeida, M.S.F.; Barreira, E.; Simoes, M.L.; Cardoso, V. A framework for in -situ geometric data acquisition using laser scanning for BIM modeling. J. Build. Eng. 2020, 28, 101073. [Google Scholar] [CrossRef]
- Shao, J.; Zhang, W.; Mellado, N.; Wang, N.; Jin, S.; Cai, S.; Luo, L.; Lejemble, T.; Yan, G. SLAM-aided forest plot mapping combining terrestrial and mobile laser scanning. ISPRS J. Photogramm. Remote Sens. 2020, 163, 214–230. [Google Scholar] [CrossRef]
- Hosseininaveh, A.A.; Sargeant, B.; Erfani, T.; Robson, S.; Shortis, M.; Hess, M.; Boehm, J. Towards fully automatic reliable 3D acquisition: From designing imaging network to a complete and accurate point cloud. Robot. Autumn. Syst. 2014, 62, 1197–1207. [Google Scholar] [CrossRef]
- Zhang, X.; Zhao, P.; Hu, Q.; Ai, M.; Hu, D.; Li, J. A UAV-based panoramic oblique photogrammetry (POP) approach using spherical projection. ISPRS J. Photogramm. Remote Sens. 2020, 159, 198–219. [Google Scholar] [CrossRef]
- Saadati, S.; Abbasi, M.; Abbasy, S.; Amiri-Simkooei, A. Geodetic calibration network for total stations and GNSS receivers in sub-kilometer distances with sub-millimeter precision. Measurement 2019, 141, 258–266. [Google Scholar] [CrossRef]
- Lutz, K. 61-years of working aerial photogrammetry history. Photogram. Eng. Remote Sens. 2015, 81, 89–93. [Google Scholar]
- Kavaliauskas, P.; Židanavičius, D.; Jurelionis, A. Geometric Accuracy of 3D Reality Mesh Utilization for BIM-Based Earthwork Quantity Estimation Workflows. ISPRS Int. J. Geo-Inf. 2021, 10, 399. [Google Scholar] [CrossRef]
- Crommelinck, S.; Bennett, R.; Gerke, M.; Yang, M.Y.; Vosselman, G. Contour Detection for UAV-Based Cadastral Mapping. Remote Sens. 2017, 9, 171. [Google Scholar] [CrossRef]
- Zhou, Y.; Rupnik, E.; Meynard, C.; Thom, C.; Pierrot-Deseilligny, M. Simulation and Analysis of Photogrammetric UAV Image Blocks—Influence of Camera Calibration Error. Remote Sens. 2020, 12, 22. [Google Scholar] [CrossRef]
- Stöcker, C.; Nex, F.; Koeva, M.; Gerke, M. High-Quality UAV-Based Orthophotos for Cadastral Mapping: Guidance for Optimal Flight Configurations. Remote Sens. 2020, 12, 3625. [Google Scholar] [CrossRef]
- Varga, Z.; Vörös, F.; Pál, M.; Kovács, B.; Jung, A.; Elek, I. Performance and Accuracy Comparisons of Classification Meth-ods and Perspective Solutions for UAV-Based Near-Real-Time “Out of the Lab” Data Processing. Sensors 2022, 22, 8629. [Google Scholar] [CrossRef] [PubMed]
- Orsini, C.; Benozzi, E.; Williams, V.; Rossi, P.; Mancini, F. UAV Photogrammetry and GIS Interpretations of Extended Ar-chaeological Contexts: The Case of Tacuil in the Calchaquí Area (Argentina). Drones 2022, 6, 31. [Google Scholar] [CrossRef]
- Sestras, P.; Bilașco, Ş.; Rosca, S.; Veres, I.; Elias, N.; Hysa, A.; Spalević, V.; Cîmpeanu, S.M. Multi-Instrumental Approach to Slope Failure Monitoring in a Landslide Susceptible Newly Built-Up Area: Topo-Geodetic Survey, UAV 3D Modeling and Ground-Penetrating Radar. Remote Sens. 2022, 14, 5822. [Google Scholar] [CrossRef]
- Kyriou, A.; Nikolakopoulos, K.; Koukouvelas, I.; Lampropoulou, P. Repeated UAV Campaigns, GNSS Measurements, GIS, and Petrographic Analyses for Landslide Mapping and Monitoring. Minerals 2021, 11, 300. [Google Scholar] [CrossRef]
- Leica TCR 405 Total Station. Available online: www.leica-geosystems.com (accessed on 20 May 2022).
- Romanian Position Determination System. Available online: www.rompos.ro (accessed on 27 September 2022).
- GNSS Geomax Zenith 10. Available online: https://geomax-positioning.com/products/gnss (accessed on 17 August 2022).
- DJI Mavic 2 Enterprise, Zoom Edition. Available online: https://www.dji.com/mavic-2-enterprise (accessed on 27 September 2022).
- ETERRA. Available online: https://geoportal.ancpi.ro/geoportal/imobile/Harta.html (accessed on 20 February 2022).
- Drone Deploy, Drone Mapping Software. Available online: www.dronedeploy.com (accessed on 20 February 2022).
- Agisoft Metashape. Available online: https://www.agisoft.com/features/professional-edition/ (accessed on 19 January 2022).
- Topo, L.T. Surveying Software. Available online: www.topolt.com (accessed on 20 May 2022).
- Info Cluj. Available online: www.infocluj.eu (accessed on 18 January 2022).
- Arhimar—Architecture Office. Available online: www.arhimar.ro (accessed on 10 February 2022).
- EUROSTAT—European Institute of Statistics. Available online: https://composite-indicators.jrc.ec.europa.eu/cultural-creative-cities-monitor/countries-and-cities/cluj-napoca (accessed on 24 November 2022).


Disclaimer/Publisher’s Note: The statements, opinions and data contained in all publications are solely those of the individual author(s) and contributor(s) and not of MDPI and/or the editor(s). MDPI and/or the editor(s) disclaim responsibility for any injury to people or property resulting from any ideas, methods, instructions or products referred to in the content. |
© 2023 by the authors. Licensee MDPI, Basel, Switzerland. This article is an open access article distributed under the terms and conditions of the Creative Commons Attribution (CC BY) license (https://creativecommons.org/licenses/by/4.0/).