Abstract
In the process of sustainable transformation, resource-based cities (RBCs) in Heilongjiang are in a dilemma. Resilience is a key capability to help RBCs deepen sustainable development, adapt to shocks, and exit the transformation dilemma. This study aims to clarify the resilience measurements and dynamics of RBCs and propose targeted resilience enhancement strategies. First, we construct a resilience indicator system based on the urban complex adaptive system (CAS) and use principal component analysis (PCA) to specify indicator weights to obtain the resilience values of RBCs in Heilongjiang Province during 2010–2019, then use cluster analysis to classify five resilience grades. Second, we identify and analyze the resilience dynamics of RBCs in Heilongjiang Province from 2010–2019 based on the adaptive cycle framework. The results indicate that the overall resilience dynamics of RBCs have exhibited an upward trend over the past decade, but there are clear variations in the level of resilience values and dynamics between the different types of RBCs. The petroleum-based city has the highest level of resilience, is less affected by shocks, and recovers quickly. Forest-based cities have a medium level of resilience and are able to recover from shocks, but they fail to improve and remain at a medium level for a long time. Coal-based cities have a low level of resilience and find it difficult to recover from shocks, but this has improved since 2017. Finally, we propose targeted resilience enhancement strategies for RBCs of different types and resilience levels in Heilongjiang Province to provide RBCs with directional guidance for overcoming the development dilemma through resilience measures.
1. Introduction
Over-exploitation and inappropriate processing methods of resources have led to the decline of RBCs in China, resulting in urban problems such as environmental pollution, economic downturns, unemployment, population loss, and weak infrastructure [1]. Faced with the severe problems existing in RBCs, the Chinese government issued a series of policies to help RBCs transform from the initial dual structure of resource consumption to sustainable urban development. However, as a sudden external shock, the “one size fits all” transformation policy makes the already vulnerable RBCs unable to adapt to the sudden transformation of the system mechanism quickly, and urban development is in trouble [2]. The transformation dilemma faced by Chinese RBCs consists primarily of two aspects: internal pressure and external shocks. Internal pressures contain of resource depletion, industrial decline, weak innovation capacity, weak endogenous dynamics, population loss, unemployment, and inadequate social security, among others. External shocks include the persistent economic downturn since the global financial crises, policy restrictions on the development and use of nonrenewable resources, and environmental damage caused by abandoned mining areas. Among them, the problems of transformation of RBCs in Heilongjiang Province are severe due to the constraints of institutional background, industrial structure, location, and other factors [3,4,5].
Resilience is a key concept in understanding and describing the complexity and adaptability of systems [6]. In engineering systems, resilience is the linear process by which a material is able to bounce back after being subjected to a force. However, in a complex adaptive system (CAS) [7], resilience is the ability of the system to adapt to changes after external shocks, which is a complex, nonlinear, and dynamic process [8]. Resilience is not an individual capability, but an amalgamation of multiple capabilities, a process with temporal properties. As a complex adaptive system, the resilience of a city can be understood as the process of the urban system constantly resisting shocks, adapting to changes and recovering [9,10,11,12]. Black swan events are unpredictable and uncertain as external shocks in urban CAS. When a shock occurs, it will inevitably have some negative effects on the city, but a resilient urban system can prepare for the shock before it occurs through redundancy and stability, respond in time when it occurs through rapidity and resilience, and self-organize and adapt after the shock occurs through learning and memory of past experiences and recover gradually to the original state or improve to a better state [13,14]. Based on this, scholar Meerow reviewed 172 pieces of relevant literature and defined urban resilience as the ability of urban systems to maintain or rapidly recover function in the face of disturbances, adapt to change, and rapidly shift systems that limit adaptive capacity. It emphasizes the importance of time scales and the adaptability of systems [15]. In addition, resilience can be described by observing an adaptive dynamic process in a system [16], known as the adaptive cycle [17,18]. The theory is based on system dynamics and believes that a system undergoes four phases: (1) growth or exploitation (r), (2) conservation (K), (3) collapse or release (Ω), and (4) reorganization (α). It can be seen as two parts: the r-K foreloop and Ω-α backloop. The foreloop is a slow, incremental phase of growth and accumulation with increasing connectivity and stability. The backloop is a phase of rapid reorganization and renewal, where connectivity and potential quickly drop to a minimum when resource accumulation peaks and then gradually rise back to a new phase [19,20]. Currently, a part of the research uses the adaptive cycle framework as a method to identify the dynamics of systems at different scales and characteristics, such as regional socioecological systems [21], coastal human and environmental systems [22], urban landscape risk [23], and urban sustainability [24].
In addition, RBCs are affected by the finiteness and non-renewability of natural resources, and cities form distinct stages in their life cycles, i.e., development, maturity, decline, and transformation [25,26]. Established studies show a strong correlation between the RBCs’ life cycles and the adaptive cycles [1]. Specifically, when RBCs are in the r exploitation phase (development period), the development of non-renewable resources accumulates a large amount of capital, and the rapid accumulation of capital brings population growth, employment opportunities, and social welfare [27]. Urban resilience increases with redundancy and diversity. With the continuous accumulation of capital and resources, RBCs have entered the K conservation phase (maturity period), urban resilience is in a stable state. However, the solidified system reduces connectivity and flexibility. In addition, in parallel with economic and social development, conflicts between resource exploitation and the ecological environment, as well as urban construction and distribution of resource-based industries, have accumulated a high level of risk for RBCs. When subjected to external shocks, RBCs are unable to adapt to changes quickly, and the system rapidly enters the Ω release phase (decline period), with increased urban vulnerability and reduced resilience. At this point, when the system has resilience, it will gradually step out of the Ω release stage, begin to adapt and reorganize the structure and enter the α reorganization phase (transformation period). In the other case, the RBCs lack the resilience to resist, adapt, and recover, leaving them in a long-term Ω release phase. There is an urgent need for interventions to avoid a long-term collapse state and to help RBCs enter a new adaptive cycle. Conversely, RBCs leave the adaptive cycle, which leads to the urban system’s decay or to an unknown state [28].
It can be seen that resilience is the key capability that helps RBCs adapt to the transition shocks, overcome the transition dilemma and gradually recover. Therefore, under the perspective of resilience enhancement of RBCs, we first need to understand what kind of adaptive dynamics are experienced in the process of transformation, so as to identify whether RBCs have or lack specific resilience capabilities in the transformation process, as well as the factors affecting their dynamics. On the basis of clarifying the resilience level and resilience capacity of RBCs, we propose targeted resilience enhancement strategies to assist them in exiting the transition dilemma. There are both theoretical and practical implications for broadening the application of resilience theory and improving the sustainable development of RBCs.
Based on this, we take the following three aspects as the objectives and innovations: (1) We construct a resilience indicator system for RBCs based on the urban CAS components and existing resilience studies to obtain measurements of the resilience of RBCs through quantitative methods. (2) We identify the resilience dynamics of RBCs in Heilongjiang Province during 2010–2019 using the adaptive cycle framework to analyze their resilience capacity and the affecting factors. (3) We propose targeted resilience enhancement strategies for RBCs of different types and resilience levels in Heilongjiang Province.
2. Study Area and Data
Heilongjiang Province, located in northeastern China (121°11′–135°05′ E, 43°26′–53°33′ N), is the most northerly, easterly, and highest latitude province in China. Heilongjiang Province is rich in mineral and forest resources and used to be an essential energy industrial base and one of China’s important coal and oil production areas. Based on the list of RBCs in China determined in “The National Sustainable Development Plan for Resource-Based Cities (2013–2020)” [29]. Nine prefecture-level cities in Heilongjiang Province were selected as the research regions. Mudanjiang, Hehe, Yichun, and DaHingganLing are forest-based cities; Jixi, Hegang, Shuangyashan, and Qitaihe are coal-based cities; and Daqing is a petroleum-based city (Figure 1).
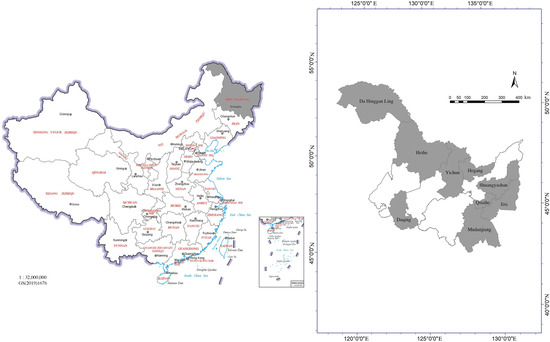
Figure 1.
Location of RBCs in Heilongjiang Province, China.
The signs of recession in Heilongjiang Province have become more serious in recent years [30]. The decline in resource reserves and the issuance of resource conservation policies have caused the development of resource industries in Heilongjiang Province to step into a difficult situation. In addition, the fixed resource–production dual industrial structure cannot quickly adjust its structure to adapt to the change in sustainability policies, resulting in economic decline, increased unemployment, and severe population loss [31]. Regarding socioeconomic data, between 2010 and 2019, the average regional GDP growth rate of the nine RBCs decreased from 18% to 4.8%, with a negative growth trend of −0.1% and −0.4% in 2015 and 2016, respectively. Among them, the lowest value appeared in 2015 in Qitaihe at −12.5%. The average natural population growth rate decreased by 5.5% over ten years, with the lowest average of −8.9 in 2018, of which the lowest was −14.7% in Shuangyashan. Furthermore, RBCs advocate resource industry-led land development and urban construction during the formation period. This development approach lacks consideration for the safety and rationality of urban spatial layout, making problems in transportation, housing, and public service facilities frequent. The socioeconomic decline has prevented the problem from being dealt with promptly, and the urban infrastructure system is relatively weak.
The research data include two parts: statistical data and remote sensing data. Most of the governance, social economy, and urban infrastructure indicators data were collected from the statistical data of 9 RBCs in Heilongjiang Province from 2010 to 2019, including the “Statistical Yearbook”, “Ecological Environment Status Bulletin”, “National Economic and Social Development Statistical Bulletin”, and “Demographic Census”. A small part of the data was obtained from each city’s government portal and the China National Bureau of Statistics website [32]. Due to the absence of individual data, the data are supplemented according to the values of adjacent years. The data for environmental and resource indicators were primarily based on Jie Yang and Xin Huang’s 30-m land cover data set for China from 1990 to 2019 [33].
3. Method
Based on CAS and resilience theory, this study specifies the resilience measurements of RBCs in Heilongjiang Province through a quantitative approach and identifies the resilience dynamics based on the adaptive cycle framework (Figure 2). Firstly, we construct a resilience indicator system based on the urban CAS components and established resilience studies from four aspects: governance, social economy, urban infrastructure, environment and resources. Secondly, we apply PCA to determine the indicator weights and calculate the resilience values of RBCs in Heilongjiang Province during 2010–2019. Finally, we apply cluster analysis to classify the grades of the resilience values, identify the resilience dynamics through the adaptive cycle framework and analyze them.
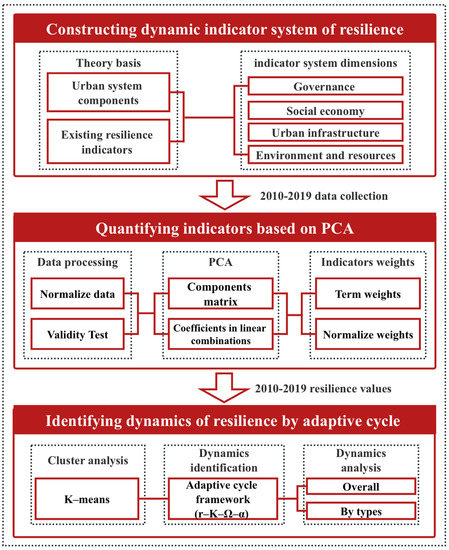
Figure 2.
Conceptual framework.
3.1. Constructing an Indicator System of Resilience
The sustainability and resilience of urban systems depend on the adaptability of socioeconomic and environmental conditions [34,35]. Most of the existing studies quantify resilience by measuring the components of CAS [36,37,38]. From the perspective of CAS, the urban system can be summarized as an interacting and coupled socioecological system consisting of four subsystems: governance networks, socioeconomic dynamics, urban infrastructure and form, and networked material and energy flows [15,39]. Resilience Alliance [40] simplifies into governance networks, social dynamics, built environment, and metabolic flows. Specifically, governance networks refer to the decision makers, institutions, and mechanisms that shape urban systems, including states, labor, industry, consumers, and NGOs; social dynamics is the economic and social capacity of the urban system and consists of six elements: capital, demographics, justice and equity, mobility, public health, and education; built environment is a simplification of the biological and ecological processes in the city and consists of four elements: buildings, transportation, greenspace, and utilities; finally, metabolic flows refers to the various materials produced or consumed in or by the urban system, which includes six elements: water, energy, materials, food, water, and consumer goods. Based on this, the study determines that the resilience indicator system of RBCs contains four dimensions: governance, social economy, urban infrastructure, environment and resources based on the components of urban CAS. Second, we build the indicators database by combining existing resilience assessments (Table 1). Finally, we combine the characteristics of RBCs in terms of economy, industry, human resources and natural resources and the available data, the above 21 components of urban CAS were refined into 26 categories, and 62 indicators were selected from them (Table 2).

Table 1.
References of selecting resilience indicators for RBCs.
Table 2.
Resilience indicator system of RBCs.
3.2. Quantifying Indicators Based on PCA
We used the principal component analysis (PCA) method to determine the weights of the resilience indicators. PCA is a relatively effective data analysis method that is often used for the quantification of sustainability evaluation indicators [46,47,48,49]. This method is based on the principle of information condensation of data and uses variance interpretation rate for weight calculation, thus avoiding human subjective factors and bias caused by different methods [50]. In this study, we used the SPSS Statistics 25 software for PCA, and the data were tested for validity. The results showed that the KMO value was 0.804, indicating suitability for factor analysis. The degree of freedom in Bartlett’s sphericity test was 1891, and the significance was 0.000, indicating extremely significant. The specific steps are as follows:
Since the indicators have different magnitudes and contain both positive and negative indicators, the study chose the maximum difference normalization method to standardize the data. The positive indicators were normalized using Formula (1), and the negative indicators were normalized using Formula (2):
where is the value of indicator j in year i.
We used the normalized data to build a matrix X, i variables X1, X2, …, Xi through the linear combination to obtain new comprehensive variables (principal components) P1, P2, …, Pj, as follows:
The principal components P1, P2, …, Pj are subject to:
- Unrelated;
- Among all linear combinations of P1, P2, …, Pj, P1 has the largest variance, P2 has the largest variance in the linear combination that is not related to P1, Pj has the largest variance in the linear combination that is not related to P1, P2, …, Pj−1.
The linear combination coefficient aij in Formula (3) can be regarded as the contribution of the i indicator to the j principal component, the weight of i indicator is the normalization of the weighted average of the aij, and the weight in the weighted average process is the variance contribution rate of each principal component. The formula is as follows:
where Ej is the variance contribution rate of the j principal component and Wi is the weight of the i indicator.
SPSS software generates the initial factor load coefficient fij, and the linear combination coefficient aij needs to be obtained through the following formula:
where is the initial eigenvalues of the j principal component.
Finally, the weights are normalized and brought into the standardized data to obtain the resilience values.
3.3. Identifying the Dynamics of Resilience
Based on the established studies [22,24], we used K-means cluster analysis to classify the resilience values of the nine RBCs during 2010–2019 into five grades and obtain interval values (Table 3). Furthermore, we applied the different characteristics of the four phases of the adaptive cycle to identify the dynamics of resilience during 2010–2019. The resilience measurement can be reflected in the adaptive dynamics of the urban system, and the adaptive cycle is the conceptual framework to describe the system’s adaptive dynamics [51,52,53]. Each adaptive cycle, in particular, is a four-phase transition process (r-K-Ω-α). In the r exploitation phase, the resilience tends to rise rapidly; in the K conservation phase, the resilience shows a stable state; in the Ω release phase, the resilience shows a short-term rapid decline; subsequently, after continuous adjustment or adaptation, the system will enter the α reorganization phase, presenting a relatively stable and slow upward trend. However, there are cases where the lack of urban resilience leads to the urban system’s decay or to an unknown X state. In addition, complex urban systems subject to external shocks and uncertainty events may not always follow the 4-phase cycle and may be missing or in one phase for a long time [11,54] (Figure 3). Eventually, the resilience dynamics of RBCs can be identified based on the characteristics of each adaptive cycle phase, combined with the rising, falling, and stable trends of resilience values of RBCs from 2010–2019.
Table 3.
Resilience grades and corresponding cluster members.
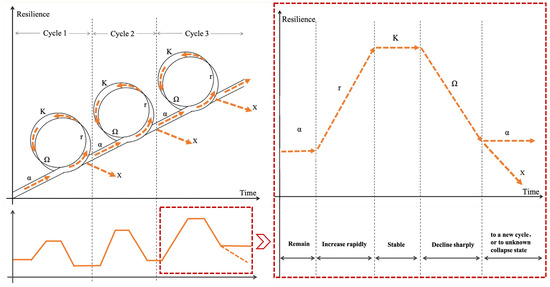
Figure 3.
Dynamics identification of resilience by adaptive cycle framework.
4. Results and Discussion
4.1. Analysis of the Resilience Values of Nine RBCs
Figure 4 and Figure 5 show that the resilience values of the nine RBCs from 2010 to 2019 show an overall upward trend, with an average increase of 62.7% from 2010 to 2015 and a slower growth of 18% from 2015 to 2019. There are significant differences in resilience values among the nine RBCs. In the 10-year average resilience values, the highest is Daqing at 0.78, and the lowest is Qitaihe at 0.13, with a difference of nearly six times between the two cities. According to the above-mentioned interval of resilience values, Qitaihe has low resilience; Hegang and Shuangyashan have medium-low resilience; Jixi, DaHingganLing, Yichun, Hehe, and Mudanjiang have medium-high resilience; and there are no cities with high resilience. In addition, the differences in the resilience levels of RBCs are more related to their resource types, with the highest resilience level in the petroleum-based city (Daqing), followed by four forest-based cities (Mudanjiang, Hehe, Yichun, and DaHingganLing), and the lowest in coal-based cities (Jixi, Shuangyashan, Hegang, and Qitaihe).
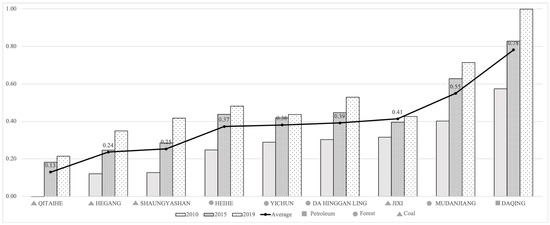
Figure 4.
Overall resilience values of 9 RBCs in 2010, 2015, 2019, and 10-year average.

Figure 5.
Overall resilience values of 9 RBCs in different grades from 2010 to 2019.
Established studies have identified resource endowment, industry and policy, and socioeconomic development as important factors influencing the transformation of RBCs [55,56,57,58,59]. Therefore, we analyze the reasons for these results in light of the above factors. It can be seen that RBCs with better resource richness have higher resilience. Daqing city relies on mature petroleum exploration technology and processing industry, and its petroleum production has always maintained a stable level, and urban system components have been maintained at a high level. Forest-based cities, on the other hand, rely on rich natural resources such as forests and lakes, which form a good ecological environment, generate a natural protection barrier, and enhance the adaptive capacity of urban systems to cope with natural disasters. On the contrary, coal-based cities have been in a state of high vulnerability and reduced resilience for a long time due to the decline of the coal industry that dominates urban development, which has brought acute shocks such as the economic downturn and structural unemployment. While dilapidated urban infrastructure and abandoned mines are gradually forming urban risk hazards.
Regarding urban industry and policy, petroleum and coal-based cities focus on a secondary industry. For example, the secondary industry in Daqing once accounted for a maximum of 80%. However, the same single industry structure produces two very different levels of resilience. Daqing’s petroleum industry is a state-owned enterprise with a solid position and stable production to ensure socioeconomic stability and redundancy and is less restricted by policy. In contrast, coal-based cities were mostly served by private and family-contracted coal mines in the early stages of coal industry development. Most of them had major safety hazards, and some of them were even illegal. The local government strictly rectified and regulated private and family-contracted coal mines through policy enactment. The safety hazards of coal mining were well resolved. However, the resource-based industries were hit hard, affecting the components that sustain the operation of the urban system, and urban resilience was reduced. Forest-based cities are the first to shift their industrial focus to primary and tertiary industries. Relying on the good natural landscape and geographical location, urban industries have developed into tourism and import/export trade. However, the transformation effect is not significant in terms of resilience enhancement.
Finally, good socioeconomic levels drive urban infrastructure development, higher levels provide more capital, and urban resilience improves with increased redundancy and flexibility, and vice versa. In recent years, except for Daqing, RBCs in Heilongjiang Province have significantly decreased in terms of human resources, economic capital, and population composition, which also makes them lack endogenous dynamics for resilience enhancement.
In general, rich natural resource reserves and a good socioeconomic level can provide RBCs with more material and capital redundancy, while a balanced industrial structure provides stability for urban development, thus helping to improve the resilience level of cities, and vice versa. Therefore, strategies to improve the level of resilience of RBCs should ensure that natural resources are developed and utilized responsibly, optimize the industrial structure, and improve the socioeconomic status of cities so that they have sufficient capital and stable structures to withstand shocks.
4.2. Spatial Distribution of the Resilience Values of Nine RBCs
Figure 6 shows that the overall resilience values of RBCs in Heilongjiang Province are distributed into four groups. RBCs in the northwest group are DaHingganLing, Hehe, and Yichun; in the northeast group are Hegang, Shuangyashan, Qitaihe, and Jixi; in the southwest group is Daqing; and in the southeast group is Mudanjiang. The overall spatial distribution is high in the south and low in the north. From the spatial distribution of resilience values in different dimensions of RBCs (Figure 7), governance resilience is axially distributed, with RBCs on the northwest–southeast axis being higher than on the northeast–southwest axis, i.e., forest-based cities are higher than mining-based cities. The spatial variation of social economy resilience is obvious, showing a phased growth, and the spatial distribution is high in the south and low in the north. The spatial variation in urban infrastructure resilience rises from low to high and then falls back again, with the same spatial high in the south and low in the north. The spatial distribution of environment and resources resilience is high in the west and low in the east, which roughly corresponds with the spatial distribution of natural resources, with the northeastern part of Heilongjiang Province being a confluence of mountain ranges and more abundant resources.
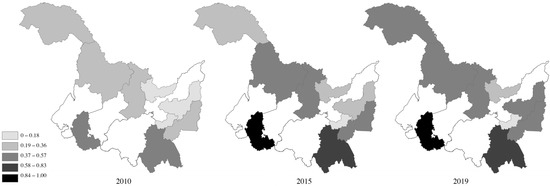
Figure 6.
Spatial distribution of the overall resilience values of 9 RBCs.
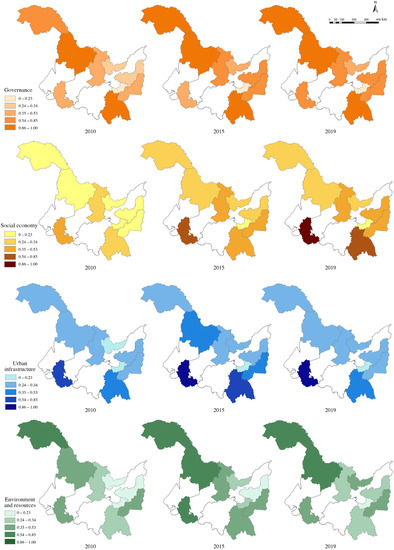
Figure 7.
Spatial distribution of the resilience values in different dimensions of 9 RBCs.
It can be seen that the resilience of the nine RBCs has obvious group-type spatial distribution characteristics. The RBCs within the group tend to develop homogeneously, and the resilience of the fringe cities is better than that of the inner cities. This may be because when RBCs do not fully exploit their advantages, the competitive advantages of cities within the group mainly focus on their location conditions and resource abundance, the factors of urban development converge, and the pressure of internal competition increases, so the resilience is lower [3,60,61]. On the other hand, RBCs at the fringes of groups have better transportation conditions and external communication advantages, and the connectivity and mobility of urban system components increase, thus raising the level of resilience.
4.3. Identification and Analysis of the Resilience Dynamics of Nine RBCs
4.3.1. Overall Resilience Dynamics of 9 RBCs
As can be seen from Figure 8, the overall average resilience values of the nine RBCs in Heilongjiang Province show an overall fluctuating and increasing trend during 2010–2019, with two decreasing trends in 2013 and 2017. We combined the stage adaptive cycle phase characteristics to identify that the RBCs in Heilongjiang Province have experienced two adaptive cycles during the ten years. The first adaptive cycle (2010–2013) underwent phases change from α-r-Ω, with resilience slipping rapidly into the Ω release phase in 2013 after a brief and smooth α reorganization phase and a rapidly rising r exploitation phase (2010–2012). Subsequently, RBCs entered a second adaptive cycle (2013–2017) after a rapid renewal and went through a complete α-r-K-Ω phase change. Similarly, after the α reorganization phase and r exploitation phase (2013–2015), the urban system entered the stable K conservation phase (2015–2016) in the process of continuous accumulation. And as the system became rigid, resilience quickly declined to the Ω release phase in 2017. However, resilience soon entered the rapidly improving r exploitation phase again in 2018 and finally entered the K conservation phase in 2019.
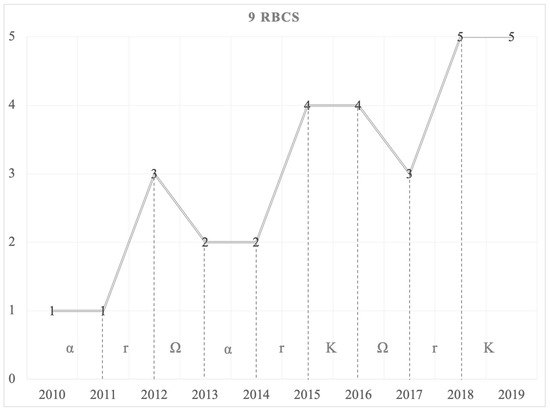
Figure 8.
Resilience dynamics of overall resilience values of 9 RBCs from 2010 to 2019.
In general, RBCs in Heilongjiang Province have the resilience capacity to withstand shocks, adapt, and recover. After each catastrophic event, RBCs can recover quickly and enter a higher adaptive cycle. However, in the first adaptive cycle, the absence of the K conservation phase may represent that the RBCs have not formed a stable structure during the accumulation of system components and therefore enter the Ω release phase immediately after the shock. In addition, after the second adaptive cycle, the system went directly to the r exploitation phase without going through the α reorganization phase. The government’s interventions likely enabled the urban system to recover rapidly in the short-term. Although resilience is at a low level during the α reorganization phase, the system learns and remembers the experience of the last catastrophic event in the process of reorganization and renewal, enhancing the self-organization ability. Thus, this phase is also a manifestation of adaptive capacity.
Specifically, RBCs in Heilongjiang Province experienced two catastrophic events in 2013 and 2017. The main reasons for the rapid decline in the resilience of RBCs in 2013 may be related to the economic downturn caused by the international financial crisis and the implementation of sustainable development policies. Established studies have demonstrated that system resilience can be impacted by external environmental and policy changes [54,62,63,64]. After the impact of the global financial crisis in 2012, RBCs in Heilongjiang Province could not quickly adjust and adapt to the negative impact of the downward international financial environment, resulting in a severe economic downturn. In addition, during the “12th Five-Year Plan” period, China emphasized the importance of sustainable development and ecology and environmental protection. As a result, resource-based industries are directly restricted. Mining cities strictly control the development of high-energy consumable industries. To resolutely eliminate the backward production capacity that seriously consumes resources and pollutes the environment, most of the coal industry structure is forced to be adjusted; forest-based cities start to stop natural forest logging completely. Therefore, under the double impact of the international financial crisis and resource-saving policies, RBCs cannot make a timely structural adjustment, and the social economy slips rapidly, thus entering the Ω release phase. In Hegang, for example, in 2013, the regional gross domestic product fell by 9.5% year-on-year, public revenue fell by 24.59%, and socioeconomic development encountered unprecedented difficulties. The rapid decline in resilience in 2017 may be attributed to China’s renewed emphasis on the necessity of building ecological civilization during the “13th Five-Year Plan” period. the convergence of unfavorable factors, such as the tightening of macropolicies for sustainable development and resource-saving society construction, as well as the decline of industries in RBCs. As an external shock, the socioeconomic conflicts accumulated over the years have once again emerged, leading to another significant decline in urban resilience.
4.3.2. Resilience Dynamics of RBCs by Type
The resilience dynamics of three types of RBCs in Heilongjiang Province, i.e., petroleum, forest, and coal, are identified and analyzed over a 10-year period as follows:
- Petroleum-based cities
From Figure 9, the resilience dynamics of the petroleum-based city (Daqing) showed an overall stepwise growth trend and went through one adaptive cycle over ten years. After experiencing a rapid resilience growth r exploitation phase in 2010–2011; resilience entered a longer plateau period, i.e., the K conservation phase (2011–2016); and in 2017 resilience suddenly dropped into the Ω release phase; but then rapidly entered the r exploitation phase in 2018 and finally entered the K conservation phase again in 2019.
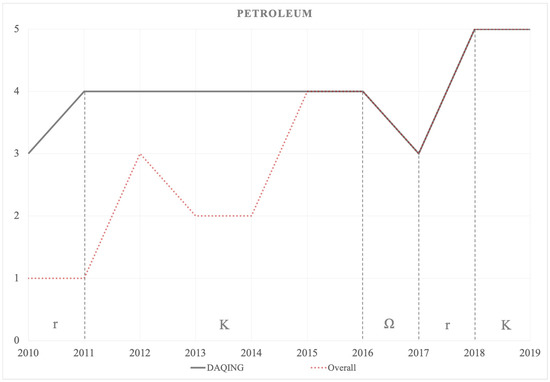
Figure 9.
Resilience dynamics of petroleum-based cities from 2010 to 2019.
In general, the petroleum-based city of Daqing has a high resilience capacity, is less affected by shocks, and can quickly update and adjust its structure, thus enhancing resilience to a higher level. However, urban resilience in a stable phase for a long time implies the system’s rigidity, so the petroleum-based city will face a higher risk of entering the Ω release phase. Specifically, the international financial crisis and resource-constrained policies in 2013 did not significantly impact the resilience of Daqing. The reason may be that petroleum resources are still the lifeblood of the modern economy and are critical to the functioning of the country. As an important petroleum production and petrochemical industry base in China, Daqing has a very mature industrial chain. The high profits generated by the petroleum industry have driven the city’s overall development and socioeconomic level, and the urban system components are accumulating and increasing in redundancy, which has a certain ability to resist shocks.
On the contrary, due to the petroleum industry’s solid position, the mechanisms of the urban system have solidified, and the connectivity and flexibility between urban system components have been decreasing. Thus, in 2017, when China issued the “National Mineral Resources Planning (2016–2020)” [65], which placed explicit restrictions on the petroleum industry. Daqing also entered the Ω release phase as the rigid urban system was unable to quickly adapt to sudden external shocks and its resilience rapidly declined. However, Daqing has subsequently adjusted the urban system state through a series of external measures, and urban resilience has recovered rapidly and increased significantly. For example, Daqing has continuously adjusted its own industrial structure, and the proportion of tertiary industry increased from 14.4% in 2012 to 38.9% in 2019; accordingly, the proportion of secondary industry decreased from 82.1% in 2012 to 53.9% in 2019. In addition, Daqing has paid more attention to the improvement of ecological and environmental quality, with a significant reduction in total emissions of major pollutants, a 76.8% reduction in industrial wastewater discharge and a 44% improvement in wetland area in 2019 compared to 2016. The environment has improved considerably, and the reduction in risk factors has helped improve resilience.
- 2.
- Forest-based cities
From Figure 10, the resilience dynamics of forest-based cities showed an overall smoothly fluctuating trend, experiencing a complete four-phase adaptive cycle (α-r-K-Ω) during 2010–2014. Subsequently, after the Ω release phase in 2014, the resilience rebounded to an upward r exploitation phase in 2015 and entered the longer-term stable K conservation phase in 2015–2019.
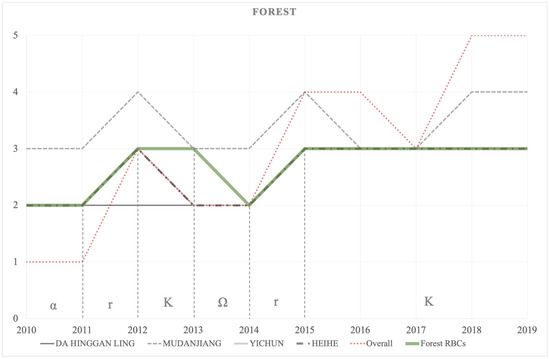
Figure 10.
Resilience dynamics of forest-based cities from 2010 to 2019.
Overall, forest-based cities have medium resilience and can recover from the effects of shocks. However, forest-based cities are also in a long-term K conservation phase, and the old system’s solidified structure reduces the urban system’s diversity and flexibility. However, unlike the petroleum-based city Daqing, forest-based cities do not have a higher socioeconomic redundancy. As a result, urban resilience is difficult to raise to higher levels after recovery. Specifically, forest-based cities experienced a short-term decline in resilience due to the shock in 2013 but were not significantly affected in 2017. The reason may be that after implementing the sustainable development policy in 2013, the country has been vigorously engaged in ecological construction and forest conservation. Therefore, in the face of the sudden change in the leading industry, the socioeconomics of forest-based cities suffered a considerable impact and experienced severe economic decline and unemployment. In Yichun, for example, its timber production dropped by 94.2% year-on-year after 2013, from 924,000 m3 to 54,000 m3, as the forestry industry stopped the main logging. There was a significant impact on the economy, with the growth rate of regional GDP decreasing from 9.8% in 2013 to −9.4% in 2014.
Since then, forest-based cities have shifted their industrial focus to tertiary industries such as tourism and foreign trade. They have also developed forest medicine, fruits, animals, and other new forest-based economies. However, due to the limitations of Heilongjiang Province’s location at the edge of China, the transformation effect is not apparent and has not formed a large-scale new industry. Although the ecological civilization construction policy in 2017 did not significantly impact forest-based cities, their resilience has been at a medium level for a long time and has not been improved.
- 3.
- Coal-based cities
From Figure 11, the resilience dynamics of coal-based cities showed an overall fluctuating trend and underwent two adaptive cycles during the ten years. The first adaptive cycle (α-r-Ω) was during 2010–2013, followed by a second adaptive cycle (α-r-K-Ω) during 2013–2017, and then entered the r exploitation phase of rapid resilience improvement after 2017.
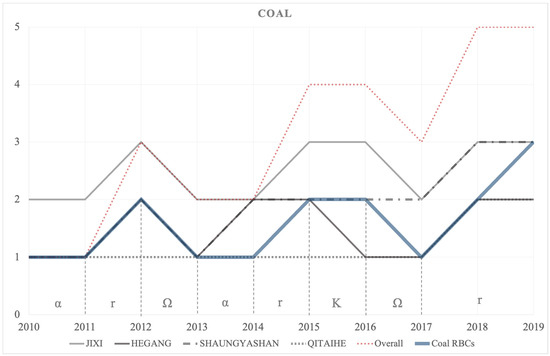
Figure 11.
Resilience dynamics of coal-based cities from 2010 to 2019.
Overall, before 2017, coal-based cities had low resilience capacity, were more affected by shocks, and had difficulty raising resilience to higher levels after recovery. However, after 2017, the rapid increase in resilience to higher levels likely indicates the effectiveness of external measures for resilience improvement. Specifically, the resilience dynamics of coal-based cities are similar to the overall resilience dynamics of nine RBCs experiencing two catastrophic events in 2013 and 2017. The reason may be due to the urban coal industry recession and the decline in resource reserves after 2013, resulting in a reduction in the socioeconomic and a lack of redundancy. In addition, the early coal industry has not yet formed a standardized and large-scale industrial chain, which has generated more private coal mines and family-contracted coal mines, most of these have safety hazards, and some are even illegal mining. After promulgating the sustainable development policy, the local government carried out strict consolidation and governance. A large number of private coal mines were closed, creating a break in the coal supply chain and structural changes in the coal industry, leading to a more severe economic downturn accompanied by severe unemployment, loss of residents, and resident wellbeing issues, leaving the city in a state of high vulnerability and a rapid decline in resilience. In 2014, Hegang became the city with the lowest housing price in China, the growth rate of regional GDP was −10.5%, and the number of residents living on the minimum security increased suddenly by 16,711 people compared with the previous year.
Afterward, coal-based cities continued to adjust their development strategies to foster alternative industries such as tourism and steel manufacturing. Resilience began to rebound and enter the K conservation phase gradually. However, coal-based cities are restricted by many unfavorable factors, such as backward infrastructure, poor location conditions, and population loss. The city’s endogenous development momentum is not strong, and the transition of successive alternative industries is difficult. It cannot compensate for the economic and social problems arising from the serious decline of the coal industry. The resilience remains low, and the resistance to external shocks is weak, making it difficult to quickly adapt to the shocks caused by urban policy changes, thus entering the Ω release phase again in 2017.
After 2017, the country entered the “13th Five-Year Plan” period. Coal-based cities are guided by supply-side structural reform through a new round of policy adjustment and policy feedback at the national and regional levels. The socioeconomic situation gradually improves, leading to the accumulation and enhancement of urban system components, and resilience enters the rapid rise of the r exploitation phase again.
5. Conclusions and Policy Implications
5.1. Conclusions
This study specifies the resilience measurements of RBCs in Heilongjiang Province and analyzes the dynamics and characteristics of resilience from 2010 to 2019 using the adaptive cycle framework, which is a relatively uncommon perspective in the current research field. Therefore, on the one hand, this study clarifies the resilience level and capacity of RBCs and proposes targeted resilience enhancement strategies that have practical implications for enhancing the RBCs’ sustainable development. Additionally, it broadens the scope of research in the direction of resilience dynamics with theoretical significance. The specific findings are detailed below:
- We constructed a resilience indicator system for RBCs in Heilongjiang Province, and applied PCA to specify the indicator weights, brought in standardized data to obtain the resilience values of RBCs in Heilongjiang Province during 2010–2019, and used cluster analysis to classify five grades of resilience. The results show that:
- From 2010 to 2019, the overall resilience values of the nine RBCs exhibited an upward trend;
- There are substantial differences in the level of resilience values between cities, and these differences are primarily attributable to the resource types of cities. The petroleum-based city (Daqing) had the highest level of resilience, followed by the four forest-based cities (Mudanjiang, Hehe, Yichun, and DaHingganLing), and the coal-based cities (Jixi, Shuangyashan, Hegang, and Qitaihe) had the lowest;
- There are group-based characteristics in the spatial distribution of resilience values, with cities within a group tending to develop homogeneously and edge cities being more resilient than inner cities.
- We identified and analyzed the resilience dynamics of RBCs in Heilongjiang Province during 2010–2019 based on the adaptive cycle framework. The results show that:
- Overall, the nine RBCs have the resilience capacity to resist, adapt, and recover from shocks, can recover rapidly, and advance to a higher level of the adaptive cycle following each catastrophic event. They experienced two adaptive cycles during the ten years and entered two Ω release phases in 2013 and 2017, the primary causes of which may have been the financial crisis and policy changes;
- From the perspective of the resilience dynamics of different types of RBCs, the resilience dynamics of petroleum-based cities exhibit a stepped growth trend, with high resilience capacity, being less affected by shocks, and recovering quickly. The resilience dynamics of forest-based cities exhibit a smooth fluctuating trend, with the capacity to recover after being affected by shocks, but in a stable stage for a long time, and the resilience has not been raised to a higher level. The resilience dynamics of coal-based cities exhibit a fluctuating trend, and prior to 2017, the resilience capacity was low, affected by shocks, and it was difficult to raise resilience to a higher level after recovery; after that, resilience increased rapidly to a higher level.
5.2. Policy Implications
RBCs in Heilongjiang Province can generally recover and improve after a shock. However, the levels and capacities of resilience vary significantly between different types of RBCs. Consequently, RBC resilience enhancement strategies in Heilongjiang Province should be differentiated and targeted.
In general, RBCs are impacted not only directly by sudden natural disasters, financial crises, and other black swan events, but also indirectly by “one size fits all” transformation policies. Therefore, resilience enhancement strategies for RBCs should consider disaster resistance, response, and adaptation, as well as the dispersion of the negative effects of institutional change and sudden policy implementation. We propose that resilience enhancement strategies for RBCs should follow the process of adaptive cycles and propose specific strategies based on the resilience characteristics at different phases, emphasizing the positive effect of external measures. Specifically, during the r exploitation phase, RBCs should concentrate on the accumulation of various capital and resource elements to form redundancy and reserve in anticipation of potential shocks. When RBCs are in the K conservation phase, they should focus on the connectivity and flexibility of urban subsystems and build a stable urban structure in order to increase their shock resistance. When RBCs are in the Ω release phase of collapse due to shocks, it is necessary to formulate emergency response plans, mobilize capital redundancy, utilize facilities flexibly, and quickly adjust urban structure in order to minimize the negative impact of shocks on the city. In the α reorganization phase, RBCs should develop self-organization and adaptive capacity to resist future potential risks by memorizing the positive effects learned from the previous shock.
For different types of RBCs, the petroleum-based city (Daqing) has a higher level of resilience, is less affected by shocks, recovers quickly, and has been in the K conservation phase for a long time compared to other types of RBCs. This indicates that Daqing has a stable urban structure and sufficient redundancy, but the overly solid structure leaves little room for improvement and exposes the system to the risk of impending collapse. Therefore, increasing the flexibility and diversity of urban system components is the main strategy to enhance the resilience of petroleum-based cities. It can provide new development motivation and direction for the urban system through specific measures such as cultivating high-tech industries, increasing employment opportunities, introducing professionals, enhancing the natural environment, and protecting ecological resources. Forest-based cities have a medium level of resilience, can recover from shocks but fail to improve and remain at a medium level for a long period of time. This indicates that forest-based cities also have a solid system structure. However, the accumulation of system elements does not create redundancy, and the resilience improvement lacks internal drivers. Therefore, forest-based cities should gradually open up the structure of the solidified system under the premise of enhancing redundancy. Specifically, they can rely on their abundant forest resources to further develop forest medicine, forest fruits, forest animals, and other forest economies, as well as construct a robust industrial chain, while developing tertiary industries such as tourism and services to increase employment opportunities and drive the accumulation and improvement of socioeconomic components. Coal-based cities have a low resilience capacity, are more affected by shocks, and have difficulty improving their resilience to higher levels. However, the situation has changed in recent years, indicating that sustainable development policies are effective in the long term. However, coal-based cities are significantly vulnerable due to their recurrent state of collapse. Therefore, coal-based cities should first restore and repair their own conditions before incorporating new urban components after establishing a stable urban structure. Considering that coal-based cities are severely impacted by resource depletion, they may not be able to accumulate sufficient resources for reconstruction in a timely manner. Consequently, in the process of accumulating urban components, the stability of the urban system should be enhanced through top-down government funding and bottom-up NGO support to address industrial structure risks, expand alternative industries, repair urban infrastructures, reclaim abandoned mining areas and urban wastelands, and conduct ecological restoration.
5.3. Research Limitations and Prospects
In the past two years, the global COVID-19 epidemic has been a major catastrophe, and measures such as “city closures” and “travel restrictions” were unquestionably another significant shock to RBCs that had just emerged from or were still in the midst of the dilemma of transformation. However, the years 2020 to the present are excluded from this study because of an absence of data. In our future research, we will investigate in greater detail the resilience dynamics and target strategies of RBCs in the context of the epidemic.
Author Contributions
Conceptualization, M.L. and Z.T.; methodology, Z.T.; software, Z.T.; validation, M.L. and Z.T.; formal analysis, Z.T.; investigation, Z.T.; resources, M.L. and Z.T.; data curation, Z.T.; writing—original draft preparation, M.L. and Z.T.; writing—review and editing, M.L. and Z.T.; visualization, Z.T.; supervision, C.Y., Y.D. and W.D.; project administration, M.L.; funding acquisition, M.L. All authors have read and agreed to the published version of the manuscript.
Funding
This research was funded by National Natural Science Foundation of China, grant number 52078160.
Data Availability Statement
The data presented in this study are available on request from the corresponding author.
Acknowledgments
We thank all the teachers and students who contributed to this study, especially Naisi Hua, and the anonymous reviewers for the helpful comments that improved this manuscript.
Conflicts of Interest
The authors declare no conflict of interest.
References
- Yang, Y.; Fang, Y.; Xu, Y.; Zhang, Y. Assessment of urban resilience based on the transformation of resource-based cities: A case study of Panzhihua, China. Ecol. Soc. 2021, 26, 20. [Google Scholar] [CrossRef]
- Liu, Z.; Zhou, W.; Yao, H. Progress of studies abroad on development and transition of resource-based cities. China Popul. Resour. Environ. 2011, 21, 161–168. [Google Scholar]
- Hu, Y.; Liu, Y.; Sun, H. Process and factors of urban growth and shrinkage: A case study of mining cities in Heilongjiang Province. Sci. Geogr. Sin. 2020, 40, 1450–1459. [Google Scholar] [CrossRef]
- Wang, W.; Lu, C.; Wang, Y. Problems countermeasures of population loss in resource-based cities in Heilongjiang. China Population. Resour. Environ. 2018, 28, 63–66. [Google Scholar]
- Li, Z.; Hou, S.; Huang, Y.; Xu, H. Land Ecological Security Evaluation of Coal-Resource Cities in Heilongjiang Province:A Case Study of Shuangyashan City. Sci. Technol. Manag. Land Resour. 2011, 28, 46–51. [Google Scholar]
- Turner, B.L., II. Vulnerability and resilience: Coalescing or paralleling approaches for sustainability science? Glob. Environ. Chang. 2010, 20, 570–576. [Google Scholar] [CrossRef]
- Batty, M. The size, scale, and shape of cities. Science 2008, 319, 769–771. [Google Scholar] [CrossRef]
- Cumming, G.S.; Barnes, G.; Perz, S.; Schmink, M.; Sieving, K.E.; Southworth, J.; Binford, M.; Holt, R.D.; Stickler, C.; Van Holt, T. An exploratory framework for the empirical measurement of resilience. Ecosystems 2005, 8, 975–987. [Google Scholar] [CrossRef]
- Carpenter, S.; Walker, B.; Anderies, J.M.; Abel, N. From metaphor to measurement: Resilience of what to what? Ecosystems 2001, 4, 765–781. [Google Scholar] [CrossRef]
- Walker, B.; Holling, C.S.; Carpenter, S.R.; Kinzig, A. Resilience, Adaptability and Transformability in Social-Ecological Systems. Ecol. Soc. 2004, 9, 5. Available online: http://www.jstor.org/stable/26267673 (accessed on 21 January 2022). [CrossRef]
- Folke, C. Resilience: The emergence of a perspective for social–ecological systems analyses. Glob. Environ. Chang. 2006, 16, 253–267. [Google Scholar] [CrossRef]
- Folke, C.; Carpenter, S.R.; Walker, B.; Scheffer, M.; Chapin, T.; Rockström, J. Resilience Thinking: Integrating Resilience, Adaptability and Transformability. Ecol. Soc. 2010, 15, 20. Available online: https://www.jstor.org/stable/26268226 (accessed on 21 January 2022). [CrossRef]
- Carpenter, S.R.; Arrow, K.J.; Barrett, S.; Biggs, R.; Brock, W.A.; Crépin, A.-S.; Engström, G.; Folke, C.; Hughes, T.P.; Kautsky, N.; et al. General Resilience to Cope with Extreme Events. Sustainability 2012, 4, 3248–3259. [Google Scholar] [CrossRef]
- Berkes, F. Environmental Governance for the Anthropocene? Social-Ecological Systems, Resilience, and Collaborative Learning. Sustainability 2017, 9, 1232. [Google Scholar] [CrossRef]
- Meerow, S.; Newell, J.P.; Stults, M. Defining urban resilience: A review. Landsc. Urban Plan. 2015, 147, 38–49. [Google Scholar] [CrossRef]
- Godschalk, D.R. Urban hazard mitigation: Creating resilient cities. Nat. Hazards Rev. 2003, 4, 136–143. [Google Scholar] [CrossRef]
- Holling, C.S. Resilience and stability of ecological systems. Annu. Rev. Ecol. Syst. 1973, 4, 1–23. Available online: https://www.jstor.org/stable/2096802 (accessed on 21 January 2022). [CrossRef]
- Allen, C.R.; Holling, C.S. Novelty, adaptive capacity, and resilience. Ecol. Soc. 2010, 15, 24. Available online: https://www.jstor.org/stable/26268188 (accessed on 21 January 2022). [CrossRef]
- Holling, C.S.; Gunderson, L.; Peterson, G. Sustainability and Panarchies. In Panarchy: Understanding Transformations in Human and Natural Systems; Gunderson, L.H., Holling, C.S., Eds.; Island Press: Washington, DC, USA, 2002; pp. 63–102. [Google Scholar]
- The Resilience Alliance. Available online: https://www.resalliance.org/key-concepts (accessed on 21 January 2022).
- Li, K.X.; Hu, H.; Zhao, H.M. Evolution analysis of regional social-ecological systems based on adaptive cycle theory and Pressure-State-Response framework. Acta Ecol. Sin. 2022, 42, 1–16. [Google Scholar] [CrossRef]
- Li, Y.; Kappas, M.; Li, Y.F. Exploring the coastal urban resilience and transformation of coupled human-environment systems. J. Clean. Prod. 2018, 195, 1505–1511. [Google Scholar] [CrossRef]
- Luo, F.; Liu, Y.; Peng, J.; Wu, J. Assessing urban landscape ecological risk through an adaptive cycle framework. Landsc. Urban Plan. 2018, 180, 125–134. [Google Scholar] [CrossRef]
- Zhang, L.; Huang, Q.; He, C.; Yue, H.; Zhao, Q. Assessing the dynamics of sustainability for social-ecological systems based on the adaptive cycle framework: A case study in the Beijing-Tianjin-Hebei urban agglomeration. Sustain. Cities Soc. 2021, 70, 102899. [Google Scholar] [CrossRef]
- Ding, X.C.; Zhang, Y. Research on transition and development mode of resource-based cities according to the cycle theory. World Reg. Stud. 2008, 3, 70–76. [Google Scholar]
- Mao, J.X.; He, Y.J. Study on the lifecycle model of resource-intensive cities. Geogr. Geo-Inf. Sci. 2008, 24, 56–60. [Google Scholar]
- Holling, C.S. Understanding the complexity of economic, ecological and social systems. Ecosystems 2001, 4, 390–405. [Google Scholar] [CrossRef]
- Shao, Y.; Xu, J. Understanding Urban Resilience: A Conceptual Analysis Based on Integrated International Literature Review. Urban Plan. Int. 2015, 30, 48–54. [Google Scholar]
- The State Council the People’s Republic of China. Available online: http://www.gov.cn/zwgk/2013-12/03/content_2540070.htm (accessed on 21 January 2022).
- Zhang, W.Z.; Wang, D.; Yu, J.H. Study on the Development Path and Pattern of Substituted Industry in Resource-Based Cities. Bull. Chin. Acad. Sci. 2011, 26, 134–141. [Google Scholar]
- Dong, S.; Li, Z.H.; Li, B.; Xue, M. The problems and strategies on economic transformation of resource-based cities in China. China Popul. Resour. Environ. 2007, 5, 12–17. [Google Scholar]
- National Bureau of Statistics of China. Available online: http://www.stats.gov.cn/english/ (accessed on 21 January 2022).
- Yang, J.; Huang, X. The 30 m annual land cover dataset and its dynamics in China from 1990 to 2019. Earth Syst. Sci. Data 2021, 13, 3907–3925. [Google Scholar] [CrossRef]
- Brelsford, C.; Lobo, J.; Hand, J.; Bettencourt, L.M. Heterogeneity and scale of sustainable development in cities. PNAS 2017, 114, 8963–8968. [Google Scholar] [CrossRef]
- Allington, G.R.; Li, W.; Brown, D.G. Urbanization and environmental policy effects on the future availability of grazing resources on the Mongolian Plateau: Modeling socio-environmental system dynamics. Environ. Sci. Policy 2017, 68, 35–46. [Google Scholar] [CrossRef]
- Pelling, M.; Manuel-Navarrete, D. From resilience to transformation: The adaptive cycle in two Mexican urban centers. Ecol. Soc. 2011, 16, 11. [Google Scholar] [CrossRef]
- Jabareen, Y. Planning the resilient city: Concepts and strategies for coping with climate change and environmental risk. Cities 2013, 31, 220–229. [Google Scholar] [CrossRef]
- Hosseini, S.; Barker, K.; Ramirez-Marquez, J.E. A review of definitions and measures of system resilience. Reliab. Eng. Syst. Saf. 2016, 145, 47–61. [Google Scholar] [CrossRef]
- Dicken, P. Global Shift: Mapping the Changing Contours of the World Economy, 6th ed.; Guilford Press: New York, NY, USA, 2011; p. 20. [Google Scholar]
- Assessing Resilience in Social-Ecological Systems: Workbook for Practitioners. Available online: http://www.resalliance.org/3871.php (accessed on 21 January 2022).
- Christopher, B.G. A Validation of Metrics for Community Resilience to Natural Hazards and Disasters Using the Recovery from Hurricane Katrina as a Case Study. Ann. Assoc. Am. Geogr. 2015, 105, 67–86. [Google Scholar] [CrossRef]
- The Rockefeller Foundation and ARUP. City Resilience Framework. Available online: https://www.urban-response.org/system/files/content/resource/files/main/city-resilience-framework-arup-april-2014.pdf (accessed on 21 January 2022).
- Cutter, S.L.; Ash, K.D.; Emrich, C.T. The geographies of community disaster resilience. Glob. Environ. Chang. 2014, 29, 65–77. [Google Scholar] [CrossRef]
- Orencio, P.M.; Fujii, M. A localized disaster-resilience index to assess coastal communities based on an analytic hierarchy process (AHP). Int. J. Disaster Risk Reduct. 2013, 3, 62–75. [Google Scholar] [CrossRef]
- Constructing a Resilience Index for the Enhanced Critical Infrastructure Protection Program. Available online: https://www.osti.gov/servlets/purl/991101 (accessed on 21 January 2022).
- Hosseini, H.; Kaneko, S. Dynamic sustainability assessment of countries at the macro level: A principal component analysis. Ecol. Indic. 2011, 11, 811–823. [Google Scholar] [CrossRef]
- Douka, H.; Papadopoulos, A.; Savakis, N.; Tsoutsos, T.; Psarras, J. Assessing energy sustainability of rural communities using principal component analysis. Renew. Sustain. Energy Rev. 2012, 16, 1949–1957. [Google Scholar] [CrossRef]
- Tan, F.; Lu, Z. Study on the interaction and relation of society economy and environment based on PCA–VAR model: As a case study of the Bohai Rim region, China. Ecol. Indic. 2015, 48, 31–40. [Google Scholar] [CrossRef]
- Abou-Ali, H.; Abdelfattah, Y. Integrated paradigm for sustainable development: A panel data study. Econ. Model. 2013, 30, 334–342. [Google Scholar] [CrossRef]
- Wang, D.; Yang, H.; Hu, Y.; Zhu, A.X.; Mao, X. Analyzing Spatio-Temporal Characteristics of Cultivated Land Fragmentation and Their Influencing Factors in a Rapidly Developing Region: A Case Study in Guangdong Province, China. Land 2022, 11, 1750. [Google Scholar] [CrossRef]
- Walker, B.; Salt, D. Resilience Thinking: Sustaining Ecosystems and People in a Changing World; Island Press: Washington, DC, USA, 2015; pp. 25–27. [Google Scholar]
- Walker, B.; Salt, D. Resilience Practice: Buiding Capacity; Island Press: Washington, DC, USA, 2012; pp. 33–34. [Google Scholar]
- Fath, B.D.; Dean, C.A.; Harald, K. Navigating the adaptive cycle: An approach to managing the resilience of social systems. Ecol. Soc. 2015, 20, 24. [Google Scholar] [CrossRef]
- Beier, C.M.; Lovecraft, A.L.; Chapin, F.S., III. Growth and collapse of a resource system: An adaptive cycle of change in public lands governance and forest management in Alaska. Ecol. Soc. 2009, 14, 5. Available online: http://www.ecologyandsociety.org/vol14/iss2/art5/ (accessed on 21 January 2022). [CrossRef]
- Li, X.; Zhuang, X. Eco-City Problems: Industry–City–Ecology, Urbanization Development Assessment in Resource-Exhausted Cities. Sustainability 2023, 15, 166. [Google Scholar] [CrossRef]
- Ming, L.; Chang, J.; Li, C.; Chen, Y.; Li, C. Spatial-Temporal Patterns of Ecosystem Services Supply-Demand and Influencing Factors: A Case Study of Resource-Based Cities in the Yellow River Basin, China. Int. J. Environ. Res. Public Health 2022, 19, 16100. [Google Scholar] [CrossRef]
- Long, R.; Li, H.; Wu, M. Dynamic evaluation of the green development level of China’s coal-resource-based cities using the TOPSIS method. Resour. Policy 2021, 74, 102415. [Google Scholar] [CrossRef]
- di Santo, N.; Russo, I.; Sisto, R. Climate Change and Natural Resource Scarcity: A Literature Review on Dry Farming. Land 2022, 11, 2102. [Google Scholar] [CrossRef]
- Liao, L.; Du, M.; Huang, J. The Effect of Urban Resilience on Residents’ Subjective Happiness: Evidence from China. Land 2022, 11, 1896. [Google Scholar] [CrossRef]
- Zheng, Y.; Cheng, L.; Wang, Y. Measuring the Spatial Conflict of Resource-Based Cities and Its Coupling Coordination Relationship with Land Use. Land 2022, 11, 1460. [Google Scholar] [CrossRef]
- Zhang, S.; Wang, L.; Wu, X. Population Shrinkage, Public Service Levels, and Heterogeneity in Resource-Based Cities: Case Study of 112 Cities in China. Sustainability 2022, 14, 15910. [Google Scholar] [CrossRef]
- Beatley, T.; Newman, P. Biophilic Cities Are Sustainable, Resilient Cities. Sustainability 2013, 5, 3328–3345. [Google Scholar] [CrossRef]
- Shi, C.; Guo, N.; Zhu, X.; Wu, F. Assessing Urban Resilience from the Perspective of Scaling Law: Evidence from Chinese Cities. Land 2022, 11, 1803. [Google Scholar] [CrossRef]
- Huang, J.; Sun, Z.; Du, M. Differences and Drivers of Urban Resilience in Eight Major Urban Agglomerations: Evidence from China. Land 2022, 11, 1470. [Google Scholar] [CrossRef]
- Ministry of Natural Resources of the People’s Republic of China. National Mineral Resources Planning (2016–2020). Available online: https://www.mnr.gov.cn/gk/ghjh/201811/t20181101_2324927.html (accessed on 21 January 2022).


Disclaimer/Publisher’s Note: The statements, opinions and data contained in all publications are solely those of the individual author(s) and contributor(s) and not of MDPI and/or the editor(s). MDPI and/or the editor(s) disclaim responsibility for any injury to people or property resulting from any ideas, methods, instructions or products referred to in the content. |
© 2023 by the authors. Licensee MDPI, Basel, Switzerland. This article is an open access article distributed under the terms and conditions of the Creative Commons Attribution (CC BY) license (https://creativecommons.org/licenses/by/4.0/).