Abstract
Despite apparent efficiency concerns, the use of agricultural insurance as a policy tool has surged in rural China. Its use offers a natural experiment to assess both economic theory of property rights and agricultural policy effectiveness, and to revisit the rent dissipation model that was originally developed to explain the role of property rights in unsustainable fisheries harvest decisions. We focus on evidence of resource overpricing behavior in the context of subsidized agricultural insurance, including evidence of a theoretically-expected increasing rent pattern. Our results reinforce the importance of transactions costs as a driver of economic inefficiency and highlight the role of social costs as an important factor to explicitly consider when designing agricultural policy. In particular, when employing the formal policy mechanism of rural agricultural insurance, we suggest that informal risk-bearing arrangements can be leveraged to reduce social costs behind apparent overpricing behavior and increase land users’ welfare consistent with intended policy goals.
1. Introduction
Economic rents, or economic profits, are the net benefits to producers that result from their efforts. In a natural resource context, rent dissipation can occur when open-access resources are over-extracted, leading to economically unsustainable use (e.g., Walker et al., 1990). For biological resources like fish, rent dissipation can also lead to collapse of the resource and even extinction (e.g., Homans and Wilen (2005). Gordon (1954)’s groundbreaking analysis of fishery grounds introduced his rent dissipation model, which sought to incorporate the concept of equilibrium into fisheries production analysis [1,2,3]. The model led to the eventual recognition of the importance of property rights in natural resources management and sustainability.
Focusing on whether marine resources could be depleted and collapse the fishery, the model evolved from applying predator–prey relationships to fisheries management. Over time, scholars have expanded the model to address critiques about its biologically-mechanistic focus and its assumptions or implications about human behavior (e.g., that anglers are not adaptive). Indeed, fisheries modeling is tending toward more holistic approaches that directly incorporate social and economic dimensions into fisheries management and policy decisions (e.g., Asche et al., 2017) [4].
One well-known critique of Gordon’s framework is its apparent inconsistency with economic theory: why would fishermen harvest the so-called maximum sustainable yield when their marginal product of labor has reached zero? To put it in another way, maximum sustainable yield defined by Gordon violates the rationality assumption in neoclassical economics and implied in the law of diminishing marginal product.
Cheung (1970)’s path-breaking work on property rights rehabilitated Gordon’s solution to this common fishery problem and provided a pathway to a rigorous equilibrium model [5]. Importantly, Cheung highlighted the absence of exclusive use rights that result in zero marginal return of labor in Gordon’s model.1 In short, Cheung added an important dimension to Gordon’s framework that helped address user group dynamics in the context of barriers to entry.
As econometrics grew in influence, property rights scholars were able to employ sophisticated models along with larger and more diverse data to empirically test this theoretical context, and the framework was adopted well beyond the fisheries context, adding to our understanding of the importance of property rights (e.g., for investment decisions). For example, Hu, Tao, Zhang, and Adams (2021) derived a quantitative measure of transaction costs founded on Coasean–Cheungian contract theory [6]. Using this cardinal measure, they provide a workable explanation for rent dissipation of land use in rural China. We also note an intriguing study by Williams (2013) that investigated the role of property rights in biotech firms by focusing on the competition between “Celera” and the “Human Genome Plan” [7]. Oddly, they found that private investments were deterred rather than promoted by the presence of property rights. To explain this idiosyncratic phenomenon, Williams proposed two kinds of transaction costs: huge negotiation costs from “hold-up” issues, and “over-investment” induced by disclosure of business secrets.2 A follow-up study that further advanced the analysis gave insufficient attention to the role of transaction costs [8], and leaves room for inquiry into a rigorous empirical measure of transaction costs in this context.
As documented in previous work, the rent dissipation model is a useful tool for explaining and empirically testing behaviors of natural resource users, especially those choices involving uncertainty or risk about property rights. Here, we employ the framework to understand the impacts of a significant change to property rights that occurred when China abolished its agricultural tax in 2006. The policy change led to a dramatic shift in property rights—the right to income did not remain with the landholder, but instead remained in the public domain. As a result, the state essentially acts as absentee landlord and functionally discards the rent in the public domain. Theoretically, this should result in rent dissipation behavior like what is seen in open-access fisheries, which would be reflected in the price.
To better understand the impacts of the policy, we extend Gordon’s model to include both uncertainty around the economic resource and also agents that can dynamically manipulate the resource, which may be happening in the China agricultural context. If true, we should see signs of an increasing rent3 pattern even if the relevant economic resource is unclear.4 As to factors that play a role in the determination of land rent, we argue that property rights are an important factor that cannot be ignored. Addressing this factor has implications for our understanding of the role of transactions costs. In the theoretical part of this paper, we demonstrate that marginal transaction costs induce a significant change of behavior when agricultural insurance is available, functioning like a governmental subsidy. In that way, agricultural insurance leads to overpricing, with relevance to Halcrow (1948, 1949)’s path-breaking work [9,10].
We note that this analytical paradigm is at odds with prevailing Pigouvian theories. The Pigouvian tradition suggests that economically inferior firms obtain rents, leading to inefficiency in resource allocation and underpinning Pigou’s adamant demands for governmental intervention [11]. One notable example of this apparent conflict is in the area of agricultural insurance; for example, see the work on the modern area yield insurance by Miranda, weather index insurance by Mobarak and Rosenzweig, or even rainfall index insurance by Cole and Stein and Tobacman (to discern normal demand for rain from drought) [12,13,14]. We tabulate in Table 1 the catalogue of index-based agricultural insurance research, their findings, methodology, and pitfalls.

Table 1.
Indexed-based Agricultural Insurance.
This paper has two main objectives. First, we use the rent dissipation model to explain anomalies with China’s subsidized agricultural insurance, which can be recognized as a theoretical contribution to decision-making under uncertainty. Second, we empirically test the increasing rent pattern implication derived from the overpricing hypothesis by using ordinal measure of transaction costs5, which complements previous research on transaction costs economics. Note that Baker et al. (2020) also recognized the role of transaction costs in foresters’ investment decisions, although their research did not provide direct empirical evidence on this role [16]. The remainder of this paper is organized as follows: the conceptual model is presented in Section 2, in which we present an overpricing hypothesis by bringing a transaction costs constraint into risk management in land use. Section 3 and Section 4 refines the constraint involved in subsidized agricultural insurance and provides an empirical test of the theory. Finally, we compute marginal value of public funds in Section 5 as an additional test of the theory. Section 6 provides a discussion and concludes.
2. Theoretical Background and Research Hypotheses
Two main facts can be observed in the promotion of agricultural insurance: first, collusion between insurance companies and agents dominates the illegal actions6; and second, at the macro-level view of rent-seeking, both premium series and indemnity series data show a significant increasing trend. Informational asymmetry in this kind of business is possible, but it does not constitute a powerful explanation for the two facts reported above. To understand the prevailing fraud cases7, two difficulties are recognized: the first concern is the difficulty of developing a premium structure, and the second is that the theoretical foundation of traditional agricultural insurance research ignores ambiguous property rights and transaction costs involved in promotion. These factors can drive Chinese farmers to ignore agricultural insurance. Put differently, both distortion of the price mechanism and evasion of transaction costs result in rent-seeking.
One common idea in neo-institutional economics is that ambiguous property rights result in rent-seeking behavior and transaction costs. In terms of a price signal, public services provided by the government are in contrast to the case examined in Hu et al. (2021). Hereafter, it is demonstrated that rent dissipation can be transformed into economic rent increase when the budget constraint is removed, which runs counter to the analyses of Gordon and Cheung. Our reformulation of the rent dissipation model emphasizes the empirical implications of marginal transaction costs fc(·). The empirical grounding of this model stands in contrast with other policy evaluation models, which is demonstrated in Section 2.2 by the overestimation of the demand for agricultural insurance driven by information asymmetries among farmers.
2.1. Classical Rent Dissipation Model in ‘Land Use’ of Fishbeds
In general, designated fishbeds and agricultural insurance both can create income flows to owners. The analysis of resource use and income distribution is complicated by non-zero, positive transaction costs. Since agricultural insurance generally fails to support itself, and relies on governmental subsidies to remain viable, it is natural to suppose that poor demand for this service is the natural response from the market8. To use property-rights terminology, the rent originating from agricultural insurance is too low to encourage a large number of outsiders to participate. A limited number of laborers9 is enough to deplete the total rent of such a nonexclusive resource.
As pointed out in the introduction, Gordon replaces the cost10 by the population factor, as shown in Figure 1. In Gordon’s solution of Figure 1, P1, P2, …, P7 denote seven increasing fish populations successively. The landings, q, depends not only on fish population p, but also on labor input l. The cost of fishing is given by c = c(l). According to Gordon, it’s the decreasing fishing population that determines maximum yields, rather than the law of decreasing marginal product. Even if one thinks this substitution is correct in the logic, the “Gordon solution” fails to offer a stable equilibrium as to the nonexclusive fishing bed; why will those fishermen continue to squeeze in while there is huge rent dissipation?
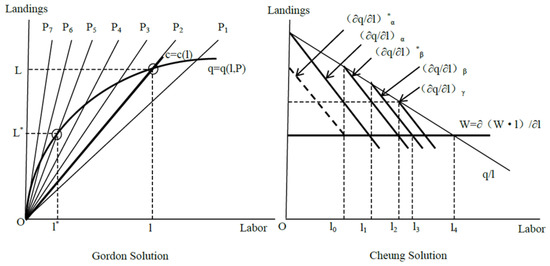
Figure 1.
Traditional Rent Dissipation Models: Biological Population versus Common Property. “l*” in the Gordon Solution suggests optimal labor input. Geometrically, this point can be found by moving the cost curve c = c(l) parallelly to get a point of tangency in production function q = q(l, P). To rephrase it, we shall say marginal equality principle prevails in this land use case.
In contrast, Cheung argues that, to draw the economic value of public resource to zero, the number of anglers must approach infinity. Here, (∂q/∂l)α in the “Cheung Solution” of Figure 1, designates a marginal production curve of laborer α when β and γ are absent. Given the competitive opportunity cost W, the equilibrium labor input will be l1. However, when β joins, α’s marginal production curve will shrink into (∂q/∂l)*α.11 Assuming homogenous labor, now β’s marginal production curve will be (∂q/∂l)β. Total labor on a given fishing bed will increase, while total rent declines owing to unconstrained competition. That is, rent dissipation occurs. If a third γ enters, rent dissipation will continue. Hence, reconciliation between Cheung’s solution and poor demand for agricultural insurance depends on our understanding about the transaction costs behind this institution. Moreover the “Cheung solution” is approximately stable in terms of mathematical limitations: (∂q/∂l)α = (∂q/∂l)β = (∂q/∂l)γ = …… = W. However, when trying to deduce a three-person equilibrium (begun by drawing (∂q/∂l)*α, which is shown by the dotted line in our Figure 1), Cheung’s derivation becomes ad hoc, and a marginal production curve cannot be illustrated for the third labor γ. The difficulty results from the linear assumption that makes an equal share of labor input impossible under decreasing marginal product and rent dissipation constraints. In Hu et al. (2021), a general transaction-costs function is suggested and a more robust result than Cheung can be obtained.
2.2. Extension: Cardinal Transaction Costs at Margin and Overpricing Hypothesis of Agricultural Insurance
Taking into consideration transaction costs as actual costs12, the rent dissipation model in fisheries economics can be extended to the overpricing hypothesis. Owing to its emphasis on the constraint of marginal transaction costs on potential rivals, the horizon axis in Figure 2 measures the quantity of the public resource rather than such a flexible factor as labor, in order to demonstrate the overpricing mechanism under ambiguous property rights. “q” stands for production, and “p” indicates a proxy for fixed costs (comparable to a fishing bed), which is different from the proxy for variable costs (such as fishing labor). Rent originates from the return of proxy for overhead costs. R0 indicates the prevailing quantity due to agricultural insurance when transaction costs are assumed away. However, when assuming overpricing (as shown by R1 in Figure 2), now R1-R can be used to measure the marginal information costs fc(·) involved in this practice.

Figure 2.
Transaction costs and the Illustration of Overpricing Mechanism to Increase Rent.
Unlike the United States, China abolished its agricultural tax in 2006. Since 2007, the central government in China has begun to subsidize agricultural insurance. It is not difficult to discern the following points: rent from this public service is almost infinite relative to China’s agricultural products because the subsidies are entirely financed by income taxes that are irrelevant to Chinese farmers. If agricultural insurance is recognized as an expected public service provided by all three levels of government, then its service flow or rent rate is permanent. That is, the rent from this service can be understood as unlimited. One would suspect that rent-seeking will be very popular and that public data may show certain increasing rent patterns. However, problems would eventually arise in such a system. In fact, agricultural insurance once existed in rural China but failed. Why has it returned, or to use a common phrase, is it just a “new bottle for old wine”?
We assert that ambiguous property rights are the key to understanding the phenomenon and in this context can be explained using the overpricing hypothesis: If the rent rates derived from certain resources behave as if they are inexhaustible because of certain kinds of information costs, then the suppliers of such resources (or, equally, the government agents, such as insurance companies) are incentivized to increase the frequency of the services by exaggerating the scale of production (area planted or material cost, for example) or by exaggerating production units (numbers of farmers or farmer cooperatives). Additionally, suppliers have the choice to increase the quantity supplied by exaggerating the extent of the availability of such services (e.g., production losses). Owing to its emphasis on cardinal measures of transaction costs implied in an overpriced resource, our theory is empirically-relevant and can be tested.
Importantly, this theory includes marginal transaction costs fc(·), which depress the signal of R1 significantly, as demonstrated by the service flow R = R1−fc(·) that the insured farmer received in fact. Note R < R0, which leads to the conclusion that this public service cannot fulfill its stated contractual benefit relevant to farmers when insurance claims settlement is costly. In this new equilibrium, the farmer as the end user of agricultural insurance is expected to exit the market. However, from the standpoint of insurance companies and agents between insurance companies and farmers, the existence of marginal transaction costs (and farmer apathy) creates an advantageous opportunity for increasing the in-house agent’s private benefits.
As noted in Figure 2, with overpricing (and a rightward shift from α to β) now R is significantly lower than the stated benefit of agricultural insurance, R0. The proxy for overhead costs becomes 2P0 in the new equilibrium resulting from the marginal transaction costs fc(·). In contrast, when fc(·) is not included and R = R1, the program only generates 0.5P0 units of overhead cost that can be captured by the insurance companies. It is not difficult to ascertain that through the constraints on competition from farmers of fc(·), and under ambiguous property rights, this public service will increasingly benefit insurance companies.13 In this model, the quantity of labor (a proxy for direct costs) shrinks rather than dramatically increases as found in Cheung’s Solution of Figure 2. The total rent under the overpricing hypothesis will be 2R·P0, which is significantly larger than 0.5R1·P0. The implication is straightforward: because intra-marginal agents (insurance companies or in-house agents) can influence the contractual terms of agricultural insurance (or otherwise exert detrimental effects on farmers by increasing transactions costs without concomitant benefits to farmers) to restrain competition from farmers, even if the governmental institution overprices agricultural insurance, total rents derived from this public service can still increase. Alternatively, in simple economic terms, it is not surprising that a small number of people can use ambiguous property rights just as efficiently as if they were exclusive rights.
Adding marginal transaction costs fc(·) induced by the information asymmetry of relevant institution into consideration, farmers generally will be precluded from participating in negotiations. Naturally, the competition is centered on the agents and insurance companies rather than the farmers. The empirical implication is that the farmers see little benefit from the service or care about its real results. As noted, the value of agricultural insurance is measured by the farmers’ expenses rather than the total premiums indicated in the “China Insurance Yearbook”. However, interestingly, the premium rates for agricultural insurance in China are not set by the market, and there is not only a price control but also a rigorous subsidy proportion limitation. This feature of the system lends itself to empirical test using a nonparametric method. Thus, the overpricing hypothesis can be tested with a simple but rather significant deduction—focusing on the frequency of agricultural insurance, one will discern that the value of such services will increase after the subsidization policy is implemented in 2007. In addition, one will also observe that the case of loss exaggeration (fraud) is somewhat common. Given the wide availability of the service, these illegal behaviors mirror high indemnities that can be discerned in the data.
3. Materials and Methods
The Uruguay Round of the GATT negotiation is a milestone in the history of the WTO. Eighteen official agreements were reached among all the members, including China’s Agreement on Agriculture. The AOA consists of 13 documents and 5 appendices. The so-called green box exempts members from the “domestic support” concession commitment to the WTO. The relevant content is contained in “Table A2” of AOA, in which agricultural insurance is discussed in Paragraphs 1, 5, and 7. To transform into a completely market-oriented economy after the transition period following its WTO entry, China gradually eliminated various price supports for agricultural products. As a green-box provision in the AOA, agricultural insurance became China’s preferred policy intervention, with its stated expectation of reducing risk in agricultural production.
According to the “AOA”, agricultural insurance can be seen as a contract with property rights ambiguously indicated. Thus, if a first-hand contract is available, then the model will be presented with a wonderful opportunity. However, in China, the farmers involved in agricultural insurance will wait for the agents to estimate losses, and more curiously, the farmers do not possess the policies. When searching for relevant data, one can find the total premiums and indemnities in a county or the corresponding operating material of an insurance company in a district. These data are not ideally suited for this analysis. Assuming the prerequisite of overpricing hypothesis is invalidated, then one group of clients may need more insurance from a company while another group demands less, and still others’ level of demand may be just between these two groups.
Given the aggregated nature of the data, one can infer the rent implied in the policies on average at most, which may miss the implication of choices of more extensive groups. Likewise, the comparisons of the data from different districts relating to the same insurance company are open to the same doubt. We can still see the role of opportunity costs in aggregated evidence, and we expect to see a rent-seeking pattern after 2007. We use agricultural insurance premium data directly extracted from yearly “China Insurance Yearbook” during 2005–2021. Its definition is officially set basing on provincial data, so we have 31 premium series of data every year from these locations: Beijing, Tianjing, Hebei, Shanxi, Neimeng, Liaoning, Jilin, Heilongjiang, Shanghai, Jiangsu, Zhejiang, Anhui, Fujian, Jiangxi, Shandong, Henan, Hubei, Hunan, Guangdong, Guangxi, Hainan, Chongqing, Sichuang, Guizhou, Yunnan, Xizang, Shannxi, Gansu, Qinghai, Ningxia, and Xinjiang (Hongkong, Taiwan and Macau are excluded on purely statistical grounds). Its measure is roughly equivalent to the farmer’s outlay plus their governmental subsidy that is not reported in public publications. By the same token, there are 31 indemnities data series each year indicating all indemnities concerning agricultural insurance in the given province.
Recently, the China Insurance Regulation Committee (CIRC hereafter) released the premium and indemnity series of subsidized agricultural insurance in 2021. Combining them with data during 2004–2020, one can get time series on premium and indemnity in China’s 31 provinces or province-level municipality, which can be used to test the implication of overpricing hypothesis constructed in Section 2.2.
Since 2007, the Chinese Administration of Finance began a special fund to subsidize both farmers and insurance companies involved in agricultural insurance. In China, subsidized agricultural insurance is financed in four steps as subsidies from the central government, provincial government, municipal government, and local government, plus payments from the farmer. For instance, in one example case in Hunan, the percentage cost borne for insurance by each of above ranged from 10% to 40%, but typically a farmer would be asked to contribute 25%. This long chain of actors leaves room for outside influence that can undermine the policy goal and reduce effectiveness of the program. In practice, agricultural insurance premiums are set by nonmarket forces prima facie despite the principal-agency contract chain, owing to its lack of consideration of farmers’ production decisions. The good intention behind fixed premium system originates from the desire for equity. However, overpricing behavior, the increasing indemnities (use of the insurance), and exclusion of most small farmers (in-house landlords) leads to undesirable outcomes both for efficiency and equity.
Intuitively, the premium series of 31 districts confirms this conjecture. Examples from a premium series of 9 major crop-producing areas is shown in Figure 3 (other areas are omitted to avoid overcrowding the graph). All 9 sub-plots show a clear increasing trend, and this trend also appears in time series of other 22 province or province-level municipality. Focusing on the empirical implications of overpricing hypothesis, classical Student’s t-test is a useful tool to operate verification of the theory. As a nonparametric method, the t-test is more general than structural equation modeling (see e.g., Heckman & Vytlacil, 2005) [17] and is the same method employed by Cheung (1969) to arrive at his “increasing intensity of labor” implication of his rent dissipation model14. Umbeck (1981) also employed a t-test to compare work requirements between mining camps, signaling different enforcement costs according to his theory of property rights15. Biliang (2017) uses the same method to depict “relation-based” land-transferring: desired monetary rent in this kind of transaction is significantly lower than those between strangers [18,19,20].
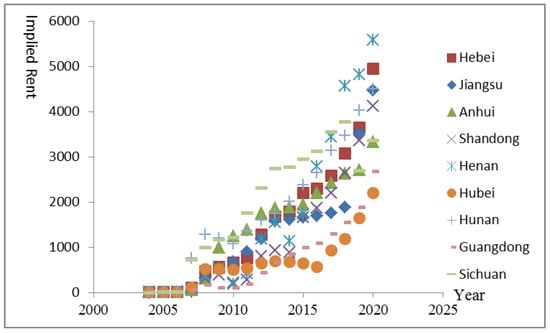
Figure 3.
The Increasing Rent Pattern: Premium Series of Subsidized Agricultural insurance in 9 Main Crop-producing Areas during 2004–2020. Data Source: China Insurance Yearbook, 2005–2021.
Tests for normality revealed initial concerns that were abated after employing the Mann–Whitney Test, which is similar to a t-test but does not assume that the original series must follow a normal distribution. Mann–Whitney’s z value shows the same pattern, thus confirming the results of t-test reported below (results of Mann–Whitney test are shown in Table A1 and Table A2). In interpreting the t-test results, we prioritize the economic significance over statistical significance when testing our refined rent dissipation model. This is consistent with Heckman who discussed this methodological approach intensively (e.g., see Heckman and Singer 2017), who drew inspiration from Friedman’s classic paper on consumption theory (1957) that does not report a p value throughout [21,22] but relies on a robust combination of economic theory, econometric models, and multi-source data.
4. Results
The trend that premiums increase with time in these 9 districts is pronounced. Note the different variation pattern behind premium series: Hebei, Jiangsu, and Anhui show a continuous increasing pattern, while premium series of other district fluctuate from time to time despite a clear increasing pattern after 2007. Take Hubei for instance. In 2010, the premium income from promoting agricultural insurance is $78.24 million, and then the premium series has a continuous descending process during 2011–2013. The year-on-year change ratios of premium are 3.1%, 3.2%, and 13.5% respectively. The premium series of Xizang province presents an alternative fluctuation pattern; in 2009, the premium income from promoting agricultural insurance is $1.26 million, which is 75.2% lower than its level in 2008. However, since 2009, it underwent an increasing trend, with slight decreases at 2012 and 2014. A paired sample t-test for homoscedasticity is reported in Table 2, which summarizes the results of the t-test in two tails among premium series from 2004 to 2020. The results support overpricing hypothesis rather strongly.16
Table 2.
t-test for Homoscedasticity in Two Tails for Premium Series, 2004 to 2020.
The aggregate magnitude not only does not contradict the theory offered in the last section but also surprisingly shows the adjustment of relevant parts (insurance companies, agents, or even governments). Take the premium series as an example. If one chooses 1% as the significance level, then the hypothesis can be rejected that any series in 2004–2006 and any series in 2007–2020 come from the same population with 99% confidence. That is, the governmental sponsorship that began in 2007 obviously activated strategic behavior. When lowering the significance level to 5% and trying to verify the implications of our theory, what can be obtained is just the opposite. No contradiction occurs, and the increasing rent pattern is shown more precisely. It is worth noting that as time goes by, the statistical significance of the “p” values increases gradually, but each of them are more than 5% during 2004–2006. Thus, the hypothesis that the difference between any series in 2004–2006 and any series in 2008–2020 is not significant with 99.9% confidence can be rejected, while the hypothesis that any two series in 2004–2006 are drawn from the same population with 95% confidence cannot be rejected. In addition, the hypothesis cannot be rejected that any two series in 2008–2020 come from two different populations, which is consistent with our theory, while also supporting our conjecture that insiders rushed into increasing casualty loss insurance and increased the availability of agricultural insurance.
We note the pattern behind the test results. In this case, a very interesting statistical phenomenon can be found. Using 5% as the cutoff significance level, we fail to reject the hypothesis that any twin of premium series in 2004–2006 come from the same population, while this hypothesis cannot be readily carried over the period after 2007. First, one can take 2007 as the beginning of this analysis. If combining any premium series in 2008–2019 with a series one-year-lead (that is, a premium series in 2007) and running the Student’s t-test for homoscedasticity in two-tails, we see the p values decrease in succession. The p value of the t-test between 2007 and 2008 is 0.03 and is significant only at the 5% level, which means that the null hypothesis is weakly rejected. However, when shifting the dividing year from 2007 to 2008 and matching the premium series in 2008 with any series in 2009–2020, there is an issue. Taking 5% as the significance level, we fail to reject the hypothesis that any two premium data series in 2008–2011 come from the same population and reject the hypothesis that the premium series in 2008 differ significantly from any premium series in 2012–2020. Likewise, we fail to reject the hypothesis that any two premium data series in 2009–2011 come from the same population and reject the hypothesis that the premium series in 2009 differ significantly from any premium series in 2012–2019. As one substitutes the following year for 2009 as the dividing point, the pattern still exists. Curiously, this pattern is also found in Table 3 based on the indemnity series. The increasing rent patterns are also similar—they follow others at every step. One can assert with confidence that rent-seeking behavior prevails after governmental sponsorship.
Table 3.
t-test for Homoscedasticity in Two Tails for Indemnity Series, 2004 to 2020.
5. Discussion
5.1. Significant Transactions Costs in Promoting Subsidized Agricultural Insurance
An anti-corruption report from Commission of Discipline Inspection (CDI) strongly supports the implications of the increasing rent hypothesis.17 According to this report, there are several typical cases to pursue subsidies in promoting agricultural insurance. First, to withdraw the funds from circulation that local government must pay to match with central government, both insurance company and local government have incentives to undermine the policy. Second, several institutions involved in organizing, monitoring, and implementation also have incentives to protect their interests. The stated mechanism in “Regulations on Agricultural Insurance” includes vague expressions such as “Directed by administration, sponsored by subsidies of three governmental levels, operated by insurance company with the help of administration branch, and extending to agricultural regime”. The chain is so long as to leave space for interference. Taking “township agricultural committee” as an example, several operational divisions and a few employees colluded with an insurance company and deliberated to increase both the insured area and disaster area in order to share illegitimate interests. The first intention can be fulfilled readily by exaggerating the sown area in reality, while the latter means an increase in the availability of extent of this public service, which confirms the overpricing hypothesis firmly. Besides the above tricks, insurance companies can also bribe administrators and large farmers privately. Recognizing the illegal “withdraw” of local government as the expression of public opinions, now administrators as agents of government are purely seeking their private interests.
As is shown in Section 2.2, agricultural insurance as a service can be valueless to farmers under the circumstances described, and large numbers of them will decline it. Despite this, the central government establishes the cover ratio of insurance indexed to the administrator’s appraisal. Facing both the official obligation and potential private interest (e.g., fraud), it is not surprising that some would illegally underwrite crops on the behalf of farmers who are unwilling to get involved.
5.2. Marginal Value of Public Funds to an In-House Landlord and Efficiency of Agricultural Insurance
The Marginal Value of Public Funds (“MVPF” hereafter) is a brand-new concept in policy evaluation, and has the advantage of being widely applicable [23]. If properly applied, it can make the comparison of any policies possible. The usage of “MVPF” relies heavily on the ratio of willingness to pay to the cost of the policy. Once the ratio is computed, the evaluation of policy can be based on a simple rule: if the MVPF > 1, then the policy is effective; if the MVPF = 1, then the policy is neutral; otherwise, the policy is inefficient. To rephrase, it can make farmers better by investing in land or other risk management tools. In the subsidized agricultural insurance setting, the estimation of MVPF refers to the following equation:
MVPF = RIA/SAL
Here, RIA indicates implied rent from subsidized agricultural insurance to an in-house agent or absent landlord, while SAL is government’s outlay. As noted, in China, the insurance premium is highly subsidized and the share paid by farmers is typically 25 percent of the total premium. An adjusted measure can be constructed to approximate SAL, the “cost”18 of agricultural insurance: 75 percent of total premium. In contrast, RIA are a hazard relief and can be approximated by a farmer’s (or in-house landlord’s) indemnities. Using Hendren and Sprung-Keyser’s MVPF model, a by-province marginal value of subsidized insurance can be made. Relevant results based on Equation (1) are computed, as tabulated in Table 4, plus efficiency estimates for the before and after 2007 periods.
Table 4.
MVPFs and Efficiency of Subsidized Agricultural Insurance.
Deducting one from the MVPF values in Table 3 results in the efficiency values reported for before and after 2007. According to the overpricing hypothesis, subsidized agricultural insurance fails in the sense of finance: too many funds are used to support an industry that cannot exist without subsidy. The “MVPF” method is brought in to highlight this point from a different view. That is, the generally poor performance both before and after subsidization (most of MVPFs are significantly less than 1). In the language of the Pigouvian tradition, agricultural insurance in China performs poorly. Before the central government subsidized agricultural insurance, this service was operated by private firms and functioned relatively well in four provinces. Afterwards, inefficient performance dominated in all 31 provinces. The implication is straightforward: unless a going rate is established, subsidized agricultural insurance is not preferable to other risk management tools in agricultural land use. The findings under the MVPF framework are also consistent with the overpricing hypothesis derived from a transaction costs approach.
Our findings suggest that institutional reform is needed to achieve Pareto improvement. This is consistent with Ye Tao et. al. (2020), who proposed farm-level yield insurance to address heterogeneous risk among farmers and provide more stable income flow [24]. These findings are in line with overpricing hypothesis, but the social cost involved in the farm-level yield insurance is higher. Moreover, the costs of reliably estimating an individual farmer’s historical yields generates significant costs to the program. It can also add significant costs to changing use or transfer of the land with the insurance company needing to re-evaluate the farm’s value. Similarly, Liu et al. (2019) challenge weather index insurance as an efficient tool in managing China’s grain production risk and cast doubt on farm-level yield insurance [25]. Here, we do not mean to undervalue research in index-based insurance products, but rather question its practical impacts given concerns about rent-seeking motivations. Indeed, we value Jing et al.’s (2020) work using a natural experiment, and highlight the importance of assessing the impacts of the subsidy and deriving insights about the role of market-oriented mechanisms. Indeed, we urge the consideration of both informal (e.g., risk bearing) and formal (e.g., insurance) mechanisms in policy design to avoid unfavorable outcomes such as the failure of crop insurance documented in Hazell (1992). In that case, the Mexican crop insurance program ANAGSA had an average loss ratio of 3.18 over 1980–1989, consistent with the overpricing hypothesis [26,27]. Note that the implications of the theory not only include a predicted surge in the loss ratio, but also a margin of cover ratio. Though the average loss ratio during 2013–2018 is only 0.69 in China19, increases in premiums support our theory. The discussion in Section 5.2 further supports it using the state-of-the-art MVPF analysis.
We briefly revisit the issue of empirically testing rent dissipation models. While our use of non-parametric econometrics is consistent with the classic papers of Cheung (1969) and Umbeck (1981), it contrasts with Fudenberg and Tirole (1987)’s treatment on this issue using game theory [28]. While we are satisfied that our non-parametric approach is well-supported by the literature, we are careful to note that a direct comparison of parametric and non-parametric methods for this context as a question for future research. Another limitation is the logical possibility that the increasing rent pattern can be produced by a prevailing incentive compatibility (IC)–individual rationality (IR) theoretical deduction [29], which was not directly accounted for in our study. This, too, is an interesting line of future inquiry that we hope to see unfold when the authors can provide solid empirical tests in the future as to this prevailing IC–IR analysis.
Further, even if an insurance company has strong incentives to offer an insurance product, the potential improvement of social welfare will still ultimately rely on the farmer’s decisions to adopt it or not, and thus on their preference weighting of costs and benefits. We argue that formal insurance in China should account for informal risk bearing that prevails in rural China. In this way we believe that the program would reduce social welfare losses and do so by better aligning incentives on the demand side rather than supply side, which is currently exacerbated by governmental intervention—an outcome (market inefficiencies made worse by policy) sometimes referred to as “government failure”.
Potential improvement lies in the informal risk-bearing arrangements in land use. Although some scholars mentioned that the performance of agricultural insurance can be improved through institutional change, to date they have not studied what options are available to Chinese farmers and how to reconcile them. In line with the theory presented in Section 2.2, the inclusion of potential substitution effects of informal risk-bearing arrangements in land use reinforces this theory. If our overpricing hypothesis is secondary to an alternative hypothesis (supply augmentation or higher income), then the cost of informal risk bearing arrangements in rural China should remain relatively constant. Notably, the agricultural tax was abolished in 2004. As Stiglitz (1974) demonstrated, the contract between farmers and the central government had long been seen as a major risk-bearing arrangement [30]. Thus, tax abolishment effectively means reducing the cost of this formal arrangement to zero and an increase in real income for farmers.
Given the significant improvement of farmers’ economic status, the validity of supply-induced increases in premiums will depend heavily on the magnitude of the substitute effect of rival goods to crop insurance. When the cost of alternative risk management in land use falls significantly, the effect of supply augmentation of agricultural insurance should be dominated. Likewise, another alternative hypothesis can be verified: when the scale of farming increases and assuming a constant premium rate, total premiums will trend upwards. Considering the significant transactions costs involved in settlements of claim (fc(·) in Figure 2), the theory would suggest that their demand for crop insurance will rely much more on the substitute effect of alternative contracts to crop insurance. Apparently, giving the significant decline of rival goods, demand for crop insurance can shrink even if the government extends the main insurance products to other crops. Unless these informal risk-bearing practices are effectively bundled with formal insurance, farmers will prefer self-insurance (or self-protection) over crop insurance. Moreover, a large problem with these farms is moral hazard—perhaps a much large problem rather than natural risk according to Allen and Lueck (1998)’s rigorous inquiry [31]. Supply factors apparently contribute little to increasing rent. Moreover, farm size plays an important role, with large farms facing much more uncertainty but a much higher expected income than small farms. Or framed another way, as a farm policy issue, property issues may have become far more urgent than production uncertainty. Other major insurance reform issues include expanding coverage (e.g., to include transportation), which Americans are now experimenting with; improvement in the estimation of a ‘going rate’ for agricultural insurance premiums; and designing insurance programs that primarily consider farmer needs and can offer different premiums according to their relative status.
6. Conclusions
To reconcile the inconsistency between policy goals for subsidized agricultural insurance and its deficiency in practice, we measured risk induced by ambiguous property rights in the economic resource and derived the overpricing hypothesis: if a resource or service behaves as if its value is unlimited owing to certain factors, then the provider (or in the context of agricultural insurance, the agent of the government) will have an incentive to increase the frequency of the service by exaggerating the production scale (sown area, material cost) or by exaggerating the number of production units involved (farmers or cooperatives), or to increase the availability of the service by exaggerating production losses. Theoretically, this overpricing behavior can be recognized as symmetrical to rent dissipation of the price signal in rural China’s land use, thus it may inform land use and risk management issues in developing countries.
Methodologically, this research demonstrates the economic significance of marginal transaction costs fc(·) in determining efficiency of resource use. The confirmation of the theory also constitutes a demonstration of the importance of transactions costs in policy design. We recommend that the improvement of formal risk management tools in rural China depends on identifying the informal risk-bearing arrangements prevailing in rural China and explicitly accounting for them in formal policies. For example, subsidized agricultural insurance can achieve efficiency if we search for potential risk-bearing arrangements in the real world and link these to a formal risk management tool in land use. There exists adequate data related to the farmer’s demand side, which indicates the policy evaluation are good approximations of the competitive market insuring all kinds of risk—natural events and issues related to human behaviors. In addition, the government can subsidize farming skill improvement and increase farmer’s human capital, thus reducing transaction costs in land use.
We note potential lines of further research based on these findings. First, due to the unavailability of first-hand policy data directly from farmers, we tested the over-pricing hypothesis with non-parametric rather than parametric specification and estimation. To deepen our understanding about property rights and the role of agricultural insurance, further work towards parametric estimation and testing of our rent dissipation model is preferred and a source of future work. Second, we conjecture about how to use informal risk-bearing arrangements to complement subsidized agricultural insurance. The complementary role of these arrangements and their impact on the effectiveness agricultural insurance in the context of property rights merits further study. Given the importance of agricultural policy and its broad importance for environmental sustainability and economic wellbeing for a large proportion of the population, more inquiries, both theoretical and empirically-driven, are needed.
Author Contributions
Conceptualization, D.C.A.; methodology, C.H.; software, C.H.; validation, H.F.; formal analysis, C.H.; investigation, C.H.; resources, J.C.; data curation, C.H.; writing—original draft preparation, C.H.; writing—review and editing, D.C.A.; visualization, C.H.; supervision, C.H.; project administration, C.H.; funding acquisition, C.H. All authors have read and agreed to the published version of the manuscript.
Funding
This research is funded by regular operational funds from School of Economics and Finance of Guizhou University of Commerce, and Youth Project of China Social Science Foundation (Grant Number: 20CSH037).
Institutional Review Board Statement
Not applicable.
Informed Consent Statement
Not applicable.
Data Availability Statement
All data can be found in “China Insurance Yearbook 2005–2020” and are available on request.
Acknowledgments
We own debts to Tamara Krawchenko and Azka Rehman for helpful suggestions.
Conflicts of Interest
The authors declare no conflict of interest.
Appendix A
Table A1.
The Increasing Rent Pattern: Mann–Whitney Test Basing on Premium Series.
Table A1.
The Increasing Rent Pattern: Mann–Whitney Test Basing on Premium Series.
| 2004 | 2005 | 2006 | 2007 | 2008 | 2009 | 2010 | 2011 | 2012 | 2013 | 2014 | 2015 | 2016 | 2017 | 2018 | 2019 | 2020 | |
|---|---|---|---|---|---|---|---|---|---|---|---|---|---|---|---|---|---|
| 2004 | −1.106 (0.2687) | −2.121 (0.0339) | −5.71 (0.0000) | −6.414 (0.0000) | −6.358 (0.0000) | −6.316 (0.0000) | −6.555 (0.0000) | −6.654 (0.0000) | −6.682 (0.0000) | −6.71 (0.0000) | −6.724 (0.0000) | −6.752 (0.0000) | −6.767 (0.0000) | −6.767 (0.0000) | −6.767 (0.0000) | −6.767 (0.0000) | |
| 2005 | −0.88 (0.3788) | −5.019 (0.0000) | −5.962 (0.0000) | −6.019 (0.0000) | −5.934 (0.0000) | −6.286 (0.0000) | −6.483 (0.0000) | −6.596 (0.0000) | −6.665 (0.0000) | −6.695 (0.0000) | −6.737 (0.0000) | −6.765 (0.0000) | −6.765 (0.0000) | −6.765 (0.0000) | −6.765 (0.0000) | ||
| 2006 | −4.47 (0.0000) | −5.695 (0.0000) | −5.751 (0.0000) | −5.639 (0.0000) | −6.16 (0.0000) | −6.315 (0.0000) | −6.455 (0.0000) | −6.455 (0.0000) | −6.54 (0.0000) | −6.554 (0.0000) | −6.61 (0.0000) | −6.667 (0.0000) | −6.709 (0.0000) | −6.723 (0.0000) | |||
| 2007 | −2.781 (0.0054) | −2.978 (0.0029) | −2.724 (0.0064) | −4.16 (0.0000) | −4.92 (0.0000) | −5.357 (0.0000) | −5.484 (0.0000) | −5.751 (0.0000) | −5.765 (0.0000) | −6.047 (0.0000) | −6.286 (0.0000) | −6.455 (0.0000) | −6.525 (0.0000) | ||||
| 2008 | −0.697 (0.4859) | −0.345 (0.7302) | −1.908 (0.0564) | −3.076 (0.0021) | −3.963 (0.0001) | −4.202 (0.0000) | −4.695 (0.0000) | −4.878 (0.0000) | −5.244 (0.0000) | −5.681 (0.0000) | −5.934 (0.0000) | −6.103 (0.0000) | |||||
| 2009 | 0.063 (0.9495) | −1.274 (0.2026) | −2.358 (0.0184) | −3.259 (0.0011) | −3.513 (0.0004) | −4.118 (0.0000) | −4.385 (0.0000) | −4.695 (0.0000) | −5.329 (0.0000) | −5.751 (0.0000) | −5.962 (0.0000) | ||||||
| 2010 | −1.499 (0.1338) | −2.597 (0.0094) | −3.33 (0.0009) | −3.569 (0.0004) | −4.019 (0.0001) | −4.315 (0.0000) | −4.709 (0.0000) | −5.174 (0.0000) | −5.624 (0.0000) | −5.878 (0.0000) | |||||||
| 2011 | −1.246 (0.2128) | −2.316 (0.0206) | −2.696 (0.0070) | −3.287 (0.0010) | −3.583 (0.0003) | −4.005 (0.0001) | −4.723 (0.0000) | −5.23 (0.0000) | −5.61 (0.0000) | ||||||||
| 2012 | −1.007 (0.3141) | −1.443 (0.1490) | −2.02 (0.0434) | −2.302 (0.0213) | −3.02 (0.0025) | −3.879 (0.0001) | −4.442 (0.0000) | −4.92 (0.0000) | |||||||||
| 2013 | −0.443 (0.6574) | −1.161 (0.2454) | −1.485 (0.1375) | −2.161 (0.0307) | −3.161 (0.0016) | −3.696 (0.0002) | −4.371 (0.0000) | ||||||||||
| 2014 | −0.669 (0.5037) | −1.049 (0.2942) | −1.908 (0.0564) | −3.006 (0.0026) | −3.569 (0.0004) | −3.569 (0.0004) | |||||||||||
| 2015 | −0.472 (0.6372) | −1.288 (0.1977) | −2.217 (0.0266) | −2.978 (0.0029) | −3.752 (0.0002) | ||||||||||||
| 2016 | −0.95 (0.3420) | −1.823 (0.0683) | −2.583 (0.0098) | −3.428 (0.0006) | |||||||||||||
| 2017 | −1.133 (0.2571) | −1.894 (0.0583) | −2.724 (0.0064) | ||||||||||||||
| 2018 | −0.88 (0.3789) | −1.781 (0.0749) | |||||||||||||||
| 2019 | −1.056 (0.291) | ||||||||||||||||
| 2020 |
Notes: The figures in paratheses show the z value in given Mann–Whitney Test.
Table A2.
The Increasing Rent Pattern behind: Mann–Whitney Test Basing on Indemnity Series.
Table A2.
The Increasing Rent Pattern behind: Mann–Whitney Test Basing on Indemnity Series.
| 2004 | 2005 | 2006 | 2007 | 2008 | 2009 | 2010 | 2011 | 2012 | 2013 | 2014 | 2015 | 2016 | 2017 | 2018 | 2019 | 2020 | |
|---|---|---|---|---|---|---|---|---|---|---|---|---|---|---|---|---|---|
| 2004 | −0.627 (0.5304) | −0.845 (0.3980) | −3.837 (0.0001) | −5.76 (0.0000) | −6.471 (0.0000) | −6.245 (0.0000) | −6.429 (0.0000) | −6.569 (0.0000) | −6.654 (0.0000) | −6.682 (0.0000) | −6.724 (0.0000) | −6.767 (0.0000) | −6.767 (0.0000) | −6.767 (0.0000) | −6.767 (0.0000) | −6.767 (0.0000) | |
| 2005 | −0.042 (0.9663) | −3.274 (0.0011) | −5.245 (0.0000) | −6.104 (0.0000) | −5.953 (0.0000) | −6.104 (0.0000) | −6.315 (0.0000) | −6.47 (0.0000) | −6.568 (0.0000) | −6.625 (0.0000) | −6.737 (0.0000) | −6.766 (0.0000) | −6.766 (0.0000) | −6.766 (0.0000) | −6.766 (0.0000) | ||
| 2006 | −3.154 (0.0016) | −5.209 (0.0000) | −6.131 (0.0000) | −5.906 (0.0000) | −6.061 (0.0000) | −6.371 (0.0000) | −6.511 (0.0000) | −6.582 (0.0000) | −6.638 (0.0000) | −6.737 (0.0000) | −6.765 (0.0000) | −6.765 (0.0000) | −6.765 (0.0000) | −6.765 (0.0000) | |||
| 2007 | −3.147 (0.0017) | −4.414 (0.0000) | −4.019 (0.0001) | −4.132 (0.0000) | −4.92 (0.0000) | −5.244 (0.0000) | −5.441 (0.0000) | −5.709 (0.0000) | −5.934 (0.0000) | −6.005 (0.0000) | −6.342 (0.0000) | −6.582 (0.0000) | −6.596 (0.0000) | ||||
| 2008 | −1.64 (0.1010) | −1.485 (0.1375) | −1.288 (0.1977) | −2.851 (0.0044) | −3.794 (0.0001) | −4.202 (0.0000) | −4.752 (0.0000) | −5.371 (0.0000) | −5.554 (0.0000) | −5.864 (0.0000) | −6.23 (0.0000) | −6.385 (0.0000) | |||||
| 2009 | 0.162 (0.8714) | 0.556 (0.5781) | −1.457 (0.1451) | −2.316 (0.0206) | −2.949 (0.0032) | −3.597 (0.0003) | −4.301 (0.0000) | −4.512 (0.0000) | −5.258 (0.0000) | −5.892 (0.0000) | −6.089 (0.0000) | ||||||
| 2010 | 0.331 (0.7408) | −1.528 (0.1266) | −2.527 (0.0115) | −3.048 (0.0023) | −3.639 (0.0003) | −4.371 (0.0000) | −4.709 (0.0000) | −5.357 (0.0000) | −5.864 (0.0000) | −6.061 (0.0000) | |||||||
| 2011 | −1.908 (0.0564) | −2.837 (0.0046) | −3.386 (0.0007) | −3.963 (0.0001) | −4.695 (0.0000) | −5.089 (0.0000) | −5.582 (0.0000) | −6.089 (0.0000) | −6.244 (0.0000) | ||||||||
| 2012 | −1.035 (0.3008) | −1.612 (0.1070) | −2.386 (0.0170) | −3.203 (0.0014) | −3.484 (0.0005) | −4.442 (0.0000) | −5.371 (0.0000) | −5.61 (0.0000) | |||||||||
| 2013 | −0.598 (0.5496) | −1.33 (0.1834) | −2.189 (0.0286) | −2.612 (0.0090) | −3.583 (0.0003) | −4.498 (0.0000) | −4.752 (0.0000) | ||||||||||
| 2014 | −0.739 (0.4598) | −1.682 (0.0925) | −1.992 (0.0464) | −3.259 (0.0011) | −4.315 (0.0000) | −4.695 (0.0000) | |||||||||||
| 2015 | −0.964 (0.3349) | −1.387 (0.1655) | −2.654 (0.0080) | −3.794 (0.0001) | −4.146 (0.0000) | ||||||||||||
| 2016 | −0.401 (0.6882) | −1.851 (0.0641) | −3.048 (0.0023) | −3.484 (0.0005) | |||||||||||||
| 2017 | −1.499 (0.1338) | −2.668 (0.0076) | −3.104 (0.0019) | ||||||||||||||
| 2018 | −1.598 (0.1101) | −2.133 (0.0329) | |||||||||||||||
| 2019 | −0.655 (0.5127) | ||||||||||||||||
| 2020 |
Notes: The figures in paratheses show the z value in given Mann–Whitney Test.
Notes
| 1 | Cheung broke down property right constraint involved in resource use into three specific rights: the right to income, the exclusive use right, and transferring right alien from compelling. |
| 2 | In the terms of contract theory, over-investment just mirrors rent dissipation that is related to specified property right constraint. |
| 3 | Here the “rent” in agricultural insurance means both cost to lease and economic gains. In the sense of economic gain from governmental subsidy, it is clearly grabbed mostly by insurance companies and in-house agents. Meanwhile, if we focus on the beneficial, it is not difficult to figure out that insurance companies cannot receive subsidies unless farmers underwrite their tilled plots. The rent implied in agricultural insurance can also be recognized as cost to lease “proxy” for governmental service. We will clarify this point is Section 2.2. |
| 4 | Actually, Cheung (2019) expresses a comparative idea, but he does not base his argument on agricultural insurance’s ground [32]. |
| 5 | That is, data about premium and indemnities of agricultural insurance during 2003–2020. |
| 6 | See Wen (2017) [33]. |
| 7 | China’s agricultural policy design has transformed from subsidizing to a more market-oriented institution. As a public service, subsidized agricultural insurance demonstrates public good in many ways. By reformulating a rent dissipation model and applying it to the somewhat unclear “Agreement on Agriculture” (AOA), this paper tries to extract a theory to explain the considerate controversy noted above. The government has supported the fishery industry by establishing an insurance system as a risk management approach. China Fishery Mutual Insurance Association (CFMI), founded in 1994, initiated a mutual insurance program in 2012 and designed mutual and commercial models (FAO, 2017) [34]. But taking as whole, the scheme is rough and needs more empirical-oriented improvement, owing to its ignorance about risk induced by ambiguous property right rather than natural events. As to background information describing the fraud cases, please refer to Wen (2017). |
| 8 | As to farmers living in coastal Bangladesh, crop insurance is found to be the least important adaption strategy [35]. The investigation is supportive of the argument laid out in the text. |
| 9 | Here, a rent increasing behavior is modeled by considering not only rent dissipation, but also intra-marginal agents’ incentive to minimize rent dissipation. Cheung (1970) demonstrates that a limited number of laborers is not enough to deplete the total rent if an economic resource is nonexclusive. But how to explain the failure of agricultural insurance program (or equally, poor demand) that is totally funded by private sector? In the line of Cheung, it is safe to infer that limited number of laborers is enough to deplete the total rent of this business. See Section 3 “Harvesting: The Dissipation of Rent”, especially page 62. |
| 10 | Cost here indicates opportunity cost that can be used to decide in-house agent’s decision to quit or squeeze in such business as subsidized agricultural insurance. |
| 11 | This is also called “business stealing effect” resulting from free entry [36]. |
| 12 | The definition of transaction costs is complicated and empirical-oriented, Cheung (2019) recognizes it as an expense that does not exist in a so-called Robinson Crusoe economy. What refer to when using term “transaction-costs as cost” is that insiders can choose between different agency contracts to minimize rent dissipation. |
| 13 | Note that ambiguous property right concerns subsidies that are totally funded by tax paid by non-farmers. Unlike our rent dissipation model of tilling plot’s price signal, here information costs in subsidized agricultural insurance function as excluding absent landlord, thus creating advantageous opportunity for in-house agent to squeeze in.It’s easy to understand this point according to Figure 2. Now the horizontal line measures “proxy” for agricultural insurance. Clearly the “proxy” is constructed to discern a flexible concept of economic rent from simple governmental subsidies. Without this difference absent landlord will soon learn that their plots are illegally under-written. But what are observed refute this possibility. Now given significant transaction costs, implied rent from agricultural insurance business will show a rent-increasing pattern that is rather comparable to rent maximization analysis under private property right. |
| 14 | See Cheung (1969), especially Footnote 46 in page 154 of Section D “Crops Unaffected by the Share Restriction: Horticulture” in Chapter 8 “Patterns of Crop Choice, Hectare Yields and Marginal Productivities Implied by Increasing Farming Intensity”. |
| 15 | See Umbeck (1981), especially page 124 of Section “Work Requirement and Threat of Violence” in Chapter 9 “Violence and Restriction of Property Rights”. |
| 16 | There may be alternative hypotheses that can explain the increasing rent pattern behind our theory. Here, two other forces are considered: increasing income hypothesis and augmented supply story. The income-induced rent increasing is verified. It is well known that the cost of informal risk bearing arrangements has been reducing significantly since 2006. According to substitute effect in classical demand theory, farmer’s demand for crop insurance will decrease. And this deduction will still make sense even without considering huge transaction costs in settlements of claim. Now turn to augmented insurance products hypothesis from supply side. It is not difficult to figure out that this explanation is futile and lack empirical content owing to its total ignorance of in-house landlord’s demand. When trying to derive some verifiable implication by considering farmer’s choice, what can be obtained is objection to augmented supply story: clearly, significant substitute effect of informal risk bearing will overthrow this possibility, even if it can receive subsidies continuously. |
| 17 | This report is not available in any published form. The source come from official online website of Chinese government. See: http://fanfu.people.com.cn/BIG5/n/2015/1202/c64371-27881857.html (accessed on 2 December 2015) |
| 18 | The cost is precisely the outlay of government, showing the direct financial burden of subsidized agricultural insurance. The transaction costs behind overpricing (increasing rent pattern) are clearly not included. |
| 19 | This information is extracted from Tao Ye & Qingyan Mu (2020) [37]. |
References
- Walker, J.M.; Gardner, R.; Ostrom, E. Rent Dissipation in a Limited-access Common-pool Resource: Experimental Evidence. J. Environ. Econ. Manag. 1990, 19, 203–211. [Google Scholar] [CrossRef]
- Homans, F.R.; Wilen, J.E. Markets and Rent Dissipation in Regulated Open Access Fisheries. J. Environ. Econ. Manag. 2005, 49, 381–404. [Google Scholar] [CrossRef]
- Gordon, H.S. The Economics Theory of Common-property Resource: The Fishery. J. Pol. Econ. 1954, 62, 124–142. [Google Scholar] [CrossRef]
- Asche, F.; Garlock, T.M.; Anderson, J.L.; Bush, S.R.; Smith, M.D.; Anderson, C.M.; Chu, J.; Garrett, K.A.; Lem, A.; Lorenzen, K.; et al. Three Pillars of Sustainability in Fisheries. Proc. Natl. Acad. Sci. USA 2018, 115, 11221–11225. [Google Scholar] [CrossRef]
- Cheung, S. Structure of a Contract and the Theory of Non-exclusive Resource. J. L. Econ. 1970, 13, 49–70. [Google Scholar] [CrossRef]
- Hu, C.; Tao, J.; Zhang, D.; Adams, D. Price Signal of Tilled Land in Rural China: An Empirically Oriented Transaction Costs Study Based on Contract Theory. Land 2021, 10, 837. [Google Scholar] [CrossRef]
- Williams, H. Intellectual Property Rights and Innovation: Evidence from the Human Genome. J. Pol. Econ. 2013, 121, 1–27. [Google Scholar] [CrossRef] [PubMed]
- Sampat, B.; Williams, H. How do patents Affect Follow-on Innovation? Evidence from the Human Genome. Amer. Econ. Rev. 2019, 109, 203–236. [Google Scholar] [CrossRef] [PubMed]
- Halcrow, G. Actuarial Structures for Crop Insurance. J. Farm Econ. 1949, 31, 418–443. [Google Scholar] [CrossRef]
- Halcrow, G. A Theory of Crop Insurance. Ph.D. Thesis, University of Chicago, Chicago, IL, USA, 1948. [Google Scholar]
- Pigou, A. Economics of Welfare; Macmillan &, Co.: London, UK, 1928. [Google Scholar]
- Miranda, M. Area-yield Insurance Reconsidered. Amer. J. Agri. Econ. 1991, 73, 233–242. [Google Scholar] [CrossRef]
- Mobarak, M.; Rosenzweig, R. Informal Risk Bearing, Index Insurance and Risk Taking in Developing Countries. Am. Econ. Rev. 2012, 103, 375–380. [Google Scholar] [CrossRef]
- Cole, S.; Daniel, S.; Jeremy, T. Dynamics of Demand for Index Insurance: Evidence from a Long Run Field Experiment. Amer. Econ. Rev. 2014, 104, 284–290. [Google Scholar] [CrossRef]
- Rothchild, M.; Stiglitz, J. Equilibrium in Competitive Insurance Market: An Essay on the Economics of Imperfect Information. Q. J. Econ. 1976, 90, 629–649. [Google Scholar] [CrossRef]
- Baker, K.; Bull, G.; Baylis, K.; Barichello, R. Toward a Theoretical Construct for Modelling Smallholders’ Forestland-Use Decisions: What Can We Learn from Agriculture and Forest Economics? Forests 2017, 8, 345. [Google Scholar] [CrossRef]
- Heckman, J.; Vytlacil, E. Structural Equations, Treatment Effects and Econometric Policy Evaluation. Econometrica 2005, 73, 669–738. [Google Scholar] [CrossRef]
- Cheung, S. The Theory of Share Tenancy; University of Chicago Press: Chicago, IL, USA, 1969. [Google Scholar]
- Umbeck, J. A Theory of Property Rights with Application to the California Gold Rush; Iowa State University Press: Ames, IA, USA, 1981. [Google Scholar]
- Luo, B. Rethinking and Extension of the Coase Theorem: Reform and Choice of Land Circulation Institutions in Rural China. Econ. Res. J. 2017, 67, 178–193. (In Chinese) [Google Scholar]
- Heckman, J.; Singer, B. Abducting Economics. Am. Econ. Rev. 2017, 107, 298–302. [Google Scholar] [CrossRef]
- Friedman, M. A Theory of Consumption Function; Princeton University Press: Princeton, NJ, USA, 1957. [Google Scholar]
- Hendren, N.; Sprung-Keyser, B. A Unified Welfare Analysis of Government Policies. Q. J. Econ. 2020, 135, 1209–1318. [Google Scholar] [CrossRef]
- Ye, T.; Hu, W.; Barnett, B.; Wang, J.; Gao, Y. Area Yield Index Insurance or Farm Yield Crop Insurance? Chinese Perspectives on Farmers’ Welfare and Government Subsidy Effectiveness. J. Agric. Econ. 2020, 71, 144–164. [Google Scholar] [CrossRef]
- Liu, Y.; Zhong, F.; Yu, K. Is Weather Index Insurance a Suitable Risk Management Tool? Chin. Rural. Econ. 2019, 36, 1–20. (In Chinese) [Google Scholar]
- Cai, J.; Janvry, A.; Sadoulet, E. Subsidy Policies and Insurance Demand. Amer. Econ. Rev. 2020, 110, 2422–2453. [Google Scholar] [CrossRef]
- Hazell, P. The Appropriate Role of Agricultural Insurance in Developing Countries. J. Int. Dev. 1992, 4, 567–581. [Google Scholar] [CrossRef]
- Fudenberg, D.; Tirole, J. Understanding Rent Dissipation: On the Use of Game Theory in Industrial Organization. Am. Econ. Rev. 1987, 77, 176–183. [Google Scholar] [CrossRef]
- Farboodi, M.; Jarosch, G.; Menzio, G. Intermediation as Rent Extraction; NBER Working Paper; National Bureau of Economic Research: Cambridge, MA, USA, 2017. [Google Scholar] [CrossRef]
- Stiglitz, J. Incentives and Risk Sharing in Sharecropping. Rev. Econ. Stud. 1974, 41, 219–255. [Google Scholar] [CrossRef]
- Allen, D.; Lueck, D. The Nature of the Farm. J. Law Econ. 1998, 41, 343–386. [Google Scholar] [CrossRef]
- Cheung, S. Economic Explanation, 5th ed.; Citic Press: Beijing, China, 2019. [Google Scholar]
- Wen, T. To Defraud the Agricultural Insurance Subsidies to Obtain Funds in Case Evaluation. Master’s Thesis, Hunan University, Changsha, China, 2017. (In Chinese). [Google Scholar]
- FAO. Fishery and Aquaculture Insurance in China. FAO Fisheries and Aquaculture Circular No.1139; FAO: Rome, Italy, 2017. [Google Scholar]
- Uddin, M.N.; Bokelmann, W.; Entsminger, J.S. Factors Affecting Farmers’ Adaptation Strategies to Environmental Degradation and Climate Change Effects: A Farm Level Study in Bangladesh. Climate 2014, 2, 223–241. [Google Scholar] [CrossRef]
- Mankiw, G.; Whinston, M. Free Entry and Social Inefficiency. Rand J. Econ. 1986, 17, 48–58. [Google Scholar] [CrossRef]
- Ye, T.; Mu, Q. Fostering Rural Resilience: A Closer Look at China’s Agricultural Insurance Project; GFDRR: Washington, DC, USA; World Bank Group: Washington, DC, USA, 2020. [Google Scholar]
Disclaimer/Publisher’s Note: The statements, opinions and data contained in all publications are solely those of the individual author(s) and contributor(s) and not of MDPI and/or the editor(s). MDPI and/or the editor(s) disclaim responsibility for any injury to people or property resulting from any ideas, methods, instructions or products referred to in the content. |
© 2023 by the authors. Licensee MDPI, Basel, Switzerland. This article is an open access article distributed under the terms and conditions of the Creative Commons Attribution (CC BY) license (https://creativecommons.org/licenses/by/4.0/).