


Landslide Susceptibility Assessment in Nepal’s Chure Region: A Geospatial Analysis

 , ,
, , 
Abstract
:1. Introduction
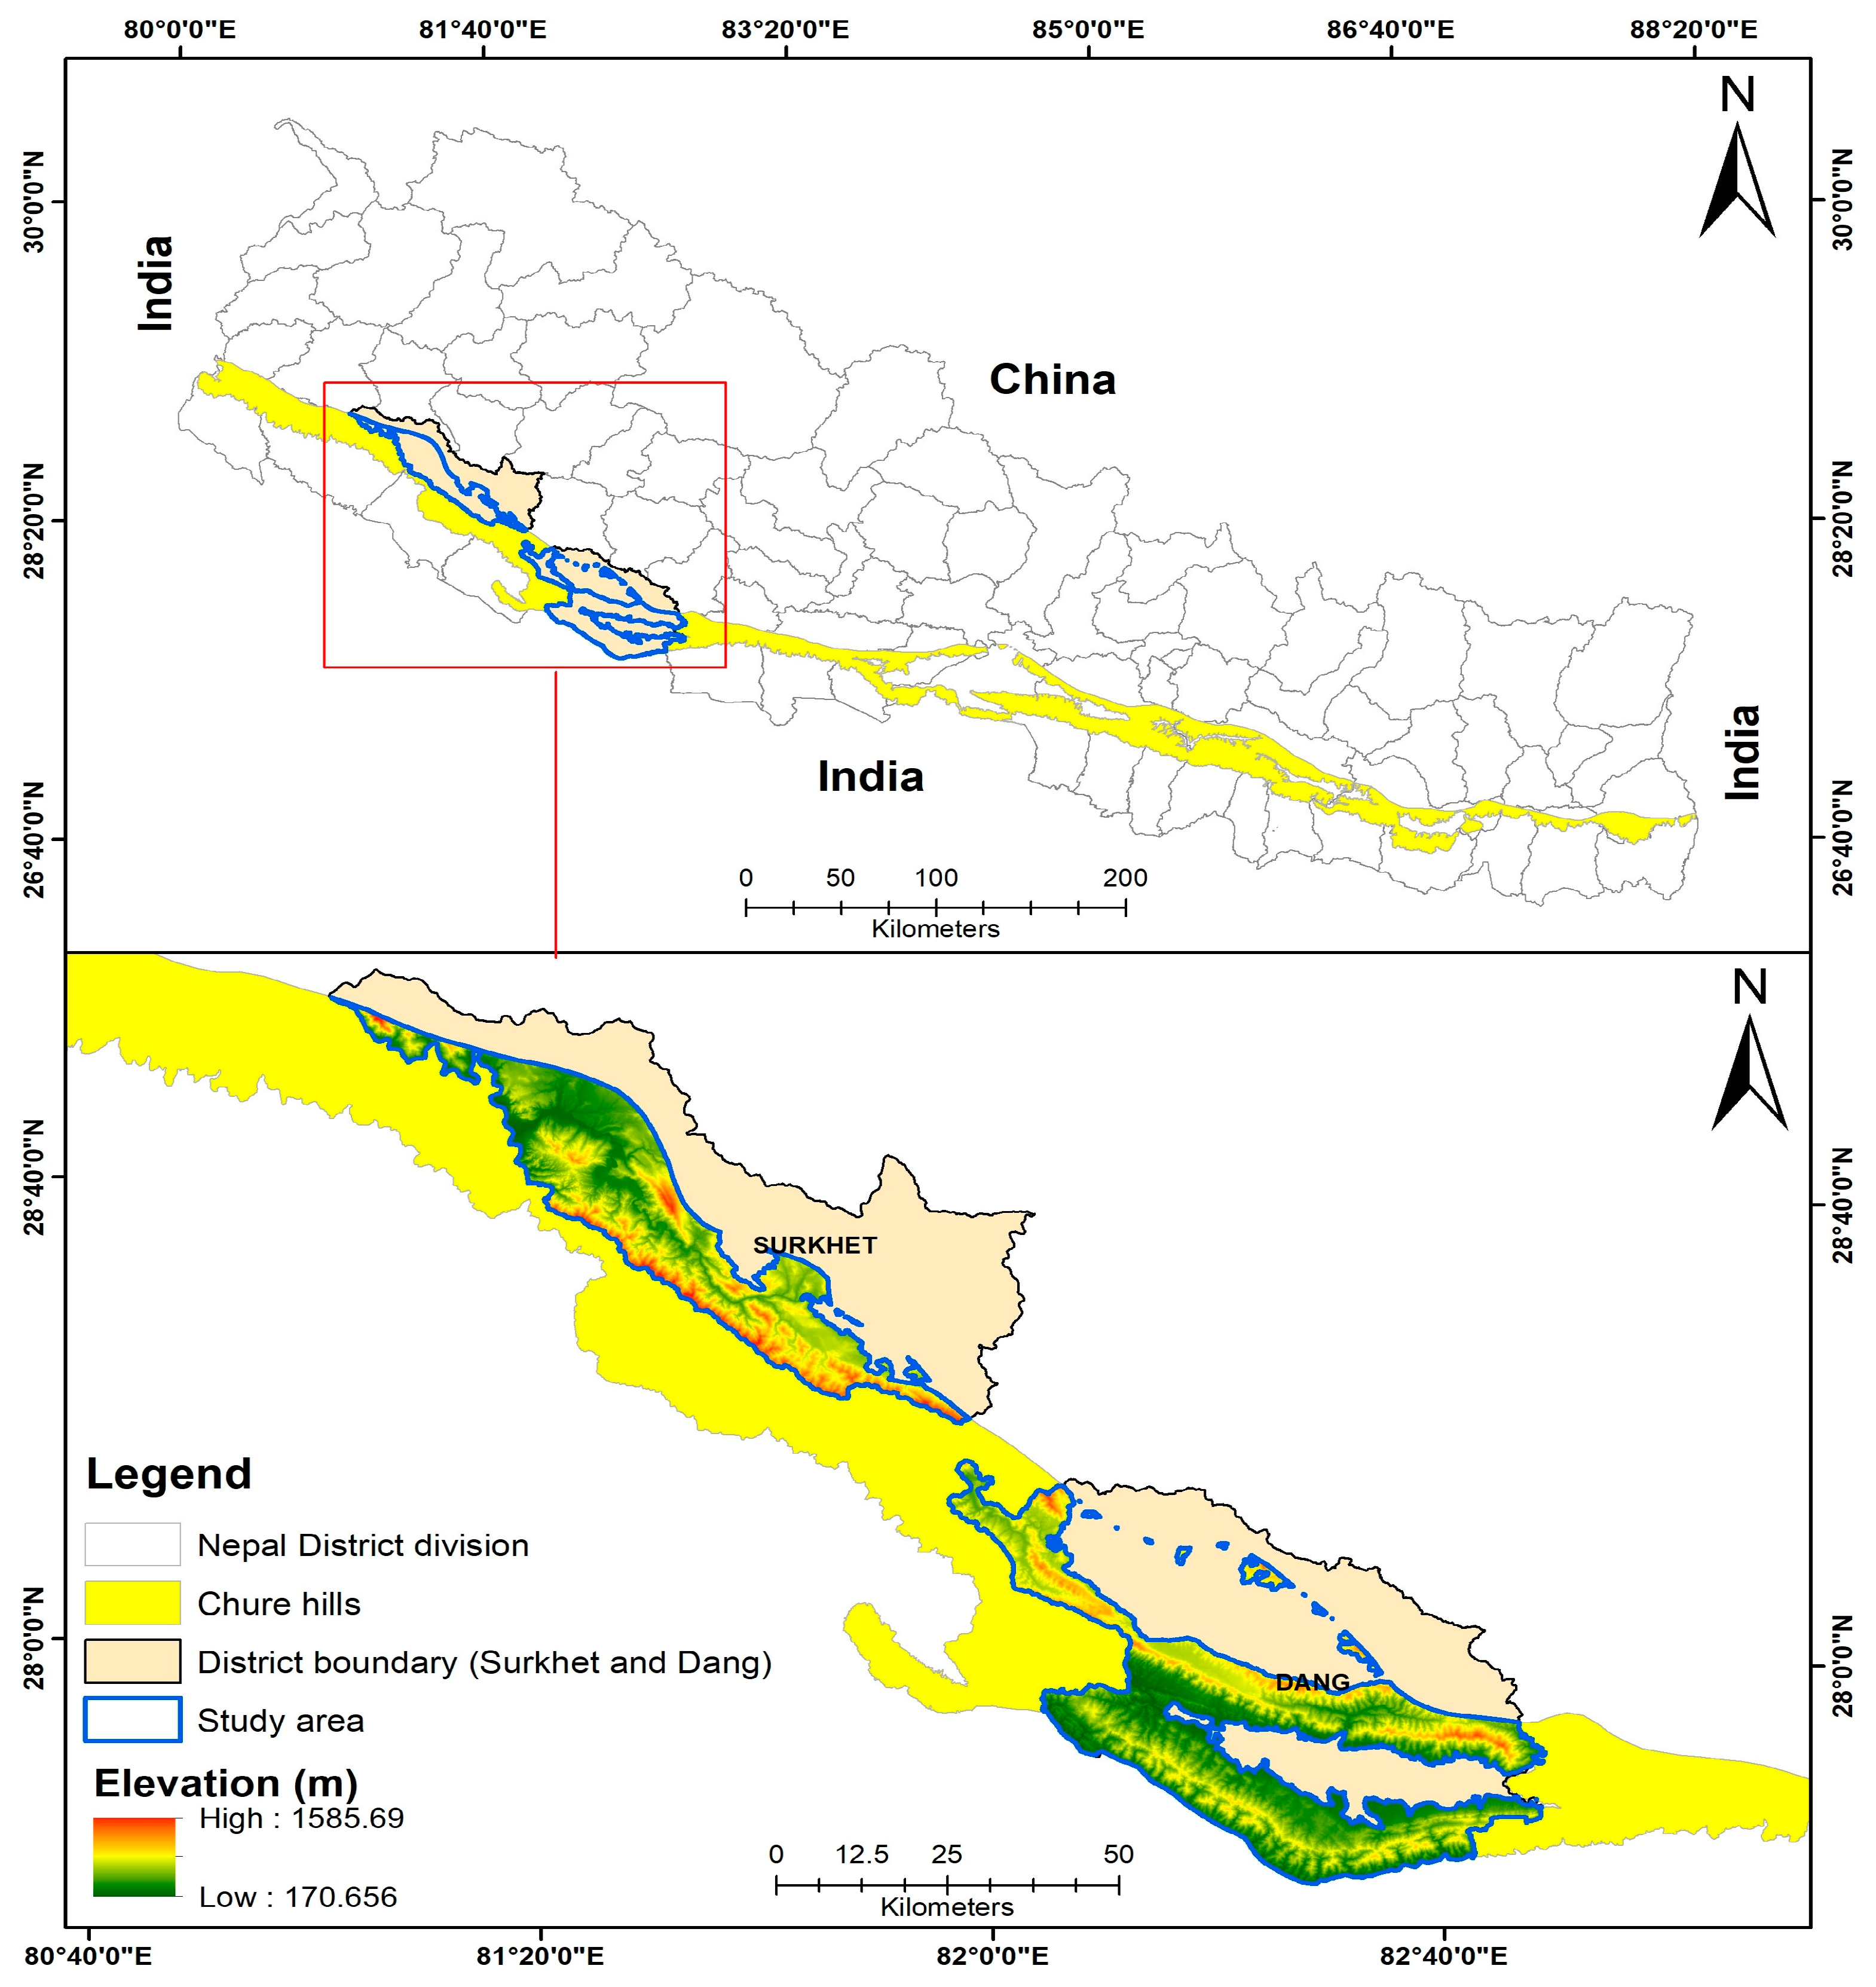
2. Study Area
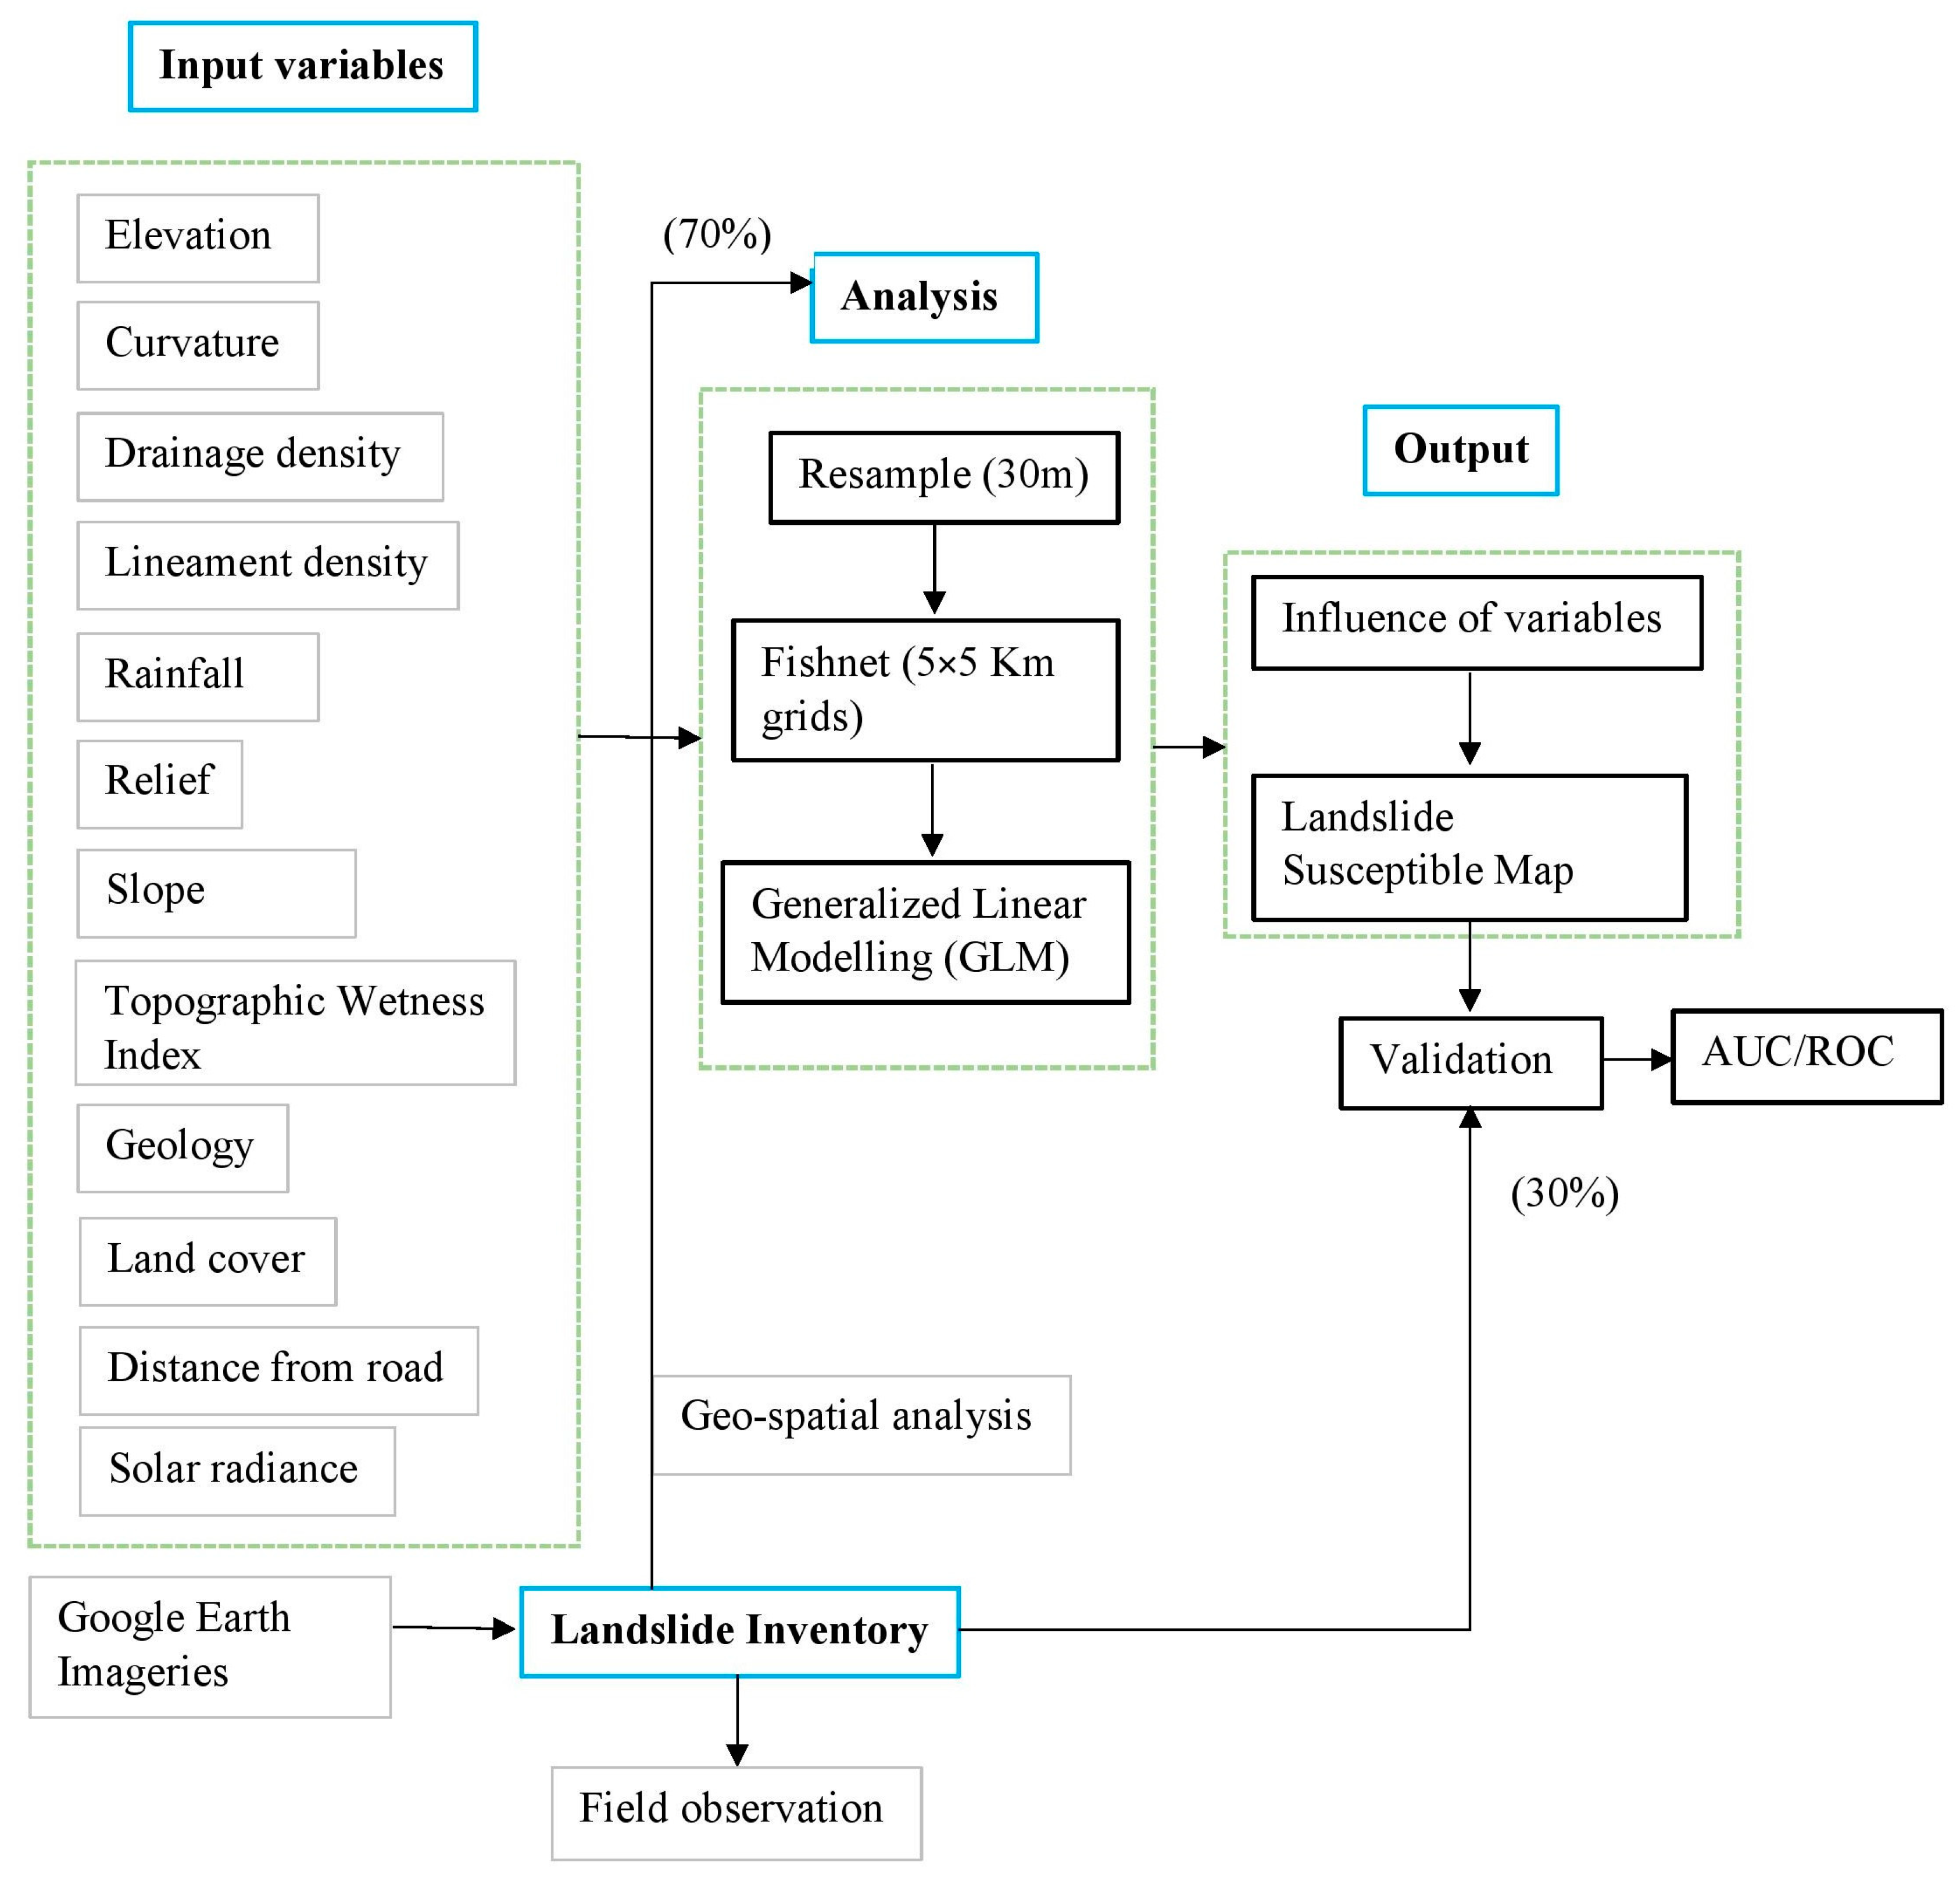
3. Materials and Methods
3.1. Data Collection and Processing
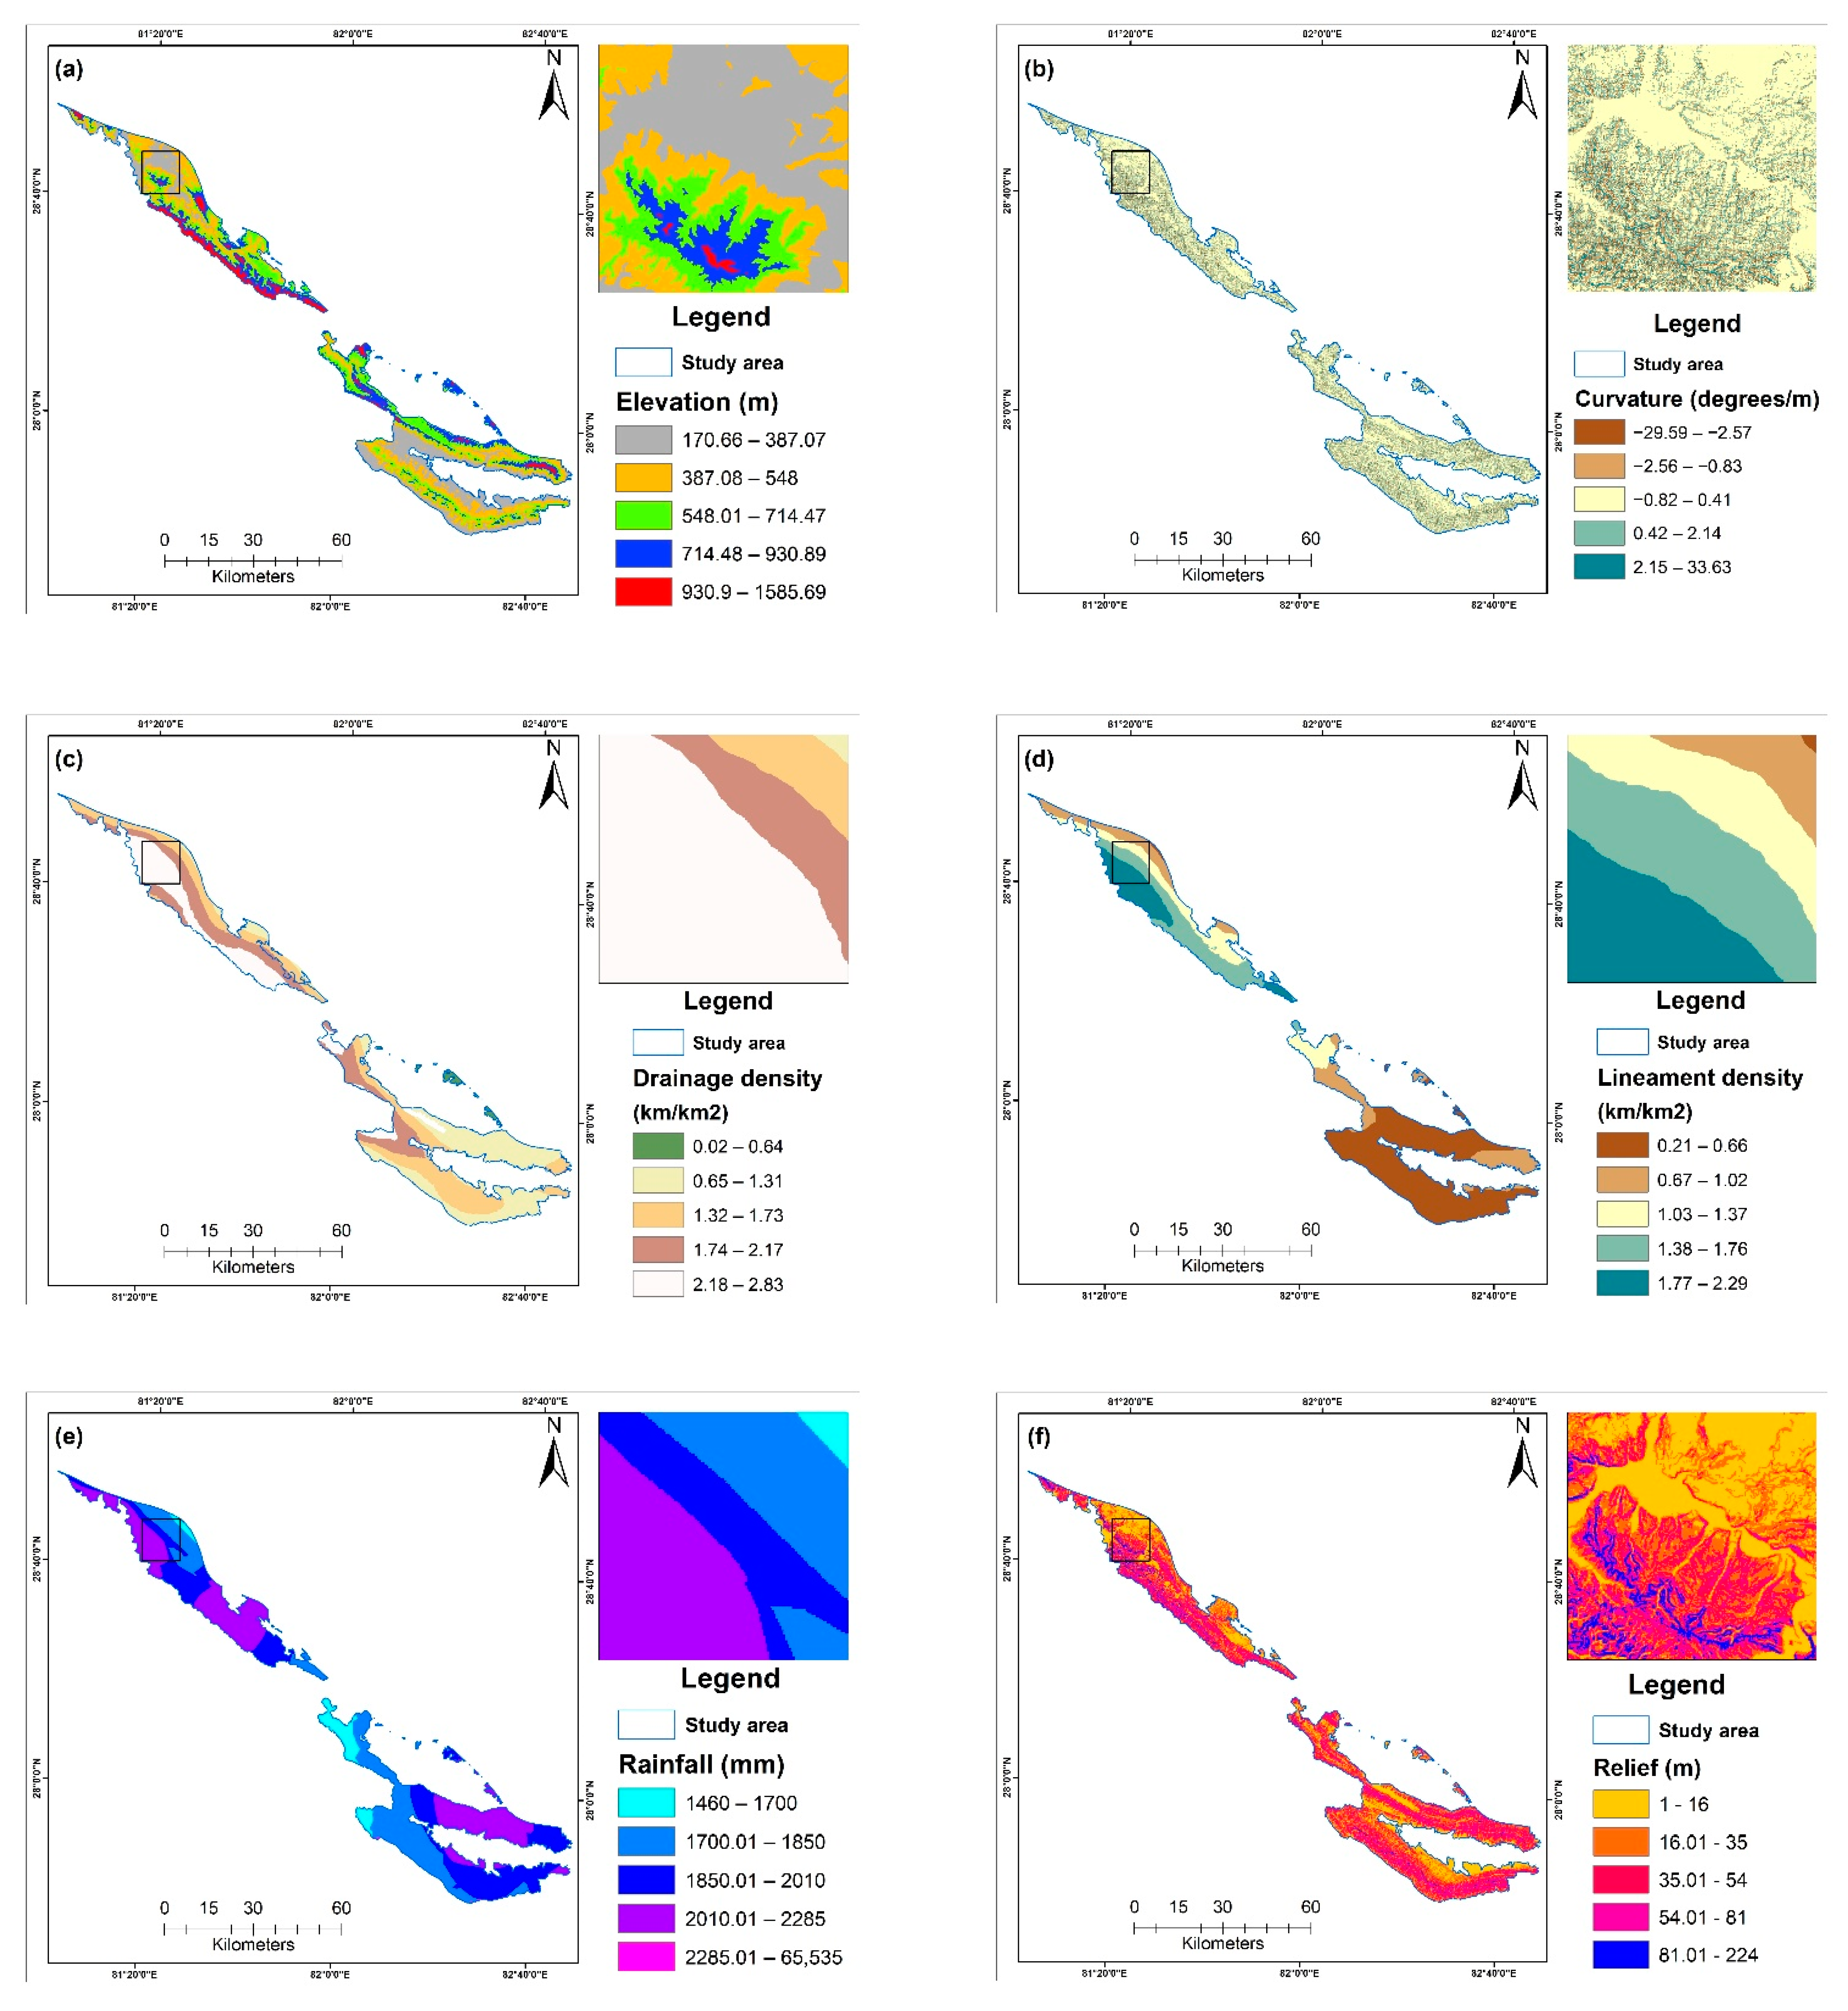
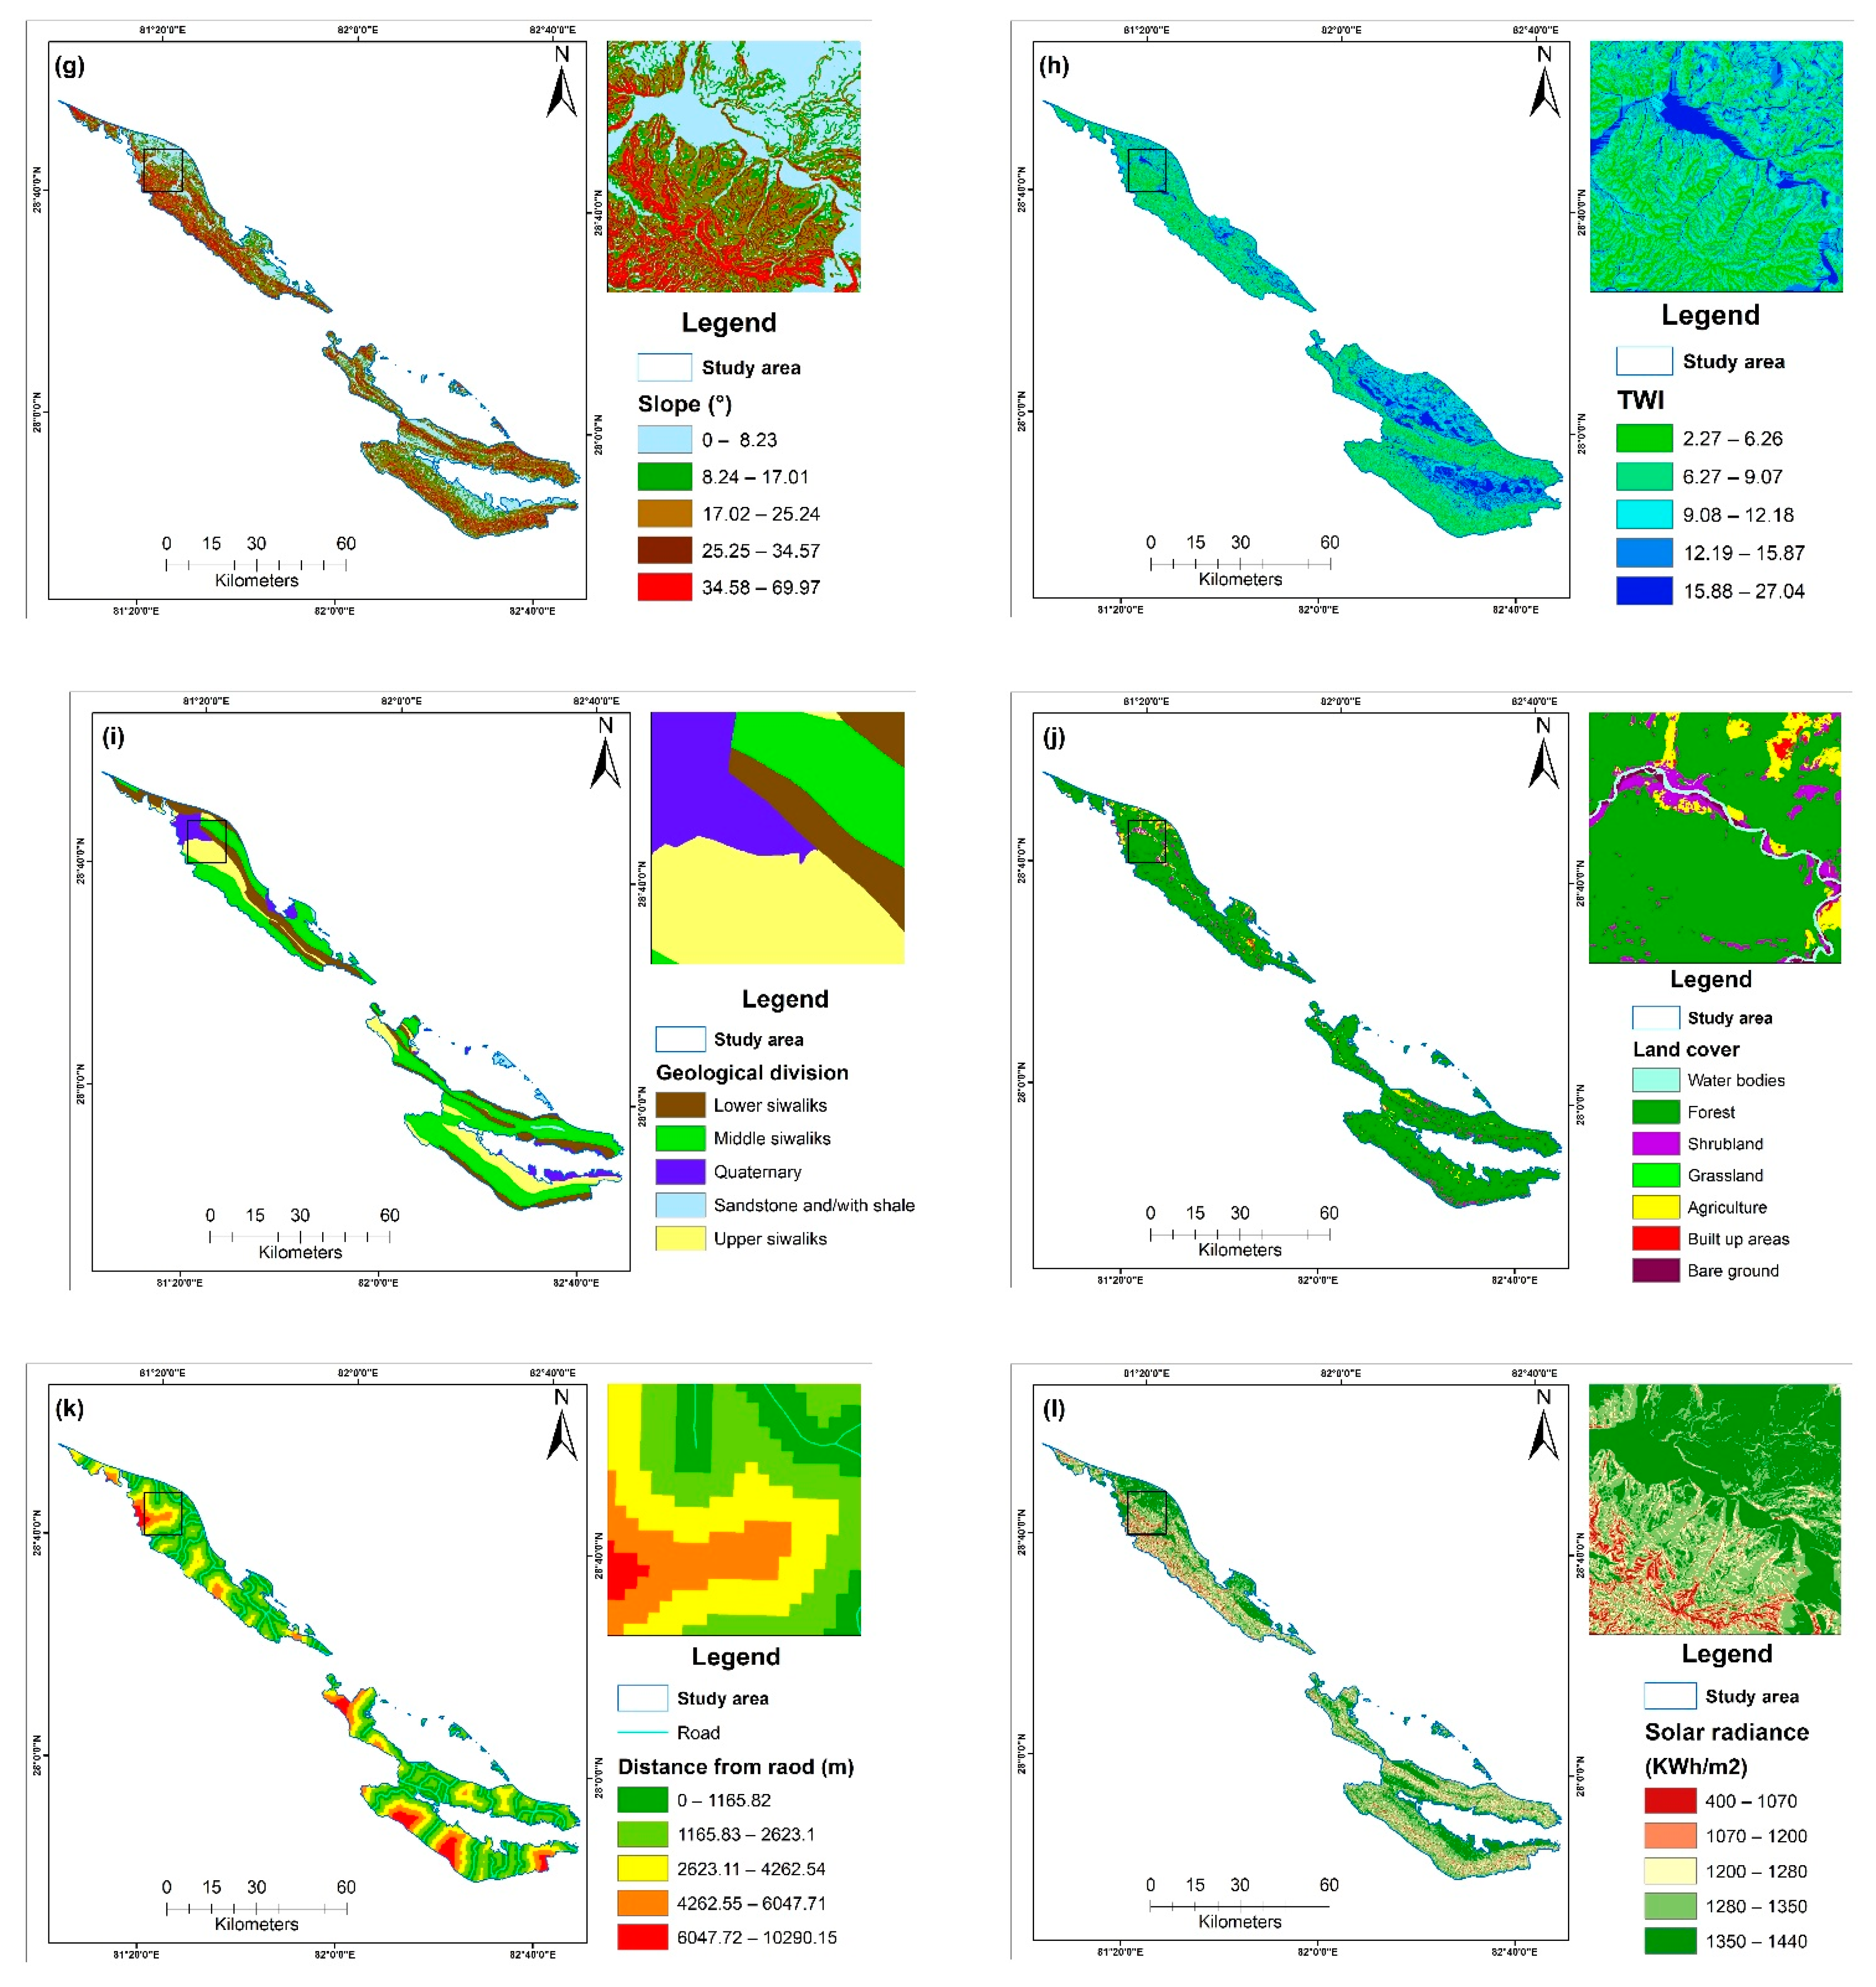
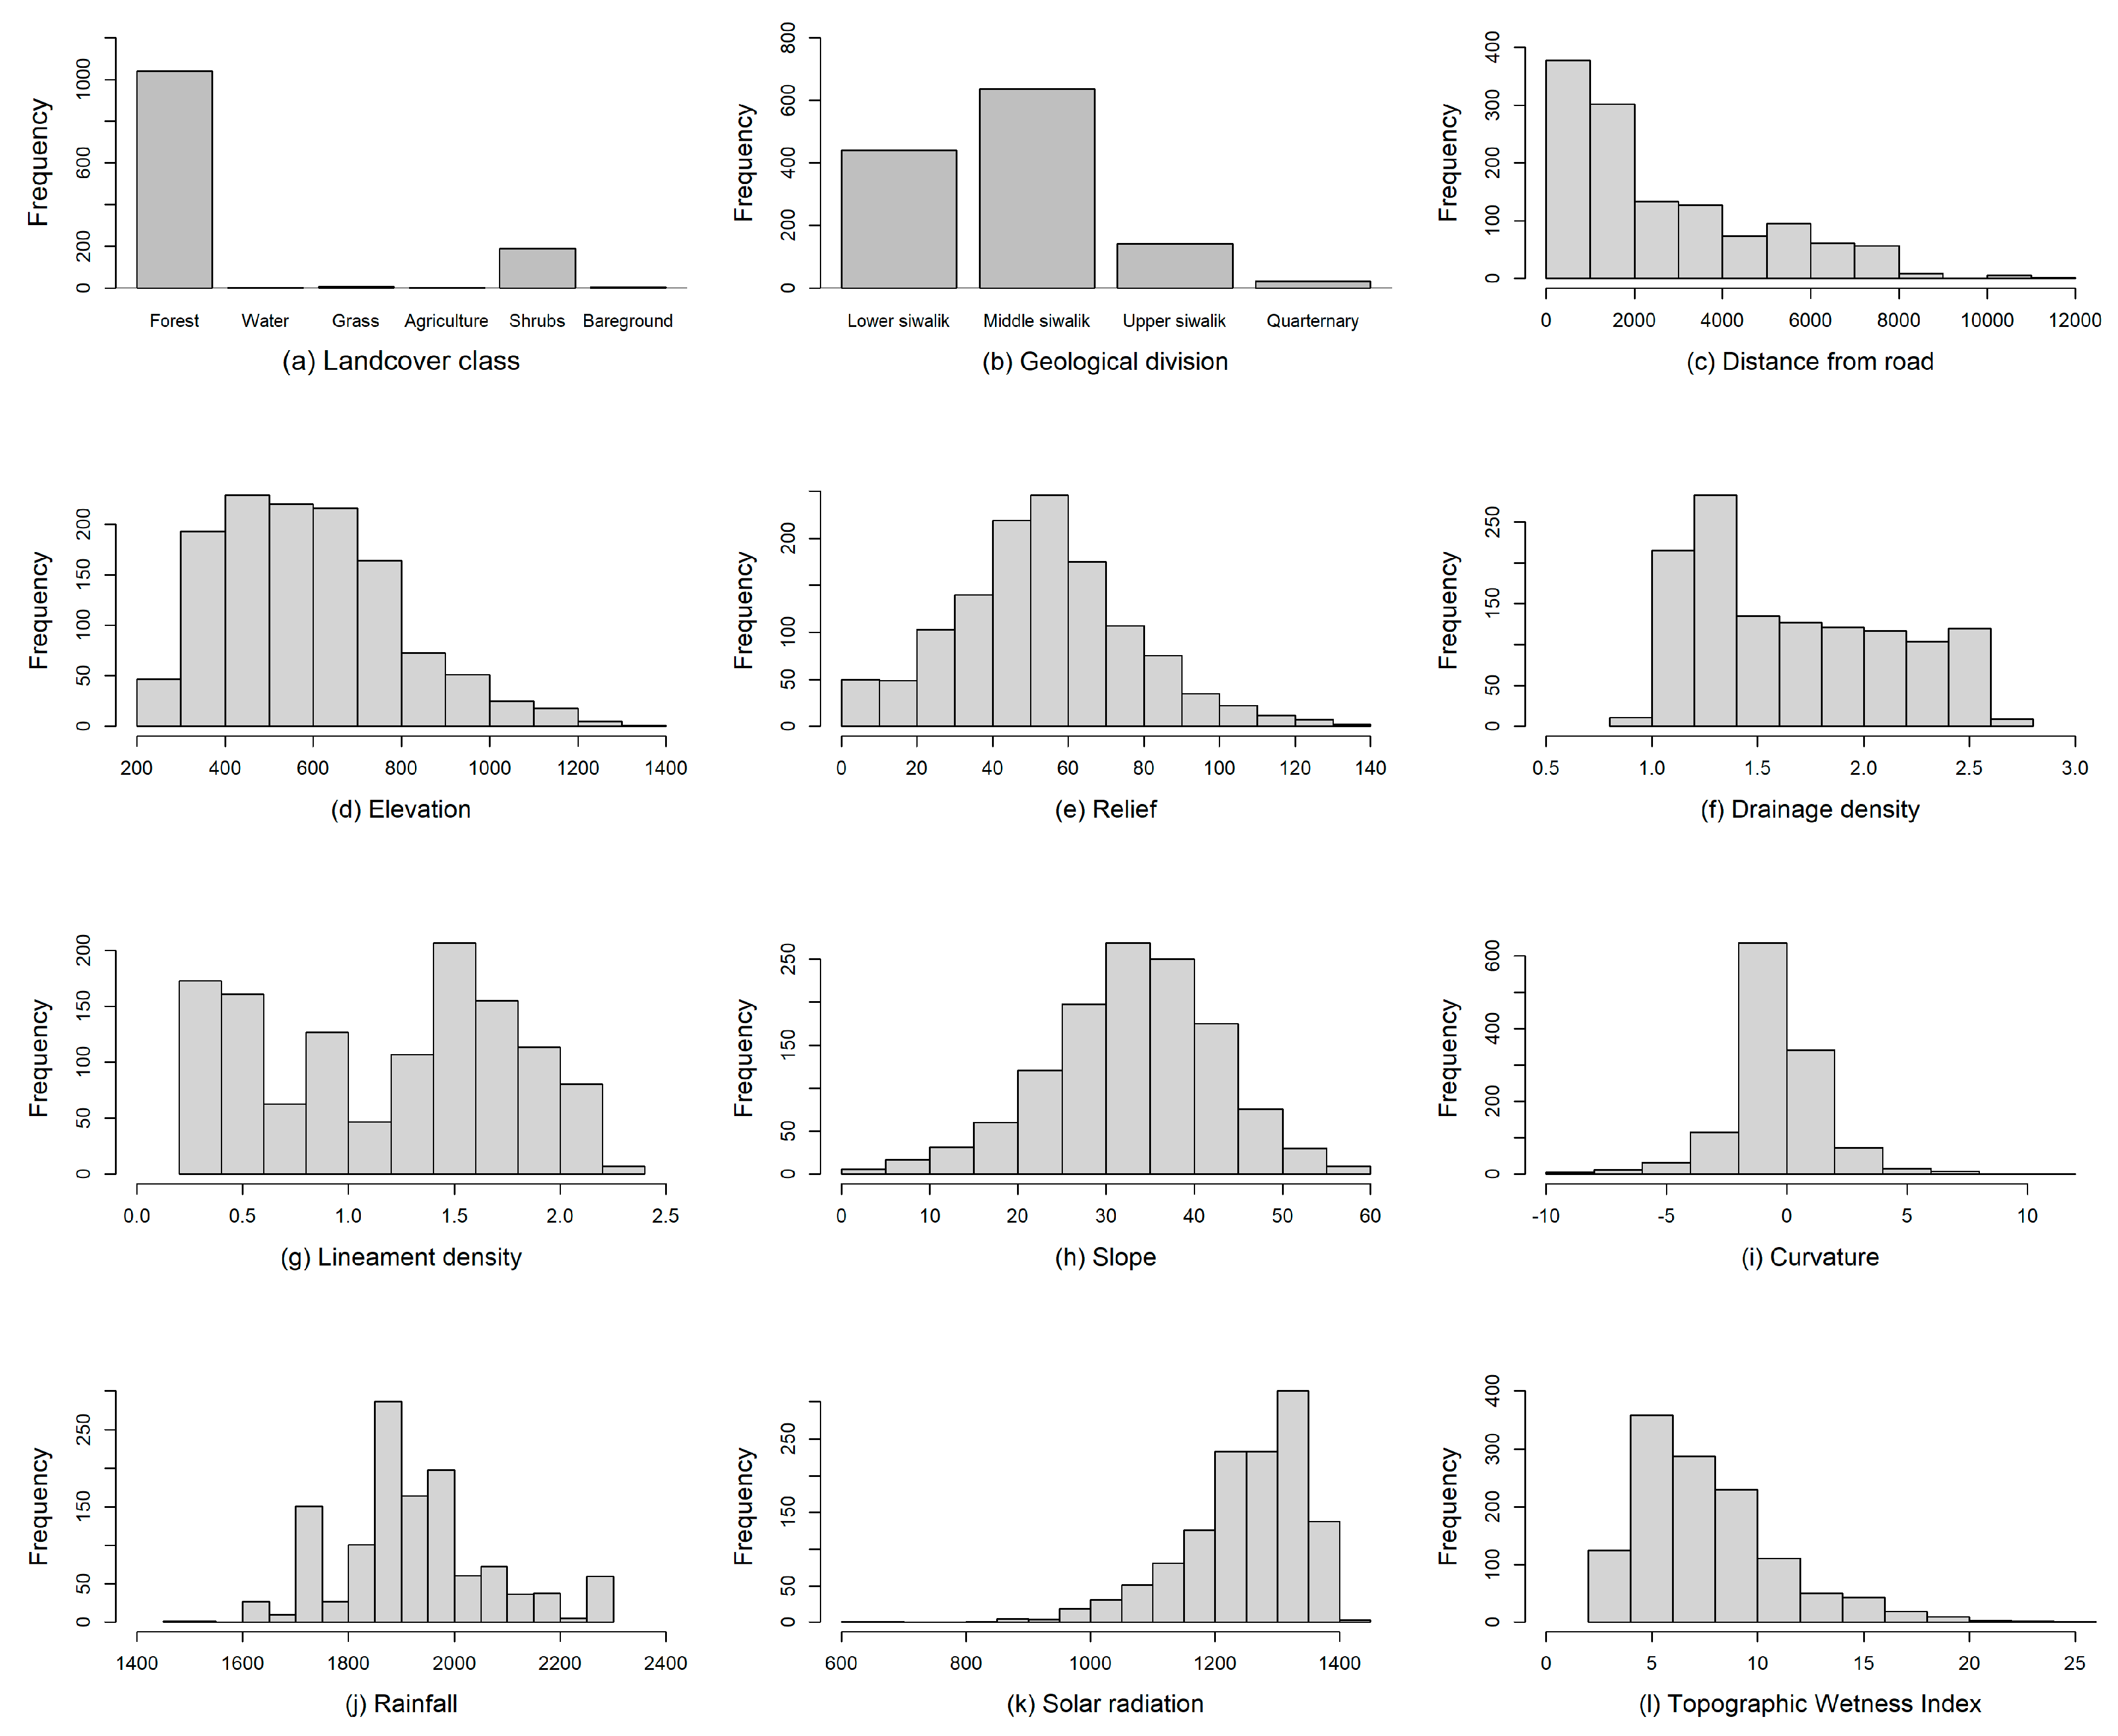
3.2. Factors Influencing Landslides
3.3. Data Analysis

| S.N. | Variables | Type | Unit | Source |
|---|---|---|---|---|
| 1. | Elevation | Continuous | Meter | (LPDAAC, 2019, [62]) |
| 2. | Curvature | Continuous | Degrees/m | Delineated from DEM |
| 3. | Drainage density | Continuous | km/km2 | Delineated from DEM |
| 4. | Lineament | Continuous | km/km2 | Delineated from DEM |
| 5. | Rainfall | Continuous | Millimeter | (Fick and Hijmans, 2017, [63]) |
| 6. | Relief | Continuous | Meter | Delineated from DEM |
| 7. | Slope | Continuous | (°) | Delineated from DEM |
| 8. | Topographical wetness index | Continuous | Unit less | Delineated from DEM |
| 9. | Geology (Lower Siwalik = 0) | Categorical | Unit less | (ICIMOD, 2020, [64]) |
| 10. | Area of water bodies | Continuous | m2 | (ESRI, 2020, [65]) |
| 11. | Area under forest | Continuous | m2 | (ESRI, 2020, [65]) |
| 12. | Area of grassland | Continuous | m2 | (ESRI, 2020, [65]) |
| 13. | Area of agricultural land | Continuous | m2 | (ESRI, 2020, [65]) |
| 14. | Area of shrubland | Continuous | m2 | (ESRI, 2020, [65]) |
| 15. | Distance from road | Continuous | Meter | (OCHA Nepal, 2021, [66]) |
| 16. | Solar radiance | Continuous | KWh m−2 | Delineated from DEM |
4. Results
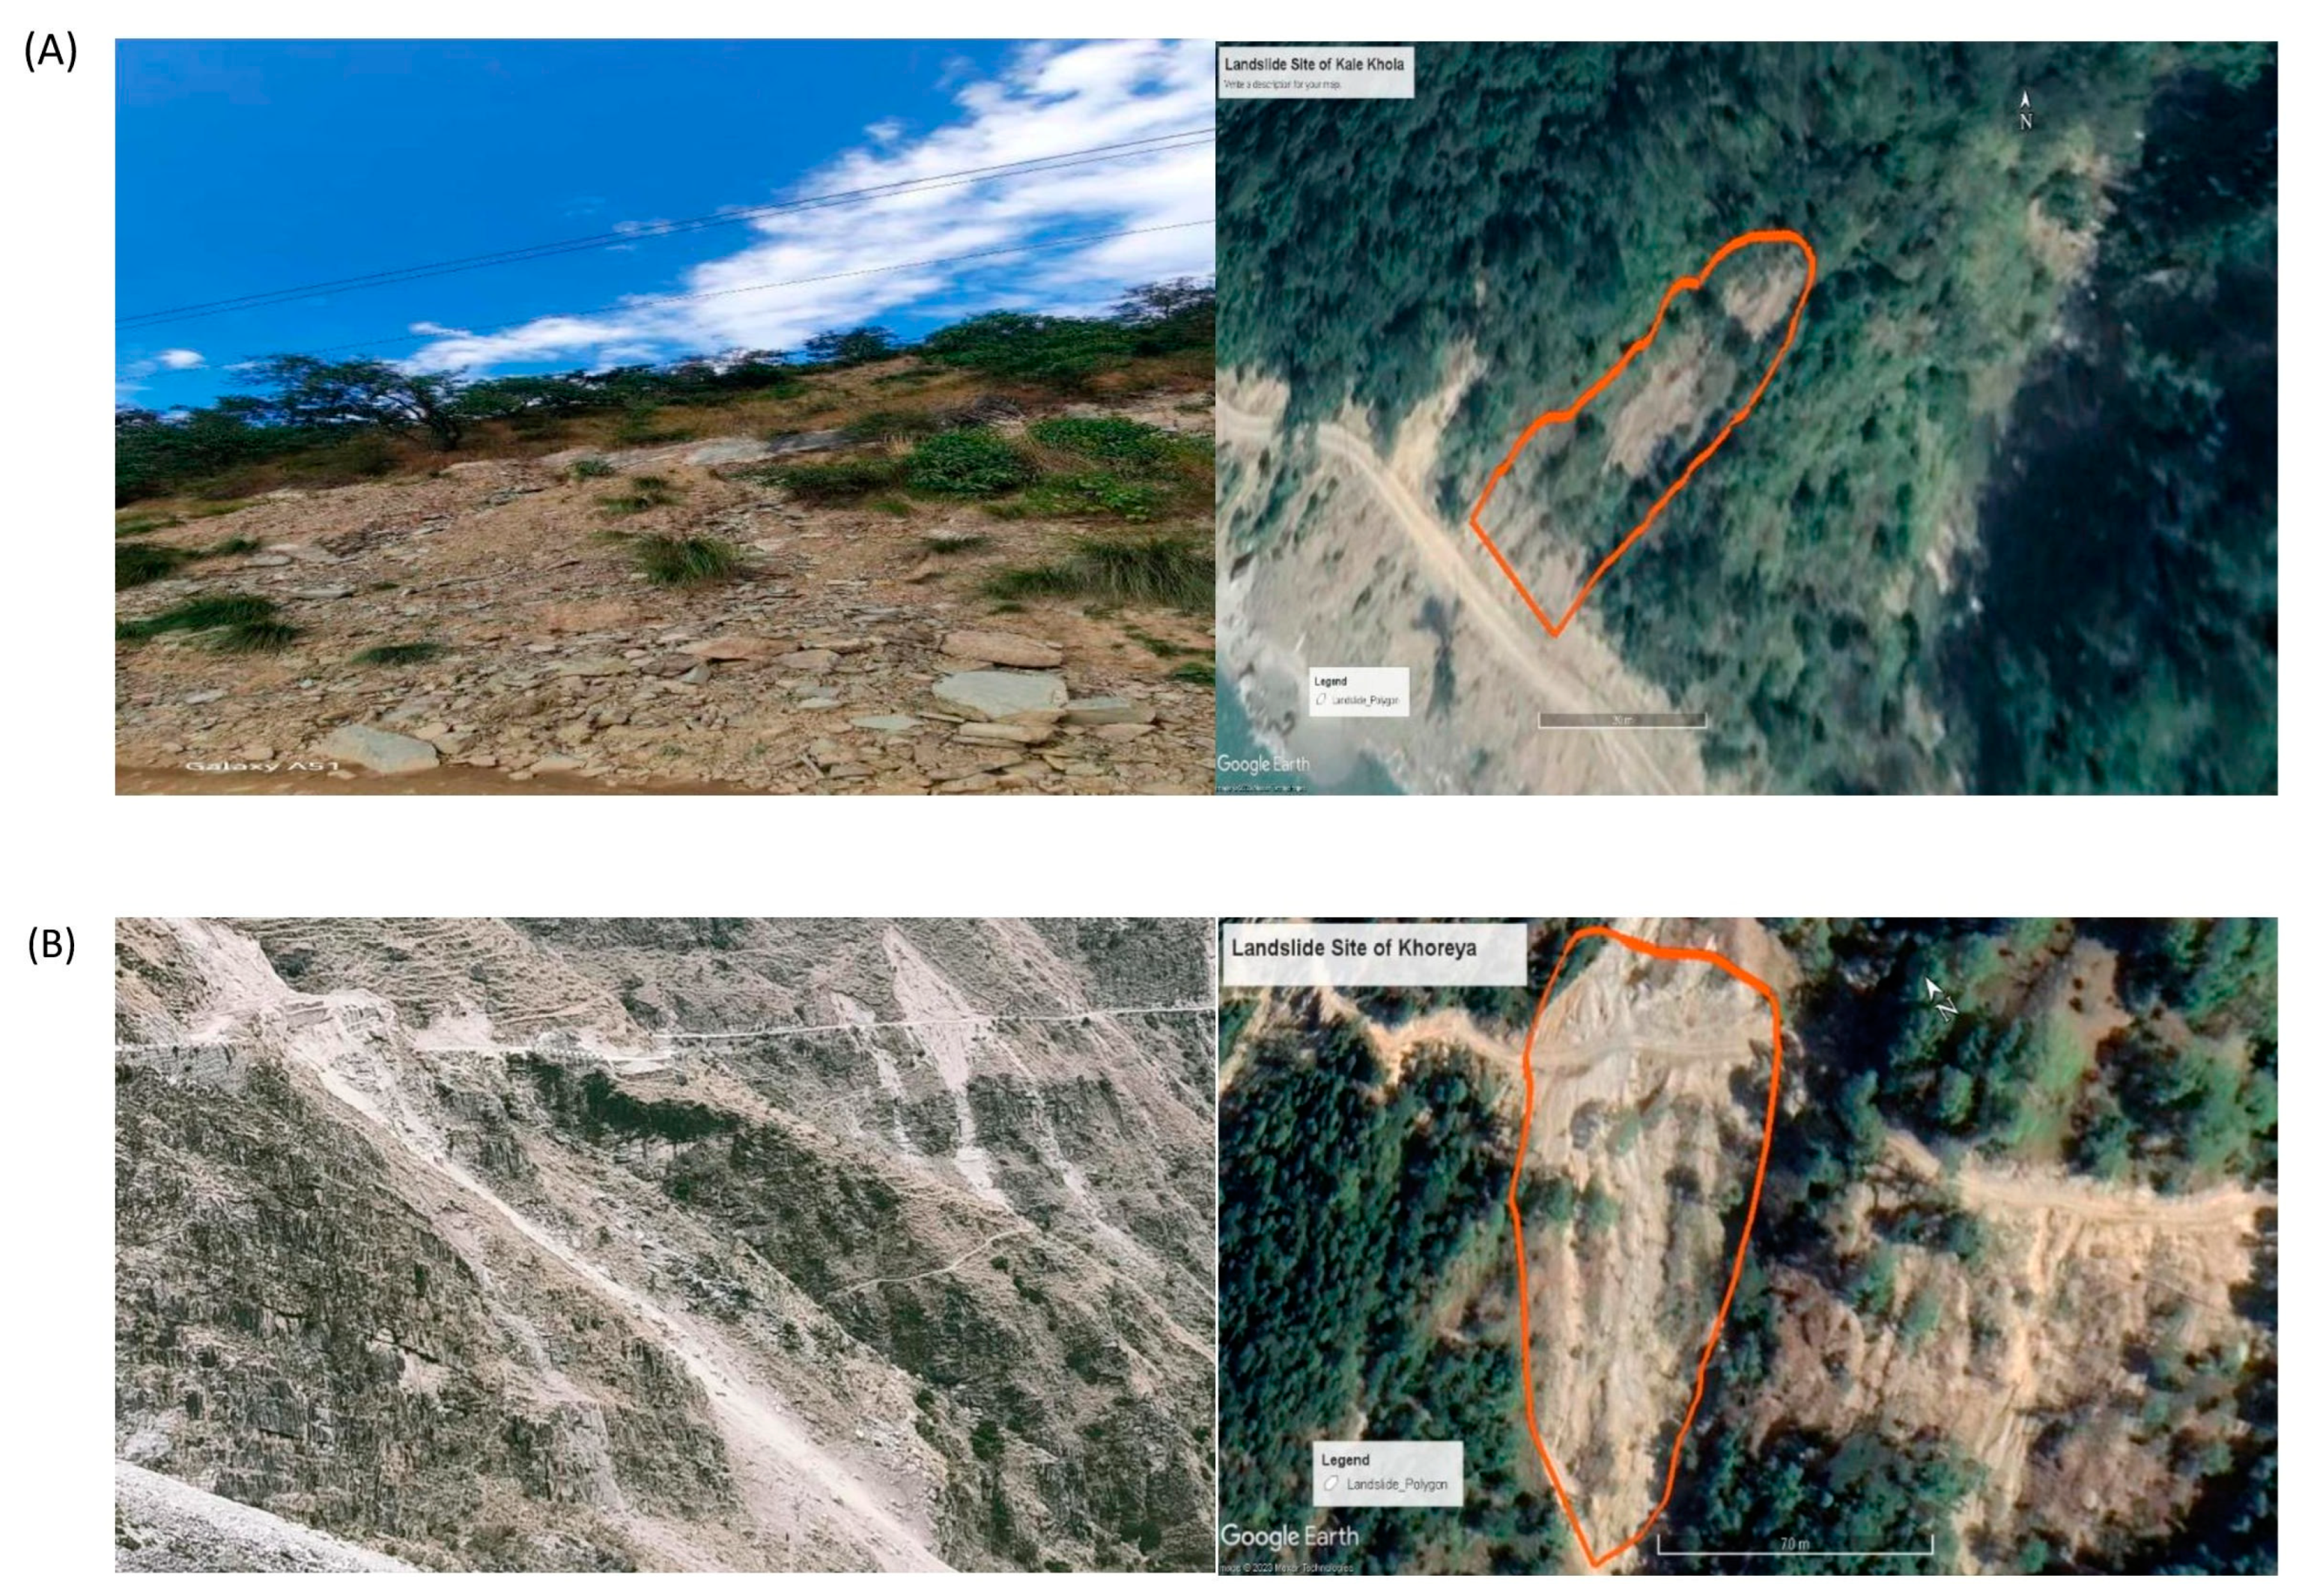
4.1. Geospatial Analysis of Landslide
4.2. Influence of Variables on Landslides
4.3. Landslide Susceptible Map
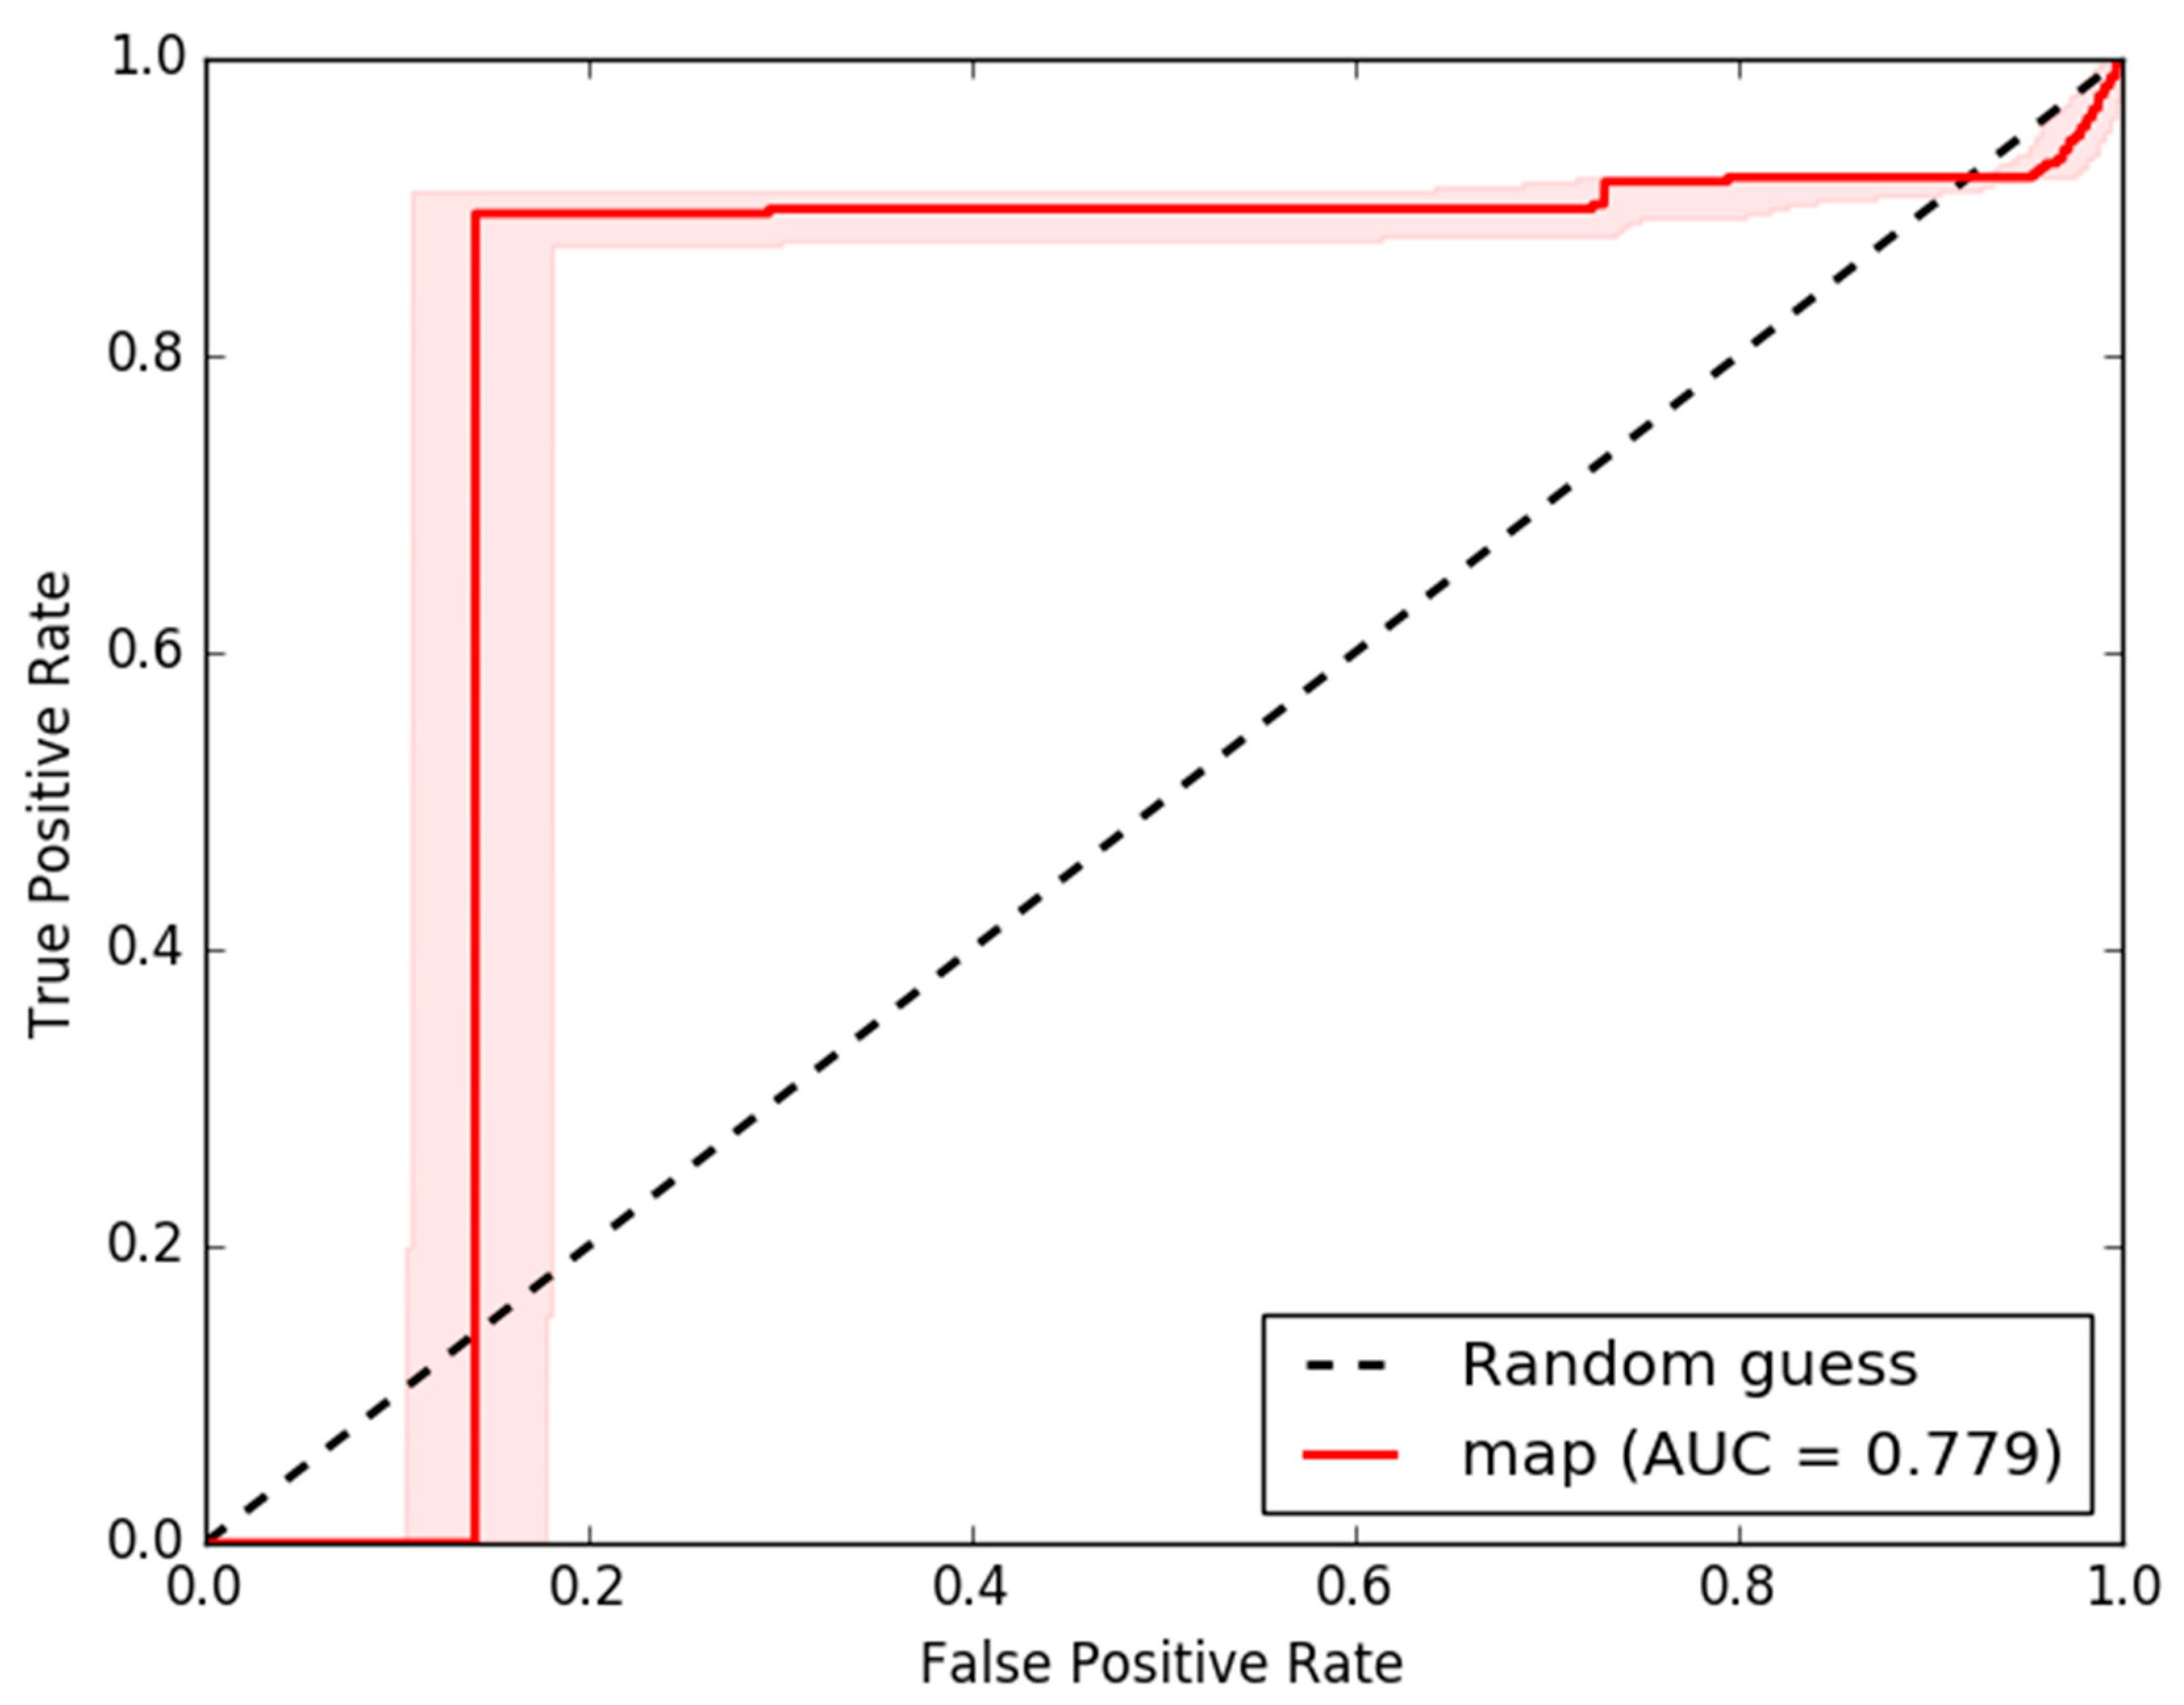
4.4. Validation
5. Discussion
6. Conclusions
Author Contributions
Funding
Data Availability Statement
Conflicts of Interest
References
- Highland, L. Estimating Landslide Losses–Preliminary Results of a Seven-State Pilot Project; US Geological Survey Reston: Reston, VA, USA, 2006.
- Kjekstad, O.; Highland, L. Economic and Social Impacts of Landslides. In Landslides–Disaster Risk Reduction; Sassa, K., Canuti, P., Eds.; Springer: Berlin/Heidelberg, Germany, 2009; pp. 573–587. ISBN 978-3-540-69970-5. [Google Scholar]
- Petley, D.N.; Hearn, G.J.; Hart, A.; Rosser, N.J.; Dunning, S.A.; Oven, K.; Mitchell, W.A. Trends in Landslide Occurrence in Nepal. Nat. Hazards 2007, 43, 23–44. [Google Scholar] [CrossRef]
- Upreti, B.N. The Physiography and Geology of Nepal and Their Bearing on the Landslide Problem. In Landslide Hazard Mitigation in the Hindu Kush-Himalaya; International Centre for Integrated Mountain Development: Kathmandu, Nepal, 2001; pp. 31–49. [Google Scholar]
- Subedi, B.; Lamichhane, P.; Magar, L.K.; Subedi, T. Aboveground Carbon Stocks and Sequestration Rates of Forests under Different Management Regimes in Churia Region of Nepal. Banko Janakari 2022, 32, 15–24. [Google Scholar] [CrossRef]
- Singh, B.K. Land Tenure and Conservation in Chure. J. For. Livelihood 2017, 15, 87–102. [Google Scholar] [CrossRef]
- Department of Forest Research and Survey. State of Nepal’s Forests; Department of Forest Research and Survey: Kathmandu, Nepal, 2014. [Google Scholar]
- Chaudhary, R.; Subedi, C. Chure-Tarai Madhesh Landscape, Nepal from Biodiversity Research Perspective. Plant Arch. 2019, 19, 351–359. [Google Scholar]
- PCTMCD. President Chure-Tarai Madhesh Conservation and Management Master Plan; President Chure-Tarai Madhesh Conservation Development Board: Lalitpur, Nepal, 2018. [Google Scholar]
- Alharbi, T.; Sultan, M.; Sefry, S.; ElKadiri, R.; Ahmed, M.; Chase, R.; Milewski, A.; Abu Abdullah, M.; Emil, M.; Chounaird, K. An Assessment of Landslide Susceptibility in the Faifa Area, Saudi Arabia, Using Remote Sensing and GIS Techniques. Nat. Hazards Earth Syst. Sci. 2014, 14, 1553–1564. [Google Scholar] [CrossRef]
- Nhu, V.-H.; Mohammadi, A.; Shahabi, H.; Ahmad, B.B.; Al-Ansari, N.; Shirzadi, A.; Clague, J.J.; Jaafari, A.; Chen, W.; Nguyen, H. Landslide Susceptibility Mapping Using Machine Learning Algorithms and Remote Sensing Data in a Tropical Environment. Int. J. Environ. Res. Public Health 2020, 17, 4933. [Google Scholar] [CrossRef]
- Ullah, I.; Aslam, B.; Shah, S.H.I.A.; Tariq, A.; Qin, S.; Majeed, M.; Havenith, H.-B. An Integrated Approach of Machine Learning, Remote Sensing, and GIS Data for the Landslide Susceptibility Mapping. Land 2022, 11, 1265. [Google Scholar] [CrossRef]
- Shi, X.; Liao, M.; Zhang, L.; Balz, T. Landslide Stability Evaluation Using High-Resolution Satellite SAR Data in the Three Gorges Area. Q. J. Eng. Geol. Hydrogeol. 2016, 49, 203–211. [Google Scholar] [CrossRef]
- Van Westen, C.J.; Rengers, N.; Soeters, R. Use of Geomorphological Information in Indirect Landslide Susceptibility Assessment. Nat. Hazards 2003, 30, 399–419. [Google Scholar] [CrossRef]
- Saleem, N.; Huq, M.E.; Twumasi, N.Y.D.; Javed, A.; Sajjad, A. Parameters Derived from and/or Used with Digital Elevation Models (DEMs) for Landslide Susceptibility Mapping and Landslide Risk Assessment: A Review. ISPRS Int. J. Geo-Inf. 2019, 8, 545. [Google Scholar] [CrossRef]
- Zhao, C.; Lu, Z. Remote Sensing of Landslides—A Review. Remote Sens. 2018, 10, 279. [Google Scholar] [CrossRef]
- Corominas, J.; van Westen, C.; Frattini, P.; Cascini, L.; Malet, J.-P.; Fotopoulou, S.; Catani, F.; Van Den Eeckhaut, M.; Mavrouli, O.; Agliardi, F.; et al. Recommendations for the Quantitative Analysis of Landslide Risk. Bull Eng. Geol. Environ. 2014, 73, 209–263. [Google Scholar] [CrossRef]
- Ghimire, M.; Timalsina, N. Landslide Distribution and Processes in the Hills of Central Nepal: Geomorphic and Statistical Approach to Susceptibility Assessment. J. Geosci. Environ. Prot. 2020, 8, 276–302. [Google Scholar] [CrossRef]
- Kanungo, D.P.; Arora, M.K.; Sarkar, S.; Gupta, R.P. A Comparative Study of Conventional, ANN Black Box, Fuzzy and Combined Neural and Fuzzy Weighting Procedures for Landslide Susceptibility Zonation in Darjeeling Himalayas. Eng. Geol. 2006, 85, 347–366. [Google Scholar] [CrossRef]
- Raghuvanshi, T.K.; Ibrahim, J.; Ayalew, D. Slope Stability Susceptibility Evaluation Parameter (SSEP) Rating Scheme–an Approach for Landslide Hazard Zonation. J. Afr. Earth Sci. 2014, 99, 595–612. [Google Scholar] [CrossRef]
- Carrara, A.; Cardinali, M.; Guzzetti, F.; Reichenbach, P. Gis Technology in Mapping Landslide Hazard. In Geographical Information Systems in Assessing Natural Hazards; Carrara, A., Guzzetti, F., Eds.; Advances in Natural and Technological Hazards Research; Springer: Dordrecht, The Netherlands, 1995; pp. 135–175. ISBN 978-94-015-8404-3. [Google Scholar]
- Safaei, M.; Omar, H.; Huat, B.K.; Yousof, Z.B.; Ghiasi, V. Deterministic Rainfall Induced Landslide Approaches, Advantage and Limitation. Electron. J. Geotech. Eng. 2011, 16, 1619–1650. [Google Scholar]
- Anis, Z.; Wissem, G.; Vali, V.; Smida, H.; Essghaier, G.M. GIS-Based Landslide Susceptibility Mapping Using Bivariate Statistical Methods in North-Western Tunisia. Open Geosci. 2019, 11, 708–726. [Google Scholar] [CrossRef]
- Pradhan, B.; Lee, S. Landslide Susceptibility Assessment and Factor Effect Analysis: Backpropagation Artificial Neural Networks and Their Comparison with Frequency Ratio and Bivariate Logistic Regression Modelling. Environ. Model. Softw. 2010, 25, 747–759. [Google Scholar] [CrossRef]
- Abdo, H.G. Assessment of Landslide Susceptibility Zonation Using Frequency Ratio and Statistical Index: A Case Study of Al-Fawar Basin, Tartous, Syria. Int. J. Environ. Sci. Technol. 2022, 19, 2599–2618. [Google Scholar] [CrossRef]
- Mersha, T.; Meten, M. GIS-Based Landslide Susceptibility Mapping and Assessment Using Bivariate Statistical Methods in Simada Area, Northwestern Ethiopia. Geoenviron Disasters 2020, 7, 20. [Google Scholar] [CrossRef]
- Guo, M.; Li, J.; Sheng, C.; Xu, J.; Wu, L. A Review of Wetland Remote Sensing. Sensors 2017, 17, 777. [Google Scholar] [CrossRef] [PubMed]
- Abija, F.A.; Nwosu, J.I.; Ifedotun, A.I.; Osadebe, C.C. Landslide Susceptibility Assessment of Calabar, Nigeria Using Geotechnical, Remote Sensing and Multi-Criteria Decision Analysis: Implications for Urban Planning and Development. SDRP-JESES 2019, 4, 774–788. [Google Scholar] [CrossRef]
- Brenning, A. Spatial Prediction Models for Landslide Hazards: Review, Comparison and Evaluation. Nat. Hazards Earth Syst. Sci. 2005, 5, 853–862. [Google Scholar] [CrossRef]
- Atkinson, P.M.; Massari, R. Generalised Linear Modelling of Susceptibility to Landsliding in the Central Apennines, Italy. Comput. Geosci. 1998, 24, 373–385. [Google Scholar] [CrossRef]
- Crovelli, R.A. Probability Models for Estimation of Number and Costs of Landslides; US Geological Survey: Reston, VA, USA, 2000.
- Das, I.; Kumar, G.; Stein, A.; Bagchi, A.; Dadhwal, V.K. Stochastic Landslide Vulnerability Modeling in Space and Time in a Part of the Northern Himalayas, India. Environ. Monit. Assess 2011, 178, 25–37. [Google Scholar] [CrossRef] [PubMed]
- Chung, C.-J.F.; Fabbri, A.G.; Van Westen, C.J. Multivariate Regression Analysis for Landslide Hazard Zonation. In Geographical Information Systems in Assessing Natural Hazards; Carrara, A., Guzzetti, F., Eds.; Advances in Natural and Technological Hazards Research; Springer: Dordrecht, The Netherlands, 1995; pp. 107–133. ISBN 978-94-015-8404-3. [Google Scholar]
- Shrestha, K.; Khadka, U.R.; Singh Shrestha, M. Comparative GIS-Based Assessment of Landslide Susceptibility of Chepe River Corridor, Gandaki River Basin, Nepal. In Integrated Research on Disaster Risks; Djalante, R., Bisri, M.B.F., Shaw, R., Eds.; Disaster Risk Reduction; Springer International Publishing: Berlin/Heidelberg, Germany, 2021; pp. 111–136. ISBN 978-3-030-55562-7. [Google Scholar]
- Thapa, D.; Bhandari, B.P. GIS-Based Frequency Ratio Method for Identification of Potential Landslide Susceptible Area in the Siwalik Zone of Chatara-Barahakshetra Section, Nepal. Open J. Geol. 2019, 09, 873. [Google Scholar] [CrossRef]
- CBS. National Population and and Housing Census 2021; Central Bureau of Statistics: Kathmandu, Nepal; National Planning Commission: Kathmandu, Nepal, 2021.
- Uprety, Y.; Tiwari, A.; Karki, S.; Chaudhary, A.; Yadav, R.K.P.; Giri, S.; Shrestha, S.; Paudyal, K.; Dhakal, M. Characterization of Forest Ecosystems in the Chure (Siwalik Hills) Landscape of Nepal Himalaya and Their Conservation Need. Forests 2023, 14, 100. [Google Scholar] [CrossRef]
- Manandhar, E.; Kharel, B.P.; Basnet, L. Integrated River System Resource Management Planning: A Stepping Stone for Sustainable Conservation of Chure-TaraiMadhesh Landscape. In Proceedings of the Seminar on Leaving no One Behind; National Academy of Science and Technology: Khumaltar, Lalitpur, 12 October 2019. [Google Scholar]
- Ghimire, M. Historical Land Covers Change in the Chure-Tarai Landscape in the Last Six Decades: Drivers and Environmental Consequences. In Land Cover Change and Its Eco-Environmental Responses in Nepal; Li, A., Deng, W., Zhao, W., Eds.; Springer Geography; Springer: Singapore, 2017; pp. 109–147. ISBN 978-981-10-2890-8. [Google Scholar]
- Pourghasemi, H.R.; Kornejady, A.; Kerle, N.; Shabani, F. Investigating the Effects of Different Landslide Positioning Techniques, Landslide Partitioning Approaches, and Presence-Absence Balances on Landslide Susceptibility Mapping. CATENA 2020, 187, 104364. [Google Scholar] [CrossRef]
- Devkota, K.C.; Regmi, A.D.; Pourghasemi, H.R.; Yoshida, K.; Pradhan, B.; Ryu, I.C.; Dhital, M.R.; Althuwaynee, O.F. Landslide Susceptibility Mapping Using Certainty Factor, Index of Entropy and Logistic Regression Models in GIS and Their Comparison at Mugling–Narayanghat Road Section in Nepal Himalaya. Nat. Hazards 2013, 65, 135–165. [Google Scholar] [CrossRef]
- Regmi, A.D.; Poudel, K. Assessment of Landslide Susceptibility Using GIS-Based Evidential Belief Function in Patu Khola Watershed, Dang, Nepal. Environ. Earth Sci. 2016, 75, 743. [Google Scholar] [CrossRef]
- Addis, A. GIS-Based Landslide Susceptibility Mapping Using Frequency Ratio and Shannon Entropy Models in Dejen District, Northwestern Ethiopia. J. Eng. 2023, 2023, e1062388. [Google Scholar] [CrossRef]
- Lee, S.; Talib, J.A. Probabilistic Landslide Susceptibility and Factor Effect Analysis. Environ. Geol. 2005, 47, 982–990. [Google Scholar] [CrossRef]
- He, S.; Pan, P.; Dai, L.; Wang, H.; Liu, J. Application of Kernel-Based Fisher Discriminant Analysis to Map Landslide Susceptibility in the Qinggan River Delta, Three Gorges, China. Geomorphology 2012, 171–172, 30–41. [Google Scholar] [CrossRef]
- Shu, H.; Guo, Z.; Qi, S.; Song, D.; Pourghasemi, H.R.; Ma, J. Integrating Landslide Typology with Weighted Frequency Ratio Model for Landslide Susceptibility Mapping: A Case Study from Lanzhou City of Northwestern China. Remote Sens. 2021, 13, 3623. [Google Scholar] [CrossRef]
- Ali, S.A.; Parvin, F.; Vojteková, J.; Costache, R.; Linh, N.T.T.; Pham, Q.B.; Vojtek, M.; Gigović, L.; Ahmad, A.; Ghorbani, M.A. GIS-Based Landslide Susceptibility Modeling: A Comparison between Fuzzy Multi-Criteria and Machine Learning Algorithms. Geosci. Front. 2021, 12, 857–876. [Google Scholar] [CrossRef]
- Pham, B.T.; Bui, D.T.; Dholakia, M.B.; Prakash, I.; Pham, H.V.; Mehmood, K.; Le, H.Q. A Novel Ensemble Classifier of Rotation Forest and Naïve Bayer for Landslide Susceptibility Assessment at the Luc Yen District, Yen Bai Province (Viet Nam) Using GIS. Geomat. Nat. Hazards Risk 2017, 8, 649–671. [Google Scholar] [CrossRef]
- Xu, C.; Dai, F.; Xu, X.; Lee, Y.H. GIS-Based Support Vector Machine Modeling of Earthquake-Triggered Landslide Susceptibility in the Jianjiang River Watershed, China. Geomorphology 2012, 145–146, 70–80. [Google Scholar] [CrossRef]
- Clubb, F.J.; Mudd, S.M.; Attal, M.; Milodowski, D.T.; Grieve, S.W.D. The Relationship between Drainage Density, Erosion Rate, and Hilltop Curvature: Implications for Sediment Transport Processes. J. Geophys. Res. Earth Surf. 2016, 121, 1724–1745. [Google Scholar] [CrossRef]
- Ding, Q.; Chen, W.; Hong, H. Application of Frequency Ratio, Weights of Evidence and Evidential Belief Function Models in Landslide Susceptibility Mapping. Geocarto Int. 2017, 32, 619–639. [Google Scholar] [CrossRef]
- Moosavi, V.; Niazi, Y. Development of Hybrid Wavelet Packet-Statistical Models (WP-SM) for Landslide Susceptibility Mapping. Landslides 2016, 13, 97–114. [Google Scholar] [CrossRef]
- Shirzadi, A.; Chapi, K.; Shahabi, H.; Solaimani, K.; Kavian, A.; Ahmad, B.B. Rock Fall Susceptibility Assessment along a Mountainous Road: An Evaluation of Bivariate Statistic, Analytical Hierarchy Process and Frequency Ratio. Environ. Earth Sci. 2017, 76, 152. [Google Scholar] [CrossRef]
- Henriques, C.; Zêzere, J.L.; Marques, F. The Role of the Lithological Setting on the Landslide Pattern and Distribution. Eng. Geol. 2015, 189, 17–31. [Google Scholar] [CrossRef]
- Kim, K.-S.; Song, Y.-S. Geometrical and Geotechnical Characteristics of Landslides in Korea under Various Geological Conditions. J. Mt. Sci. 2015, 12, 1267–1280. [Google Scholar] [CrossRef]
- Guzzetti, F.; Peruccacci, S.; Rossi, M.; Stark, C.P. Rainfall Thresholds for the Initiation of Landslides in Central and Southern Europe. Meteorol. Atmos. Phys. 2007, 98, 239–267. [Google Scholar] [CrossRef]
- Hadji, R.; Chouabi, A.; Gadri, L.; Raïs, K.; Hamed, Y.; Boumazbeur, A. Application of Linear Indexing Model and GIS Techniques for the Slope Movement Susceptibility Modeling in Bousselam Upstream Basin, Northeast Algeria. Arab. J. Geosci. 2016, 9, 192. [Google Scholar] [CrossRef]
- Cellek, S. The Effect of Aspect on Landslide and Its Relationship with Other Parameters. In Landslides; IntechOpen: London, UK, 2021. [Google Scholar]
- Singh, K.; Kumar, V. Hazard Assessment of Landslide Disaster Using Information Value Method and Analytical Hierarchy Process in Highly Tectonic Chamba Region in Bosom of Himalaya. J. Mt. Sci. 2018, 15, 808–824. [Google Scholar] [CrossRef]
- Panchal, S.; Shrivastava, A.K. Landslide Hazard Assessment Using Analytic Hierarchy Process (AHP): A Case Study of National Highway 5 in India. Ain. Shams Eng. J. 2022, 13, 101626. [Google Scholar] [CrossRef]
- R Core Team. R: A Language and Environment for Statistical Computing; R Foundation for Statistical Computing: Vienna, Austria, 2021. [Google Scholar]
- LPDAAC. ASTER Global Digital Elevation Model V003 [Dataset]. NASA EOSDIS Land Processes Distributed Active Archive Center. 2019. Available online: https://lpdaac.usgs.gov/products/astgtmv003/ (accessed on 18 October 2022).
- Fick, S.E.; Hijmans, R.J. WorldClim 2: New 1 km spatial resolution climate surfaces for global land areas. Int. J. Climatol. 2017, 27, 4302–4315. [Google Scholar] [CrossRef]
- ICIMOD. Geology of Nepal [Dataset]. 2020. Available online: https://rds.icimod.org/home/datadetail?metadataid=2521 (accessed on 27 April 2022).
- ESRI. Sentinel-2 10-Meter Land Use/Land Cover [Dataset]. 2020. Available online: https://livingatlas.arcgis.com/landcover (accessed on 22 May 2022).
- OCHA Nepal. Nepal Road Network [Dataset]. Humanitarian Data Exchange. 2021. Available online: https://data.humdata.org/dataset/nepal-road-network (accessed on 18 October 2022).
- Signorell, A.; Aho, K.; Alfons, A.; Anderegg, N.; Aragon, T.; Arppe, A.; Baddeley, A.; Barton, K.; Bolker, B.; Borchers, H.W. DescTools: Tools for Descriptive Statistics; R Package Version 0.99; R Project: Vienna, Austria, 2018; Volume 28, p. 17. [Google Scholar]
- Racine, J.S. Rstudio: A Platform-Independent Ide for R and Sweave. J. Appl. Econom. 2012, 27, 167–172. [Google Scholar] [CrossRef]
- Boomsma, A. Regression Diagnostics with R. In Department of Statistics & Measurement Theory; University of Groningen: Groningen, The Netherlands, 2014. [Google Scholar]
- Chatterjee, S.; Hadi, A.S. Regression Diagnostics: Detection of Model Violations. In Regression Analysis by Example; John Wiley & Sons, Ltd.: Hoboken, NJ, USA, 2015; pp. 85–120. ISBN 978-0-470-05546-5. [Google Scholar]
- Hosmer, D.W., Jr. Model-Building Strategies and Methods for Logistic Regression. Appl. Logist. Regres. 2013, 22, 89–151. [Google Scholar]
- Bhandari, B.; Dhakal, S. Lithological Control on Landslide in the Babai Khola Watershed, Siwaliks Zone of Nepal. Am. J. Earth Sci. 2018, 5, 54–64. [Google Scholar]
- Upreti, B.N. An Overview of the Stratigraphy and Tectonics of the Nepal Himalaya. J. Asian Earth Sci. 1999, 17, 577–606. [Google Scholar] [CrossRef]
- Dhakal, S. Geological Divisions and Associated Hazards in Nepal. In Contemporary Environmental Issues and Methods in Nepal; Tribhuvan University: Kirtipur, Nepal, 2014; pp. 100–109. [Google Scholar]
- McAdoo, B.G.; Quak, M.; Gnyawali, K.R.; Adhikari, B.R.; Devkota, S.; Rajbhandari, P.L.; Sudmeier-Rieux, K. Roads and Landslides in Nepal: How Development Affects Environmental Risk. Nat. Hazards Earth Syst. Sci. 2018, 18, 3203–3210. [Google Scholar] [CrossRef]
- Lee, S. Geological Application of Geographic Information System. Korea Inst. Geosci. Min. Resour. 2014, 9, 109–118. [Google Scholar]
- Ramli, M.F.; Yusof, N.; Yusoff, M.K.; Juahir, H.; Shafri, H.Z.M. Lineament Mapping and Its Application in Landslide Hazard Assessment: A Review. Bull Eng. Geol. Environ. 2010, 69, 215–233. [Google Scholar] [CrossRef]
- Saha, A.; Saha, S. Comparing the Efficiency of Weight of Evidence, Support Vector Machine and Their Ensemble Approaches in Landslide Susceptibility Modelling: A Study on Kurseong Region of Darjeeling Himalaya, India. Remote Sens. Appl. Soc. Environ. 2020, 19, 100323. [Google Scholar] [CrossRef]
- Gurung, A.; Bista, R.; Karki, R.; Shrestha, S.; Uprety, D.; Oh, S.E. Community-Based Forest Management and Its Role in Improving Forest Conditions in Nepal. Small-Scale For. 2013, 12, 377–388. [Google Scholar] [CrossRef]
- Ghimire, M. Landslide Occurrence and Its Relation with Terrain Factors in the Siwalik Hills, Nepal: Case Study of Susceptibility Assessment in Three Basins. Nat. Hazards 2011, 56, 299–320. [Google Scholar] [CrossRef]
- Cheng, Y.-S.; Yu, T.-T.; Son, N.-T. Random Forests for Landslide Prediction in Tsengwen River Watershed, Central Taiwan. Remote Sens. 2021, 13, 199. [Google Scholar] [CrossRef]
- Du, J.; Glade, T.; Woldai, T.; Chai, B.; Zeng, B. Landslide Susceptibility Assessment Based on an Incomplete Landslide Inventory in the Jilong Valley, Tibet, Chinese Himalayas. Eng. Geol. 2020, 270, 105572. [Google Scholar] [CrossRef]
- Gautam, A.P.; Shivakoti, G.P.; Webb, E.L. A Review of Forest Policies, Institutions, and Changes in the Resource Condition in Nepal. Int. For. Rev. 2004, 6, 136–148. [Google Scholar] [CrossRef]
- Måren, I.E.; Karki, S.; Prajapati, C.; Yadav, R.K.; Shrestha, B.B. Facing North or South: Does Slope Aspect Impact Forest Stand Characteristics and Soil Properties in a Semiarid Trans-Himalayan Valley? J. Arid. Environ. 2015, 121, 112–123. [Google Scholar] [CrossRef]
- Kayastha, P.; Dhital, M.R.; De Smedt, F. Application of the Analytical Hierarchy Process (AHP) for Landslide Susceptibility Mapping: A Case Study from the Tinau Watershed, West Nepal. Comput. Geosci. 2013, 52, 398–408. [Google Scholar] [CrossRef]
- Zekkos, D.; Clark, M.; Whitworth, M.; Greenwood, W.; West, A.J.; Roback, K.; Li, G.; Chamlagain, D.; Manousakis, J.; Quackenbush, P.; et al. Observations of Landslides Caused by the April 2015 Gorkha, Nepal, Earthquake Based on Land, UAV, and Satellite Reconnaissance. Earthq. Spectra 2017, 33, 95–114. [Google Scholar] [CrossRef]
- Alimohammadlou, Y.; Najafi, A.; Yalcin, A. Landslide Process and Impacts: A Proposed Classification Method. Catena 2013, 104, 219–232. [Google Scholar] [CrossRef]
- Haigh, M.J.; Rawat, J.S.; Rawat, M.S.; Bartarya, S.K.; Rai, S.P. Interactions between Forest and Landslide Activity along New Highways in the Kumaun Himalaya. For. Ecol. Manag. 1995, 78, 173–189. [Google Scholar] [CrossRef]
- Schmaltz, E.M.; Steger, S.; Glade, T. The Influence of Forest Cover on Landslide Occurrence Explored with Spatio-Temporal Information. Geomorphology 2017, 290, 250–264. [Google Scholar] [CrossRef]
- Baral, S.; Vacik, H. What Governs Tree Harvesting in Community Forestry-Regulatory Instruments or Forest Bureaucrats’ Discretion? Forests 2018, 9, 649. [Google Scholar] [CrossRef]
- Dahal, R.K.; Hasegawa, S.; Bhandary, N.P.; Poudel, P.P.; Nonomura, A.; Yatabe, R. A Replication of Landslide Hazard Mapping at Catchment Scale. Geomat. Nat. Hazards Risk 2012, 3, 161–192. [Google Scholar] [CrossRef]
- Gyawali, P.; Tamrakar, N.K. Landslide Susceptibility Assessment of the Chure Khola Catchment Area of the Siwalik Region, Central Nepal. J. Nepal Geol. Soc. 2018, 56, 19–30. [Google Scholar] [CrossRef]

| Estimate | Std. Error | z Value | Pr (>|z|) | |
|---|---|---|---|---|
| (Intercept) | −5.25 | 3.62 × 10⁻¹ | −14.503 | <2.00 × 10⁻¹⁶ *** |
| Curvature | −2.07 × 10⁻² | 1.80 × 10⁻² | −1.155 | 0.248151 |
| Digital elevation model | 1.32 × 10⁻³ | 1.91 × 10⁻⁴ | 6.903 | 5.08 × 10⁻¹² *** |
| Drainage density | −1.37 × 10⁻⁵ | 4.68 × 10⁻⁵ | −0.292 | 0.770134 |
| Lineament | −5.83 × 10⁻¹ | 8.50 × 10⁻² | −6.86 | 6.91 × 10⁻¹² *** |
| Rainfall | 1.46 × 10⁻³ | 2.04 × 10⁻⁴ | 7.168 | 7.63 × 10⁻¹³ *** |
| Relief | 6.42 × 10⁻³ | 1.93 × 10⁻³ | 3.324 | 0.000889 *** |
| slope | −1.09 × 10⁻⁴ | 1.90 × 10⁻⁵ | −5.719 | 1.07 × 10⁻⁸ *** |
| Solar | 2.01 × 10⁻² | 2.80 × 10⁻³ | 7.171 | 7.44 × 10⁻¹³ *** |
| Topographical wetness index | 4.31 × 10⁻⁴ | 1.05 × 10⁻² | 0.041 | 0.96737 |
| Middle Siwalik | −5.94 × 10⁻¹ | 6.84 × 10⁻² | −8.673 | <2.00 × 10⁻¹⁶ *** |
| Upper Siwalik | −1.20 | 1.25 × 10⁻¹ | −9.636 | <2.00 × 10⁻¹⁶ *** |
| Quaternary | −1.32 | 2.66 × 10⁻¹ | −4.965 | 6.87 × 10⁻⁷ *** |
| Area of water bodies | 1.24 × 10⁻⁶ | 4.79 × 10⁻⁷ | −2.587 | 0.009679 ** |
| Area of forest | 2.73 × 10⁻⁷ | 2.72 × 10⁻⁸ | 10.03 | <2.00 × 10⁻¹⁶ *** |
| Area of grassland | 2.21 × 10⁻⁵ | 5.07 × 10⁻⁶ | 4.35 | 1.36 × 10⁻⁵ *** |
| Area of agricultural land | 6.63 × 10⁻⁷ | 2.39 × 10⁻⁷ | 2.779 | 0.005454 ** |
| Area of bare ground | 2.08 × 10⁻⁶ | 8.61 × 10⁻⁷ | 2.414 | 0.015764 * |
| Area of shrubland | 3.84 × 10⁻⁷ | 8.51 × 10⁻⁸ | 4.51 | 6.49 × 10⁻⁶ *** |
| Distance from road | −3.06 × 10⁻⁶ | 1.73 × 10⁻⁵ | −0.177 | 0.859502 |
| Risk Zone | Dang (km2) | Surkhet (km2) | Total |
|---|---|---|---|
| Very high | 360 (23.32%) | 54 (5.22%) | 414 (16.05%) |
| High | 994 (64.38%) | 799 (77.20%) | 1793 (69.52%) |
| Moderate | 159 (10.30%) | 154 (14.88%) | 313 (12.14%) |
| Low | 31 (2.01%) | 27 (2.61%) | 58 (2.25%) |
| Very low | 0 | 1 (0.1%) | 1 (0.04%) |
| Total (km2) | 1544 | 1035 | 2579 |
Disclaimer/Publisher’s Note: The statements, opinions and data contained in all publications are solely those of the individual author(s) and contributor(s) and not of MDPI and/or the editor(s). MDPI and/or the editor(s) disclaim responsibility for any injury to people or property resulting from any ideas, methods, instructions or products referred to in the content. |
© 2023 by the authors. Licensee MDPI, Basel, Switzerland. This article is an open access article distributed under the terms and conditions of the Creative Commons Attribution (CC BY) license (https://creativecommons.org/licenses/by/4.0/).
Share and Cite
Thapa, P.B.; Lamichhane, S.; Joshi, K.P.; Regmi, A.R.; Bhattarai, D.; Adhikari, H. Landslide Susceptibility Assessment in Nepal’s Chure Region: A Geospatial Analysis. Land 2023, 12, 2186. https://doi.org/10.3390/land12122186
Thapa PB, Lamichhane S, Joshi KP, Regmi AR, Bhattarai D, Adhikari H. Landslide Susceptibility Assessment in Nepal’s Chure Region: A Geospatial Analysis. Land. 2023; 12(12):2186. https://doi.org/10.3390/land12122186
Chicago/Turabian StyleThapa, Purna Bahadur, Saurav Lamichhane, Khagendra Prasad Joshi, Aayoush Raj Regmi, Divya Bhattarai, and Hari Adhikari. 2023. "Landslide Susceptibility Assessment in Nepal’s Chure Region: A Geospatial Analysis" Land 12, no. 12: 2186. https://doi.org/10.3390/land12122186
APA StyleThapa, P. B., Lamichhane, S., Joshi, K. P., Regmi, A. R., Bhattarai, D., & Adhikari, H. (2023). Landslide Susceptibility Assessment in Nepal’s Chure Region: A Geospatial Analysis. Land, 12(12), 2186. https://doi.org/10.3390/land12122186