Article

Vegetation Fires in the Lubumbashi Charcoal Production Basin (The Democratic Republic of the Congo): Drivers, Extent and Spatiotemporal Dynamics

by
Yannick Useni Sikuzani
1,2,
Médard Mpanda Mukenza
3,4,*,
Héritier Khoji Muteya
1,
Nadège Cirezi Cizungu
4,5,
François Malaisse
6 and
Jan Bogaert
6,*
1
Unité Ecologie, Restauration Ecologique et Paysage, Faculté des Sciences Agronomiques, Université de Lubumbashi, Lubumbashi P.O. Box 1825, Democratic Republic of the Congo
2
Centre de Compétences en Planification et Gestion Urbaine, Université de Lubumbashi, Lubumbashi P.O. Box 1825, Democratic Republic of the Congo
3
Département de Gestion des Ressources Naturelles Renouvelables, Faculté des Sciences Agronomiques, Université Technologique Katumba Mwanke, Lubumbashi P.O. Box 74, Democratic Republic of the Congo
4
Ecole Régionale Post-Universitaire d’Aménagement et Gestion Intégrés des Forêts et Territoires Tropicaux (ERAIFT), Kinshasa P.O. Box 15373, Democratic Republic of the Congo
5
Département d’Environnement et de Gestion des Ressources Naturelles, Faculté des Sciences Agronomiques et de l’environnement, Université Evangélique en Afrique, Bukavu P.O. Box 3323, Democratic Republic of the Congo
6
Unité Biodiversité et Paysage, Gembloux Agro-Bio Tech, Université de Liège, 5030 Gembloux, Belgium
*
Authors to whom correspondence should be addressed.
Land 2023, 12(12), 2171; https://doi.org/10.3390/land12122171
Submission received: 20 November 2023 / Revised: 10 December 2023 / Accepted: 13 December 2023 / Published: 15 December 2023

Abstract

:
In the Lubumbashi charcoal production basin (LCPB) in Southeastern DR Congo, agricultural and charcoal production activities regularly give rise to fires that lead to considerable degradation of the miombo open forest. This study analyzes the drivers of the spatiotemporal distribution of active fires and burnt areas in the LCPB by processing MODIS and Landsat data. In addition, a kernel density analysis method (KDE) was used to estimate fire risk, while the effect of the road network and dwellings on vegetation fires was highlighted in areas between a 0 and 3000 m radius. The obtained results revealed that fires in the LCPB generally occur between April and November, mainly during the day, between 11 a.m. and 12 p.m. These fires are concentrated in the central and southwestern part of the LCPB, more specifically in the savannahs and near roads. From 2002 to 2022, an average of 11,237 active fires and an average of 6337 km2 of burnt areas were recorded in the LCPB. Each year, these fires peak in August, and despite their steady decline, the few fires that have affected the forests have caused more devastation (more than 2790 km2/year) than those observed in the fields and savannah. These figures highlight the imperative need to put in place fire prevention and management measures in the LCPB, with particular emphasis on awareness, monitoring, and fire-fighting measures.

1. Introduction

Forests are crucial for the planet and humanity. They provide both essential resources and ecosystem services [1,2,3]. For a long time, in the tropics, because of land cover/use changes to meet the various needs of humans [4,5], these ecosystems have experienced alarming degradation, threatening environmental stability and the survival of many species [6]. Hence, for example, the orangutan (Pongo pygmaeus L.) and the Bali lion (Panthera leo L.) have suffered the loss of their natural habitat as a result of deforestation, leading to their disappearance [6,7].
According to Ref. [8], 178 million hectares of the world’s forest area disappeared between 1990 and 2020. And currently, nearly 30% of the remaining forests are seriously degraded, mainly due to uncontrolled deforestation and shifting cultivation [8,9]. In Africa, small-scale processes such as slash-and-burn agriculture are mainly responsible for regional deforestation and forest degradation [10,11]. Indeed, recent research continues to highlight the extent of the damage caused by agricultural expansion, deforestation, and climate change on forest resources [8,10,12,13]. In addition, wildfire is seen as one of the main agents of disturbance and stress in the various biomes [14].
Human influence on fire regimes, resulting from both natural and manmade causes, varies greatly according to the region around the world [14]. Furthermore, the characteristics of wildfires, such as type, intensity, spread, and temporal distribution, depend on several factors, including climate, fuel load, and continuity, as well as start sources, such as roads and villages [15]. In many tropical forests, road establishment is perceived as one of the major factors facilitating timber exploitation and habitat fragmentation [16]. Associated with villages, roads are recognized as huge sources of degradation of natural ecosystems [17]. Africa is the most active continent, with a high frequency of bushfires (around 28,000 per year) [18,19], which affect the terrestrial landscape over large areas and modify the diversity, distribution, and composition of species [20,21]. The Democratic Republic of the Congo (DR Congo), where an average of 2824 fires a year were recorded between 1996 and 2001, is no exception [19].
In the DR Congo, each fire and its use have different impacts on the ecosystem and on communities since fire is both a beneficial tool and a threat to the ecosystem. Indeed, when used correctly and strategically, bushfires can improve the health of the ecosystem and reduce its impact on climate change [22]. On the other hand, bushfires can be destructive, particularly when used to clear new agricultural plots in forest areas and along gallery forests. Furthermore, if used repeatedly, fire can contribute to the destruction of savannahs [19]. In the DR Congo, anthropogenic fires are the result of different land management objectives and depend on the location and specific context [19]. The pressures exerted by human activity on the forests are having disastrous consequences, amplified by an ever-growing population [22]. Indeed, the rate of deforestation in the country has increased considerably, rising from 0.11% between 1990 and 2000 to 0.22% between 2000 and 2005 [23]. However, between 2001 and 2022, the country lost about 18.4 million hectares of forest cover, corresponding to a decrease of 9.2% since 2000. This translates into a deforestation rate of around 0.4% per year [24]. In addition, forests, which play a crucial role at the local, regional, and global level, face constant threats [25].
In the southeastern part of the DR Congo, the Katangese Copperbelt area has been one of the most active mining regions for more than 100 years and contributes to demographic explosion [26]. At the same time, this area is crisscrossed by the miombo woodland, which is rich in endemism and ecosystem services provided to local communities. Miombo is a type of open forest characterized by sparse shrub vegetation dominated by trees with contiguous crowns and light foliage belonging to the genera Brachystegia, Julbernadia and Isoberlinia [27]. It also includes sparse herbaceous vegetation where daylight penetrates, giving a clear and luminous appearance [27]. Intensive mining activities and increasing urbanization [26,27], combined with high energy and food demand [28], strongly contribute to the deterioration of the miombo in the rural zone of Lubumbashi [29,30,31], referred to as the Lubumbashi charcoal production basin (LCPB).
The LCPB is heavily dependent on agriculture and charcoal production, resulting in the continuous exploitation of forest resources [32]. Also, long abandoned in a state of accelerated degradation, the main roads are increasingly undergoing modernization, leading to the creation of several small charcoal traders and farmers. Ref. [33] considers that the landscape dynamics of the miombo’s forest ecosystems are strongly influenced by logging and the expansion of agriculture, as well as by the vegetation fires that regularly escape from farming activities and charcoal production [34]. Indeed, with more than 3 million inhabitants in 2020, the electricity production and distribution are insufficient to meet the households needs in the city of Lubumbashi in a context where mining companies are favored. Consequently, charcoal has become the primary domestic energy source, meeting the demands of over 72% of households [35]. However, repeated human-induced vegetation fires caused by agriculture, charcoal production, or, rarely, hunting, have contributed changes in the landscape’s configuration [34].
In the case of the LCPB, it is very crucial to monitor the spread of vegetation fires in order to better understand their impact on vegetation [36,37,38]. In this context, an approach integrating landscape analysis of fires and land cover categories based on remote sensing data, combined with geographic information systems (GISs) and landscape ecology analysis tools, is essential [34]. By adopting this multidisciplinary approach, it is possible to effectively monitor phenomena at different spatiotemporal scales, such as bushfires and deforestation [39,40]. These are particularly interesting tools for resource management, enabling the different components of the landscape to be understood in their mutual eco-geographical relationships [41,42]. Also, remote sensing remains an approach that provides large-scale data. These capabilities enable a better understanding of landscape changes and guide decision making in land management and environmental conservation [43].
This paper aims to analyze the impact of vegetation fires in the LCPB, examining their causes and spatiotemporal dynamics. We verify whether agricultural activities, charcoal production, and the road network in the LCPB contribute to the increase in vegetation fires that degrade forests through savannization.

2. Materials and Methods

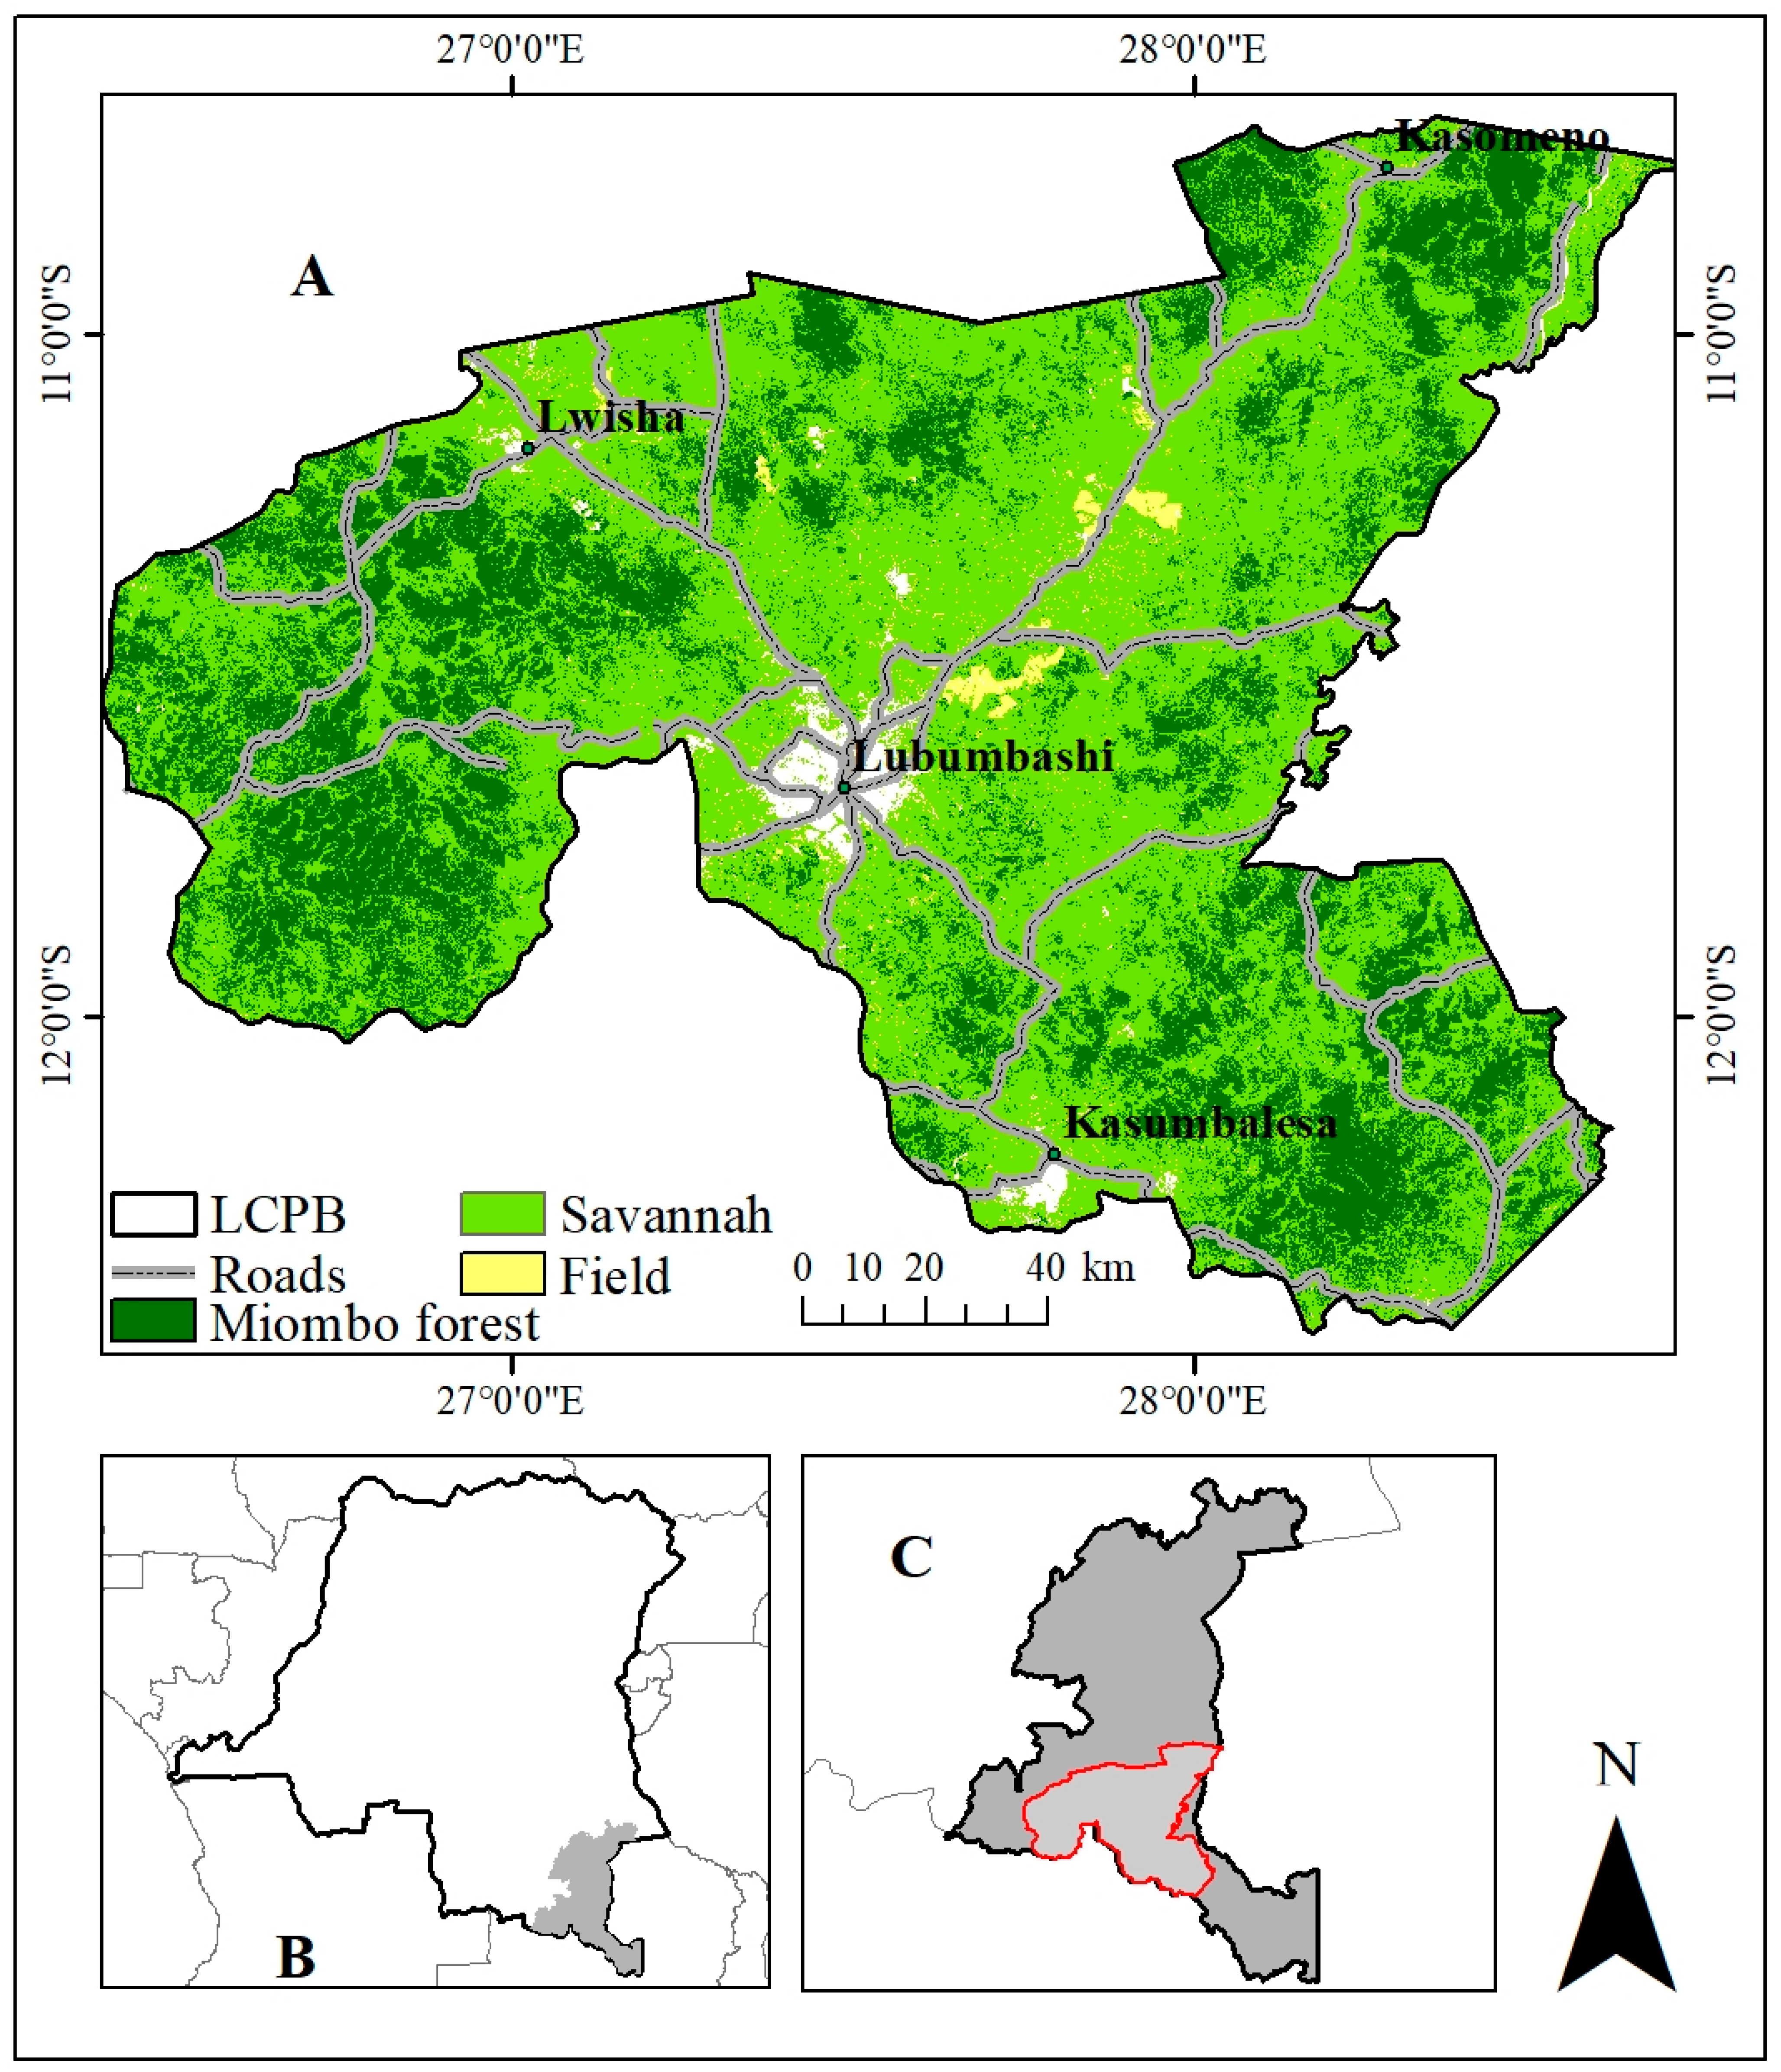
2.1. Biophysical Description of the Study Area

This study took place in the LCPB, located in the southeast of the Democratic Republic of Congo (DRC), with the geographical coordinates 10°39′7.47″–12°26′37.61″ S and 26°20′54.95″–28°40′13.55″ E (Figure 1) [32]. The LCPB covers an area of approximately 26,603.4 km2 and has a Cw-type climate according to the Köppen classification [44]. The region experiences a rainy season from November to March and a dry season from May to September, with April and October constituting a transitional period between the two seasons [45].
Annual rainfall in the LCPB is estimated to be around 1270 mm, and the average annual temperature is around 20 °C [46]; however, recent climate warming has been observed [47]. The prevailing winds in the region are generally trade winds, blowing from southeast to east and then from northeast to east [26]. The natural vegetation in the region is miombo woodland, but this is currently fragmented and often replaced by savannah [48,49]. The predominant soil cover is ferralitic, with an average pH of around 5.2 [47]. The LCPB is home to several socioeconomic activities, including industrial and artisanal mining, agriculture, charcoal production, residential livestock farming, and trade, which are essential for local people [48,50]. It faces several challenges, including rapid population growth and the failure of state services [50]. Since the election of provincial governors in 2006, a number of roads linking the city of Lubumbashi to the territories have been built, boosting the expansion and creation of villages in LCPB.

2.2. Methods

2.2.1. Data

In this study, Landsat images were used to study land cover. The Google Earth Engine (GEE) platform, which offers easy and instant access to satellite data, as well as the computing resources required for online preprocessing [51], was used. For this reason, Landsat images (30 m spatial resolution) acquired in the dry season (June–August) were emanated from the Landsat 5 Thematic Mapper (TM) sensors for the years 2002, 2004, and 2007; Landsat 7 Enhanced Thematic Mapper plus (ETM+) for the year 2010; and Landsat 8 Operational Land Imager (OLI) for the years 2013, 2016, 2019, and 2022. A total of eight images were selected. These are surface reflectance data from the Level 2 Collection 2 Tier 1 datasets that were collected over a time step varying between 2 and 3 years, depending on their availability and quality and, above all, on the objectives of the study [48]. It is important to note that the years in which the images were acquired coincided with periods of significant growth in human activity in the region. The years 2002 to 2007 represent the period following the liberalization of the mining sector, while 2010 to 2013 correspond to the period after the global financial crisis. Finally, the years 2016 to 2022 mark the period following the dismemberment of provinces in the DR Congo. Also, the discarded dates of images do not show much change compared to the nearby posted dates; consequently, they were removed from the analysis.
To analyze bushfire dynamics, active fire points and MODIS image time series (MCD64A1) corresponding to burnt areas were used [52]. These data were collected from https://earthdata.nasa.gov/firms and https://search.earthdata.nasa.gov/, respectively, on 26 May 2023. The MODIS fire points have a spatial resolution of 1 kilometer, while the MODIS images have a spatial resolution of 500 m. Each 500 m pixel contains information on the presence or absence of burnt surfaces, as well as an approximation of the date of the fire’s passage during the month analyzed.

2.2.2. Preprocessing of Landsat Images

Radiometric preprocessing through Google Earth Engine was carried out to correct the spatial discontinuity that appeared in May 2003 due to a failure of the Landsat 7 Scan Line Corrector (SLC) that resulted in a loss of approximately 22% of the data in each image scene. To overcome this limitation, a technique based on the application of the “gap mask” was used [53], which made it possible to recover missing data, thus ensuring the reliability and accuracy of subsequent analyses [53].

2.2.3. Landsat Image Classification and Validation

A false-color composite of Landsat images was produced using the mid-infrared, near-infrared, and red bands in order to better discriminate among vegetation types [54]. This color composite was used to distinguish the different objects present in the images in order to facilitate their interpretation. Land cover units were identified and coded on the different scenes. For each land cover unit, training areas (ROIs) were delineated for each study year at the size of a pixel throughout the dry season. These areas were selected using sampling polygons, avoiding transition zones in order to minimize the pixel phenomenon. These ROIs were then used to create a model for training the Random Forest based on an ensemble approach using several decision trees. This structure reduces classification errors and increases prediction accuracy [55]. Its concours to the creation of decision trees [56]. Four land cover types were selected in line with the objective of the study (Table 1). This image classification was carried out in order to determine the land cover types in which the vegetation fires had spread. To check the accuracy of the resulting classifications, we followed the best practice recommendations [57], constructing unbiased area estimators and estimating uncertainty (Table 2 and Table 3). To do this, a sample of reference observations was collected on the change maps included between 2002 and 2022, based on local knowledge, visual appreciation of Google Earth images, and exchanges with the local population.

2.3. Analysis of Vegetation Fires in the LCPB

2.3.1. Distribution and Destructive Power

To analyze the distribution of bushfires at different temporal scales, we filtered the MODIS data. Only fire points (96% of the total number) with a confidence level greater than 30% were included in our analyses to guarantee the reliability of the results. In addition, we used the value of radiative power expressed in megawatts (MW) to assess the destructive potential of fires and classify them into different categories—very low to low, moderate, and high—according to the methodology of Ref. [58]. For the daily fire analysis, we took into account the times of satellite detection in the area, namely 8 a.m., 9 a.m., 11 a.m., midday, and 8 p.m. Using these data, we created a fire density map using the non-parametric kernel density estimation method, a technique recognized for its flexibility, spatial accuracy, and ability to track fire clusters over time and space [59]. The fire density map enabled us to visualize the spatial clustering of fires in the LCPB region and to distinguish hot zones, with a high density of fires, from cold zones, with a low density [60]. This approach offers valuable information on fire distribution and provides a better understanding of the spatiotemporal patterns of bushfires in the study area.

2.3.2. Quantifying the Spatiotemporal Dynamics of Burnt Areas and Assessing Their Impact

The spatiotemporal analysis of burnt areas was carried out by extracting fire values from MODIS images, using ArcGIS 10.8 software [61]. MODIS data over a one-month period are presented as a series of images with different information, such as unburnt areas, approximate fire days corresponding to the Gregorian calendar, snow or high aerosol concentrations, continental water, marine water (sea and ocean), and areas not classified due to a lack of data. Therefore, only pixel values between 1 and 366, which provide fire information, were used in this study [62]. Using the shapefile, the study area was cropped onto the MODIS map layers, making it possible to obtain initial statistics on the burnt areas [61]. The cropped images were then projected in UTM 35 S projection (corresponding to the study area) and converted into shapefile format, keeping the pixel size at 500 m. For the subsequent processing of the time series of burnt areas, a spatial and temporal aggregation of the pixels was performed in order to obtain an image of the study area [63]. This allowed coherent fire events to be formed by applying two fundamental rules [63]: (1) pixels must be adjacent to each other or at a maximum distance of 1 pixel to minimize inaccuracies related to the spatial resolution of the sensor, such as partial burns (spatial rule); and (2) pixels must present fire dates with a maximum temporal distance of 16 days (temporal rule). This rule is based on the accuracy interval of 8 days before and after the fire detection date. In addition, a geospatial analysis (GIS cross-referencing) was carried out to study the location of fires and the distribution of burnt areas on the land cover in the LCPB. The vector layer of fire points, maps of burnt areas, and land cover were overlaid for each year (2002, 2004, 2007, 2010, 2013, 2016, 2019, and 2022) on ArcGIS 10.8 software. Then, using the same software, the fire points and burnt areas per year in each land cover, were extracted.

2.3.3. Determination of the Impact of the Road Network and Dwellings on the Spread of Fires in the LCPB

ArcGIS 10.8 software was used to create buffer zones that were intended to assess the influence of different distances from the road network and villages on the spread of fires and burnt areas. To avoid overlap, these buffer zones were defined at distances of 0 to 1000 m, 1000 to 2000 m, and 2000 to 3000 m radius. It was important to include both the main and secondary roads in the region in the analysis, with the main roads often being important access routes for a number of types of human traffic, while secondary roads can facilitate the dispersal of flames in different directions. As for villages, the population density was used as a selection criterion, and five villages with a relatively high population density were chosen [64]. This approach allows for the quantification of fire frequency as a function of distance from roads and villages. As the data collected did not follow a normal distribution, we used the Kruskal–Wallis test, the non-parametric equivalent of ANOVA, to compare the fire frequencies observed at different distances.

3. Results

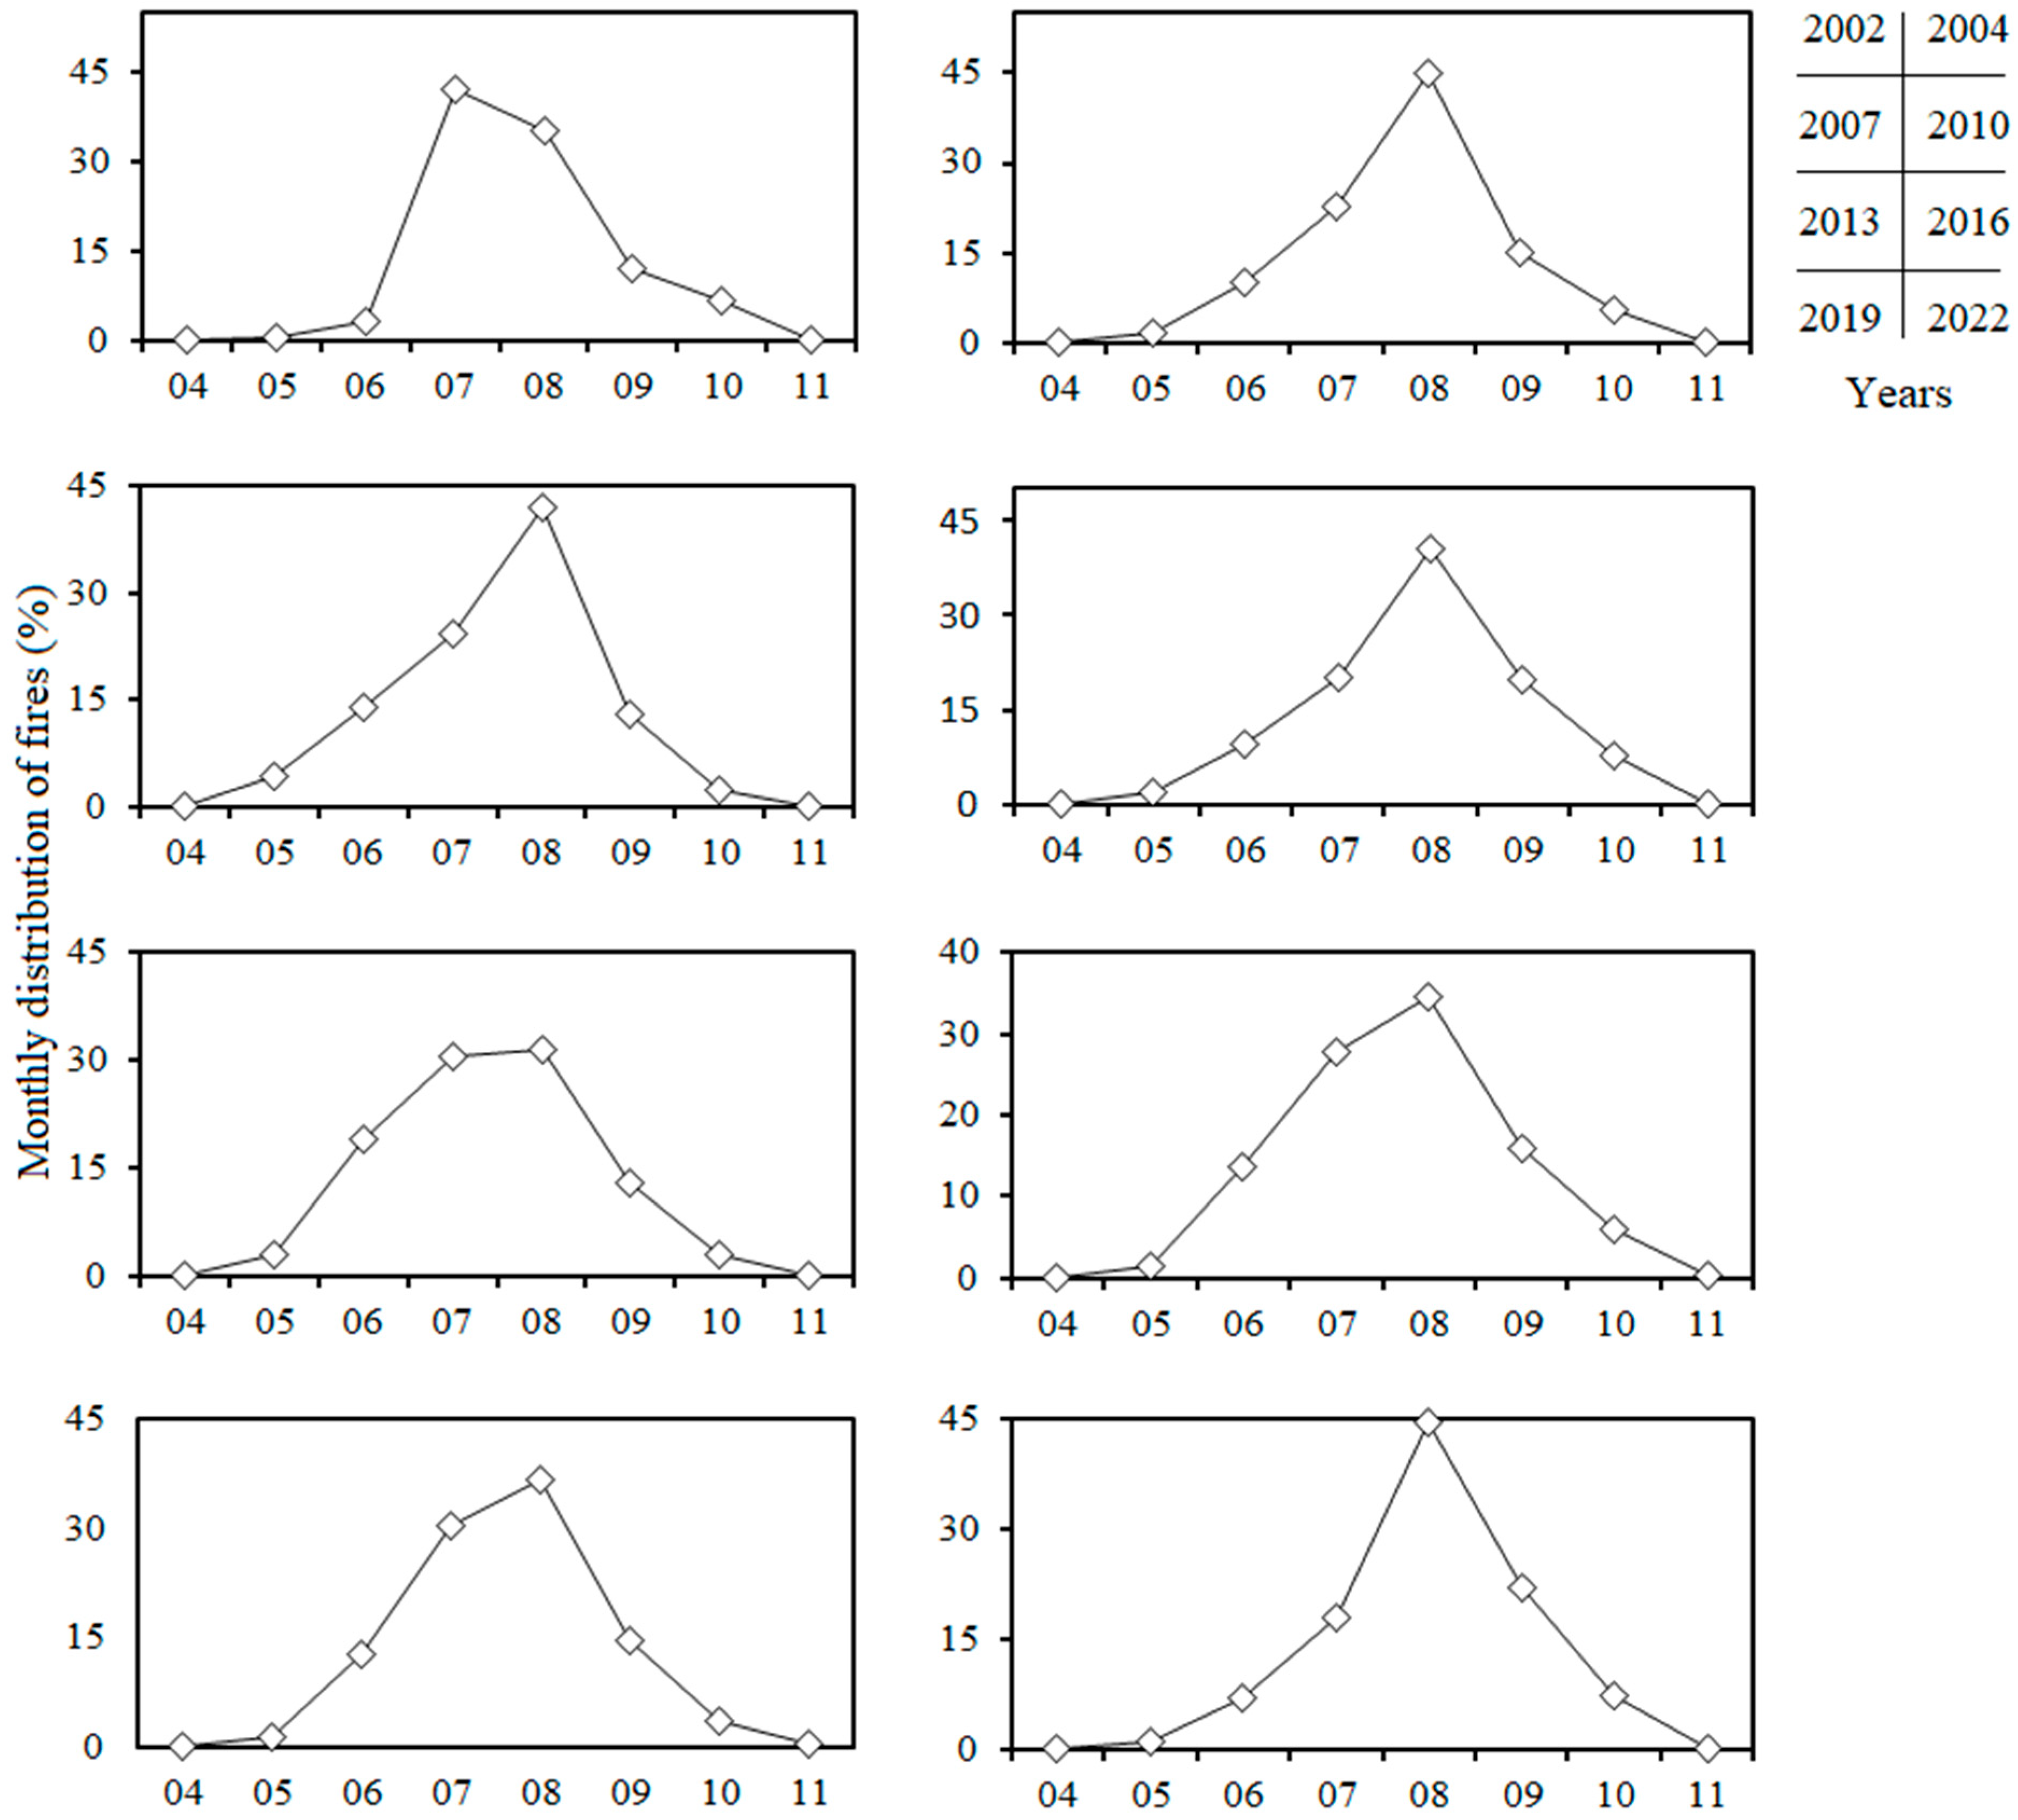
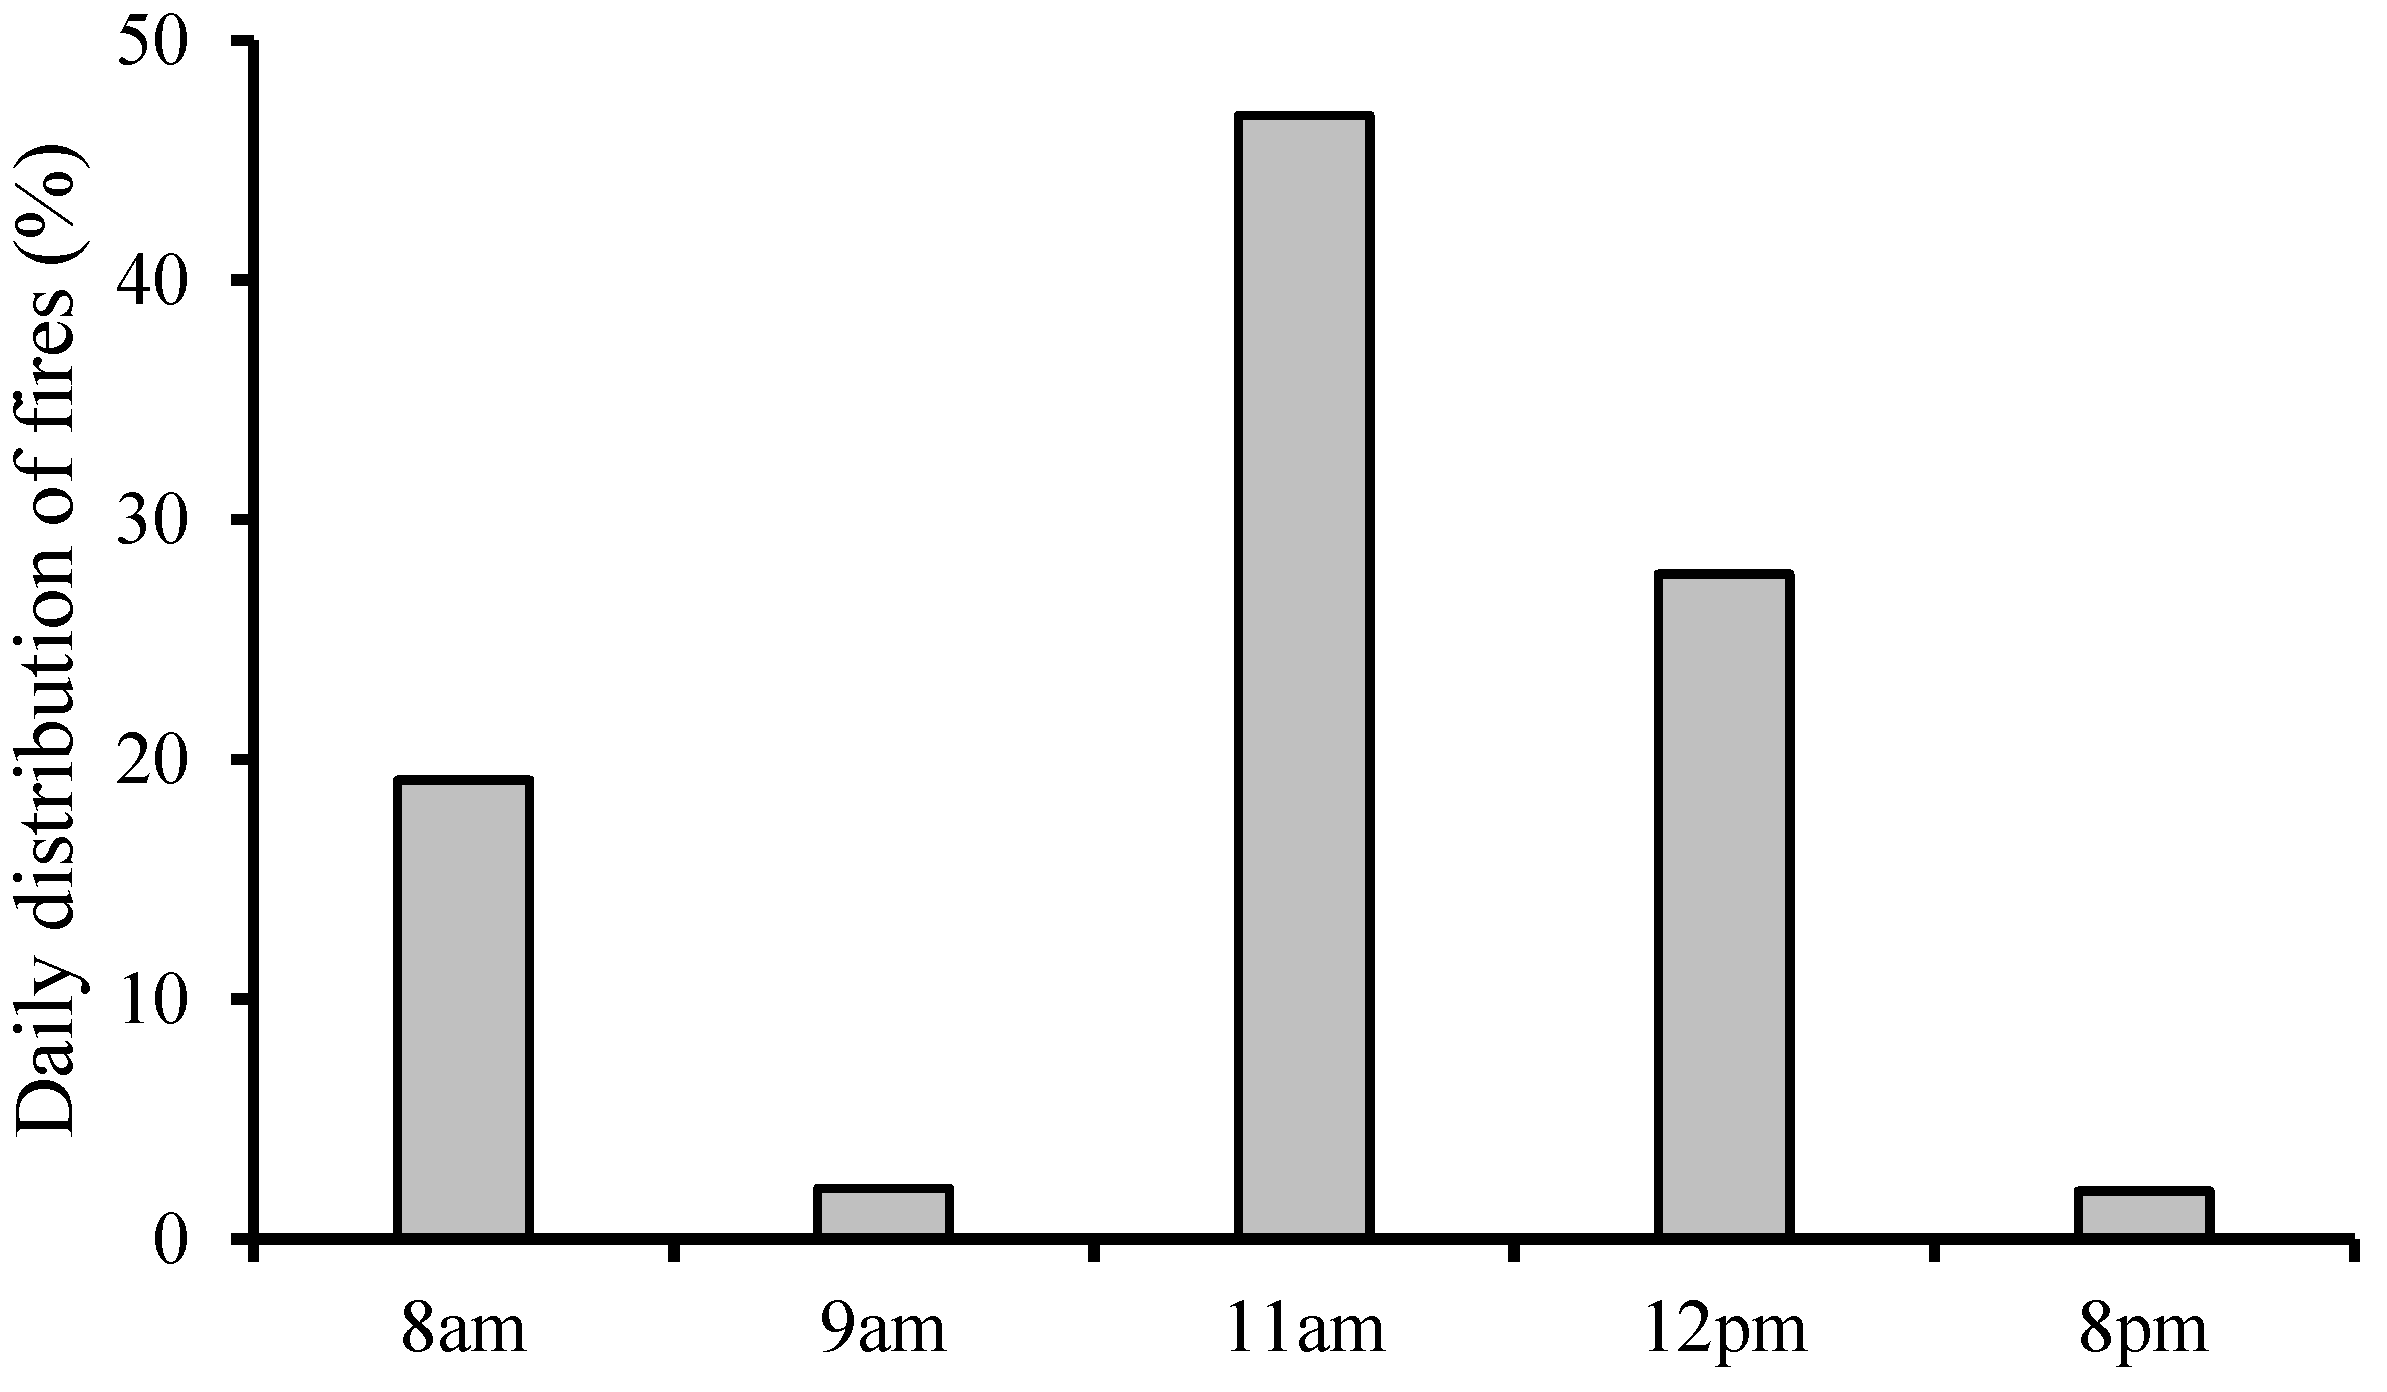
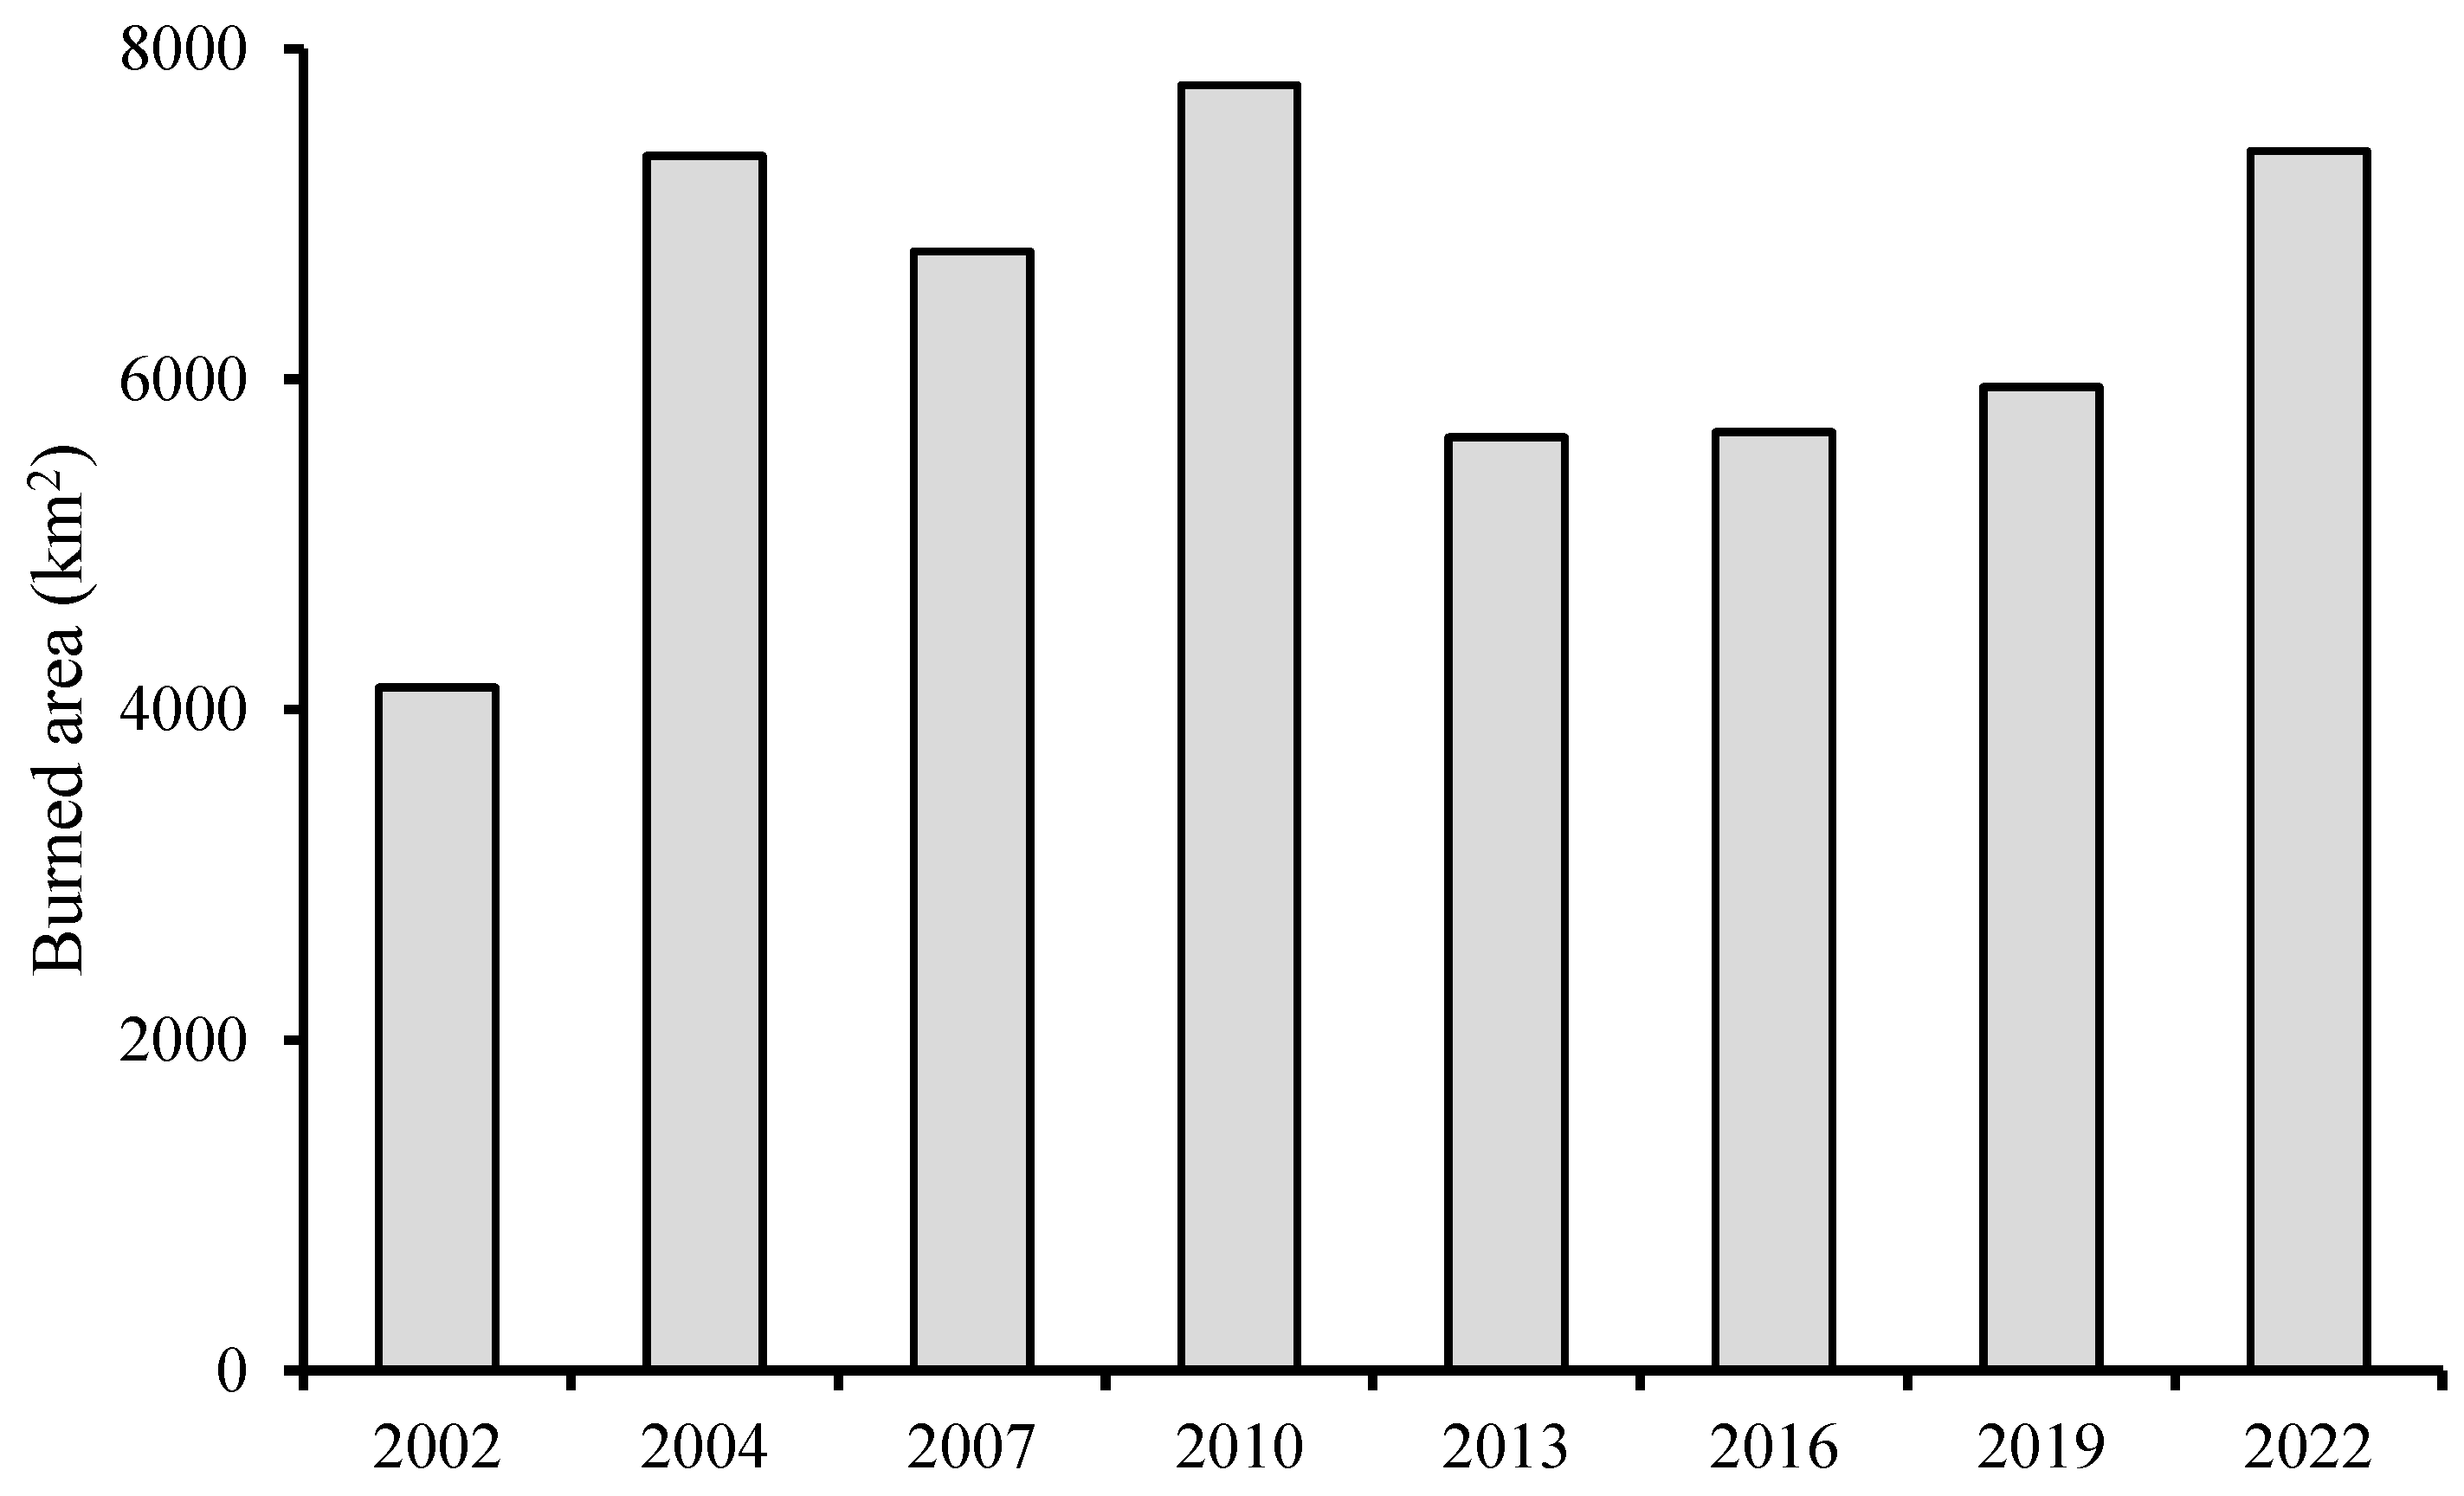
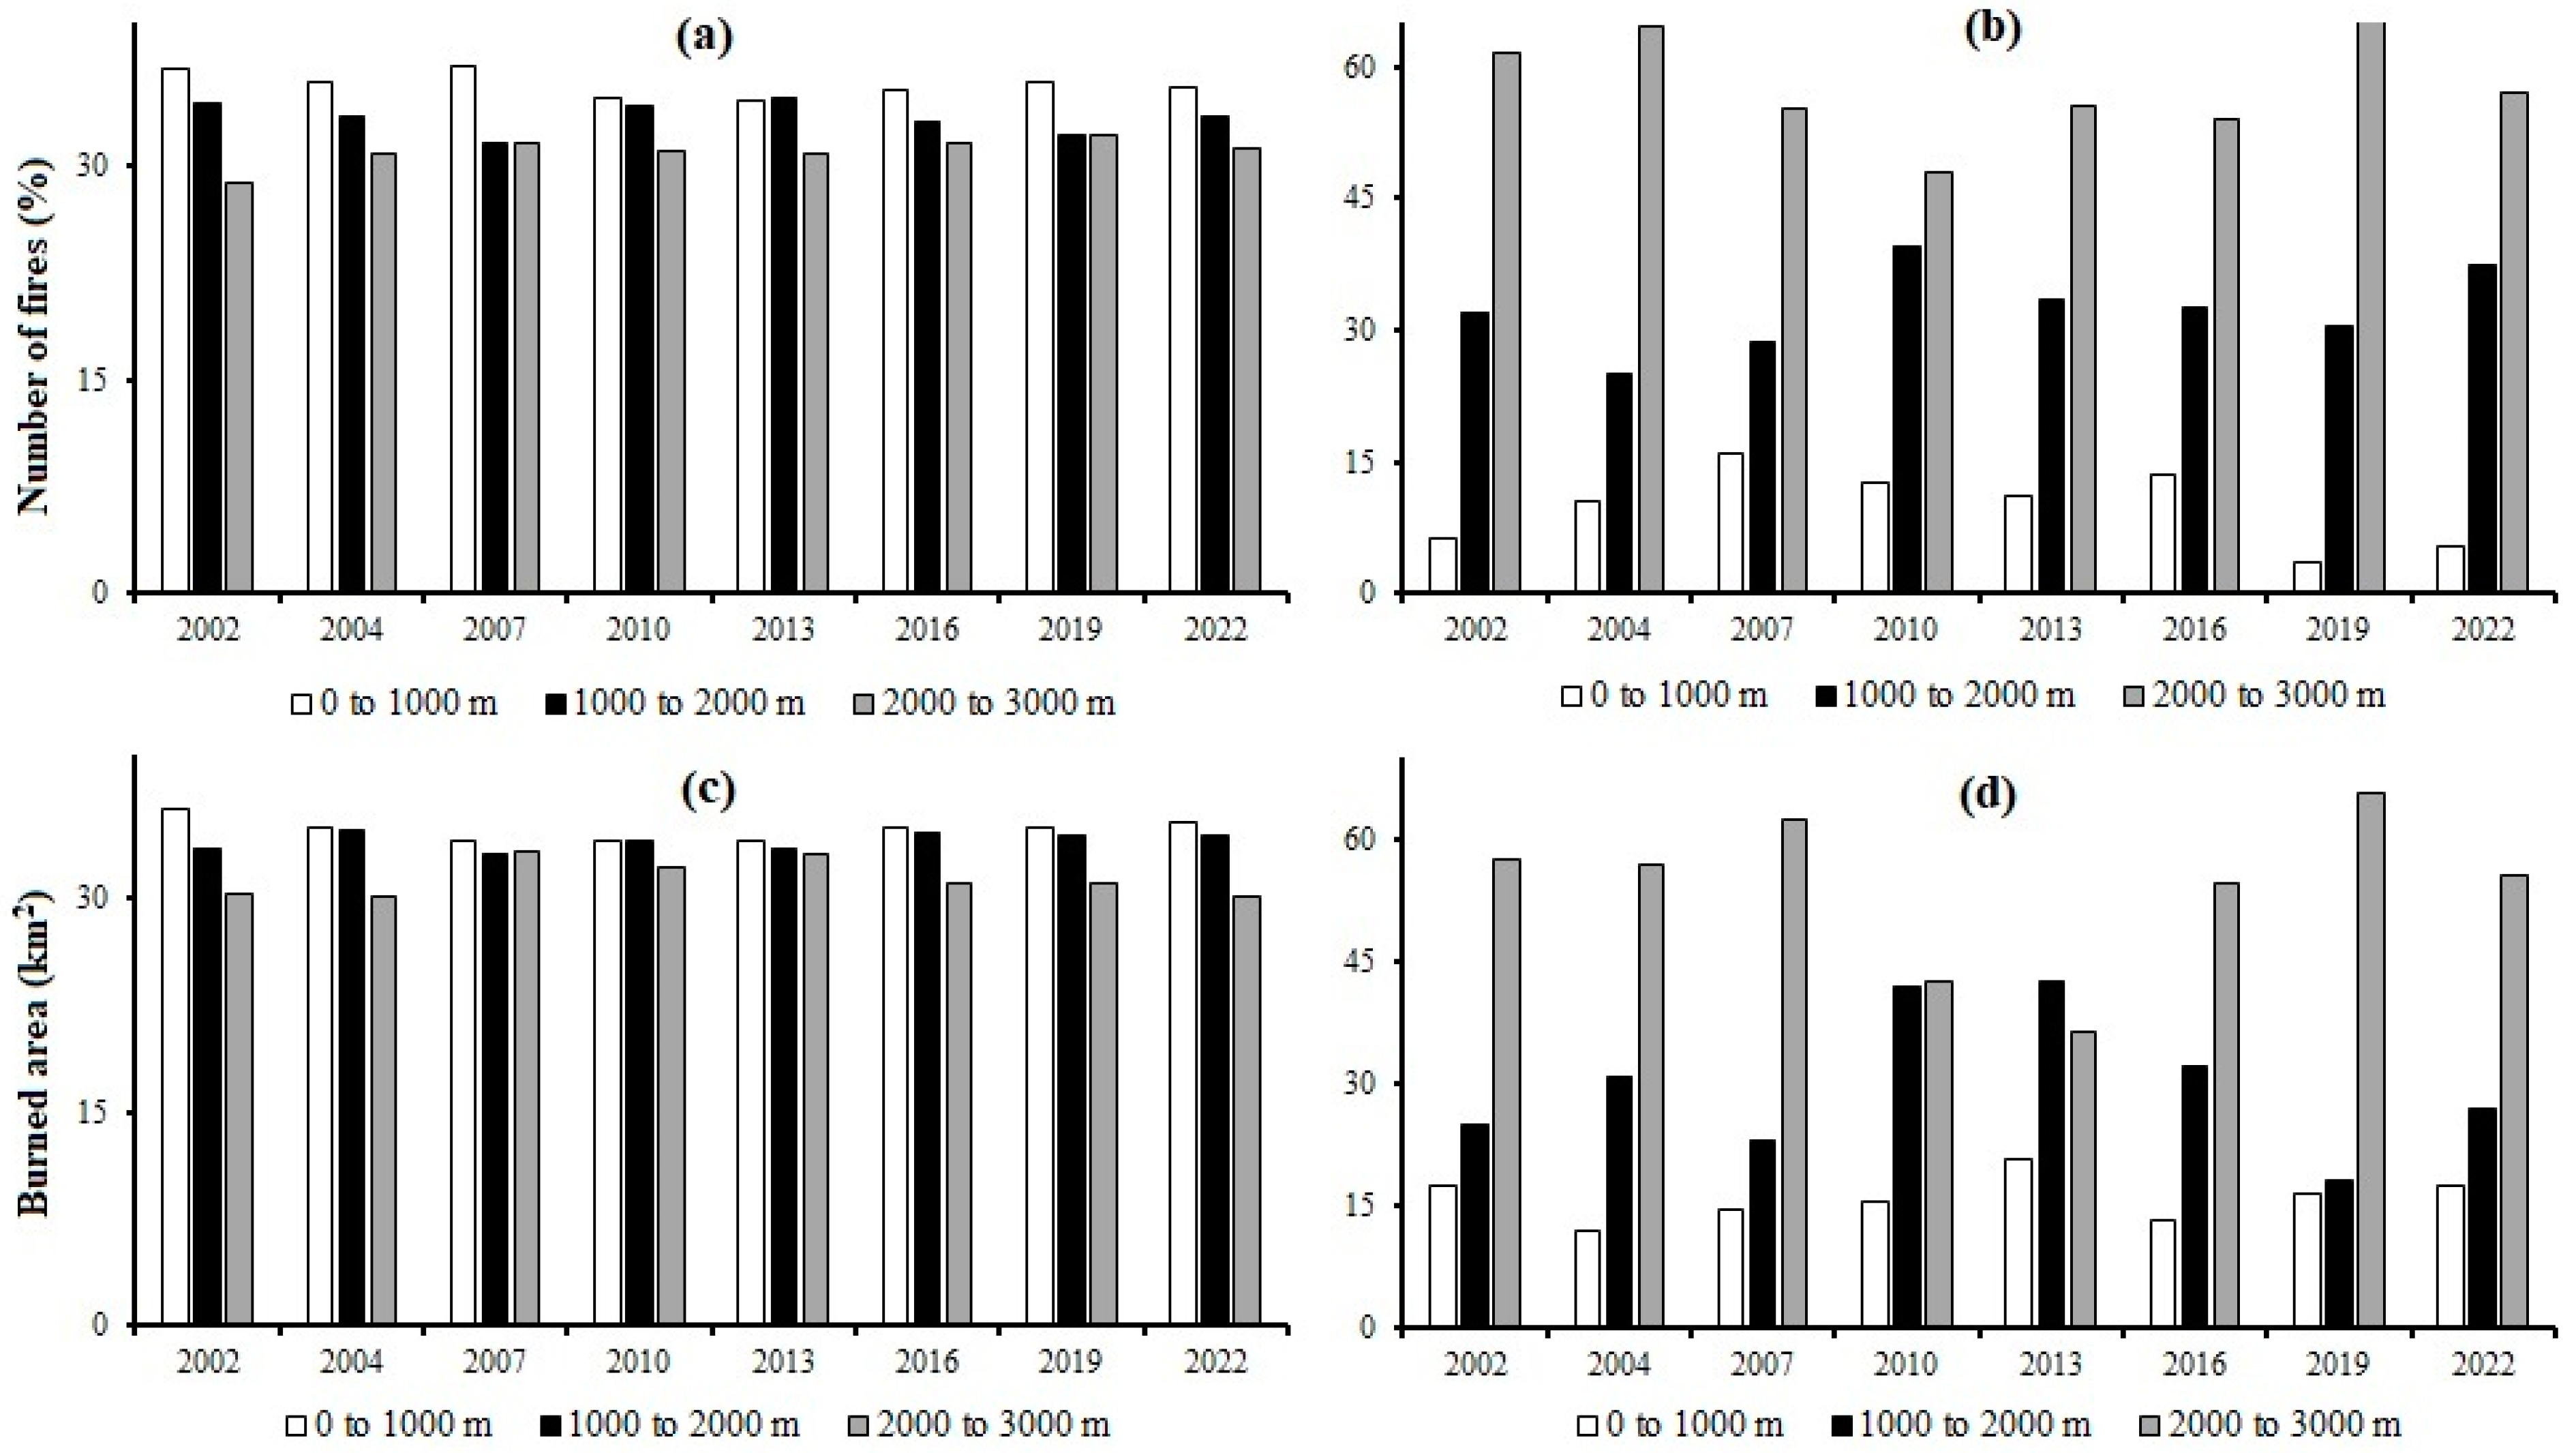
3.1. Analysis of the Distribution of Fires and the Destructive Power of Fires in the Study Area between 2002 and 2022

The statistical analysis of the annual and monthly distribution of fire incidents in the study area reveals an uneven distribution, as clearly illustrated by the data presented in Table 4 and Figure 2. Fire frequency has increased significantly in the LCPB area, particularly in 2019, which recorded a significantly higher number of fire incidents (12,714) compared to the year 2002 (7254). Fires in the LCPB span eight months, from April to November, peaking in August (Figure 2), except for 2002. However, it is remarkable that a majority of fires are detected during daylight hours, particularly between 11 a.m. and 12 p.m. (Figure 3). In terms of their degree of destruction, the most frequent fire incidents in the study area are characterized by a destructive power ranging from low to very low. However, the other categories of fire incidents are less frequent, representing a relatively small percentage (<20%) of all events recorded between 2002 and 2022. Finally, the analysis of the spatial clustering of fire outbreaks reveals that fires in the LCPB are concentrated in the central and southwestern parts, including along roads (Figure 4).

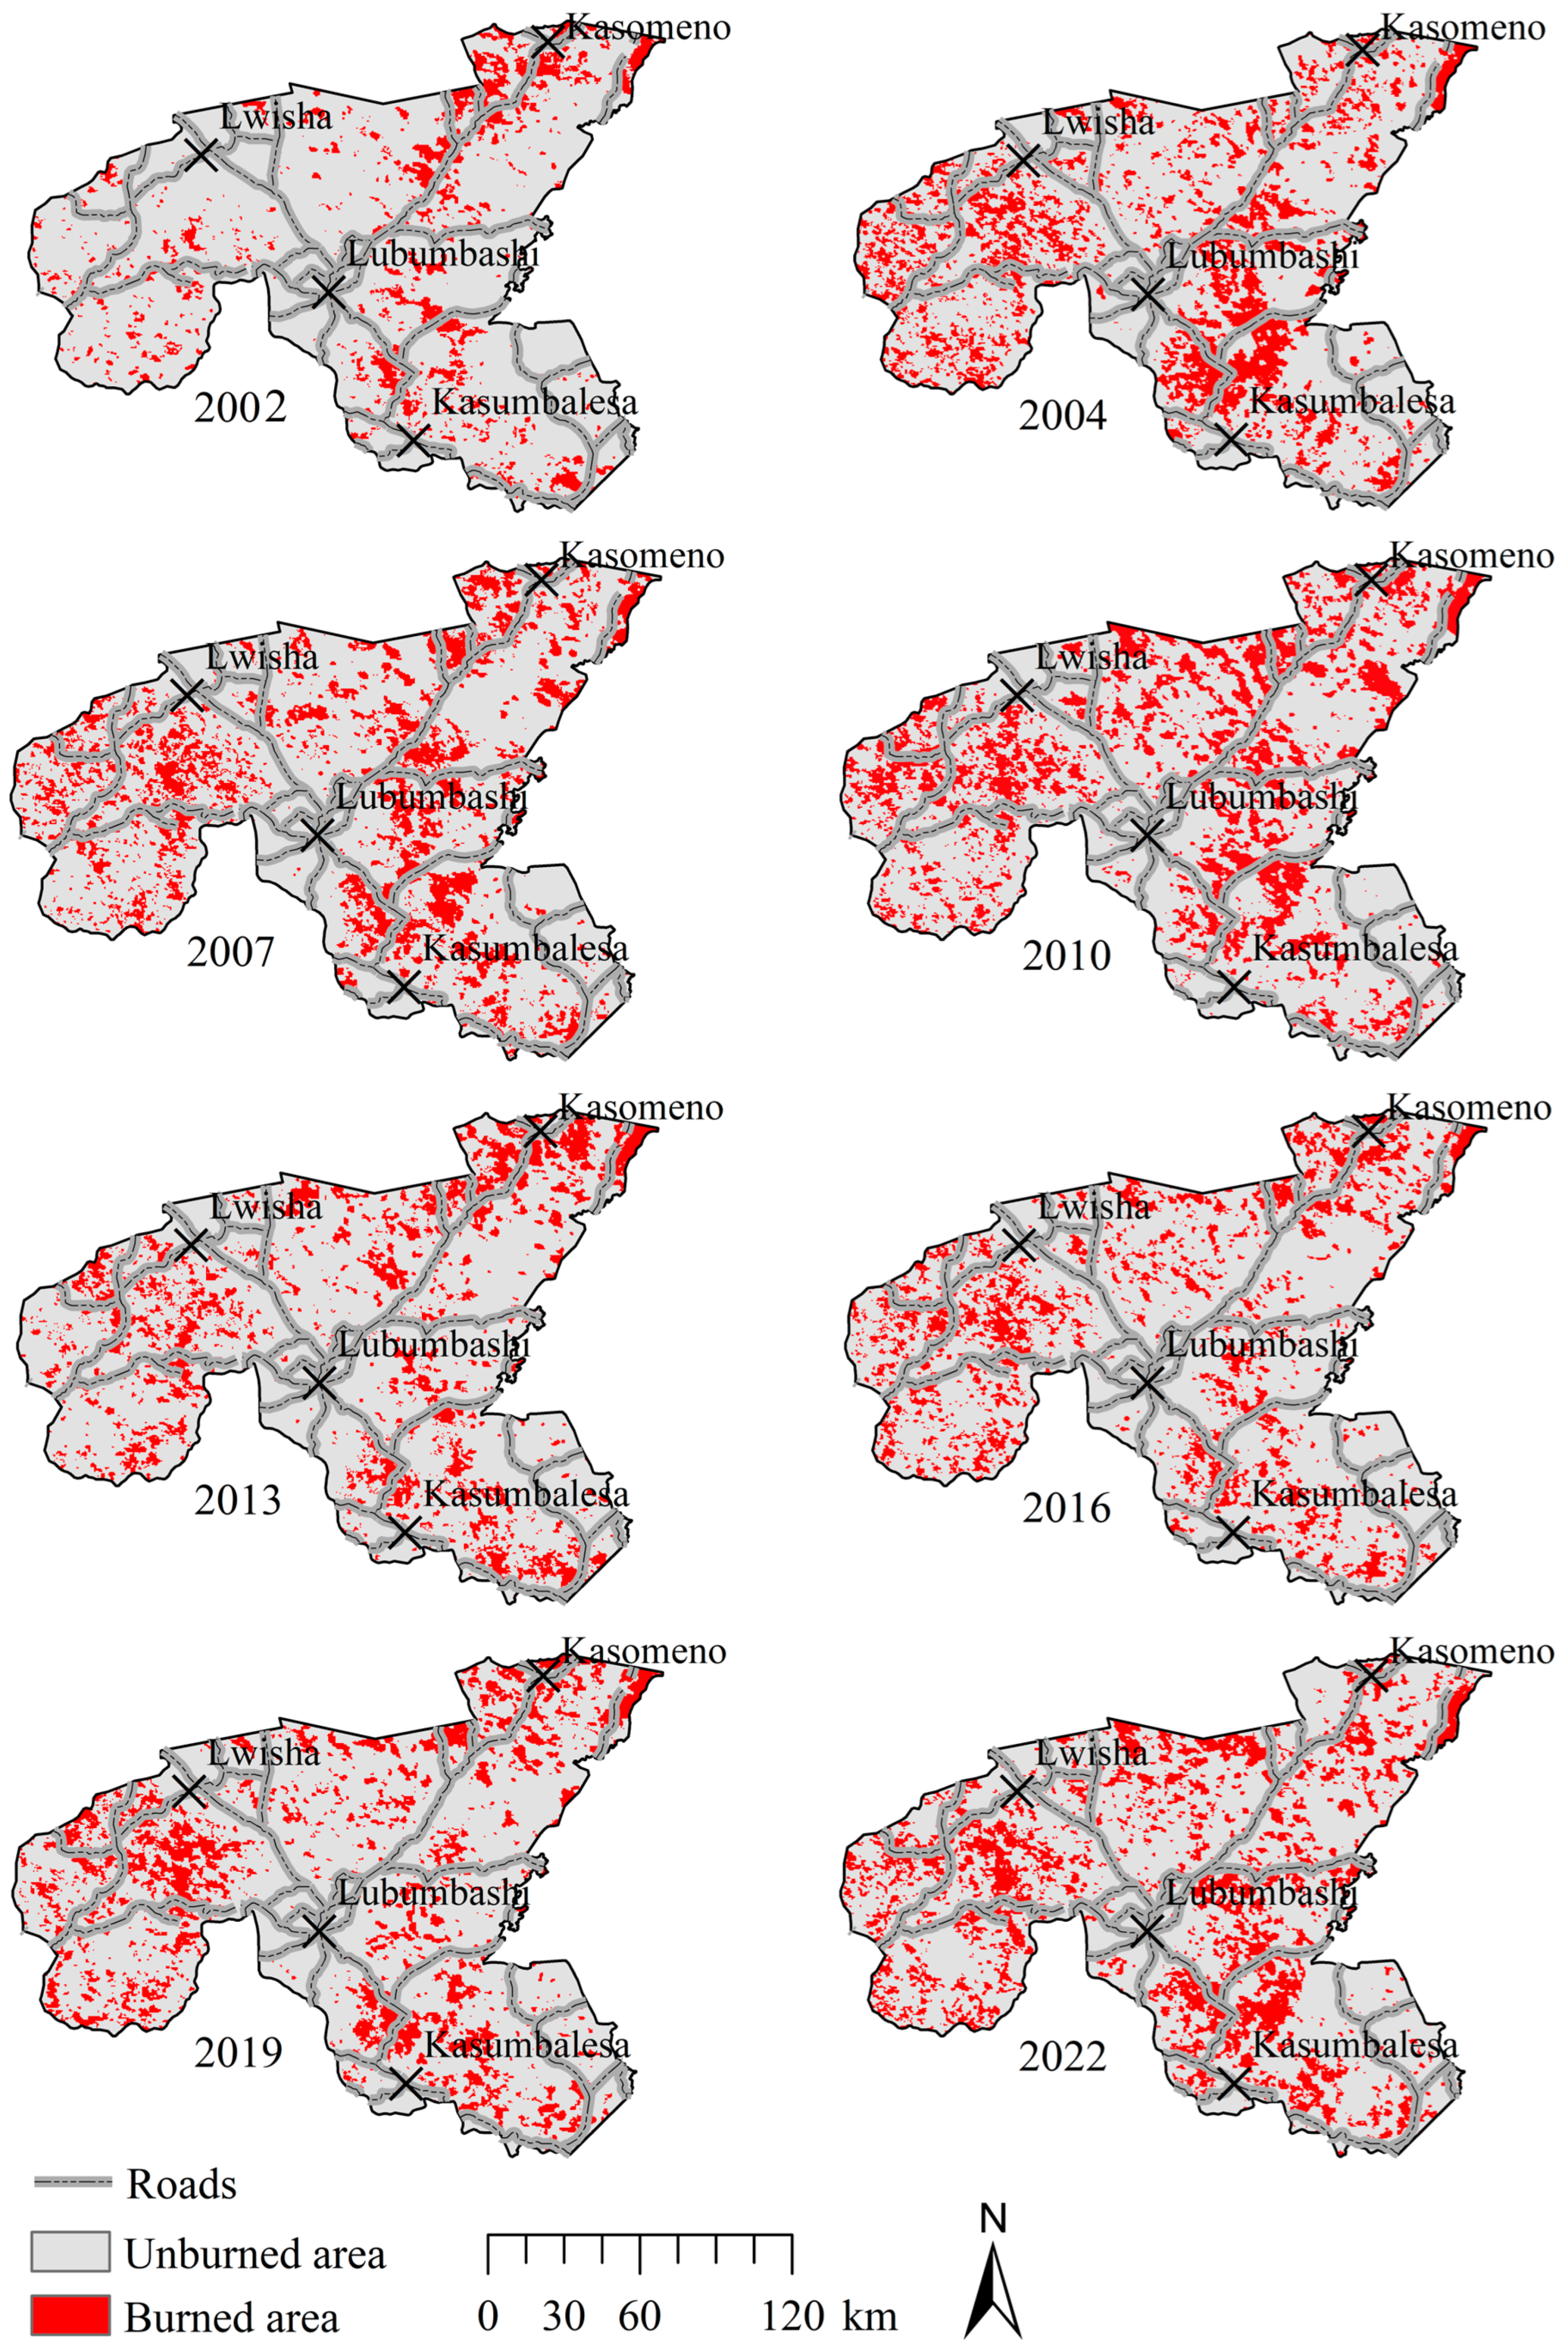
3.2. Spatiotemporal Dynamics of Bushfires in the LCPB: Quantification of the Number of Fires and the Area Burnt in Land Occupations

Burnt areas were recorded in all the years of the study, from 2002 to 2022 (Figure 5 and Figure 6). However, the variation in fire dynamics in the LCPB is small (with the exception of the period from 2002 to 2004), with a coefficient of variation (CV) around 20%, meaning that the amount of area burnt from one year to the next in this region, from 2004 onwards, is relatively stable. In the study area, the average annual area burnt was 6337 km2. From 2004 onwards, the area burnt in the LCPB has remained at a high level, exceeding 5000 km2. Bushfires mainly affected the savannahs (Table 5). However, during their peak in August, it is the forests that are most exposed instead, with an average annual burnt area estimated at 2798 km2. Forest fires first increased between 2002 and 2007 and then decreased between 2010 and 2022. In the savannahs and fields, on the other hand, these fires increased progressively between 2002 and 2022. Each year, due to their steady decline, the few fires that have affected the forests have caused more devastation (more than 2790 km2/year) than those observed in the fields and savannah.

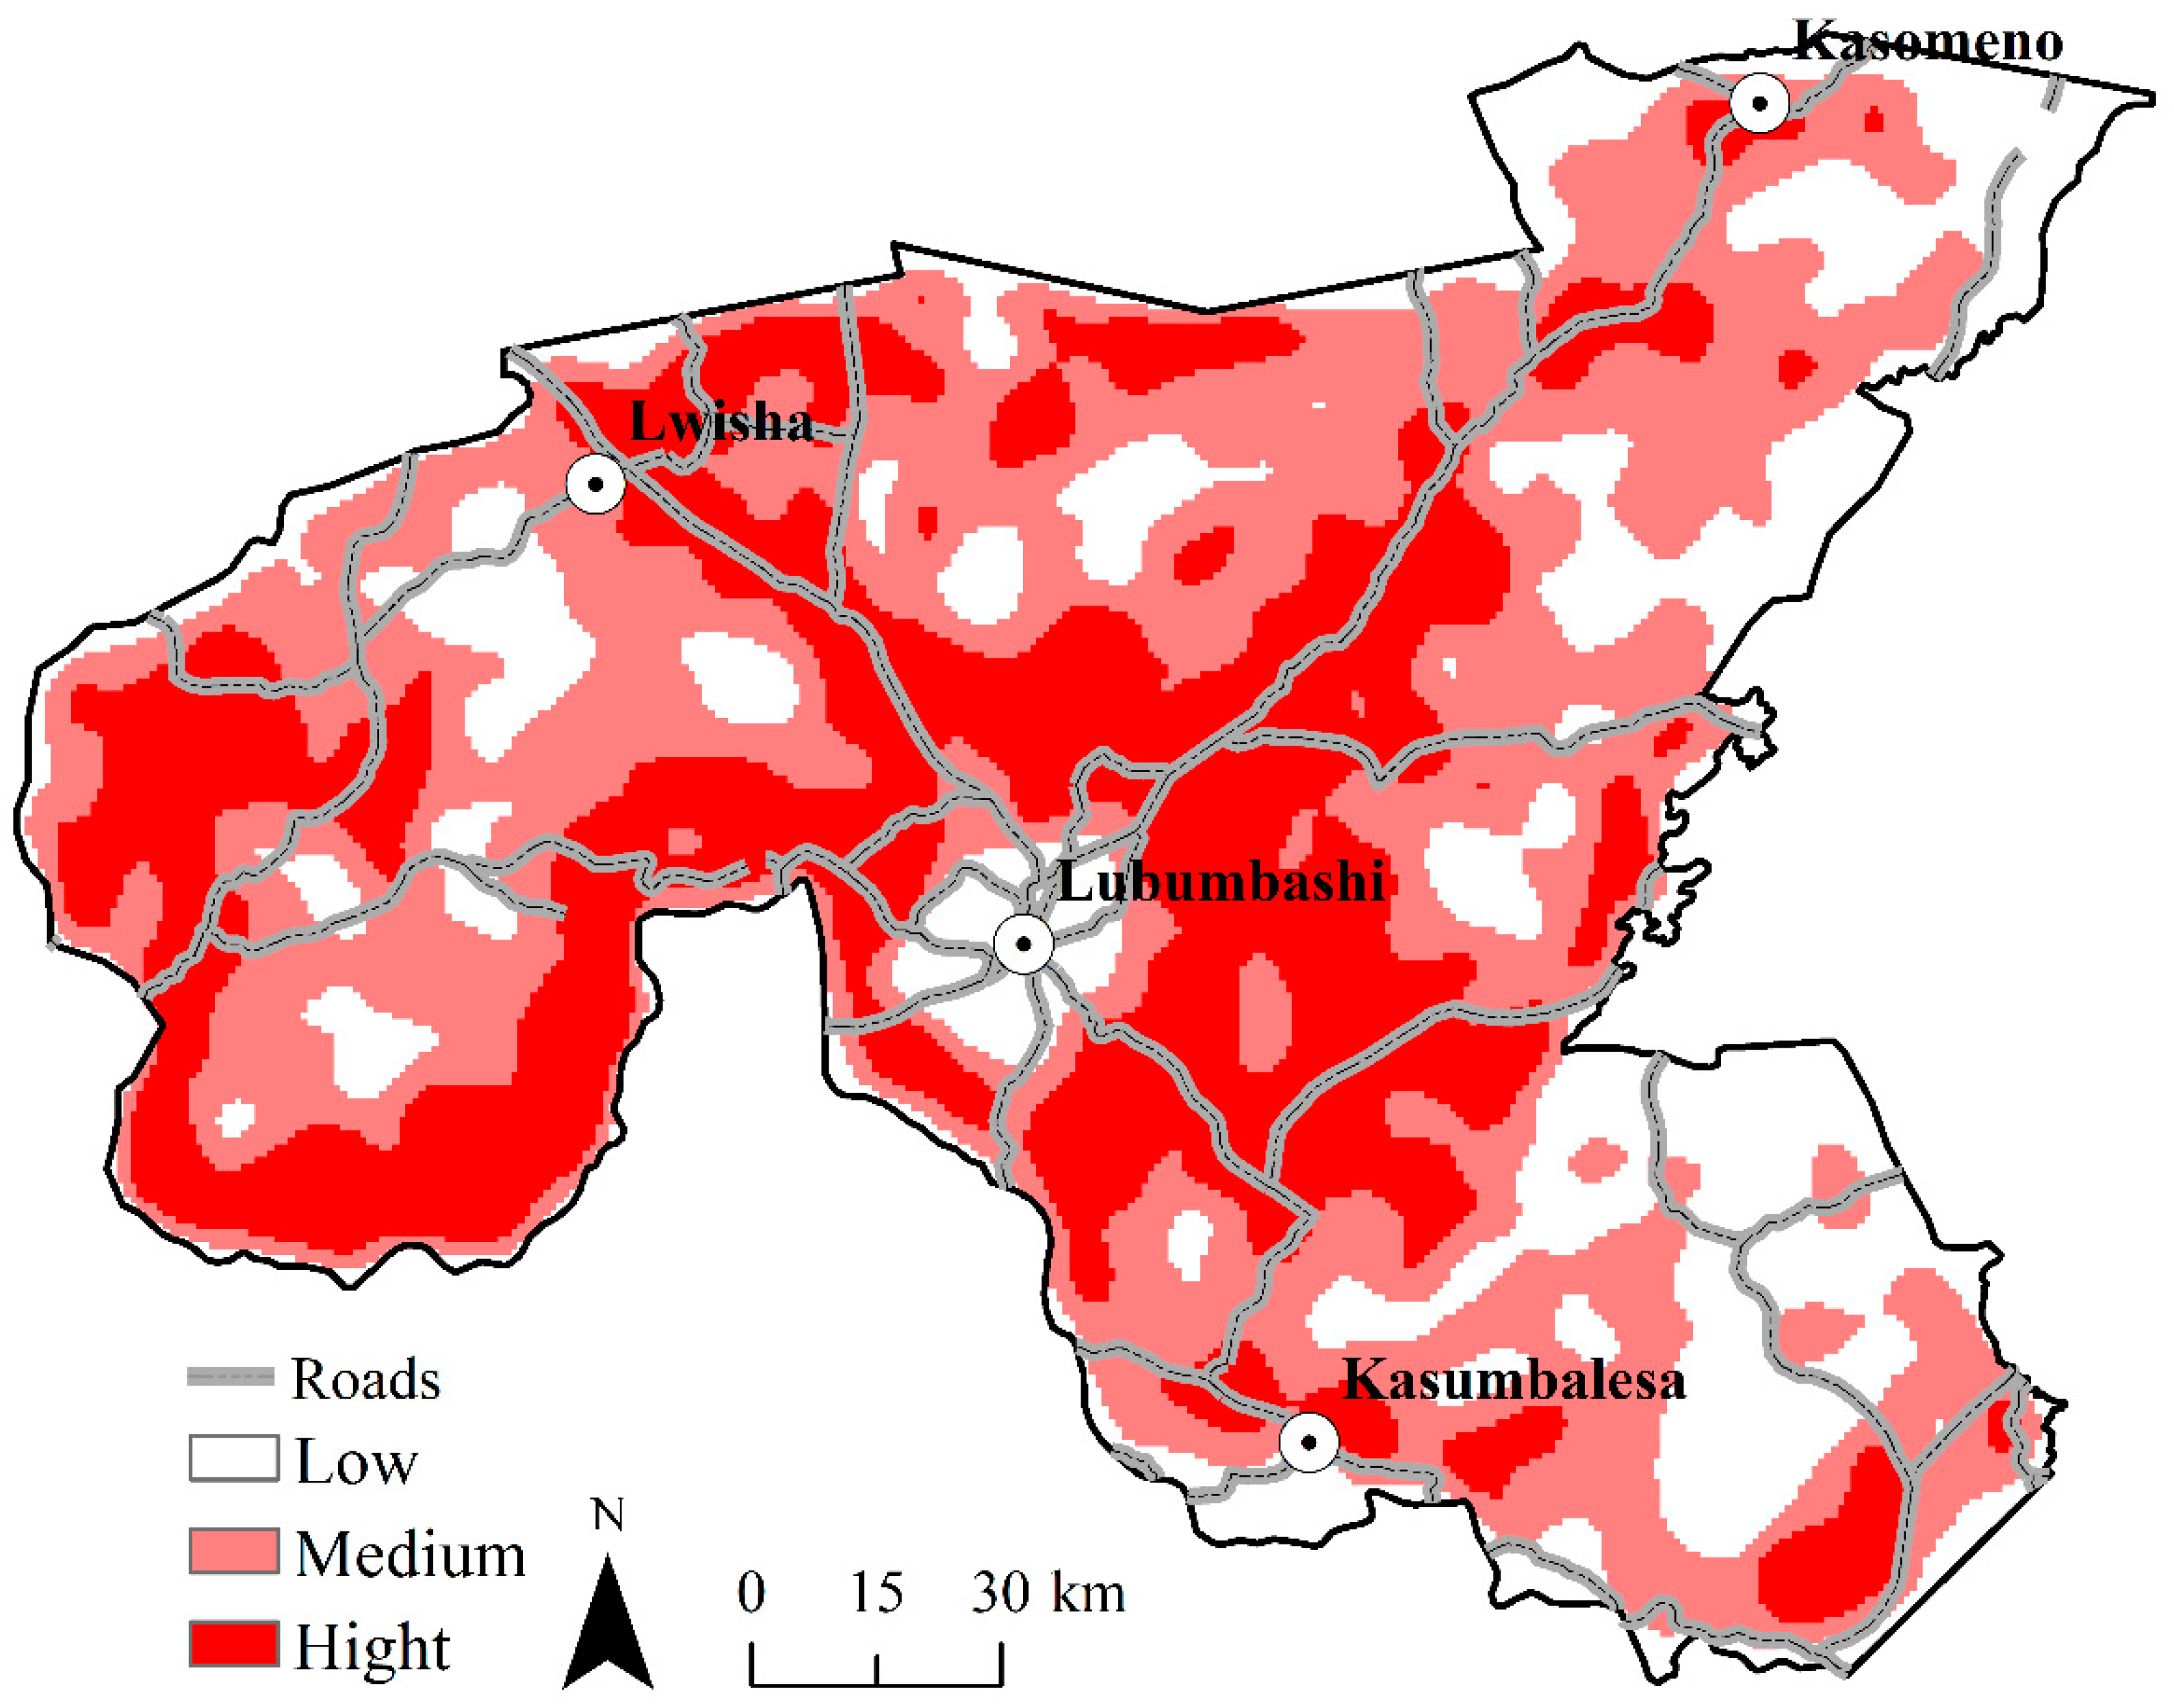
3.3. Impact of Roads and Dwellings on the Spread of Fires in the LCPB

Burnt areas are also distributed around roads (Figure 7). Spatial analyses revealed that, unlike villages, roads played an important role in the spread of fires and burnt areas over all the periods studied between 2002 and 2022. In the study area, fires tend to spread more easily close to roads but away from villages. Indeed, the closer they are to roads, the higher the number of fires and burnt areas, while the opposite trend is observed around villages. These results were confirmed by significant statistical tests (p = 0.0009 < 0.05), clearly demonstrating the influence of roads on the spread of fires.

4. Discussion

4.1. Methodology

To assess the impact of fires on vegetation cover, this study used data from the Landsat (30 m spatial resolution) and MODIS (500 m to 1 km spatial resolution) satellites. The acquisition of these data at a reduced time step (from 2 to 3 years) enabled the rapid changes linked to vegetation fires to be captured. This did not prevent the study from highlighting the main trends in landscape evolution in the study area, and our results are similar to those of previous studies in the region using the same approach [32,34]. Landsat images, although of coarse resolution, are suitable for large-scale studies and provide a global view of the landscape [43,65]. These data were used by Ref. [28] to identify the main land cover units in the Katanga region on the basis of knowledge of the study area. MODIS data, for their part, have been used to assess forest fire risk and have proved their effectiveness on several occasions in this field [66,67,68]. The data collections used enabled the better detection of small fires, a significant reduction in unmapped areas, and a reduction in uncertainty regarding the date of fires [58,67]. In addition, spatial clustering of fire outbreaks was performed using the kernel density analysis (KDE) method, a robust approach for estimating fire risk [68]. Buffers and meshes are spatial analysis tools used to study relationships between geographical objects [69]. Buffer zones are effective tools for analyzing environmental risks. These tools make it easier to analyze the impact of human activities on the spread of forest fires by studying their geographical distribution. They can also help to identify areas at risk and establish preventive protection measures against this phenomenon [70]. These tools were used in the present study to assess the role of roads and villages in fire propagation, while also locating the area considered to be the epicenter of the fires.

4.2. Characterization of Bushfire Dynamics and Their Impact on Miombo in the LCPB Region

Over the last two decades, the LCPB region has seen a significant increase in the frequency of fires. This trend can be explained by several factors. Firstly, rapid population growth in the region has led to an increasing demand for wood energy [32], which may lead to the more frequent use of fire. In addition, the continuing impoverishment of populations has led some people to turn to new practices, such as charcoal mining by professional charcoal producers and new farmers acquiring land for the sole purpose of charcoal production. The data also revealed a periodic variation in the incidence of fires in the region. Increases were observed in 2002 and 2007, followed by a decrease between 2010 and 2013, and then a further increase between 2016 and 2022. These fluctuations can be attributed to a number of factors. Firstly, weather conditions play a key role [71]. Prolonged periods of drought and high temperatures favor the rapid spread of fires [71]. In addition, the fragmentation of natural habitats and the expansion of urbanized areas increase exposure to fire [72]. Urbanization often leads to a greater human presence in at-risk areas, thereby increasing the risk of accidental fires [73]. Moreover, human activities, such as extensive agriculture, logging, and uncontrolled agricultural burning practices, can also play a role in the increase in fires [35,73]. In the LCPB, the months with the most fire occurrences correspond to drier months, i.e., May to September [30]. During these periods, the desiccation of vegetation and soils and the wind shifts are conducive to the spread of fires [74]. The results of the current study corroborate the findings of Ref. [75], indicating that a majority of vegetation fires detected in the Sudanian and Zambezi savannahs of the DR Congo are spread during drier months, which are characterized by late fires that are known to be destructive to biodiversity because they occur at a time when combustible biomass is highly available. Clearly, the fires detected in the LCPB during the study periods (2002–2022) are linked to the conquest of new agricultural by clearing it with fire, as was the case in Burundi [76]. Indeed, during these activities, fallow land is cultivated, and new land is cleared. In both cases, fire is used to facilitate agricultural activities. Our results showed that a majority of fires in the LCPB are detected during daylight hours, particularly between 11 a.m. and 12 p.m. In peasant agriculture, at the end of the day’s work, farmers pile and burn the dried biomass, which explains the high number of fires occurring during the day. Another reason could be the times when the Aqua satellite passes overhead, as it is very active in the tropics during the day, when it records a large number of fires [60]. Our results are similar to those found by Ref. [68] in the Luki Biosphere Reserve and those of Ref. [76] in Burundi. In the study area, the most common fires are those with very low to low PR corresponding to agricultural fires without any control [68]. In the tropics, low-PR fires are associated with grassy formations [58], which are common in fallow and uncleared land. The spatial distribution of fires indicates a spatial concentration of fire foci in the central and more southeastern part of the LCPB region. In these areas, there is still considerable vegetation cover (savannah and forest) [32], which would explain this spatial distribution of fires. The results of the spatiotemporal dynamics of burnt areas in the LCPB revealed that, from 2004 onwards, the surface area of burnt areas in the LCPB has remained at a high level, exceeding 5000 km2. This can undoubtedly be linked to the rapid development of human activities, such as agriculture and charcoal production [4,10]. Furthermore, an analysis of the spatial distribution of vegetation fires in the LCPB showed that fires were more prevalent in the savannahs, but at their peak in August, the largest areas burnt were recorded in the forests. The high frequency of fires in savannahs can be explained by the fact that these plant formations are open, with a continuous grass or herbaceous cover, which makes the ecosystem more exposed to fires [75]. The same observation was made by Ref. [77] in Botswana and Ref. [18] in Cameroon. Thus, the nature of the vegetation formation and the type of land cover/use are essential factors in assessing the level of exposure and vulnerability of an environment to fire risk [52]. Furthermore, the month of August corresponds to the peak of the dry season in the LCPB, when vegetation fires reach their peak. During this month, fires occur later, and forest formations remain very sensitive to these types of fire [78]. This justifies the large areas of forest burnt during this period.
The number of fires and burnt areas in the LCPB increases considerably closer to the roads but far from the villages. This finding reinforces the results of previous research that has already highlighted the damaging impact of road infrastructure on the natural environment [65,79]. Ref. [70] also demonstrated that roads, by allowing easier access to forest areas, potentially increase the risk of introducing a source of fire ignition. In addition, the proximity of roads is often associated with an increase in human activity, such as the presence of hikers, campers, hunters, or other forest users. This increased human activity can, in turn, increase the risk of accidental fires [70]. Furthermore, the decrease in fires around dwellings can be explained by the clustering of villages in densely populated areas, which reduces the amount of vegetation or fuel available for fires. This limits the ability of flames to spread and therefore reduces the intensity of the fire. People can detect smoke and report fire outbreaks quickly, enabling early intervention and quicker control of the flames.

4.3. Implications for Combating Wildfire and Preserving the Biodiversity of the Miombo in the LCPB

Vegetation fires have a significant impact on biodiversity and fragile ecosystems, as highlighted by studies such as Ref. [80]. In the specific context of miombo, these fires play a crucial role in species regeneration [81]. In the LCPB, these fires are a major concern because of their extent, their spatiotemporal trends, and their impact on plant formations. The adverse consequences for biodiversity call for the implementation of effective prevention and control measures [82,83]. Firstly, to mitigate these vegetation fires, it is essential to raise awareness and educate local communities about the dangers and consequences of these fires [84]. Awareness-raising campaigns are needed to promote sustainable agricultural practices, such as the use of controlled slash-and-burn techniques or the adoption of alternative land-clearing methods. It is also crucial to control fires during charcoal production and to strictly apply the regulations against hunting by fire [85,86]. These measures will certainly help preserve biodiversity and protect the fragile ecosystems of the LCPB.
Furthermore, it is still essential to adapt the vision and practices of the stakeholders involved by combining traditional and modern methods of bushfire control. In Senegal, for example, despite a number of obstacles, traditional early fire management is still in force, and bushfire regulations have evolved to give local populations the right and duty to manage their natural resources [84]. This successful experience could be adopted by local decision makers for the management of LCPB. In addition, the introduction of regulations aimed at ensuring the sustainable management of forest ecosystems and the promotion of an integrated and participatory management policy are important assets [87,88]. At the same time, the use of innovative technologies such as satellite fire detection systems or drones should be used to spot fire outbreaks as soon as they occur [89,90]. In addition, the creation of buffer zones and protective corridors around roads can help reduce the risk of fires spreading from adjacent areas [91]. However, these buffer zones need to be complemented by design and construction measures that are appropriate for fire-risk areas.
It is worth noting that the current study is based on data that may be limited in terms of spatial and temporal resolution, which may influence the accuracy of the results. The results of this study are specific to the LCPB and may not be directly generalized to other regions or production basins, even if they have similar characteristics. Furthermore, in this study, the focus was on the drivers and consequences of wildfires in the LCPB, but other aspects, such as the socioeconomic impacts on local communities, may also be investigated in future research.

5. Conclusions

This study analyzed the impact of vegetation fires in the LCPB by examining their causes and spatiotemporal dynamics. The spatiotemporal analysis of active fires and burnt areas revealed that they are predominantly distributed along roads, particularly in the savannahs. These fires occur mainly during the dry season, between April and November, and are generally detected during the day, mainly between 11 a.m. and 12 p.m. The month of August marks the annual peak in fires, causing significant damage to the forests. From these results, it is clear that agricultural activities, charcoal production, and the road network in the LCPB contribute to the increase in vegetation fires, which have a significant impact on biodiversity and forest degradation. In order to control and prevent these fires while preserving regional biodiversity, it is essential to raise awareness, to monitor and to improve road infrastructure, and to improve the management of human activities. This research provides valuable information for the prevention and management of fires that can be used to develop more effective firefighting policies and strategies, as well as land-cover plans to reduce the ecological and socioeconomical risks associated with bushfires.

Author Contributions

Y.U.S., conceptualization, methodology, and writing—original draft preparation; M.M.M., data curation and writing—original draft preparation; H.K.M., N.C.C. and F.M., writing—review and editing; J.B., supervision, writing—original draft and funding acquisition. All authors have read and agreed to the published version of the manuscript.

Funding

The research was funded by ARES-CCD (Belgium), through the Research for development project ‘Renforcement des capacités de gestion durable de la forêt claire de miombo par l’évaluation de l’impact environnemental de la production de charbon de bois et l’amélioration des pratiques vis-à-vis des ressources forestières (CHARLU)’.

Data Availability Statement

All data are contained within the article.

Conflicts of Interest

The authors declare that the research was conducted in the absence of any commercial or financial relationships that could be construed as a potential conflict of interest.

References

  1. Harris, N.L.; Gibbs, D.A.; Baccini, A.; Birdsey, R.A.; de Bruin, S.; Farina, M.; Fatoyinbo, L.; Hansen, M.C.; Herold, M.; Houghton, R.A.; et al. Global maps of twenty-first century forest carbon fluxes. Nat. Clim. Chang. 2021, 11, 234–240. [Google Scholar] [CrossRef]
  2. Friedlingstein, P.; O’sullivan, M.; Jones, M.W.; Andrew, R.M.; Hauck, J.; Olsen, A.; Peters, G.P.; Peters, W.; Pongratz, J.; Sitch, S.; et al. Global carbon budget 2020. Earth Syst. Sci. Data Discuss. 2020, 4, 1–3. [Google Scholar] [CrossRef]
  3. Baccini, A.; Walker, W.; Carvalho, L.; Farina, M.; Sulla-Menashe, D.; Houghton, R.A. Tropical forests are a net carbon source based on aboveground measurements of gain and loss. Science 2017, 358, 230–234. [Google Scholar] [CrossRef] [PubMed]
  4. Defourny, J.-P.; Delhage, C.; Kibambe, L.J.-P. Analyse Quantitative des Causes de la Déforestation et de la Dégradation des Forêts en République Démocratique du Congo; Rapport Final; FAO: Kinshasa, Democratic Republic of the Congo, 2011. [Google Scholar]
  5. Gillet, P.; Vermeulen, C.; Feintrenie, L.; Dessart, H. Quelles sont les causes de la déforestation dans le bassin du Congo? Synthèse bibliographique et étude des cas. Biotechnol. Agron. Société Environ. 2016, 20, 183–194. [Google Scholar] [CrossRef]
  6. Seaman, D.J.I.; Voigt, M.; Bocedi, G.; Travis, J.M.J.; Palmer, S.C.F.; Ancrenaz, M.; Wich, S.; Meijaard, E.; Bernard, H.; Deere, N.J.; et al. Orangutan movement and population dynamics across human-modified landscapes: Implications of policy and management. Landsc. Ecol. 2021, 36, 2957–2975. [Google Scholar] [CrossRef]
  7. Bauer, H.; Packer, C.; Funston, P.F.; Henschel, P.; Nowell, K. Panthera Leo (Errata Version Published in 2017). The IUCN Red List of Threatened Species 2016: E.T15951A115130419. Available online: https://www.iucnredlist.org/species/15951/231696234 (accessed on 17 September 2023). [CrossRef]
  8. FAO. Global Forest Resources Assessment. 2020. Available online: https://www.fao.org/forest-resources-assessment/2020/en/ (accessed on 14 July 2023).
  9. Agbeshie, A.A.; Abugre, S.; Atta-Darkwa, T.; Awuah, R. A review of the effects of forest fire on soil properties. J. For. Res. 2022, 33, 1419–1441. [Google Scholar] [CrossRef]
  10. Eba’a Atyi, R.; Hiol Hiol, F.; Lescuyer, G.; Mayaux, P.; Defourny, P.; Bayol, N.; Nasi, R. Les Forêts du Bassin du Congo: État des Forêts; CIFOR: Bogor, Indonesia, 2021. [Google Scholar]
  11. Curtis, P.G.; Slay, C.M.; Harris, N.L.; Tyukavina, A.; Hansen, M.C. Classifying drivers of global forest loss. Science 2018, 361, 1108–1111. [Google Scholar] [CrossRef]
  12. Hansen, M.C.; Potapov, P.V.; Moore, R.; Hancher, M.; Turubanova, S.A.; Tyukavina, A.; Thau, D.; Stehman, S.V.; Goetz, S.J.; Loveland, T.R.; et al. High-resolution global maps of 21st-century forest cover change. Science 2013, 342, 850–853. [Google Scholar] [CrossRef]
  13. Böhrkircher, L.; Leuchner, M.; Bayro Kaiser, F.; Reicher, C. Problems of Deforestation and Its Drivers. In Priority-Zone Mapping for Reforestation; SpringerBriefs in Geography; Springer: Cham, Switzerland, 2023. [Google Scholar] [CrossRef]
  14. Bowman, D.M.J.S.; O’Brien, J.A.; Goldammer, J.G. Pyrogeography and the global quest for sustainable fire management. Annu. Rev. Environ. Resour. 2013, 38, 57–80. [Google Scholar] [CrossRef]
  15. Krebs, P.; Pezzatti, G.B.; Mazzoleni, S.; Talbot, L.M.; Conedera, M. Fire regime: History and definition of a key concept in disturbance ecology. Theory Biosci. 2010, 129, 53–69. [Google Scholar] [CrossRef]
  16. Stone, G.D. Keeping the home fires burning: The changed nature of householding in the Kofyar homeland. Hum. Ecol. 1998, 26, 239–265. [Google Scholar] [CrossRef]
  17. Forman, R.T.T. Horizontal processes, roads, suburbs. societal objectives, and landscape ecology. In Landscape Ecological Analysis: ISSUES and Applications; Klopatek, J.M., Gardner, R.H., Eds.; Springer: New York, NY, USA, 1999; pp. 35–53. [Google Scholar]
  18. Kana, C.E.; Etouna, J.E. Apport de Trois Méthodes de Détection des Surfaces Brûlées par Imagerie Landsat ETM+: Application au Contact Forêt-Savane du Cameroun. Cybergeo 2006. [Google Scholar] [CrossRef]
  19. Eva, H.; Grégoire, J.M.; Mayaux, P.; Chevallier, D. Suivi des Feux de Végétation Dans les Aires Protégées d’Afrique Sub-Saharienne; European Commission: Brussels, Belgium, 2003. [Google Scholar] [CrossRef]
  20. Tyukavina, A.; Hansen, M.C.; Potapov, P.V.; Stehman, S.V.; Smith-Rodriguez, K.; Okpa, C.; Aguilar, R. Types and rates of forest disturbance in Brazilian Legal Amazon, 2000–2013. Sci. Adv. 2017, 3, e1601047. [Google Scholar] [CrossRef] [PubMed]
  21. Hislop, S.; Haywood, A.; Jones, S.; Soto-Berelov, M.; Skidmore, A.; Nguyen, T.H. A satellite data driven approach to monitoring and reporting fire disturbance and recovery across boreal and temperate forests. Int. J. Appl. Earth Obs. Geoinf. 2020, 87, 102034. [Google Scholar] [CrossRef]
  22. Vancutsem, C.; Achard, F.; Pekel, J.F.; Vieilledent, G.; Carboni, S.; Simonetti, D.; Nasi, R. Long-term (1990–2019) monitoring of forest cover changes in the humid tropics. Sci. Adv. 2021, 7, eabe1603. [Google Scholar] [CrossRef]
  23. Potapov, P.V.; Turubanova, S.A.; Hansen, M.C.; Adusei, B.; Broich, M.; Altstt, A.; Mane, L.; Justice, C.O. Quantifyng forest cover loss in Democratic Republic of the Congo, 2000–2010, with Landsat ETM+data. Remote Sens. Environ. 2012, 122, 106–116. [Google Scholar] [CrossRef]
  24. Global Forest Watch. Available online: https://www.globalforestwatch.org/dashboards/country/COD/?category=forestchange&location=WyJjb3VudHJ5IiwiQ09EIl0%3D (accessed on 9 December 2023).
  25. Mwitwa, J.; German, L.; Muimba-Kankolongo, A.; Puntodewo, A. Governance and sustainability challenges in landscapes shaped by mining: Mining forestry linkages and impacts in the Copper Belt of Zambia and the DR Congo. For. Policy Econ. 2012, 25, 19–30. [Google Scholar] [CrossRef]
  26. Useni Sikuzani, Y.; Boisson, S.; Cabala Kaleba, S.; Nkuku Khonde, C.; Malaisse, F.; Halleux, J.M.; Munyemba Kankumbi, F. Dynamique de l’occupation du sol autour des sites miniers le long du gradient urbain-rural de la ville de Lubumbashi, RD Congo. Biotechnol. Agron. Société Environ. 2020, 24, 14–27. [Google Scholar] [CrossRef]
  27. Brown, C.; Boyd, D.S.; Kara, S. Landscape Analysis of Cobalt Mining Activities from 2009 to 2021 Using Very High Resolution Satellite Data (Democratic Republic of the Congo). Sustainability 2022, 14, 9545. [Google Scholar] [CrossRef]
  28. Cabala, K.S.; Useni, S.Y.; Sambieni, K.R.; Bogaert, J.; Munyemba, K.F. Dynamique des écosystèmes forestiers de l’Arc Cuprifère Katangais en République Démocratique du Congo. Causes, Transformations spatiales et ampleur. Tropicultura 2017, 35, 192–202. [Google Scholar]
  29. White, F. La Végétation de L’afrique: Mémoire Accompagné de la Carte de la Végétation de l’Afrique; ORSTOM-UNESCO: Paris, France, 1983; 384p. [Google Scholar]
  30. Malaisse, F. How to Live and Survive in Zambezian Open Forest (Miombo Ecoregion); Presses Agronomiques de Gembloux: Gembloux, Belgium, 2010. [Google Scholar]
  31. Campbell, B.M.; Angelsen, A.; Cunningham, A.; Katerere, Y.; Sitoe, A.; Wunder, S. Miombo Woodlands–Opportunities and Barriers to Sustainable Forest Management; CIFOR: Bogor, Indonesia, 2007; p. 41. [Google Scholar]
  32. Muteya, H.K.; Nghonda, D.-d.N.; Kalenda, F.M.; Strammer, H.; Kankumbi, F.M.; Malaisse, F.; Bastin, J.-F.; Sikuzani, Y.U.; Bogaert, J. Mapping and Quantification of Miombo Deforestation in the Lubumbashi Charcoal Production Basin (DR Congo): Spatial Extent and Changes between 1990 and 2022. Land 2023, 12, 1852. [Google Scholar] [CrossRef]
  33. Johnson, L.; Smith, A.; Brown, P. Influences of Anthropogenic Activities on Landscape Dynamics in the Miombo Woodlands. J. Environ. Manag. 2020, 265, 110569. [Google Scholar]
  34. Sikuzani, Y.U.; Mukenza, M.M.; Malaisse, F.; Kaseya, P.K.; Bogaert, J. The Spatiotemporal Changing Dynamics of Miombo Deforestation and Illegal Human Activities for Forest Fire in Kundelungu National Park, Democratic Republic of the Congo. Fire 2023, 6, 174. [Google Scholar] [CrossRef]
  35. Kabulu, D.J.-P.; Vranken, I.; Bastin, J.-F.; Malaisse, F.; Nyembwe, N.S.; Useni, S.Y.; Ngongo, L.M.; Bogaert, J. Approvisionnement En Charbon de Bois Des Ménages Lushois: Quantités, Alternatives et Conséquences. In Anthropisation des Paysages Katangais; Bogaert, J., Colinet, G., Mahy, G., Eds.; Presses Universitaires de Liège: Liège, Belgique, 2018; pp. 297–311. [Google Scholar]
  36. Bogaert, J.; Barima, Y.S.S.; Ji, J.; Jiang, H.; Bamba, I.; Iyongo, W.M.L.; Mama, A.; Nyssen, E.; Dahdouh-Guebas, F.; Koedam, N. A methodological framework to quantify anthropogenic effects on landscape pattern. In Landscape Ecology in Asian Cultures; Hong, S.-K., Wu, J., Kim, J.-E., Nakagoshi, N., Eds.; Part 2; Springer: New York, NY, USA, 2011; pp. 141–167. [Google Scholar]
  37. Devineau, J.L.; Fournier, A.; Nignan, S. Savanna fire regimes assessment with MODIS fire data: Their relationship to land cover and plant species distribution in western Burkina Faso (West Africa). J. Arid. Environ. 2010, 74, 1092–1101. [Google Scholar] [CrossRef]
  38. Giglio, L.; Descloitres, J.; Justice, C.O.; Kaufma, Y. An enhanced contextual fire detection algorithm for MODIS. Remote Sens. Environ. 2003, 87, 273–282. [Google Scholar] [CrossRef]
  39. Lemenkova, P.; Debeir, O. R Libraries for Remote Sensing Data Classification by K-Means Clustering and NDVI Computation in Congo River Basin, DRC. Appl. Sci. 2022, 12, 12554. [Google Scholar] [CrossRef]
  40. Bogaert, J.; André, M. L’écologie du paysage: Une discipline unificatrice. Tropicultura 2013, 31, 1–2. [Google Scholar]
  41. Saley, A. Utilisation des Nouvelles Techniques de Cartographie Pour L’étude de la Dynamique de L’occupation du Sol Dans la Commune Rurale de Namaro; CRESA: Niamey, Niger, 2006; 82p. [Google Scholar]
  42. Koua, K.A.N.; Bamba, I.; Barima, Y.S.S.; Kouakou, A.T.M.; Kouakou, K.A.; Sangne, Y.C. Echelle spatiale et dynamique de la forêt classée du Haut-Sassandra (Centre-Ouest de la Côte d’Ivoire) en période de conflits. Rev. Environ. Biodiversité-PASRES 2017, 2, 54–68. [Google Scholar]
  43. Mama, A.; Sinsin, B.; De Cannière, C.; Bogaert, J. Anthropisation et dynamique des paysages en zone soudanienne au nord du Bénin. Tropicultura 2013, 31, 78–88. [Google Scholar]
  44. Kottek, M.; Grieser, J.; Beck, C.; Rudolf, B.; Rubel, F. World Map of the Köppen-Geiger Climate Classification Updated. Meteorol. Z. 2006, 15, 259–263. [Google Scholar] [CrossRef]
  45. Assani, A.A. Analyse de la variabilité temporelle des précipitations (1916–1996) à Lubumbashi (Congo-Kinshasa) en relation avec certains indicateurs de la circulation atmosphériques (oscillation australe) et océanique (El Nino/La Nina). Sécheresse 1999, 10, 245–252. [Google Scholar]
  46. Leblanc, M.; Malaisse, F. Lubumbashi, un Ecosystème Urbain Tropical; Centre International de Sémiologie, Université Nationale du Zaïre: Lubumbashi, Democratic Republic of the Congo, 1978. [Google Scholar]
  47. Baert, G.; van Ranst, E.; Ngongo, M.L.; Kasongo, E.L.; Verdoodt, A.; Mujinya, B.B.; Mukalay, J.M. Guide des Sols en République Démocratique du Congo, Tome II: Description et Données Physico-Chimiques de Profils Types; Ecole Technique Salama-Don Bosco: Lubumbashi, Democratic Republic of the Congo, 2009; ISBN 978-90-76769-98-1. [Google Scholar]
  48. Cabala, K.S.; Useni, S.Y.; Munyemba, K.F.; Bogaert, J. Activités Anthropiques et Dynamique Spatiotemporelle de La Forêt Claire Dans La Plaine de Lubumbashi. In Anthropisation des Paysages Katangais; Bogaert, J., Colinet, G., Mahy, G., Eds.; Presses Universitaires de Liège: Liège, Belgique, 2018; pp. 253–266. [Google Scholar]
  49. Mukenza, M.M.; Muteya, H.K.; Nghonda, D.-D.N.; Sambiéni, K.R.; Malaisse, F.; Kaleba, S.C.; Bogaert, J.; Sikuzani, Y.U. Uncontrolled Exploitation of Pterocarpus tinctorius Welw. And Associated Landscape Dynamics in the Kasenga Territory: Case of the Rural Area of Kasomeno (DR Congo). Land 2022, 11, 1541. [Google Scholar] [CrossRef]
  50. Dibwe, M.D. Lubumbashi, Ville Industrielle Attractive et Repulsive (1910–2008); Los Restos de la Pobreza Urbana: Madrid, Spain, 2009. [Google Scholar]
  51. Gorelick, N.; Hancher, M.; Dixon, M.; Ilyushchenko, S.; Thau, D.; Moore, R. Google Earth Engine: Planetary-Scale Geospatial Analysis for Everyone. Remote Sens. Environ. 2017, 202, 18–27. [Google Scholar] [CrossRef]
  52. Palumbo, I.; Grégoire, J.-M.; Simonetti, D.; Punga, M. Spatio-temporal distribution of fire activity in protected areas of SubSaharan Africa derived from MODIS data. Procedia Environ. Sci. 2011, 7, 26–31. [Google Scholar] [CrossRef]
  53. Nkwunonwo, U.C. Land use/Land cover mapping of the Lagos Metropolis of Nigeria using 2012 SLC-off Landsat ETM+ Satellite Images. Int. J. Sci. Eng. Res. 2013, 4, 1217–1223. [Google Scholar]
  54. Barima, Y.S.S.; Barbier, N.; Bamba, I.; Traore, D.; Lejoly, J.; Bogaert, J. Dynamique paysagère en milieu de transition ivoirienne. Bois Trop. 2009, 299, 15–25. [Google Scholar] [CrossRef]
  55. Phan, T.N.; Kuch, V.; Lehnert, L.W. Land Cover Classification Using Google Earth Engine and Random Forest Classifier—The Role of Image Composition. Remote Sens. 2020, 12, 2411. [Google Scholar] [CrossRef]
  56. Breiman, L. Random Forests. Mach. Learn. 2001, 45, 5–32. [Google Scholar] [CrossRef]
  57. Olofsson, P.; Foody, G.M.; Herold, M.; Stehman, S.V.; Woodcock, C.E.; Wulder, M.A. Good Practices for Estimating Area and Assessing Accuracy of Land Change. Remote Sens. Environ. 2014, 148, 42–57. [Google Scholar] [CrossRef]
  58. Giglio, L.; van der Werf, G.R.; Randerson, J.T.; Collatz, G.J.; Kasibhatla, P. Estimation of burned area using MODIS active fire observations. Atmos. Chem. Phys. 2006, 6, 957–974. [Google Scholar] [CrossRef]
  59. Diggle, P. A Kernel method for smoothing point process data. Appl. Stat. 1985, 34, 138. [Google Scholar] [CrossRef]
  60. Müller, D.; Suess, S. Can the MODIS active fire hotspots be used to monitor vegetation fires in the Lao PDR. In Deutsche Gesellschaft für Internationale Zusammenarbeit (GIZ) Climate Protection through Avoided Deforestation (CliPAD) Programme; Deutsche Gesellschaft für Internationale Zusammenarbeit (GIZ): Bonn, Germany, 2011; 50p. [Google Scholar]
  61. Boschetti, L.; Roy, D.; Hoffmann, A.A.; Humber, M. MODIS Collection 5 Burned Area Product-MCD45. User’s Guide Ver. 2009, 2, 1–2. [Google Scholar]
  62. Dahan, K.S.; N’da, H.D.; Kaudjhis, C.A. Dynamique spatiotemporelle des feux de 2001 à 2019 et dégradation du couvert végétalen zone de contact forêt-savane, Département de Toumodi, Centre de la Côte d’Ivoire. Afr. Sci. 2021, 19, 94–113. [Google Scholar]
  63. Fornacca, D.; Ren, G.; Xiao, W. Performance of three MODIS fire products (MCD45A1, MCD64A1, MCD14ML), and ESA Fire_CCI in a mountainous area of Northwest Yunnan, China, characterized by frequent small fires. Remote Sens. 2017, 9, 1131. [Google Scholar] [CrossRef]
  64. N’tambwe Nghonda, D.-d.; Muteya, H.K.; Kashiki, B.K.W.N.; Sambiéni, K.R.; Malaisse, F.; Sikuzani, Y.U.; Kalenga, W.M.; Bogaert, J. Towards an Inclusive Approach to Forest Management: Highlight of the Perception and Participation of Local Communities in the Management of miombo Woodlands around Lubumbashi (Haut-Katanga, D.R. Congo). Forests 2023, 14, 687. [Google Scholar] [CrossRef]
  65. Bamba, I.; Yedmel, M.S.; Bogaert, J. Effets des routes et des villes sur la forêt dense dans la province orientale de la République Démocratique du Congo. Eur. J. Sci. Res. 2010, 43, 417–429. [Google Scholar]
  66. Caillault, S.; Ballouche, A.; Delahaye, D. Organisation spatio-temporelle des feux de brousse. Approche comparative au Burkina Faso. In Proceedings of the Actes des Neuvièmes Rencontres de Théo Quant, Besançon, France, 9 March 2010. [Google Scholar]
  67. Giglio, L.; Schroeder, W.; Hall, J.; Justice, C. MODIS Collection 6 Active Fire Product User’s Guide Revision, B. NASA. 2018. Available online: https://www.earthdata.nasa.gov/s3fspublic/imported/MODIS_C6_Fire_User_Guide_B.pdf (accessed on 25 July 2023).
  68. Cizungu, N.C.; Tshibasu, E.; Lutete, E.; Mushagalusa, C.A.; Mugumaarhahama, Y.; Ganza, D.; Bogaert, J. Fire risk assessment, spatiotemporal clustering and hotspot analysis in the Luki biosphere reserve region, western DR Congo. Trees For. People 2021, 5, 100104. [Google Scholar] [CrossRef]
  69. Fusco, J. Analyse des Dynamiques Spatio-Temporelles des Systèmes de Peuplement Dans un Contexte D’incertitude. Application à L’archéologie Spatiale. Ph.D. Thesis, UMR 7300 ESPACE (Université Nice Sophia-Antipolis), Nice, France, 2016. [Google Scholar]
  70. Ricotta, C.; Bajocco, S.; Guglietta, D.; Conodera, M. Assensing the influence of roads on five inition: Does land cover matter? Fire 2018, 1, 24. [Google Scholar] [CrossRef]
  71. Gueguim, C.D.; Tchamba, N.M.; Fotso, C.R. Dynamique spatio-temporelle des feux de brousse dans le Parc National du Mbam et Djerem (Cameroun). Int. J. Biol. Chem. Sci. 2018, 12, 728–748. [Google Scholar] [CrossRef]
  72. Guiot, J.; Mazurek, H.; Curt, T.; Raimbault, P.; Collange, L.; Thomas, S. Marseille et L’environnement: Bilan, Qualité et Enjeux: Le Développement Durable D’une Grande Ville Littorale Face au Changement Climatique; Presses Universitaires de Provence: Aix en Provence, France, 2021. [Google Scholar]
  73. Mouillot, F.; Dupuy, J.L.; Barbero, R. Feux de Végétation: Comprendre Leur Diversité et Leur Evolution; Quae: Versailles, France, 2022; pp. 1–136. [Google Scholar]
  74. Colin, P.Y.; Marielle, J.; Mariel, A. La Prévention: Éviter Tout Départ de Feu, Protection des Forêts Contre L’incendie, Cahier FAO Conservation n 36; Inrae: Provence-Alpes-Côte, France, 2001; pp. 61–66. [Google Scholar]
  75. Lutete, E.L.; Lubini, C.; Kibambe, L.; Ngomba, M.N.; Luya, Y.W.; Lumbuenamo, R.S. Impacts of bush fires on biodiversity of Sudanian and Zambezian savanna of the Democratic Republic of Congo–case study on three protected areas: Upemba, Kundelungu and Garamba National Parks, and Bombo-Lumene hunting domain from 2000 to 2014. Int. J. Adv. Res. 2016, 4, 2073–2081. [Google Scholar]
  76. Elias, N.; Didier, M. Caractérisation et organisation spatio-temporelle des feux actifs au Burundi de 2001 à 2016 sur base des données MODIS 17. Bull. Sci. Environ. Biodivers. 2019, 3, 16–31. [Google Scholar]
  77. Opha, P.D. Linking fire and climate: Interactions with land use, vegetation, and soil. Curr. Opin. Environ. Sustain. 2009, 1, 161–169. [Google Scholar]
  78. Afelu, B.; Kokou, K. Paramètres physiques d’évaluation du comportement des feux de végétation au Togo. Int. J. Biol. Chem. Sci. 2015, 9, 2091–2105. [Google Scholar] [CrossRef]
  79. Watson, F.G.; Becker, M.S.; Milanzi, J.; Nyirenda, M. Human encroachment into protected area networks in Zambia: Implications for large carnivore conservation. Reg. Environ. Chang. 2014, 15, 415–429. [Google Scholar] [CrossRef]
  80. Melo, P.; Sparacino, J.; Argibay, D.; Sousa Júnior, V.; Barros, R.; Espindola, G. Assessing Wildfire Regimes in Indigenous Lands of the Brazilian Savannah-Like Cerrado. Fire 2021, 4, 34. [Google Scholar] [CrossRef]
  81. Mbemba, C.; Karsenty, A.; Ringuet, S. Impacts of Land Use Changes on Vegetation Fires in the Miombo Woodlands of Central Africa. Int. J. Wildland Fire 2019, 28, 335–346. [Google Scholar]
  82. Timothy, J.; George, L.W.; Sarah, V.; Azharul, A. Managing Fire and Biodiversity in the Wildland Urban Interface: A Role for Green Firebreaks. Fire 2018, 1, 3. [Google Scholar] [CrossRef]
  83. Schmidt, I.B.; Eloy, L. Fire regime in the Brazilian Savanna: Recent changes, policy and management. Flora 2020, 268, 151613. [Google Scholar] [CrossRef]
  84. Arbonnier, M.; Gueye, B. Vers Une Stratégie de Gestion des Feux de Brousse Dans la Zone D’intervention de Wula-Nafaa: Régions de Tambacounda, Kolda et Sedhiou; USAID. 2010. Available online: https://agritrop.cirad.fr/558795/ (accessed on 1 March 2023).
  85. Mishra, B.; Gyawali, B.R.; Paudel, K.P.; Poudyal, N.C.; Simon, M.F.; Dasgupta, S.; Antonious, G. Adoption of Sustainable Agriculture Practices among Farmers in Kentucky, USA. Environ. Manag. 2018, 62, 1060–1072. [Google Scholar] [CrossRef]
  86. Gebska, M.; Grontkowska, A.; Swiderek, W.; Golebiewska, B. Farmer awareness and implementation of sustainable agriculture practices in different types of farms in Poland. Sustainability 2020, 12, 8022. [Google Scholar] [CrossRef]
  87. Brito, B.; Barreto, P. Enforcement against illegal logging in the Brazilian Amazon. In Compliance and Enforcement in Environmental Law; Edward Elgar Publishing: Cheltenham, UK, 2011. [Google Scholar]
  88. Goncalves, M.P.; Panjer, M.; Greenberg, T.S.; Magrath, W.B. Justice for Forests. Improving Criminal Justice Efforts to Combat Illegal Logging; The World Bank: Washington, DC, USA, 2012. [Google Scholar]
  89. Ghali, R.; Jmal, M.; Souidene Mseddi, W.; Attia, R. Recent Advances in Fire Detection and Monitoring Systems: A Review. In Proceedings of the 8th International Conference on Sciences of Electronics, Technologies of Information and Telecommunications (SETIT’18), Vol.1. SETIT 2018. Smart Innovation, Systems and Technologies; Bouhlel, M., Rovetta, S., Eds.; Springer: Cham, Switzerland, 2020; Volume 146. [Google Scholar] [CrossRef]
  90. Wang, J.; Weng, H.; Yan, Y.; Li, C. Modelling and Simulation Analysis of Drones Allocation for Bushfires. J. Phys. Conf. Ser. 2021, 1995, 012001. [Google Scholar]
  91. Landscape. Available online: https://www.landscape.sa.gov.au/mr/publications/bushfire-prevention-bushfire-management-zones (accessed on 12 October 2023).
Figure 1. Location of the study area (A), the Lubumbashi charcoal production basin (LCPB), in the southeast of the Democratic Republic of Congo (B) in the province of Upper Katanga (C). Land cover types within the LCPB were obtained from the supervised classification, supported by the maximum likelihood algorithm, of a Landsat image from 15 June 2022.
Land 12 02171 g001
Figure 2. Monthly distribution (%) of fire events in the study area between 2002 and 2022. The x-axis shows the months of the year. The bushfire period in the LCPB extends from April to November each year, with a peak in August.
Land 12 02171 g002
Figure 3. Daily distribution (%) of fire events in the study area between 2002 and 2022. The majority of fire events occurs between 11 a.m. and 12 p.m. The proportions do not add up to 100% because the other times of day were removed from the analysis because their frequency is always less than 1%.
Land 12 02171 g003
Figure 4. Map of cumulative fire occurrence between 2002 and 2022, produced using the non-parametric kernel density estimation (KDE) method. There was a high concentration of fires in the southwest and central part of the LCPB, including along roads.
Land 12 02171 g004
Figure 5. Annual distribution of burnt areas in the LCPB between 2002 and 2022. The analyses concern the month of August only. Since the 2004 period, the area burnt in the LCPB has remained at over 5000 km2.
Land 12 02171 g005
Figure 6. Maps of burnt areas in the LCPB (between 2002 and 2022) based on MODIS data (MCD64A1).
Land 12 02171 g006
Figure 7. Fire spread around roads (a) and dwellings (b) and the distribution of burnt areas around roads (c) and dwellings (d) in the LCPB. Roads play an important role in the spread of fires and burnt areas, unlike dwellings.
Land 12 02171 g007
Table 1. Land cover types obtained after supervised classification of Landsat images on GEE, based on random forest classifier.
Land Use ClassesDescriptionNumber of Training Zones (Polygons)
ForestsNatural land cover: miombo forest, with patches of dense, dry forest and gallery forest55
SavannahGenerally anthropogenic land cover: characterized by a low density of trees and a predominance of herbaceous cover. It is more often replaced by bare land in the dry season, after the end of the vegetation period.50
FieldThis class of anthropogenic land cover is made up of agricultural land after harvesting, abandoned agricultural land, or land occupied by annual and off-season crops.45
Other land coverThe bare land/building complex, bodies of water, and unclassified areas50
Table 2. Accuracy assessment and area estimate for the land cover and land cover change map based on the Landsat image supervised classification using the random forest classifier. FR stands for forest, SV for savannah, FD for field, BBS for built-up and bare soil, OT for other land cover, UA for user’s accuracy; PA for producer accuracy, and CI for confidence interval. The change in other land covers was not assessed, as it was very small (the class remained stable over all the periods studied).
2002–2004FR StableSV StableFD StableBBS StableOT StableFR LossSV GainFD GainBBS Gain
Accuracy measure
PA (%)96.5991.78100.0096.1299.07100.00100.0098.1094.62
UA (%)96.5998.0595.4197.06100.0098.0498.0294.5091.67
Overall accuracy (%)96.74
Stratified estimators of area ± CI (% of total map area)
Area (%)18.0619.309.169.079.438.818.729.258.19
95% CI0.640.800.380.450.170.240.240.480.61
2004–2007FR StableSV StableFD StableBBS StableOT StableFR LossSV GainFD GainOT Gain
Accuracy measure
PA (%)94.3493.9899.01100.00100.00100.0095.88100.00100.00
UA (%)99.0198.5499.0199.0396.0896.3089.4297.9898.25
Overall accuracy (%)97.37
Stratified estimators of area ± CI (% of total map area)
Area (%)18.2318.148.769.129.299.208.948.679.65
95% CI0.000.420.300.350.000.170.170.380.54
2007–2010FR StableSV StableFD StableBBS StableOT StableFR LossSV GainFD GainOT Gain
Accuracy measure
PA (%)10098.048810098.058310099.038510098.979693.578
UA (%)10099.014897.058898.058310010099.019696.039697.1429
Overall accuracy (%)98.67
Stratified estimators of area ± CI (% of total map area)
Area (%)18.1518.158.469.258.638.998.638.029.96
95% CI0.450.460.470.300.340.000.380.240.34
2010–2013FR StableSV StableFD StableBBS StableOT StableFR LossSV GainFD GainOT Gain
Accuracy measure
PA (%)98.0696.60100.0097.14100.00100.0098.9897.8097.35
UA (%)98.54100.0092.31100.0096.08100.0096.04100.0099.10
Overall accuracy (%)98.21
Stratified estimators of area ± CI (% of total map area)
Area (%)18.3217.969.309.218.669.219.218.949.21
95% CI0.250.470.300.250.180.250.310.310.31
Table 3. Accuracy assessment and area estimate for the land cover and land cover change map based on the Landsat image supervised classification using the random forest classifier. FR stands for forest, SV for savannah, FD for field, BBS for built-up and bare soil, OT for other land cover, UA for user’s accuracy, PA for producer accuracy, and CI for confidence interval. The change in other land covers was not assessed, as it was very small (the class remained stable over all the periods studied).
2013–2016FR StableSV StableFD StableBBS StableOT StableFR LossSV GainFD GainOT Gain
Accuracy measure
PA (%)100.0098.49100.0099.02100.0098.0498.0497.9897.06
UA (%)99.0298.0097.1799.0298.97100.0099.0198.98100.00
Overall accuracy (%)98.83
Stratified estimators of area ± CI (% of total map area)
Area (%)18.3217.969.309.218.669.219.218.949.21
95% CI0.250.470.300.250.180.250.310.310.31
2016–2019FR StableSV StableFD StableBBS StableOT StableFR LossSV GainFD GainOT Gain
Accuracy measure
PA (%)100.0094.4298.99100.00100.0098.1198.10100.00100.00
UA (%)99.01100.0098.0097.0998.0699.0599.0498.9995.10
Overall accuracy (%)98.48
Stratified estimators of area ± CI (% of total map area)
Area (%)17.8419.188.838.929.019.469.378.748.65
95% CI0.250.600.300.300.250.300.300.170.38
2019–2022FR StableSV StableFD StableBBS StableOT StableFR LossSV GainFD GainOT Gain
Accuracy measure
PA (%)100.0099.03100.0098.04100.00100.00100.00100.0098.08
UA (%)100.00100.0099.00100.0098.02100.00100.0099.0698.08
Overall accuracy (%)99.47
Stratified estimators of area ± CI (% of total map area)
Area (%)18.4718.388.839.108.839.199.199.379.28
95% CI0.000.250.170.250.250.000.000.170.35
Table 4. Total number (n) of fire events (between 2002 and 2022) and their percentage distribution (%) according to their destructive power. There has been a significant increase in fire incidents since 2002.
Radiative Power (%)
Low to Very LowModerateStrong
2002 (n = 7254)76159
2004 (n = 10,824)74179
2007 (n = 10,646)74179
2010 (n = 12,207)721810
2013 (n = 11,722)73189
2016 (n = 12,152)76168
2019 (n = 12,714)77167
2022 (n = 12,373)75178
Table 5. Annual fire numbers and monthly burnt area (month of August) by land-use unit (forest, savannah, field, and fallow) in the LCPB between 2002 and 2022. The fires mainly affected and burnt the savannahs.
Land CoverNumber of Fires by Land Cover
20022004200720102013201620192022
Forest42135726548252174609435034493091
Savannah30015043508168566917755588748994
Field1519323255106107182
Total722910,78810,59512,10511,58112,01112,43012,267
Land CoverArea burnt by land cover (km2)
20022004200720102013201620192022
Forest2196.594028.413621.723144.002866.462606.802199.421718.54
Savannah1195.072117.752008.943377.281819.792234.822735.774352.35
Field 4.7116.0519.5912.8418.121819.7930.51113.03
Total3396.376162.215650.256534.124704.376661.414965.76183.92
Disclaimer/Publisher’s Note: The statements, opinions and data contained in all publications are solely those of the individual author(s) and contributor(s) and not of MDPI and/or the editor(s). MDPI and/or the editor(s) disclaim responsibility for any injury to people or property resulting from any ideas, methods, instructions or products referred to in the content.

