
Recognition and Spatial Distribution of Rural Buildings in Vietnam


Abstract
:1. Introduction
2. Methodology
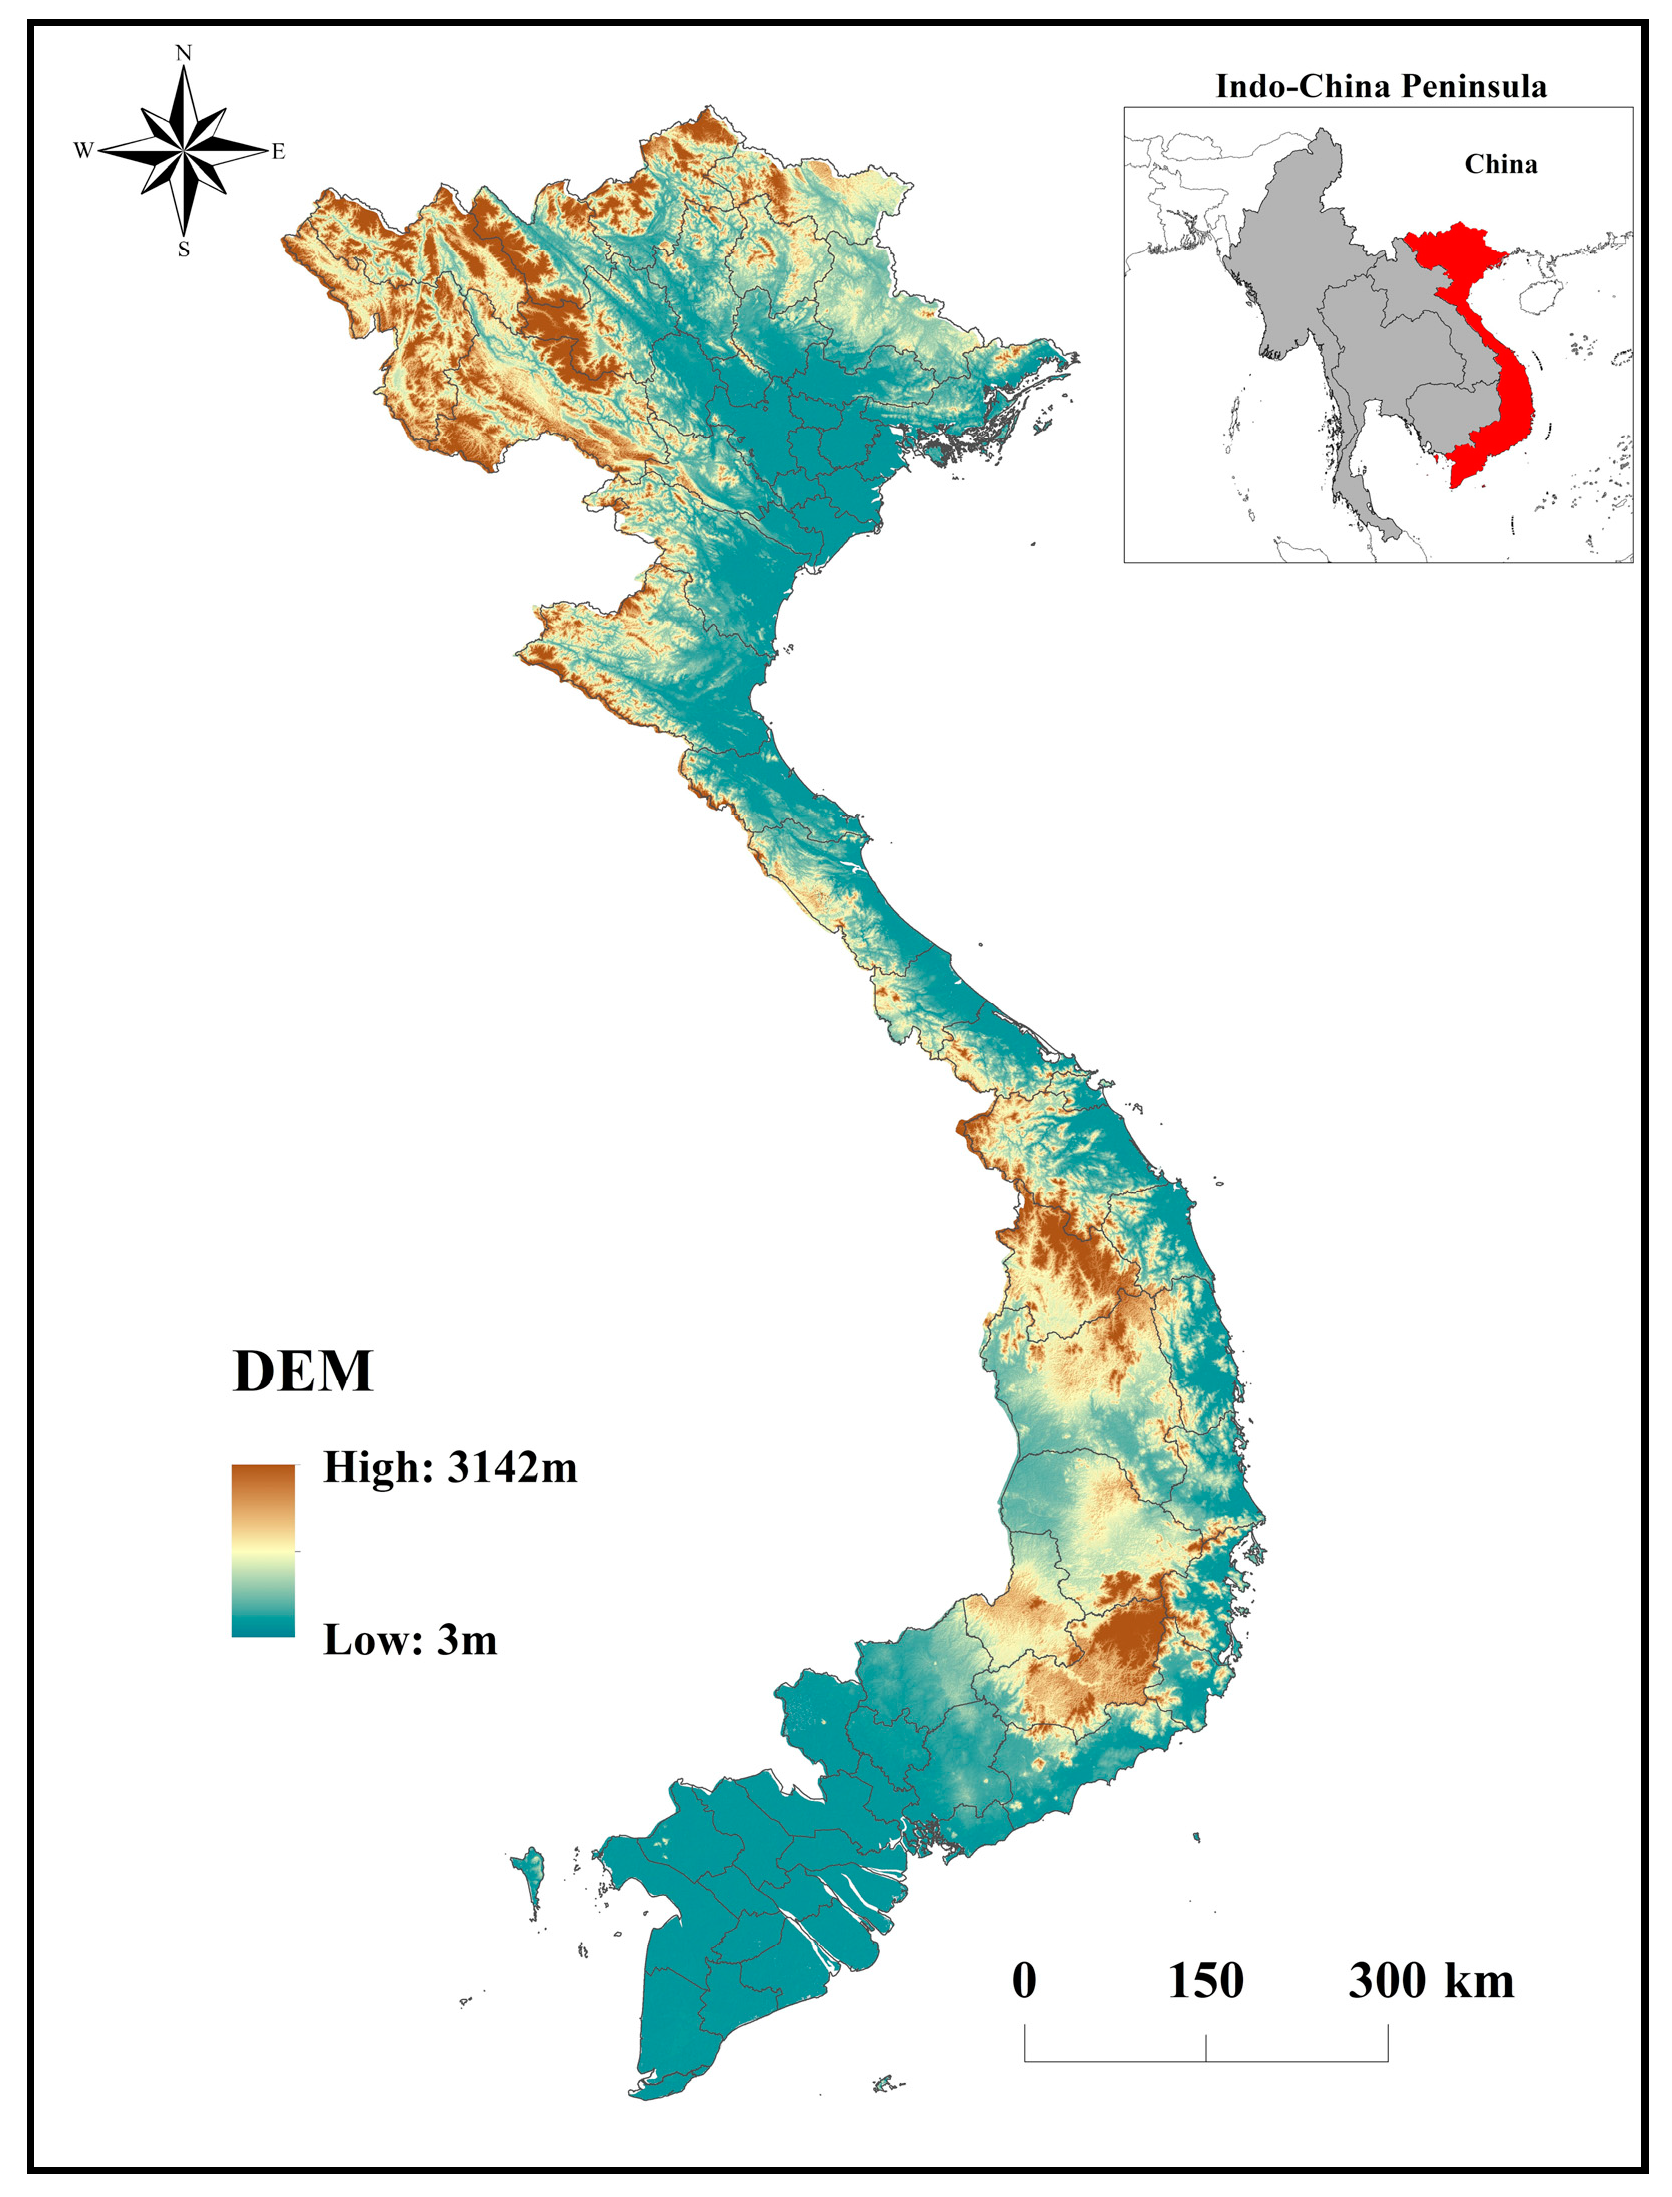
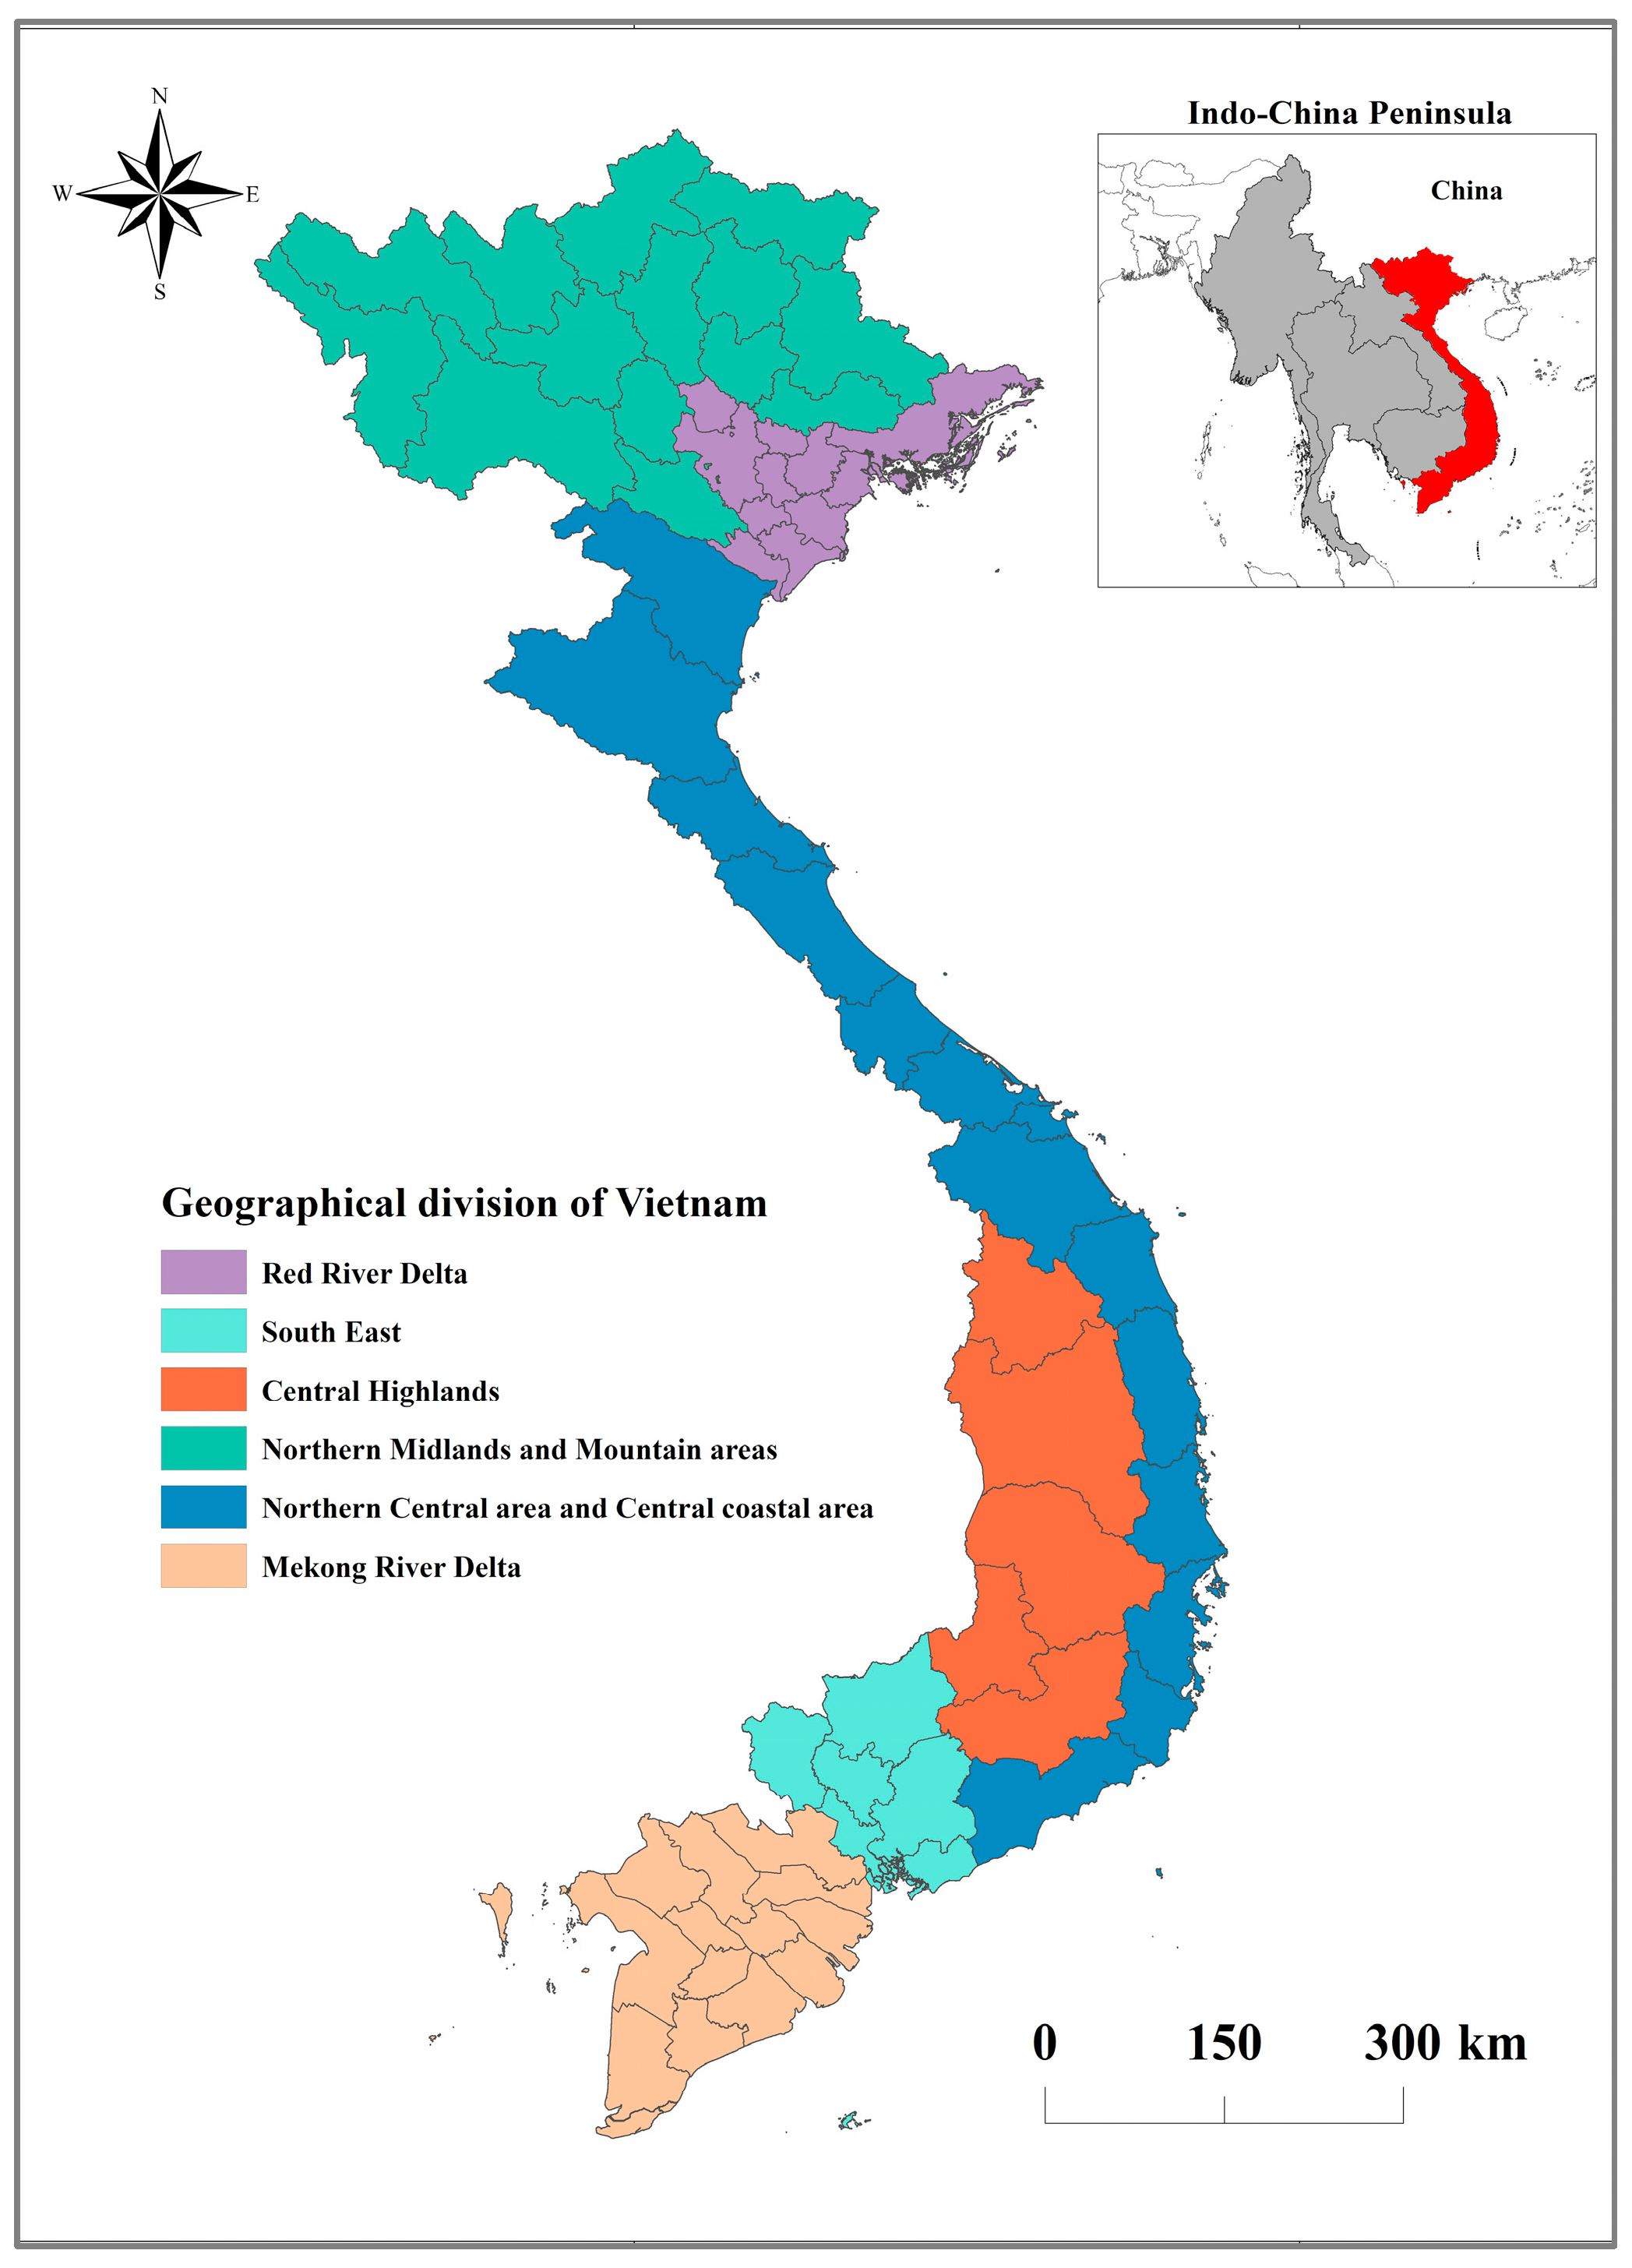
2.1. Study Area
2.2. Date Sets
2.3. Method
2.3.1. Image Recognition
2.3.2. Model Training
2.3.3. Manual Verification
2.3.4. Quantitative Testing
3. Results
3.1. Results of Rural Buildings Extraction
3.2. Date Verification
3.2.1. Manual Sampling Verification
3.2.2. Correlation Testing
3.3. Analysis of Rural Buildings Distribution
3.3.1. Analysis on the National Scale
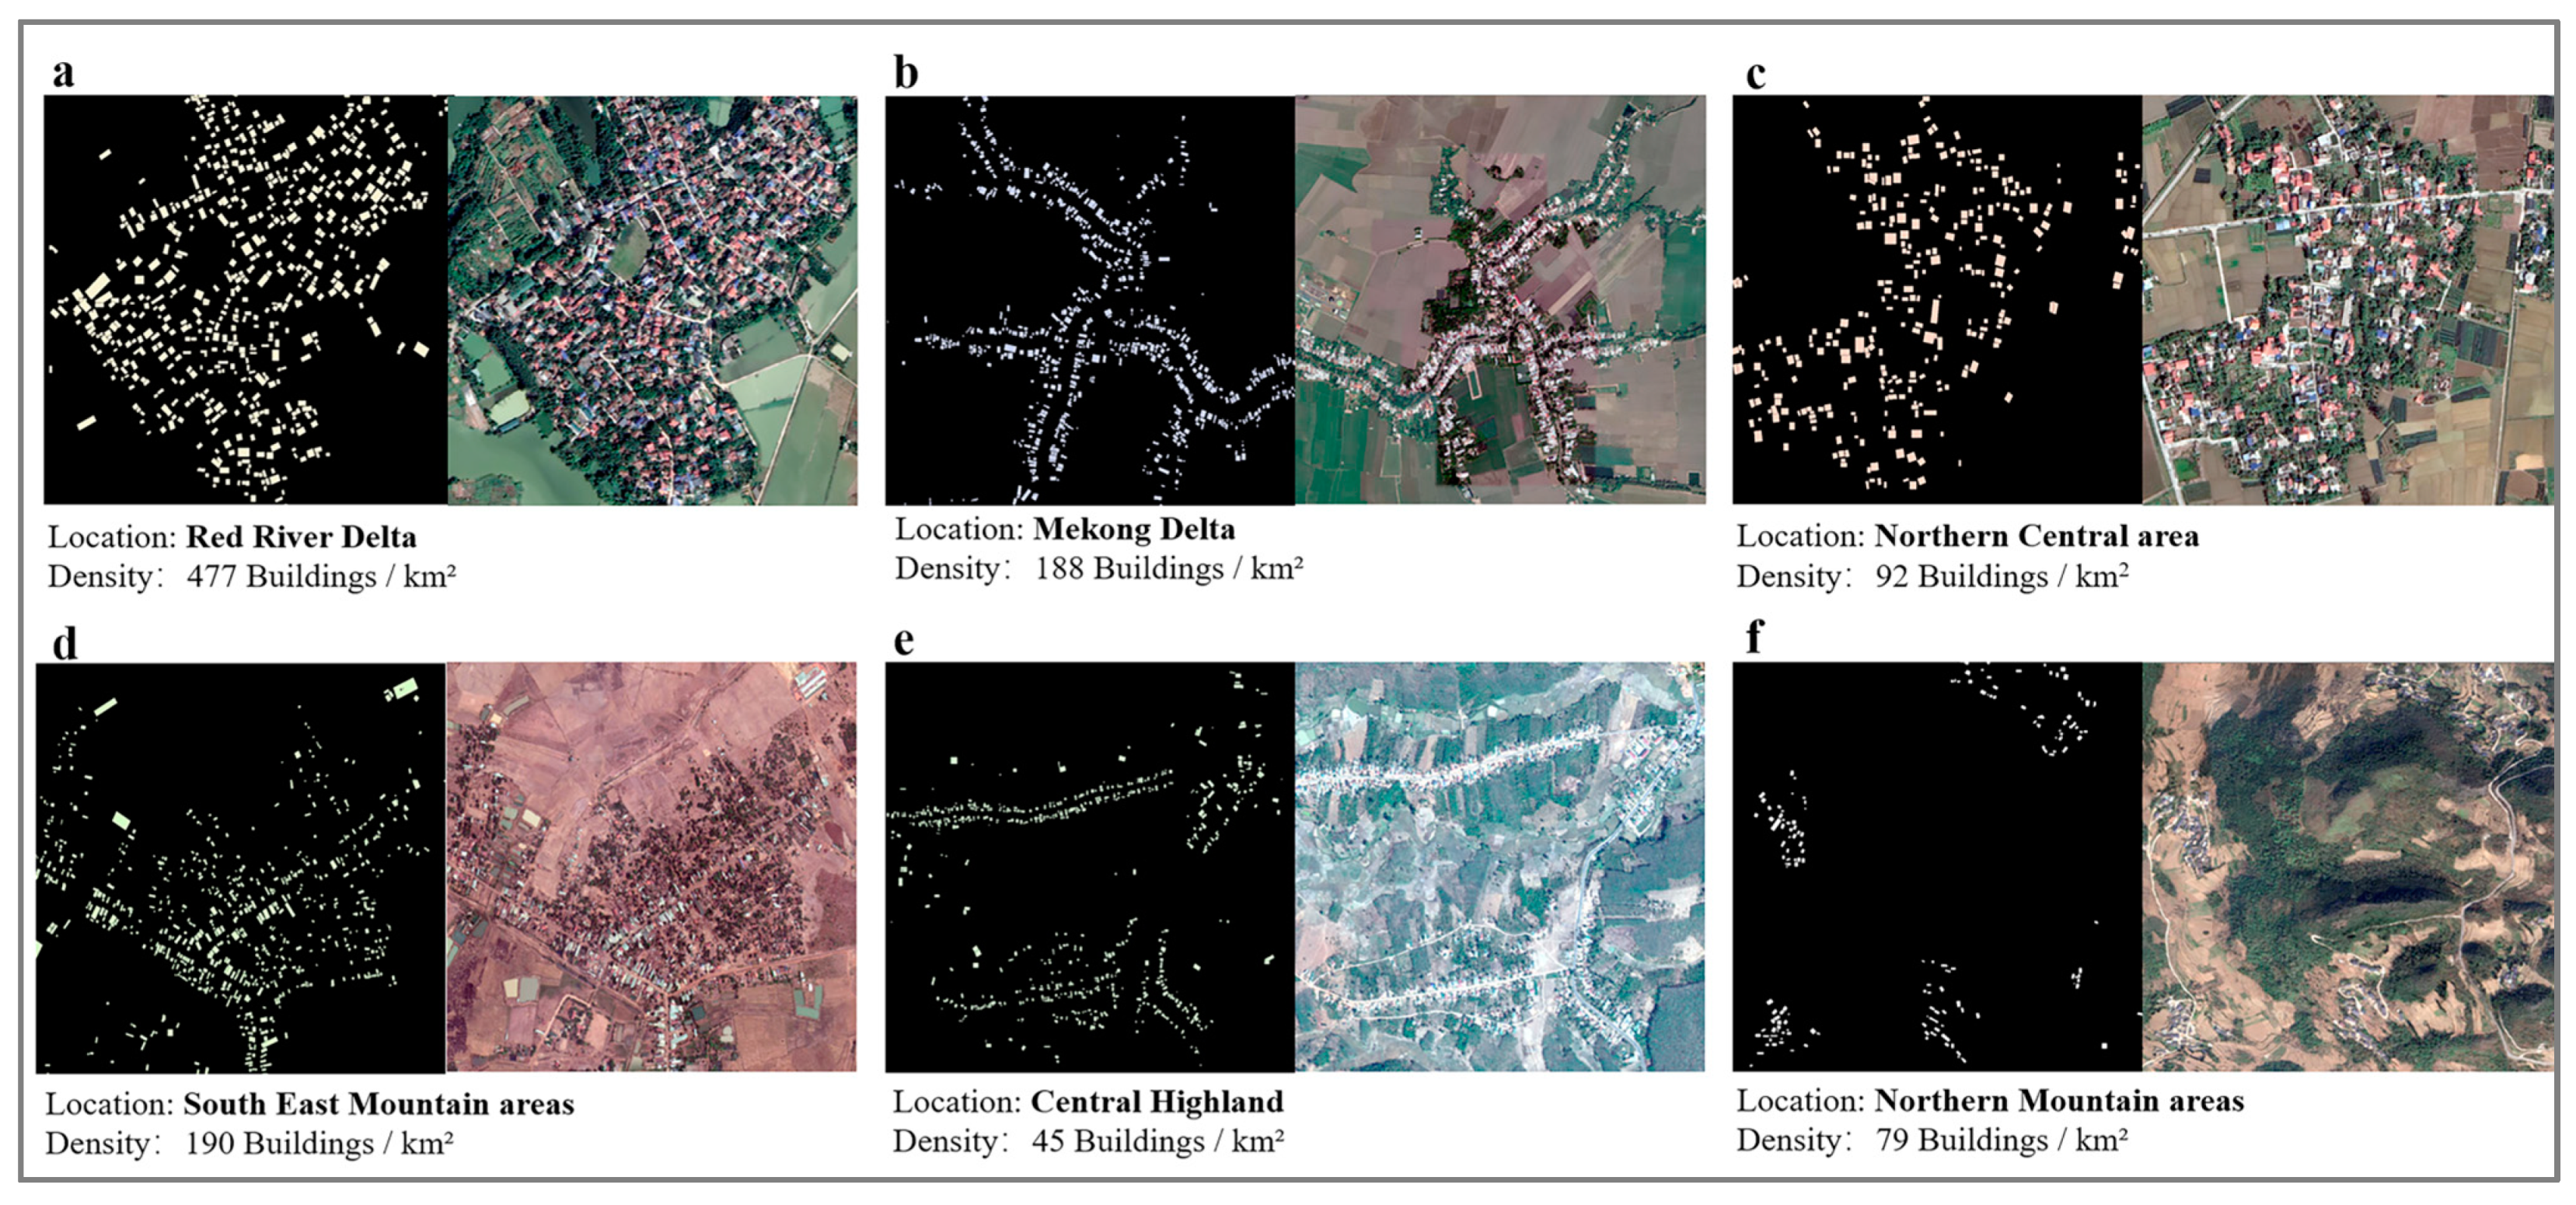
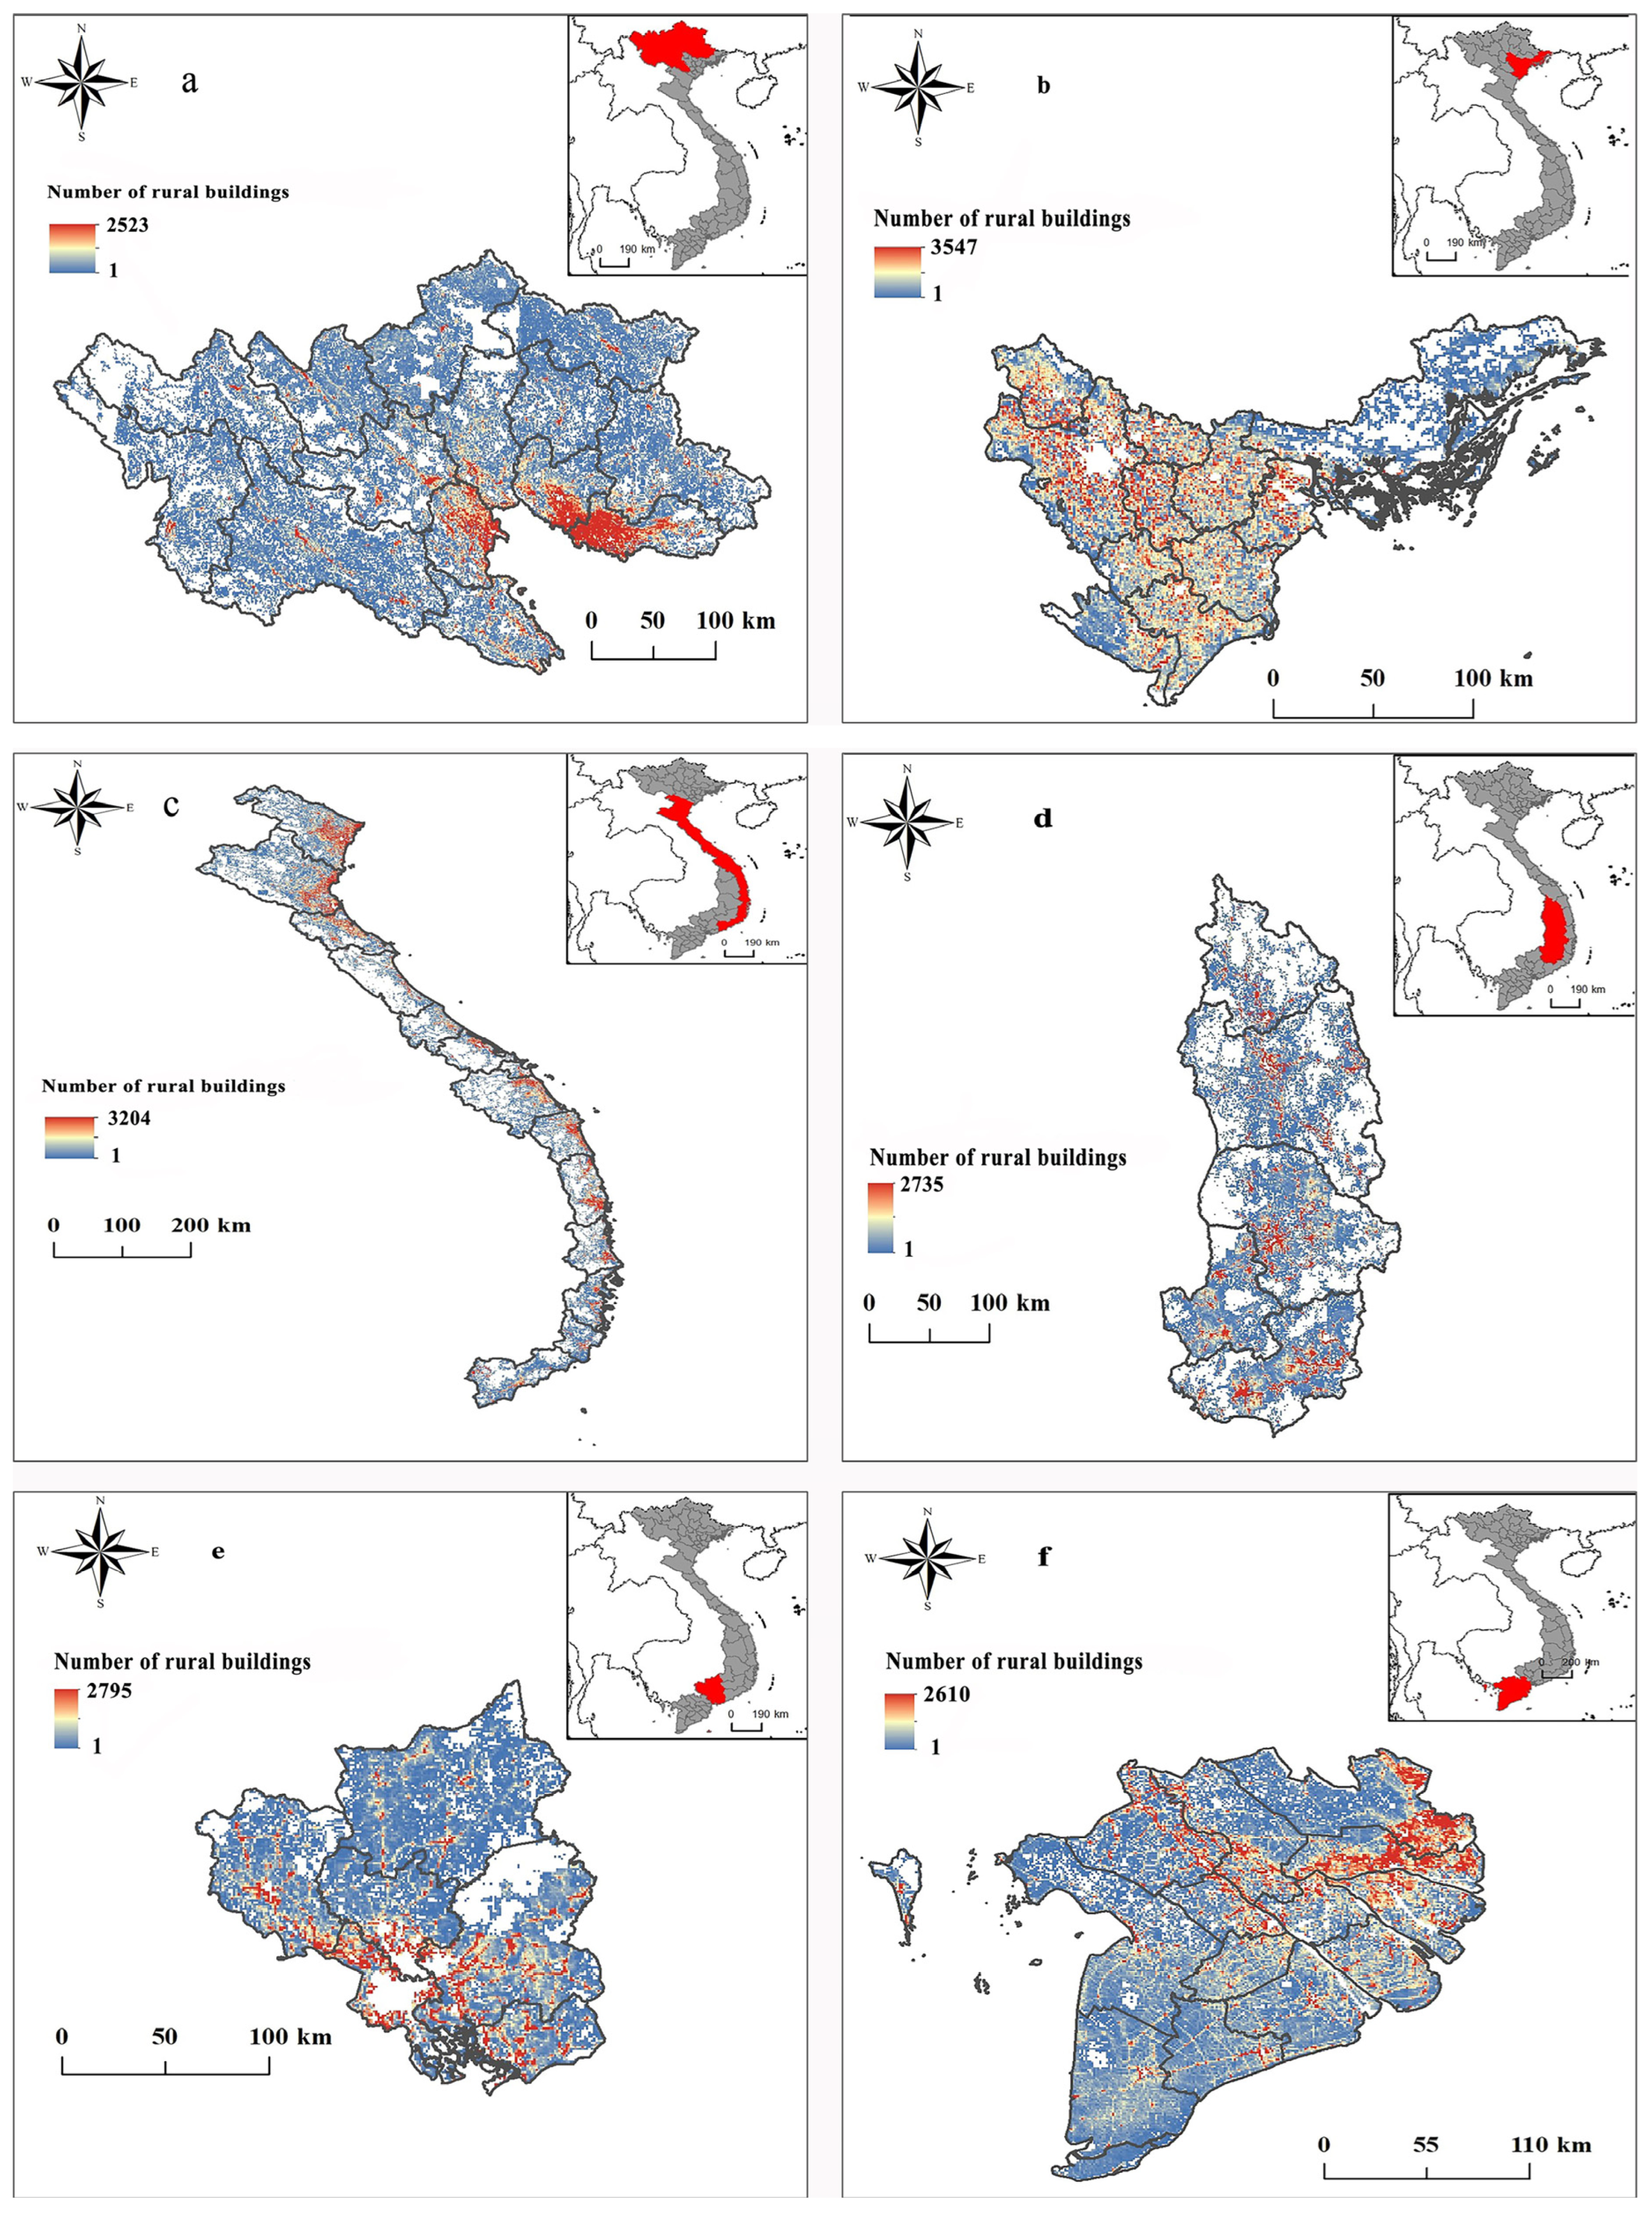
3.3.2. Analysis on the Regional Scale
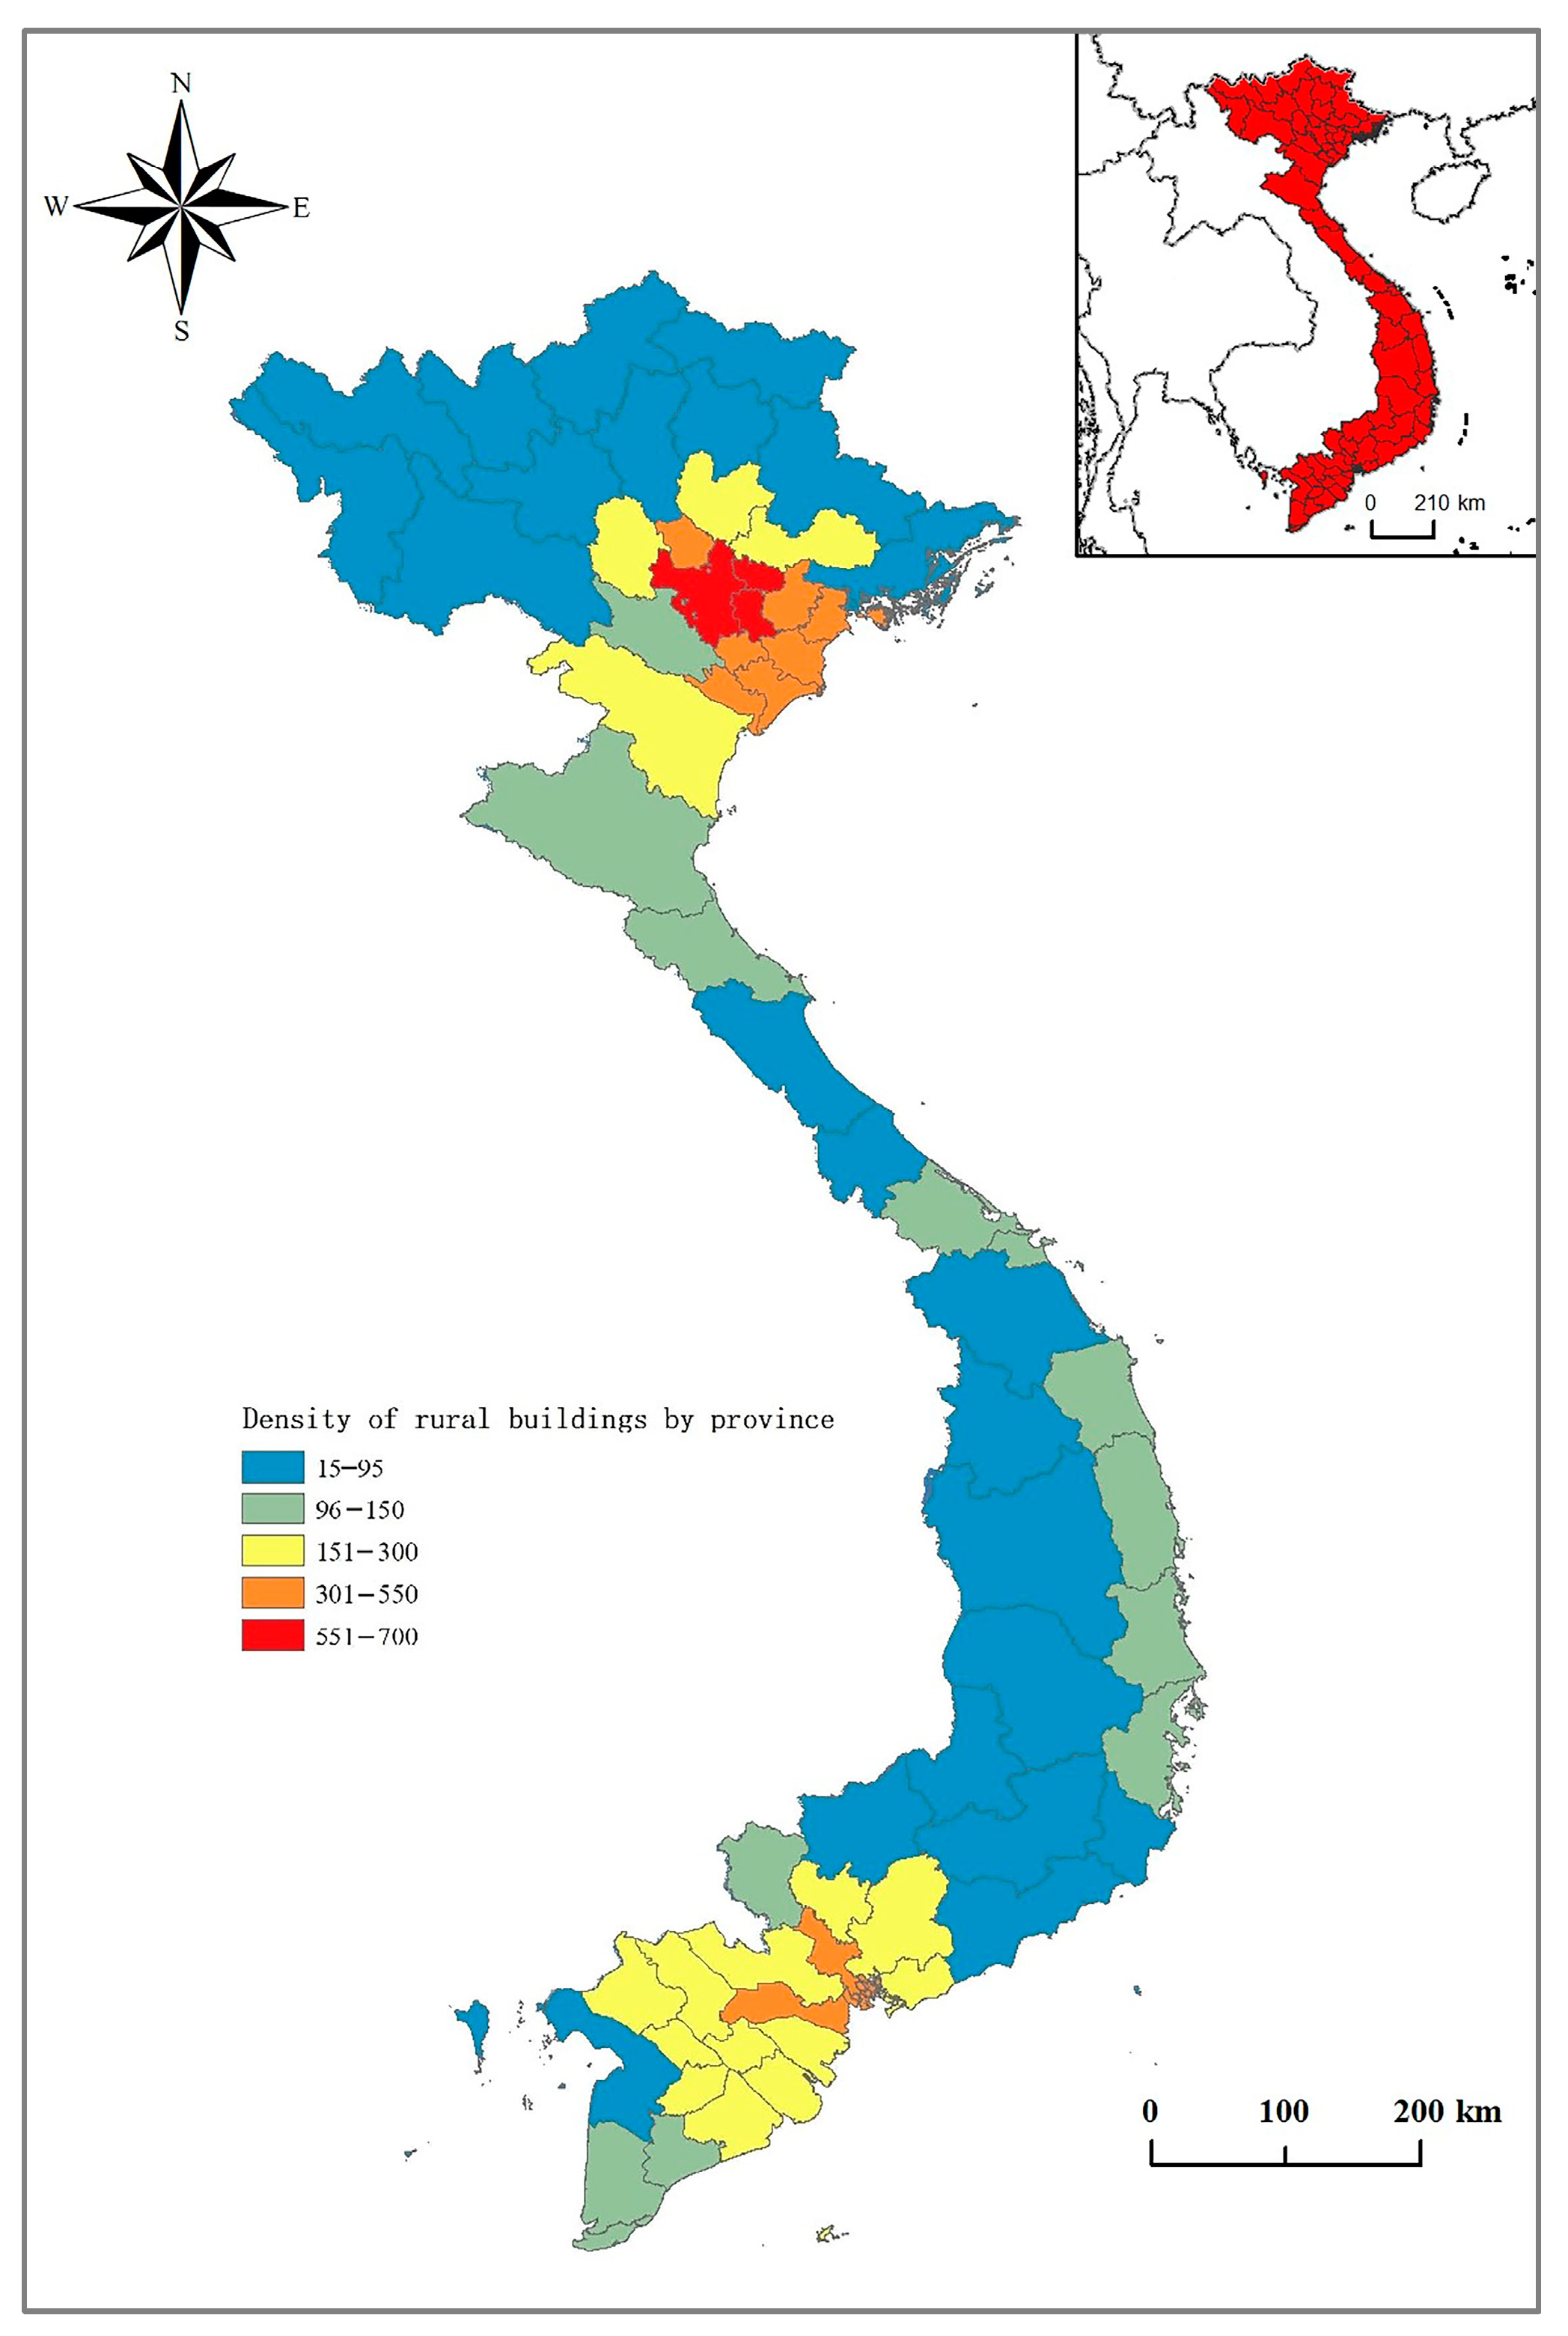
3.3.3. Analysis on the Provincial Scale
4. Conclusions and Prospects
Author Contributions
Funding
Data Availability Statement
Conflicts of Interest
| 1 | Data Sources: https://data.worldbank.org/country/viet-nam (accessed on 15 March 2023). |
| 2 | Data Sources: https://data.worldbank.org/indicator/SP.URB.TOTL?locations=VN (accessed on 15 March 2023). |
| 3 | Data Sources: https://www.gso.gov.vn/en/data-and-statistics/ (accessed on 25 March 2023). |
References
- Nguyen, T.A.; Gillen, J.; Rigg, J. Economic transition without agrarian transformation: The pivotal place of smallholder rice farming in Vietnam’s modernisation. J. Rural Stud. 2020, 74, 86–95. [Google Scholar] [CrossRef]
- Jin, Q. The Rural Settlement Geography in China; Jiangsu Science and Technology Press: Nanjing, China, 1989. (In Chinese) [Google Scholar]
- Le, T.H.; Tran-Nam, B. Relative costs and FDI: Why did Vietnam forge so far ahead? Econ. Anal. Policy 2018, 59, 1–13. [Google Scholar] [CrossRef]
- Vu, H.T.D.; Tran, D.D.; Schenk, A.; Nguyen, C.P.; Vu, H.L.; Oberle, P.; Nestmann, F. Land use change in the Vietnamese Mekong Delta: New evidence from remote sensing. Sci. Total Environ. 2022, 813, 151918. [Google Scholar] [CrossRef] [PubMed]
- Sun, T.; Xiao, X. Analysis of regional differences and influencing factors of rural housing conditions in China. China Market 2016, 20, 36–39. (In Chinese) [Google Scholar]
- McKinley, T.; Wang, L.N. Housing and wealth in rural China. China Econ. Rev. 1992, 3, 195–211. [Google Scholar] [CrossRef]
- Zheng, W.-L.; Wang, Z.-G. Design of a settlement residential space based on fractal structures and isomorphism: A case study on traditional Yi settlements in Chu Xiong. South Archit. 2021, 5, 130–137. (In Chinese) [Google Scholar]
- Lichter, D.T.; Johnson, K.M. Emerging rural settlement patterns and the geographic redistribution of America’s new immigrants. Rural Soc. 2006, 71, 109–131. [Google Scholar] [CrossRef]
- Hosseini, S.B.; Faizi, M.; Norouzian-Maleki, S.; Karimi Azari, A.R. Impact evaluation of rural development plans for renovating and retrofitting of rural settlements: Case Study: Rural Districts of Tafresh in Iran. Environ. Earth Sci. 2015, 73, 3033–3042. [Google Scholar] [CrossRef]
- Dao, M.Q. Rural poverty in developing countries: An empirical analysis. J. Econ. Stud. 2004, 31, 500–508. [Google Scholar]
- Saksena, S.; Fox, J.; Spencer, J.; Castrence, M.; DiGregorio, M.; Epprecht, M.; Sultana, N.; Finucane, M.; Nguyen, L.; Vien, T.D. Classifying and mapping the urban transition in Vietnam. Appl. Geogr. 2014, 50, 80–89. [Google Scholar] [CrossRef]
- Linard, C.; Gilbert, M.; Snow, R.W.; Noor, A.M.; Tatem, A.J. Population distribution, settlement patterns and accessibility across Africa in 2010. PLoS ONE 2012, 7, e31743. [Google Scholar] [CrossRef]
- Schulte, O.; Mumber, J.; Nguyen, T.T. Agricultural commercialisation, asset growth and poverty in rural Vietnam. Aust. J. Agric. Resour. Econ. 2023, 67, 388–416. [Google Scholar] [CrossRef]
- Kerkvliet, B.J.T.; Porter, D.J. Rural Vietnam in rural Asia. In Vietnam’s Rural Transformation; Routledge: London, UK, 2018; pp. 1–37. [Google Scholar]
- Bacud, E.S.; Puskur, R.; Duyen, T.N.L.; Sander, B.O.; Luis, J. Rural outmigration—Feminization—Agricultural production nexus: Case of Vietnam. Migr. Dev. 2021, 10, 442–466. [Google Scholar] [CrossRef]
- Gong, Y. New initiatives of agricultural reform in Vietnam in recent years and a review. Agric. Econ. 2014, 5, 14–16. (In Chinese) [Google Scholar]
- Chuc, N.D.; Anh, D.T. Digital Transformation in Vietnam. J. Southeast Asian Econ. 2023, 40, 127–144. [Google Scholar]
- Nguyen, M.H.; Dang, D.A.; Liu, A.Y. Study of Rural–Urban Migration in Vietnam: The Survey. In Rural–Urban Migration in Vietnam; Population Economics; Springer: Cham, Switzerland, 2019. [Google Scholar] [CrossRef]
- Deng, D. Four paradigms beyond the village: A methodological perspective: A case study of Skinner, Friedman, Zongzhi Huang and Zanqi Du. Soc. Sci. Res. 2010, 2, 130–136. (In Chinese) [Google Scholar]
- Van, C.; Nguyen, Y. A quantitative analysis of housing and its correlates in rural Vietnam. Manag. Sci. Lett. 2020, 10, 2419–2424. [Google Scholar] [CrossRef]
- Vo, T.A.N.; Tran, T.K. Climate change and rural vulnerability in Vietnam: An analysis of livelihood vulnerability index. Hum. Ecol. Risk Assess. Int. J. 2022, 28, 326–353. [Google Scholar] [CrossRef]
- Thuan, N.T.B.; Lofgren, C.; Chuc, N.T.K.; Lindholm, L. Are the Estimates of Catastrophic Health Expenditure Among Rural Population too High? A Comparison of Studies in Vietnam. Open Public Health J. 2008, 1, 25–31. [Google Scholar] [CrossRef]
- Chen, Y.; Xu, W. Evaluation of village view AI-assisted rural construction. World Arch. 2022, 11, 20–21. (In Chinese) [Google Scholar]
- McKay, A.; Singhal, S.; Tarp, F. Welfare Dynamics in Rural Vietnam: Learning from Regular, High-Quality Panel Data; United Nations University World Institute for Development Economics Research (UNU-WIDER): Helsinki, Finland, 2018; ISBN 9789292307226. [Google Scholar] [CrossRef]
- Nguyen, D.L.; Grote, U.; Nguyen, T.T. Migration, crop production and non-farm labor diversification in rural Vietnam. Econ. Anal. Policy 2019, 63, 175–187. [Google Scholar] [CrossRef]
- Li, N.W. North-South Differences in Vietnamese Villages and Cultural Characteristics of Water Trade in the South. Taiwan. J. SE Asia Stud. 2018, 13, 59–77. (In Chinese) [Google Scholar]
- Wan, H.; Tang, X. Symbolic symbolization and identity construction of rural residential landscapes along the Sino Vietnamese border—A case of border villages in Long Zhou County, Guangxi. Sci. Geogr. Sin. 2017, 37, 595–602. (In Chinese) [Google Scholar]
- Arouri, M.; Nguyen, C.; Youssef, A.B. Natural disasters, household welfare, and resilience: Evidence from rural Vietnam. World Dev. 2015, 70, 59–77. [Google Scholar] [CrossRef]
- Yuan, Q.; Shen, H.; Li, T.; Li, Z.; Li, S.; Jiang, Y.; Xu, H.; Tan, W.; Yang, Q.; Wang, J.; et al. Deep learning in environmental remote sensing: Achievements and challenges. Remote Sens. Environ. 2020, 241, 111716. [Google Scholar] [CrossRef]
- Hernández, J.; Garcıa, L.; Ayuga, F. Integration methodologies for visual impact assessment of rural buildings by geographic information systems. Biosyst. Eng. 2004, 88, 255–263. [Google Scholar] [CrossRef]
- Chen, S.; Ogawa, Y.; Zhao, C.; Sekimoto, Y. Large-scale individual building extraction from open-source satellite imagery via super-resolution-based instance segmentation approach. SPRS J. Photogramm. Remote Sens. 2023, 195, 129–152. [Google Scholar] [CrossRef]
- Amo-Boateng, M.; Sey, N.E.N.; Amproche, A.A.; Domfeh, M.K. Instance segmentation scheme for roofs in rural areas based on Mask R-CNN. Egypt. J. Remote Sens. Space Sci. 2022, 25, 569–577. [Google Scholar] [CrossRef]
- Luo, L.; Guo, X. Recognition and Extraction of Blue-roofed Houses in Remote Sensing Images based on Improved Mask-RCNN. Int. Core J. Eng. 2022, 8, 639–645. [Google Scholar]
- Wu, W.; Liu, H.; Li, L.; Long, Y.; Wang, X.; Wang, Z.; Li, J.; Chang, Y. Application of local fully Convolutional Neural Network combined with YOLO v5 algorithm in small target detection of remote sensing image. PLoS ONE 2021, 16, e0259283. [Google Scholar] [CrossRef]
- Conrad, C.; Rudloff, M.; Abdullaev, I.; Thiel, M.; Löw, F.; Lamers, J. Measuring rural settlement expansion in Uzbekistan using remote sensing to support spatial planning. Appl. Geogr. 2015, 62, 29–43. [Google Scholar] [CrossRef]
- Zhou, Y.; Liu, Y. Solar power brings money to rural areas. Nature 2018, 560, 29–30. [Google Scholar] [CrossRef]
- Gassar, A.A.A.; Cha, S.H. Review of geographic information systems-based rooftop solar photovoltaic potential estimation approaches at urban scales. Appl. Energy 2021, 291, 116817. [Google Scholar] [CrossRef]
- Zou, S.; Wang, L. Individual Vacant House Detection in Very-High-Resolution Remote Sensing Images. Ann. Assoc. Am. Geogr. 2020, 110, 449–461. [Google Scholar] [CrossRef]
- Schuegraf, P.; Schnell, J.; Henry, C.; Bittner, K. Building section instance segmentation with combined classical and deep learning methods. ISPRS Ann. Photogramm. Remote Sens. Spat. Inf. Sci. 2022, 2, 407–414. [Google Scholar] [CrossRef]
- Wang, W.; Shi, Y.; Zhang, J.; Hu, L.; Li, S.; He, D.; Liu, F. Traditional Village Building Extraction Based on Improved Mask R-CNN: A Case Study of Beijing, China. Remote Sens. 2023, 15, 2616. [Google Scholar] [CrossRef]
- Zhang, X.; An, G.; Liu, Y. Mask R-CNN with feature pyramid attention for instance segmentation. In Proceedings of the 2018 14th IEEE International Conference on Signal Processing (ICSP), Beijing, China, 12–16 August 2018; pp. 1194–1197. [Google Scholar]
- Ghanea, M.; Moallem, P.; Momeni, M. Building extraction from high-resolution satellite images in urban areas: Recent methods and strategies against significant challenges. Int. J. Remote Sens. 2016, 37, 5234–5248. [Google Scholar] [CrossRef]
- Stiller, D.; Stark, T.; Wurm, M.; Dech, S.; Taubenbock, H. Large-scale building extraction in very high-resolution aerial imagery using Mask R-CNN. In Proceedings of the 2019 Joint Urban Remote Sensing Event (JURSE), Vannes, France, 22–24 May 2019; pp. 1–4. [Google Scholar]
- Tiede, D.; Schwendemann, G.; Alobaidi, A.; Wendt, L.; Lang, S. Mask R- CNN- based building extraction from VHR satellite data in operational humanitarian action: An example related to COVID-19 response in Khartoum, Sudan. Trans. GIS 2021, 25, 1213–1227. [Google Scholar] [CrossRef]
- ISPRS 2D Semantic Labeling Contest. 2018. Available online: http://www2.isprs.org/commissions/comm3/wg4/semantic-labeling.html (accessed on 21 February 2023).
- Mnih, V. Machine Learning for Aerial Image Labeling. Ph.D. Thesis, University of Toronto, Toronto, ON, Canada, 2013. [Google Scholar]
- Maggiori, E.; Tarabalka, Y.; Charpiat, G.; Alliez, P. Can semantic labeling methods generalize to any city? The inria aerial image labeling benchmark. In Proceedings of the 2017 IEEE International Geoscience and Remote Sensing Symposium (IGARSS), Fort Worth, TX, USA, 23–28 July 2017; pp. 3226–3229. [Google Scholar]
- Ji, S.P.; Wei, S.Q.; Lu, M. Fully convolutional networks for multisource building extraction from an open aerial and satellite imagery data set. IEEE Int. Geosci. Remote Sens. 2019, 57, 574–586. [Google Scholar] [CrossRef]
- Nguyen, Q.; Kim, D.C. Reconsidering rural land use and livelihood transition under the pressure of urbanization in Vietnam: A case study of Hanoi. Land Use Policy 2020, 99, 104896. [Google Scholar] [CrossRef]
- Institute of International Trade and Economic Cooperation, Ministry of Commerce of China, Economic and Commercial Section of the Chinese Embassy in Vietnam, Department of Foreign Investment and Economic Cooperation, Ministry of Commerce. Country (Region) Guide for Outward Investment Cooperation—Vietnam, 2020th ed.; [DB/OL]; Chinese Government Agency: Beijing, China, 2021.
- Li, X.; Gong, P.; Zhou, Y.; Wang, J.; Bai, Y.; Chen, B.; Hu, T.; Xiao, Y.; Xu, B.; Yang, J.; et al. Mapping global urban boundaries from the global artificial impervious area (GAIA) data. Environ. Res. Lett. 2020, 15, 094044. [Google Scholar] [CrossRef]
- He, K.; Gkioxari, G.; Dollár, P.; Girshick, R. Mask r-cnn. In Proceedings of the IEEE International Conference on Computer Vision (ICCV), Venice, Italy, 22–29 October 2017; pp. 2961–2969. [Google Scholar]
- Li, X.; Xu, W.; Huang, Y. Spatial distribution of rural building in China: Remote sensing interpretation and density analysis. J. Geogr. 2022, 77, 835–851. [Google Scholar]
- He, K.; Zhang, X.; Ren, S.; Sun, J. Deep residual learning for image recognition. In Proceedings of the IEEE Computer Society Conference on Computer Vision and Pattern Recognition, Las Vegas, NV, USA, 27–30 June 2016; pp. 770–778. [Google Scholar]
- Yu, H.; Xu, F. A remote sensing image target recognition method based on improved Mask-RCNN model. In Proceedings of the 2021 IEEE 2nd International Conference on Big Data, Artificial Intelligence and Internet of Things Engineering (ICBAIE), Nanchang, China, 26–28 March 2021; pp. 436–439. [Google Scholar]
- Zhao, K.; Kang, J.; Jung, J.; Sohn, G. Building extraction from satellite images using mask R-CNN with building boundary regularization. In Proceedings of the IEEE Computer Society Conference on Computer Vision and Pattern Recognition Workshops, Salt Lake City, UT, USA, 18–22 June 2018; pp. 247–251. [Google Scholar]
- Sun, L.; Tang, Y.; Zhang, L. Rural building detection in high-resolution imagery based on a two-stage CNN model. IEEE Geosci. Remote Sens. Lett. 2017, 14, 1998–2002. [Google Scholar] [CrossRef]
- Shibuya, S. Urbanization, Jobs, and the Family in the Mekong Delta, Vietnam. J. Comp. Fam. Stud. 2018, 49, 93–108. [Google Scholar] [CrossRef]
- Nhung, N.H.; Thai, N.Q.; Trinh, B.; Phong, N.V. Rural and Urban in Vietnam Economic Structure. Int. Bus. Res. 2019, 12, 31. [Google Scholar] [CrossRef]
- Yin, X.; Li, P.; Feng, Z.M.; You, Z.; Xiao, C.W. Population Dataset in Vietnam (2000–2019). J. Glob. Cha. Data. Disc. 2022, 1, 1–11. [Google Scholar] [CrossRef]
- Liu, Y.; Ke, X.; Wu, W.; Zhang, M.; Fu, X.; Li, J.; Jiang, J.; He, Y.; Zhou, C.; Li, W.; et al. Geospatial characterization of rural settlements and potential targets for revitalization by geoinformation technology. Sci. Rep. 2022, 12, 8399. [Google Scholar] [CrossRef]
- Rigg, J. Evolving rural-urban relations and livelihoods. In Southeast Asia Transformed: A Geography of Change; Institute of Southeast Asian Studies: Singapore, 2003; pp. 231–256. [Google Scholar]


| Geographic Region | Correlation Coefficient |
|---|---|
| Red River Delta | 0.96 |
| Northern Central area and Central coastal area | 0.97 |
| Northern Midlands and Mountain areas | 0.98 |
| Central Highlands | 0.87 |
| Mekong River Delta | 0.93 |
| South East | 0.04 |
| Echelon | Area | Number of Rural Buildings | Density of Rural Buildings | Rural Population (Million) | Gini Coefficient |
|---|---|---|---|---|---|
| 1st | Red River Delta | 6,496,812 | 477/km2 | 1.47 | 0.13 |
| 2nd | South East | 2,687,616 | 190/km2 | 7.67 | 0.17 |
| Mekong River Delta | 5,412,507 | 188/km2 | 1.23 | 0.17 | |
| 3rd | Northern Central area and Central coastal area | 7,248,274 | 92/km2 | 8.31 | 0.47 |
| Northern Midlands and Mountain areas | 4,860,459 | 79/km2 | 7.95 | 0.40 | |
| 4th | Central Highlands | 2,040,244 | 45/km2 | 4.29 | 0.30 |
Disclaimer/Publisher’s Note: The statements, opinions and data contained in all publications are solely those of the individual author(s) and contributor(s) and not of MDPI and/or the editor(s). MDPI and/or the editor(s) disclaim responsibility for any injury to people or property resulting from any ideas, methods, instructions or products referred to in the content. |
© 2023 by the authors. Licensee MDPI, Basel, Switzerland. This article is an open access article distributed under the terms and conditions of the Creative Commons Attribution (CC BY) license (https://creativecommons.org/licenses/by/4.0/).
Share and Cite
Deng, X.; Liang, Y.; Li, X.; Xu, W. Recognition and Spatial Distribution of Rural Buildings in Vietnam. Land 2023, 12, 2142. https://doi.org/10.3390/land12122142
Deng X, Liang Y, Li X, Xu W. Recognition and Spatial Distribution of Rural Buildings in Vietnam. Land. 2023; 12(12):2142. https://doi.org/10.3390/land12122142
Chicago/Turabian StyleDeng, Xin, Yutian Liang, Xun Li, and Weipan Xu. 2023. "Recognition and Spatial Distribution of Rural Buildings in Vietnam" Land 12, no. 12: 2142. https://doi.org/10.3390/land12122142
APA StyleDeng, X., Liang, Y., Li, X., & Xu, W. (2023). Recognition and Spatial Distribution of Rural Buildings in Vietnam. Land, 12(12), 2142. https://doi.org/10.3390/land12122142