Article

Prediction and Evolution of Carbon Storage of Terrestrial Ecosystems in the Qinling Mountains North Slope Region, China

1
College of Landscape Architecture and Art, Northwest A&F University, Xianyang 712100, China
2
China MCC5 Group Corp. Ltd., Chengdu 610063, China
*
Author to whom correspondence should be addressed.
These authors contributed equally to this work.
Land 2023, 12(11), 2063; https://doi.org/10.3390/land12112063
Submission received: 28 September 2023 / Revised: 30 October 2023 / Accepted: 8 November 2023 / Published: 14 November 2023

Abstract

:
The Qinling Mountains north slope region constitutes a vital terrestrial ecosystem reserve within China. This study employs land use and land cover (LULC) data spanning from 1990 to 2020. Utilizing methodologies encompassing land use classification, transfer matrix analysis, and the application of the PLUS and InVEST models, this research endeavors to elucidate the spatial-temporal dynamics of land use patterns and associated carbon storage in the region. These analyses are conducted within the context of four prospective scenarios: Natural Development Priority, Arable Land Protection Priority, Ecological Protection Priority, and Urban Development Priority, all projected onto the landscape for 2030. Notably, our findings reveal a consistent decline in carbon storage across all four scenarios for 2030 compared to the baseline year 2020. This stark reality presents substantial challenges to achieving the region’s targets of carbon peaking and eventual carbon neutrality. Furthermore, this paper meticulously delineates six key drivers contributing to this decline in carbon storage. In conclusion, it proffers nine strategic recommendations aimed at augmenting carbon storage, with an overarching objective of establishing a harmonized mechanism capable of balancing urban development, safeguarding cultivated land, fortifying ecological preservation, and enhancing carbon sequestration within the area.

1. Introduction

Terrestrial ecosystems possess a robust capacity for carbon fixation by capturing CO2 through vegetation, soil, and other biomass components. They play a pivotal role in regulating, transforming, and cycling regional carbon storage [1,2]. Land use reflects the structural attributes of terrestrial ecosystems and is influenced by human utilization, alteration, and other human activities. Over the long-term interaction between humans and terrestrial ecosystems, land use/land change (LULC) has emerged as a crucial indicator of the evolution of land use patterns [3]. Furthermore, it has significantly impacted alterations in carbon storage within terrestrial ecosystems [4]. Therefore, utilizing land use change data becomes a crucial method for investigating the region’s spatiotemporal evolution of carbon storage [5,6].
Carbon storage research methods in terrestrial ecosystems have gone through a process from the qualitative to the quantitative. With the development of satellite remote sensing technology, scholars have commonly used LULC data to study carbon storage in specific areas quantitatively. Recently, numerous scholars have begun to focus on model development and optimization, as well as examining relationships between land use changes and carbon storage in terrestrial ecosystems. Regarding the development and optimization of models, the cellular automata (CA) model has been widely used in geographic modeling and land use research since 1979 [7]. Building upon this foundation, several new land use simulation and modeling models have emerged, including the CLUE-S model [8], the Future Land Use Simulation (FLUS) model [9], the Patch-Generating Land Use Simulation (PLUS) model [10], and others. These models have greatly enhanced the accuracy of land use research. Furthermore, the Integrated Valuation of Ecosystem Services and Tradeoffs (InVEST) model, developed by the U.S. Natural Capital Program, finds extensive application in terrestrial ecosystems for assessing carbon storage, habitat quality, soil conservation, and various other areas [11]. Developing these land use and carbon storage models establishes a robust foundation for investigating and forecasting the evolution of carbon storage in diverse terrestrial ecosystems across regions. For instance, Li et al. used the FLUS model, combined with global 1 km LULC data, to predict global land use changes in 2100 [12]. In Asia, Chen et al. used the PLUS and InVEST models to investigate and forecast carbon storage in the Zhouyuan region of China [5], while Babbar et al. utilized the CA and InVEST models to predict changes in carbon storage in the Sariska Tiger Reserve in India [13], and the same carbon storage study was conducted in Sri Lanka [14]. In Europe, scholars used the InVEST model to study carbon storage on agricultural land in Hungary [15] and to project total carbon storage in Spain in 2050 [16]. In Africa, scholars have explored carbon storage in southwestern Gambia using LULC data and the InVEST model [17], with a similar investigation conducted in Ethiopia [18]. In the Americas, scholars simulated land use and carbon storage in the west coast region of Mexico in 2050 based on LULC data, CA, and InVEST models [19]. Thus, based on LULC data, studying carbon storage in terrestrial ecosystems using CA, FLUS, PLUS, and InVEST models has been widely practiced globally.
Nonetheless, many case studies on carbon storage in terrestrial ecosystems lack an adequate focus on assessing and predicting the status of carbon storage in the northern slopes of the Qinling Mountains in China. The Qinling Mountains north slope region is located in the middle section of the Qinling Mountains Range, in the general sense, and on the northern slopes of the Qinling Mountains, in the special sense, specifically the vast area from the watershed of the Shaanxi Province section of the Qinling Mountains to the southern edge of the Weihe River. As is widely recognized, the Qinling Mountains Range is the geographical boundary between northern and southern China, symbolizing Chinese civilization. The Qinling Mountains north slope region plays a vital role in regulating the ecological environment in the middle and lower reaches of the Yellow River Basin and safeguarding the ecological security of the Loess Plateau region. Over the past three decades of China’s rapid urbanization, a significant portion of cultivated land in the Qinling Mountains north slope region has been converted into urban and construction land. In addition, the region’s strict ecological protection policies, such as returning farmland to forests and grasslands, have further reduced the region’s cultivated land. Consequently, from 1990 to the present, the area’s land use composition has undergone significant transformations due to human activities, resulting in inevitable alterations to the carbon storage capacity of its terrestrial ecosystems. In September 2020, the Chinese government proposed a strategic goal of achieving carbon peaking by 2030 and carbon neutrality by 2060 [20]. It requires the coordination of the relationship between urban development, ecological protection, and carbon sinks. Therefore, research on the spatiotemporal evolution of land use and carbon storage in the Qinling Mountains north slope region becomes essential to realizing the national carbon sink strategy.
Based on the LULC data from 1990, 2000, 2010, and 2020, this paper investigated the spatiotemporal evolution characteristics of carbon storage in the Qinling Mountains north slope region over the past three decades by using four methods: land use classification, the land use transfer matrix, PLUS model, and InVEST model, and further simulated the trend of carbon storage in the region in 2030 under four scenarios: the Natural development priority, Arable land protection priority, Ecological protection priority, and Urban development priority. The findings revealed a consistent decline in carbon storage within the Qinling Mountains north slope region across all four scenarios for 2030 compared to the 2020 levels. It signifies significant challenges in attaining the region’s carbon peak and carbon neutrality objectives. The paper simulated the carbon storage in the Qinling Mountains north slope region through the coupled PLUS-InVEST model, aiming to find out the key factors that have led to the continuous decline of carbon storage in the region over the past decades and give relevant suggestions for improvement, hoping to establish a mechanism to balance urban development, cultivated land protection, ecological protection, and carbon sink enhancement in the region.

2. Materials and Methods

2.1. Overview of the Study Area and Data Sources

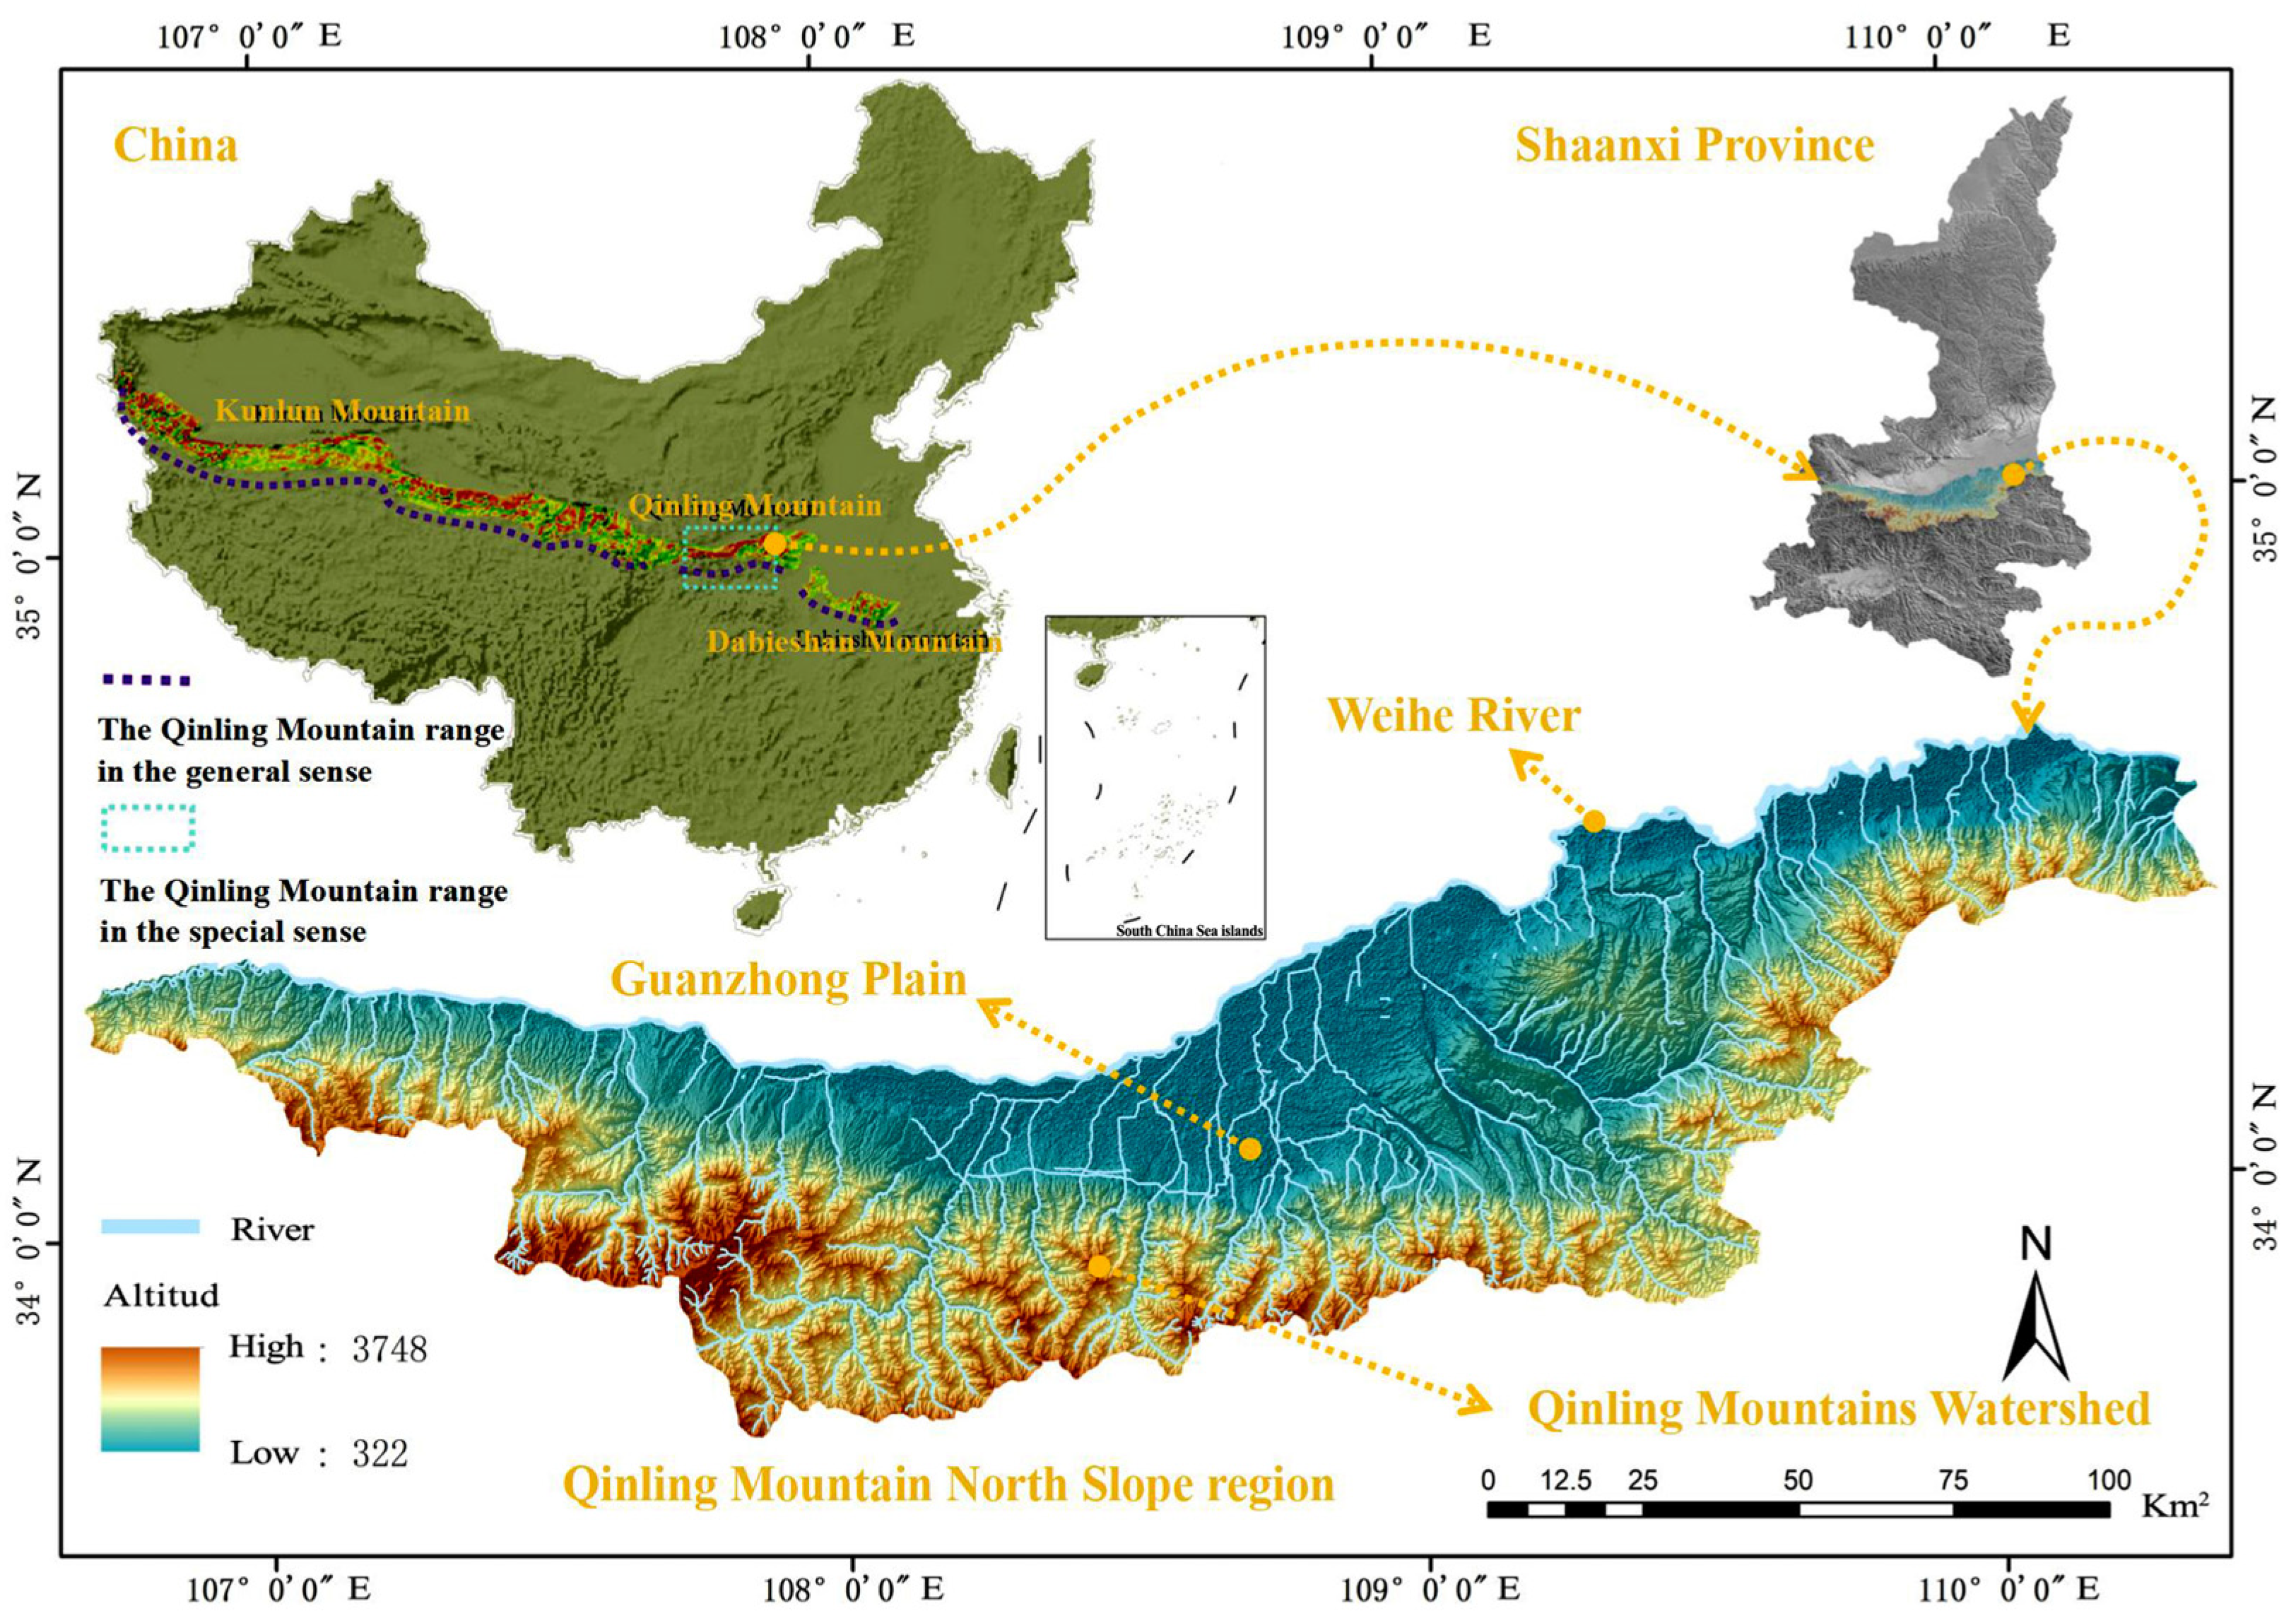
2.1.1. Overview of the Study Area

The Qinling Mountain Range is a vast mountain system running west to east across the Chinese mainland, which is not only the demarcation line between the Yangtze River Basin and the Yellow River Basin but also the cradle of Chinese civilization. Starting from the Shang (ca. 1600 BC–1046 BC) and Zhou (1046 BC–256 BC) dynasties, and passing through the Qin (221 BC–207 BC), Han (202 BC–220 AD), Jin (266 AD–420 AD), Sui (581 AD–618 AD), Tang (618 AD–907 AD), and Bei Song (960 AD–1127 AD) dynasties, many of the dynasties in the history of China that have had a significant impact on Chinese civilization have built their capitals in the region [21]. There is both a general and a special definition of the Qinling Mountains. In the general sense, the Qinling Mountains start from the Kunlun Mountains in the west and extend eastward through Shaanxi to the Zhangbaling Mountains in Anhui Province. In the special sense, the Qinling Mountains are between 32° and 35° north latitude, stretching across south-central Shaanxi Province, extending 400 to 500 km from west to east and 100 to 150 km from north to south, with ridges at an elevation of about 2000 m and peaks at more than 2000 m above sea level, with the highest peak, Taibai Mountain, at an elevation of 3771.2 m above sea level, rising about 3000 m above the valley of the Weihe River. The research in this paper is based on the Qinling Mountains in the special sense.
The Qinling Mountains north slope region refers to the vast area from the watershed of the Qinling Mountains to the southern edge of the Weihe River, spanning east to west across the cities of Weinan, Xi’an, and Baoji, and roughly located between latitudes 33°30′ N and 34°70′ N and longitudes 106°30′ E and 110°30′ E, with a total area of 14,865.30 km2 (Figure 1). Due to an altitude exceeding 3000 m, the Qinling Mountains north slope region encompasses multiple climatic zones, ranging from warm-temperate to sub-frigid. Consequently, it hosts a diverse array of plant communities, including deciduous oak forests, birch forests, coniferous forests, and alpine scrub meadows, which have been formed from the bottom up. Moreover, this region serves as the confluence point of two central faunal realms: the Palearctic realm and the Oriental realm. This unique positioning bestows upon the region a notable ecological advantage. Consequently, the Qinling Mountains north slope region is vital in climate regulation, soil and water conservation, and biodiversity preservation [22]. It is also an important ecological security barrier in China and is regarded as China’s central water tower and biological gene pool [23].

2.1.2. Data Sources

In this study, the LULC data of the Qinling Mountains north slope region in 1990, 2000, 2010, and 2020 were obtained from the Resource and Environment Science and Data Center of the Chinese Academy of Sciences (https://www.resdc.cn/ accessed on 6 July 2023). According to the study purpose and the classification criteria for current land use status in China (GB/T 21010–2017), this paper divides land use types into six categories: cultivated land (CL), forest land (FL), grassland (GL), water area (WA), construction land (COL), and unutilized land (UL).
The resolution of the Qinling Mountains north slope region LULC data obtained from the Chinese Academy of Sciences in this study was 30 m × 30 m, which was imported into the ArcGIS 10.1 software and resampled to produce a resolution of 90 m × 90 m. Furthermore, the study considers 12 factors responsible for driving changes in land use, comprising six natural and six social drivers (Table 1). The annual average temperature and annual precipitation data were obtained from the China Meteorological Science Database (http://data.cma.cn/ accessed on 6 July 2023). Distances to main roads, railways, and highways were calculated using the Euclidean distance analysis tool within the ArcGIS software.

2.2. Research Methodology

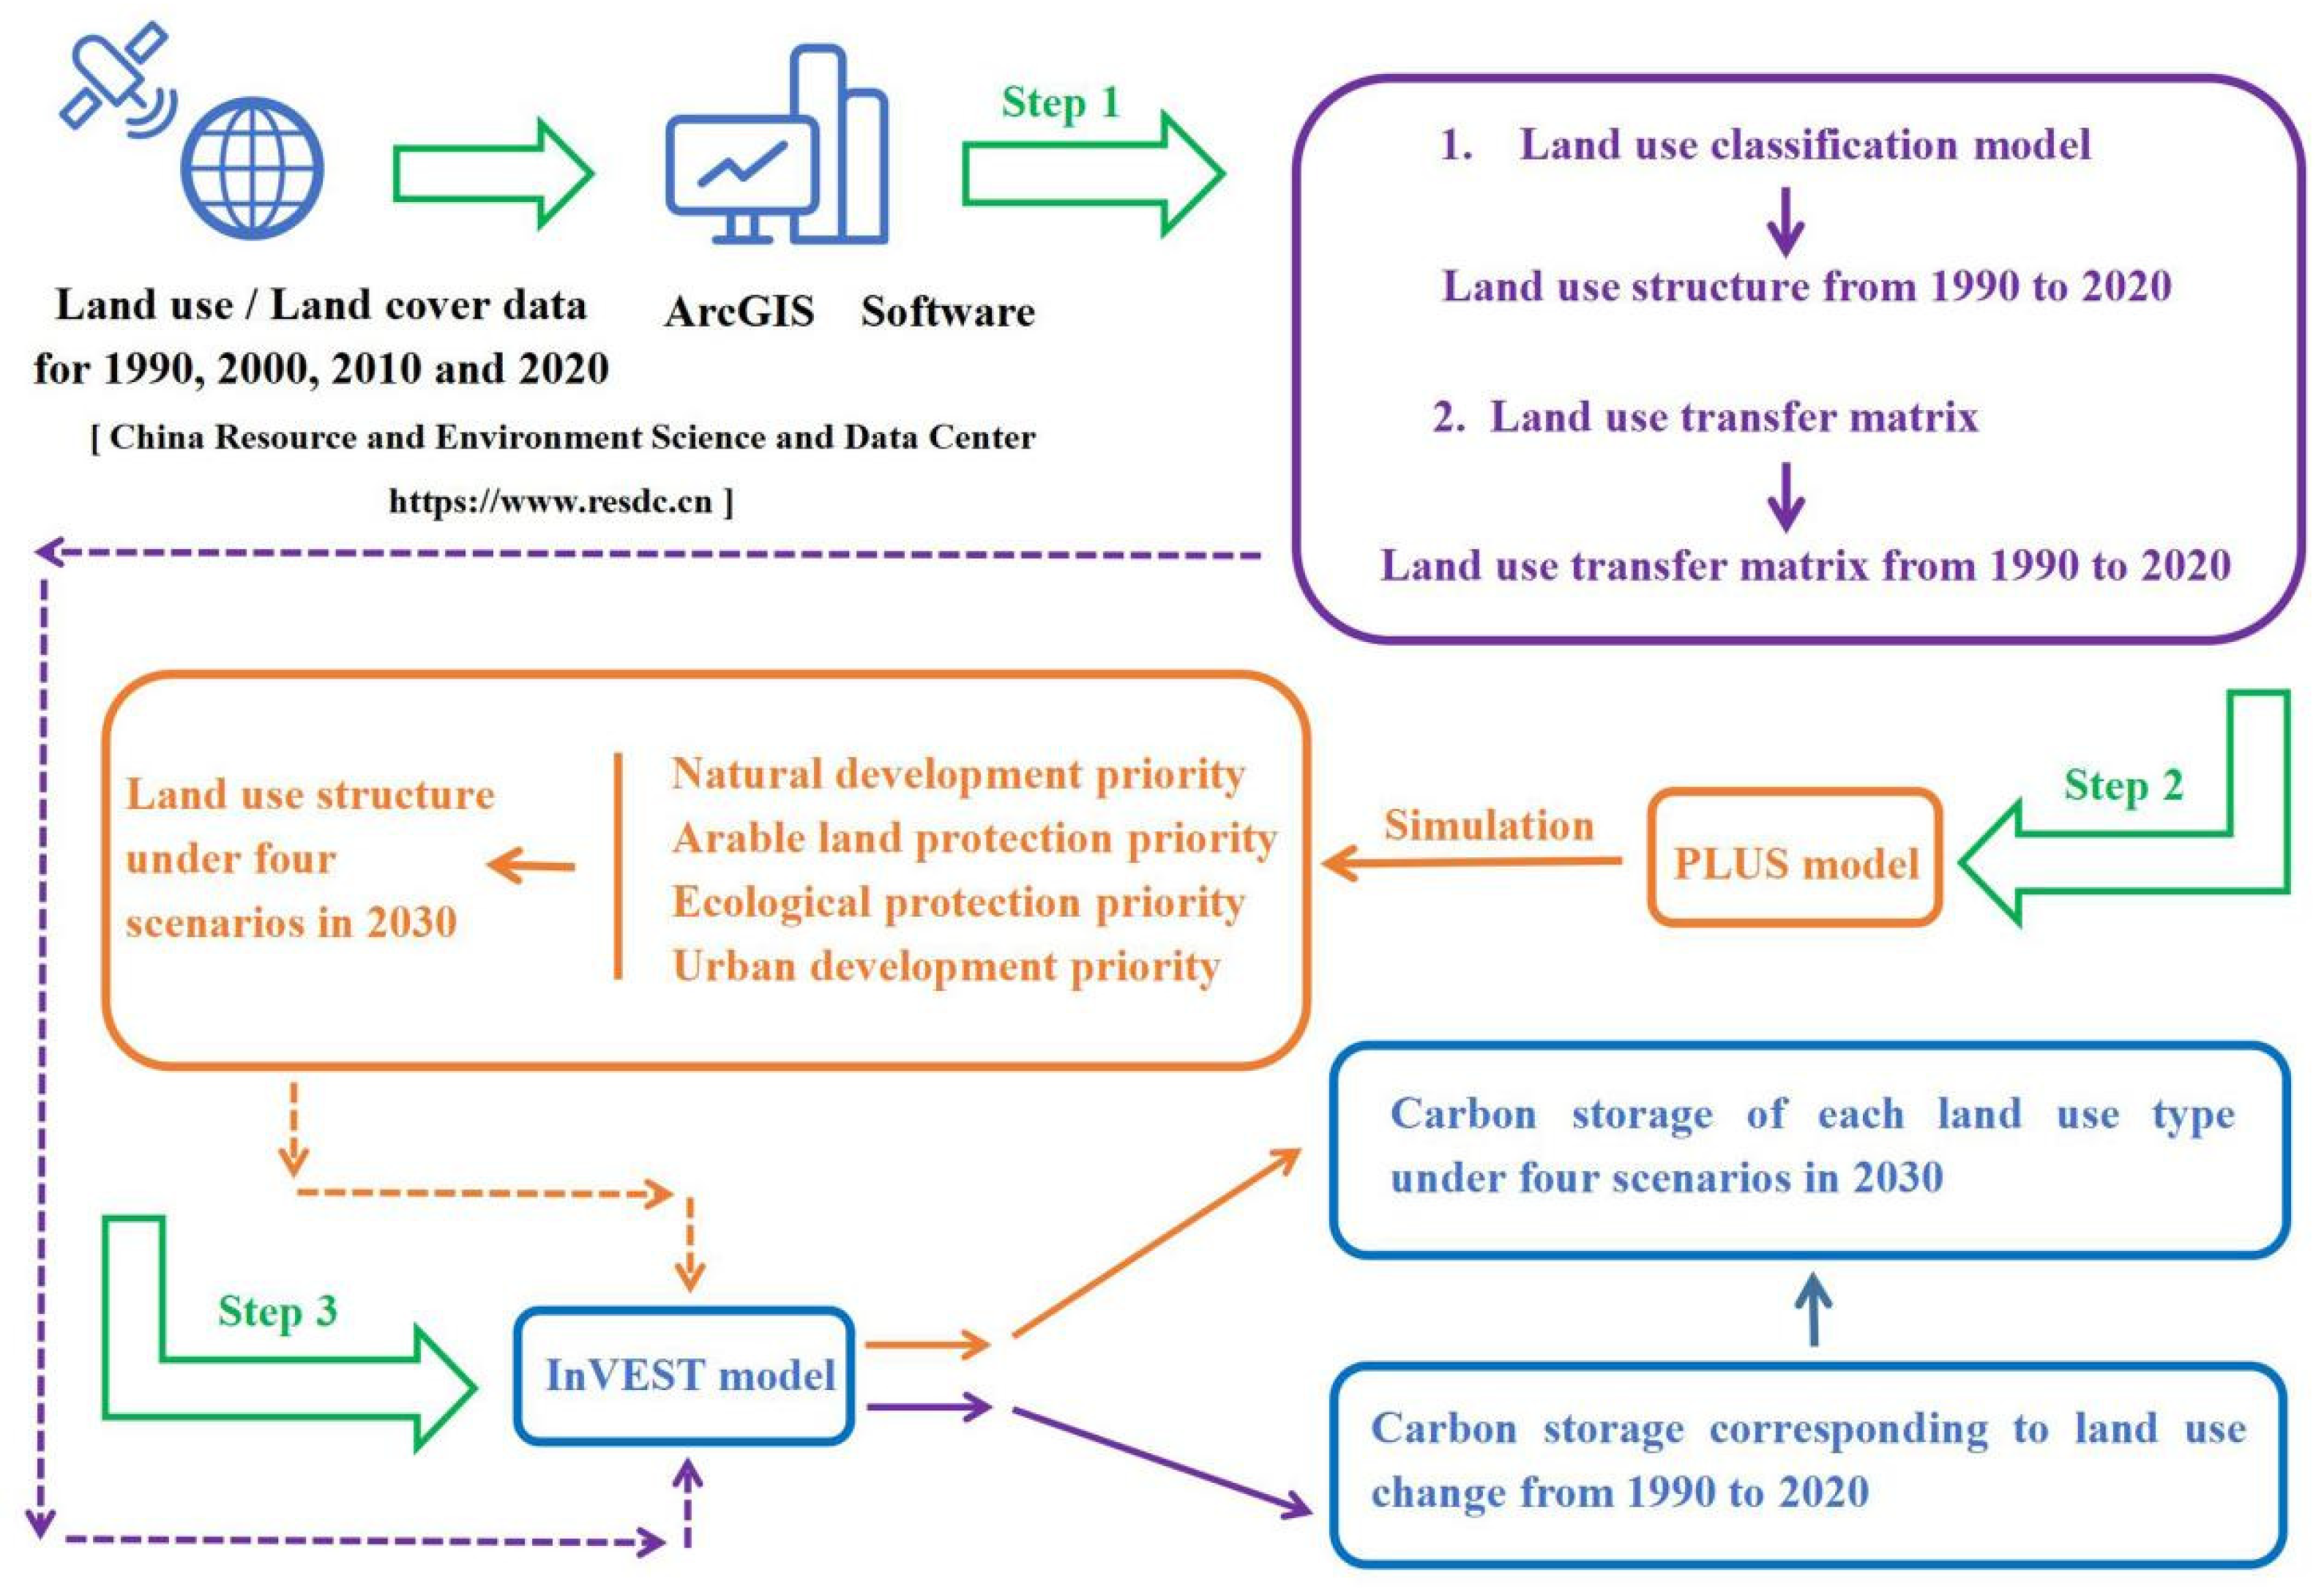
2.2.1. Method Overview

Based on the LULC data, four methods, including the land use classification model, the land use transfer matrix, the PLUS model, and the InVEST model, were used to investigate the effect of land use change on carbon storage in the Qinling Mountains north slope region from 1990 to 2020 and predict the carbon storage in the region in 2030. The research methodology comprises three steps (Figure 2): (1) Based on the LULC data, it combed the land use classification of the Qinling Mountains north slope region from 1990 to 2020 and further constructed the land use transfer matrix. (2) Leveraging land use changes from 1990 to 2020, the PLUS model was used to simulate the land use structure of the Qinling Mountains north slope region in 2030 under four scenarios: the natural development scenario (ND), the arable land protection priority (AP), the ecological protection priority (EP), and the urban development priority (UD). (3) The InVEST model was used to study changes in carbon storage among land use types over the past 30 years and simulate the carbon storage of each land use type in the Qinling Mountains north slope region under the four scenarios in 2030.

2.2.2. Land Use Classification Model and Land Use Transfer Matrix

In this study, the land use data for the Qinling Mountains north slope region is organized and classified into six categories (CL, FL, GL, WA, COL, and UL) using LULC data from 1990, 2000, 2010, and 2020. On this basis, a land use transfer matrix spanning from 1990 to 2020 was constructed. It investigated the net change data, the exchange change data, and the total change data in the region to reflect the situation and direction of the land use type changes in the Qinling Mountains north slope region over the previous three decades [24]. The land use classification and the land use transfer matrix models are consistent with studies by Chen et al. [25]. Specific formulas and the rationale behind constructing the land use transfer matrix are provided in the Supplementary Material of this paper.

2.2.3. PLUS Model

The PLUS model is a land use simulation tool rooted in Cellular Automata (CA), with higher simulation accuracy than other models [5]. It comprises two primary modules: the Land Expansion Analysis Strategy (LEAS) and the CA Model based on Multi-type Random Patch Seeds (CARS).
In this paper, the specific parameters of the PLUS model were set as follows:
(1) The LEAS module: the number of regression trees was 20, the sampling rate was 0.01, the mTry was 12, and the thread was 1. (2) The CARS module: the neighborhood size was 3, the patch generation was 0.8, the expansion coefficient was 0.5, the percentage of seeds was 0.0001, and the neighborhood weights were 0.123(CL), 0.365(FL), 0.851(GL), 0.205(WA), 0.973(COL), 0.001(UL). (3) The four development scenarios were ND, AP, EP, and UD. In ND, the 2015–2020 development trend was continued, the transfer probability and neighborhood weights at the time of the original land use type transfer were kept unchanged, and the Markov module integrated into the PLUS model was used to predict the demand for each category in 2030. The natural development model serves as the basis for setting other scenarios. In the AP scenario, priority was accorded to the preservation of cultivated land. Consequently, the probability of transitioning from FL to CL increased by 25%, from GL to CL by 30%, and from UL to CL by 15%. Conversely, the transfer probability from CL to COL was diminished by 35%. In the EP scenario, restricting urbanization with the primary aim of ecological environmental protection led to land use development in a more environmentally friendly direction. The probability of transitioning from CL to FL increased by 30%, from CL to GL by 35%, and from CL to WA by 15%. Conversely, the transfer probability from FL and GL to COL decreased by 25%. In the UD scenario, the region was at a stage of rapid urbanization, with a rapid increase in the amount of land used for construction. The probability of transitioning from CL to COL had surged by 45%, from FL to COL by 25%, from GL to COL by 30%, from WA to COL by 10%, and from UL to COL by 15%. (4) For accuracy verification, a confusion matrix was constructed using land use data from 2020. The results indicated a kappa coefficient exceeding 0.85, thereby satisfying the accuracy criteria for land use simulation within the PLUS model. Detailed information regarding the confusion matrix is available in the Supplementary Materials.

2.2.4. InVEST Model

The InVEST model, namely the Integrated Valuation of Ecosystem Services and Trad-offs model, is a tool for assessing the quantity and economic value of ecosystem service functions [13]. It mainly consists of four carbon pools, including carbon of above-ground biomass (C-above), carbon of below-ground biomass (C-below), carbon of soil organic matter (C-soil), and carbon of dead organic matter (C-dead). Formulas for the creation of carbon pools are provided in the Supplementary Materials of this paper.
In this paper, based on the existing literature [21,26,27,28], the carbon density data of the neighboring areas in the same climate zone and for similar years were preferentially selected to construct the carbon pool in the Qinling Mountains north slope region (Table 2).

3. Results

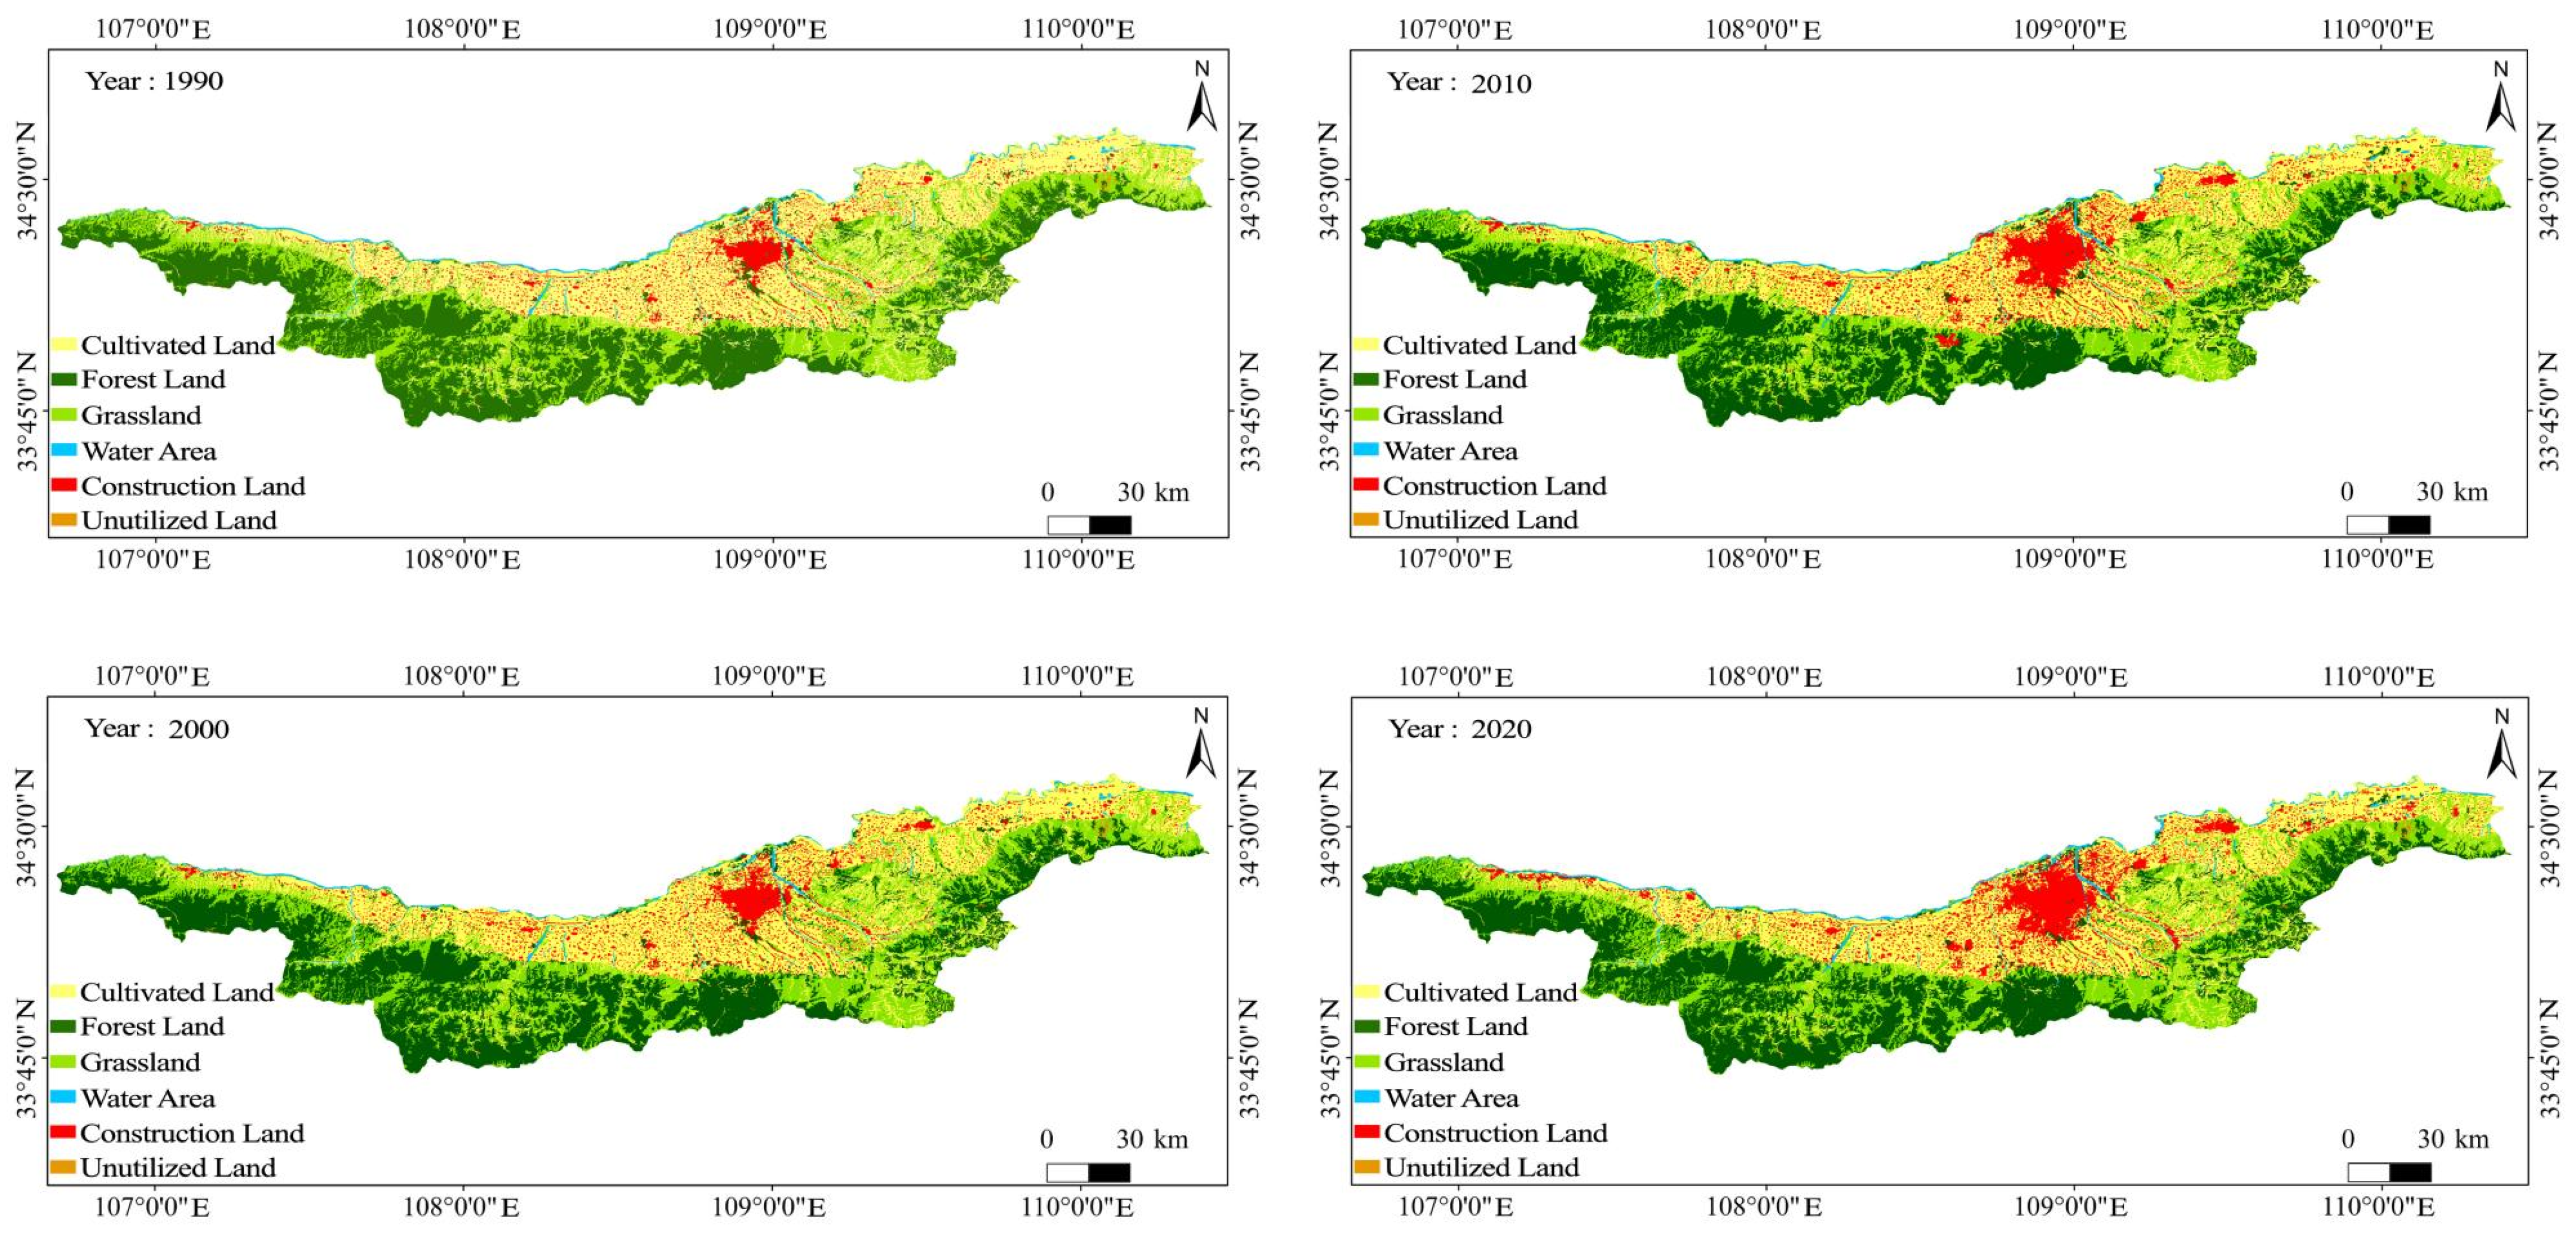
3.1. Land Use Structure from 1990 to 2020

In this paper, based on the data of LULC in the last thirty years from 1990 to 2020, the land use in the Qinling Mountains north slope region is classified into six types: CL, FL, GL, WA, COL, and UL. Table 3 and Figure 3 show the changes in the land use structure of the region from 1990 to 2020.
The results show that COL increased most dramatically, from 77,482.98 hm2 in 1990 to 137,921.13 hm2 in 2020, an increase of 60,438.15 hm2 or 78.00%, compared to 1990. Secondly, the increase in WA was also significant, with a cumulative total increase of 2880.36 hm2, or a growth rate of 10.60%, compared to 1990. In contrast, CL decreased sharply, from 533,134.71 hm2 in 1990 to 472,269.69 hm2 in 2020, a decrease of 60,865.02 hm2 or 11.42%, compared to 1990. In addition, FL, GL, and UL changed insignificantly.

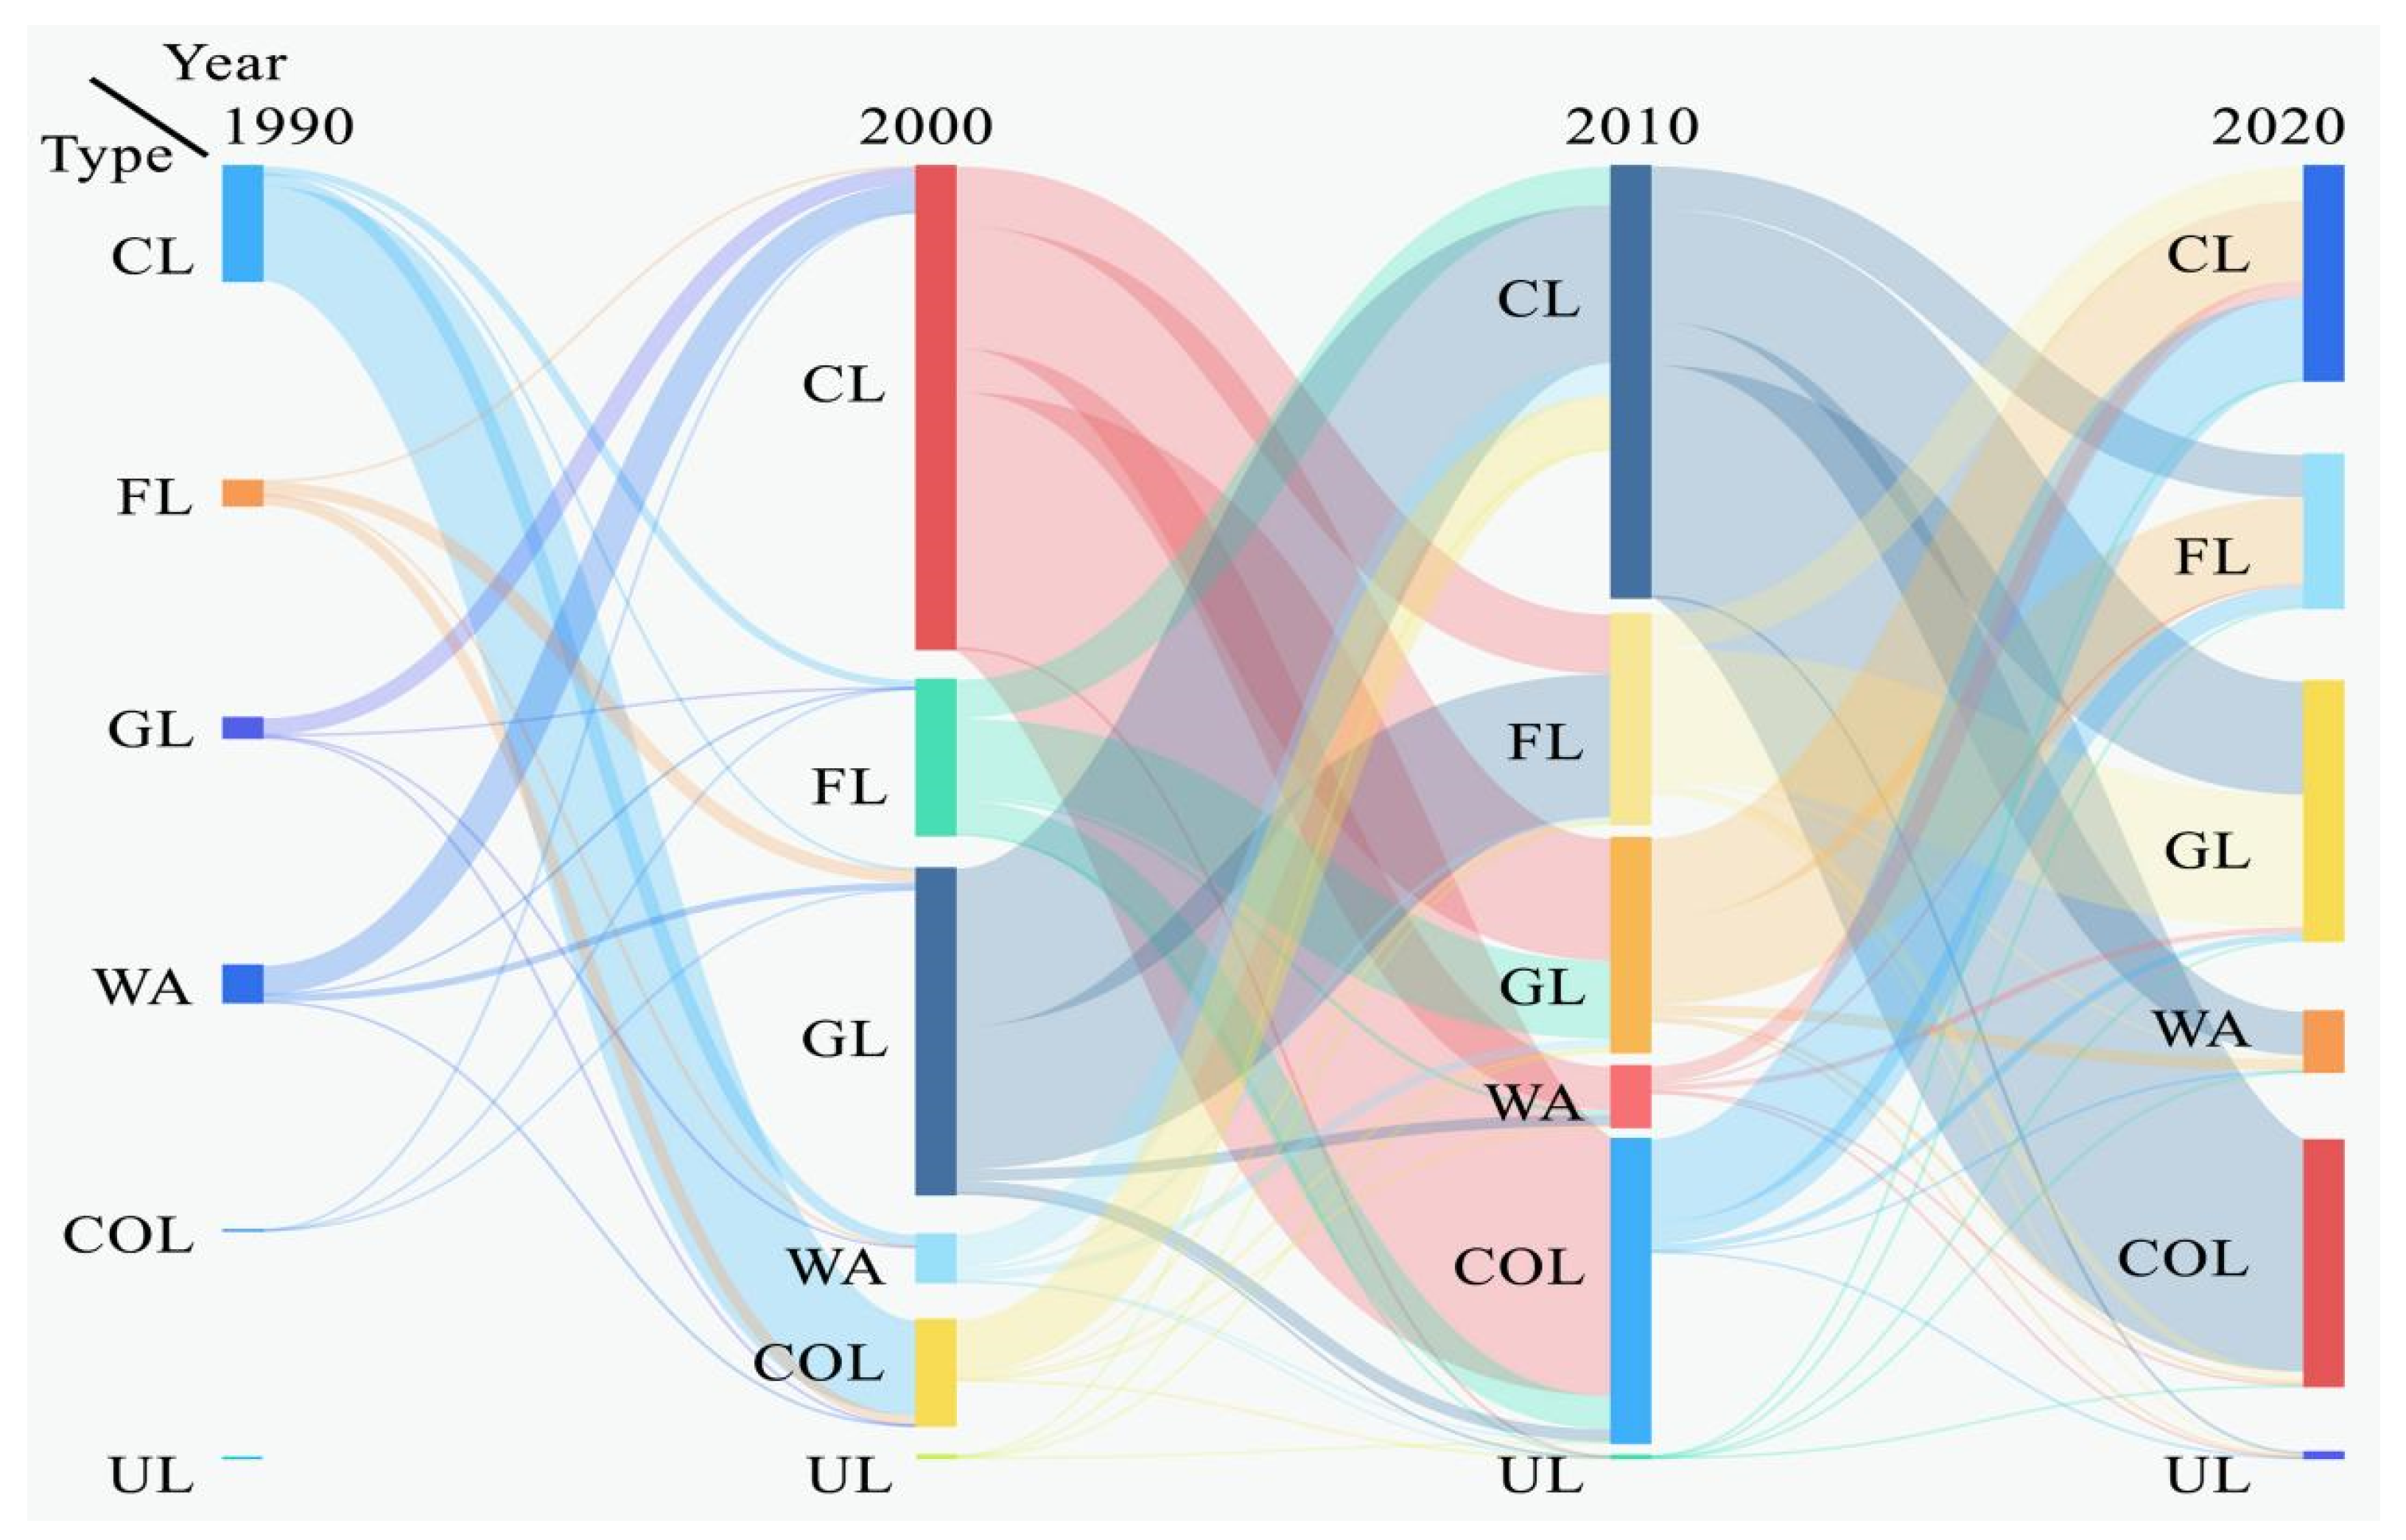
3.2. Land Use Transfer Process from 1990 to 2020

Based on the land use transfer matrix, this paper obtained the land use change information of the Qinling Mountains north slope region in three periods, as shown in Table 4 and Figure 4. The land use transfer matrix data are detailed in the Supplementary Materials of this paper.
The findings indicate that the most substantial changes in the region occurred within the CL and COL categories over the preceding three decades. Figure 4 illustrates the conversion of the various land use types from 1990 to 2020, with the wider connected curves indicating more significant change data. The dramatic changes in CL and COL can be well-visualized in the figure.
In Table 4, the proportion of the net change data to the total change data for the three stages of CL, 1990–2000, 2000–2010, and 2010–2020, was 42.46%, 26.03%, and 33.66%, respectively, which showed that the area of cropland decreased sharply in the three decades. Meanwhile, COL had been expanding alarmingly, with a net increase of 13,206.24 hm2 between 1990 and 2000, constituting a staggering 99.85% of the total change. Even in the latest decade, the proportion of net growth in COL amounted to 36.99%. Of the three decades, the largest net increase in COL occurred between 2000 and 2010, amounting to 30,580.74 hm2. It is worth noting that GL also underwent a large-scale decay process from 2000–2010, with a net loss of 14,017.86 hm2 over the decade. Furthermore, alterations in FL, WA, and UL were predominantly evident in the exchange change data, signifying that these changes primarily involved spatial relocations.

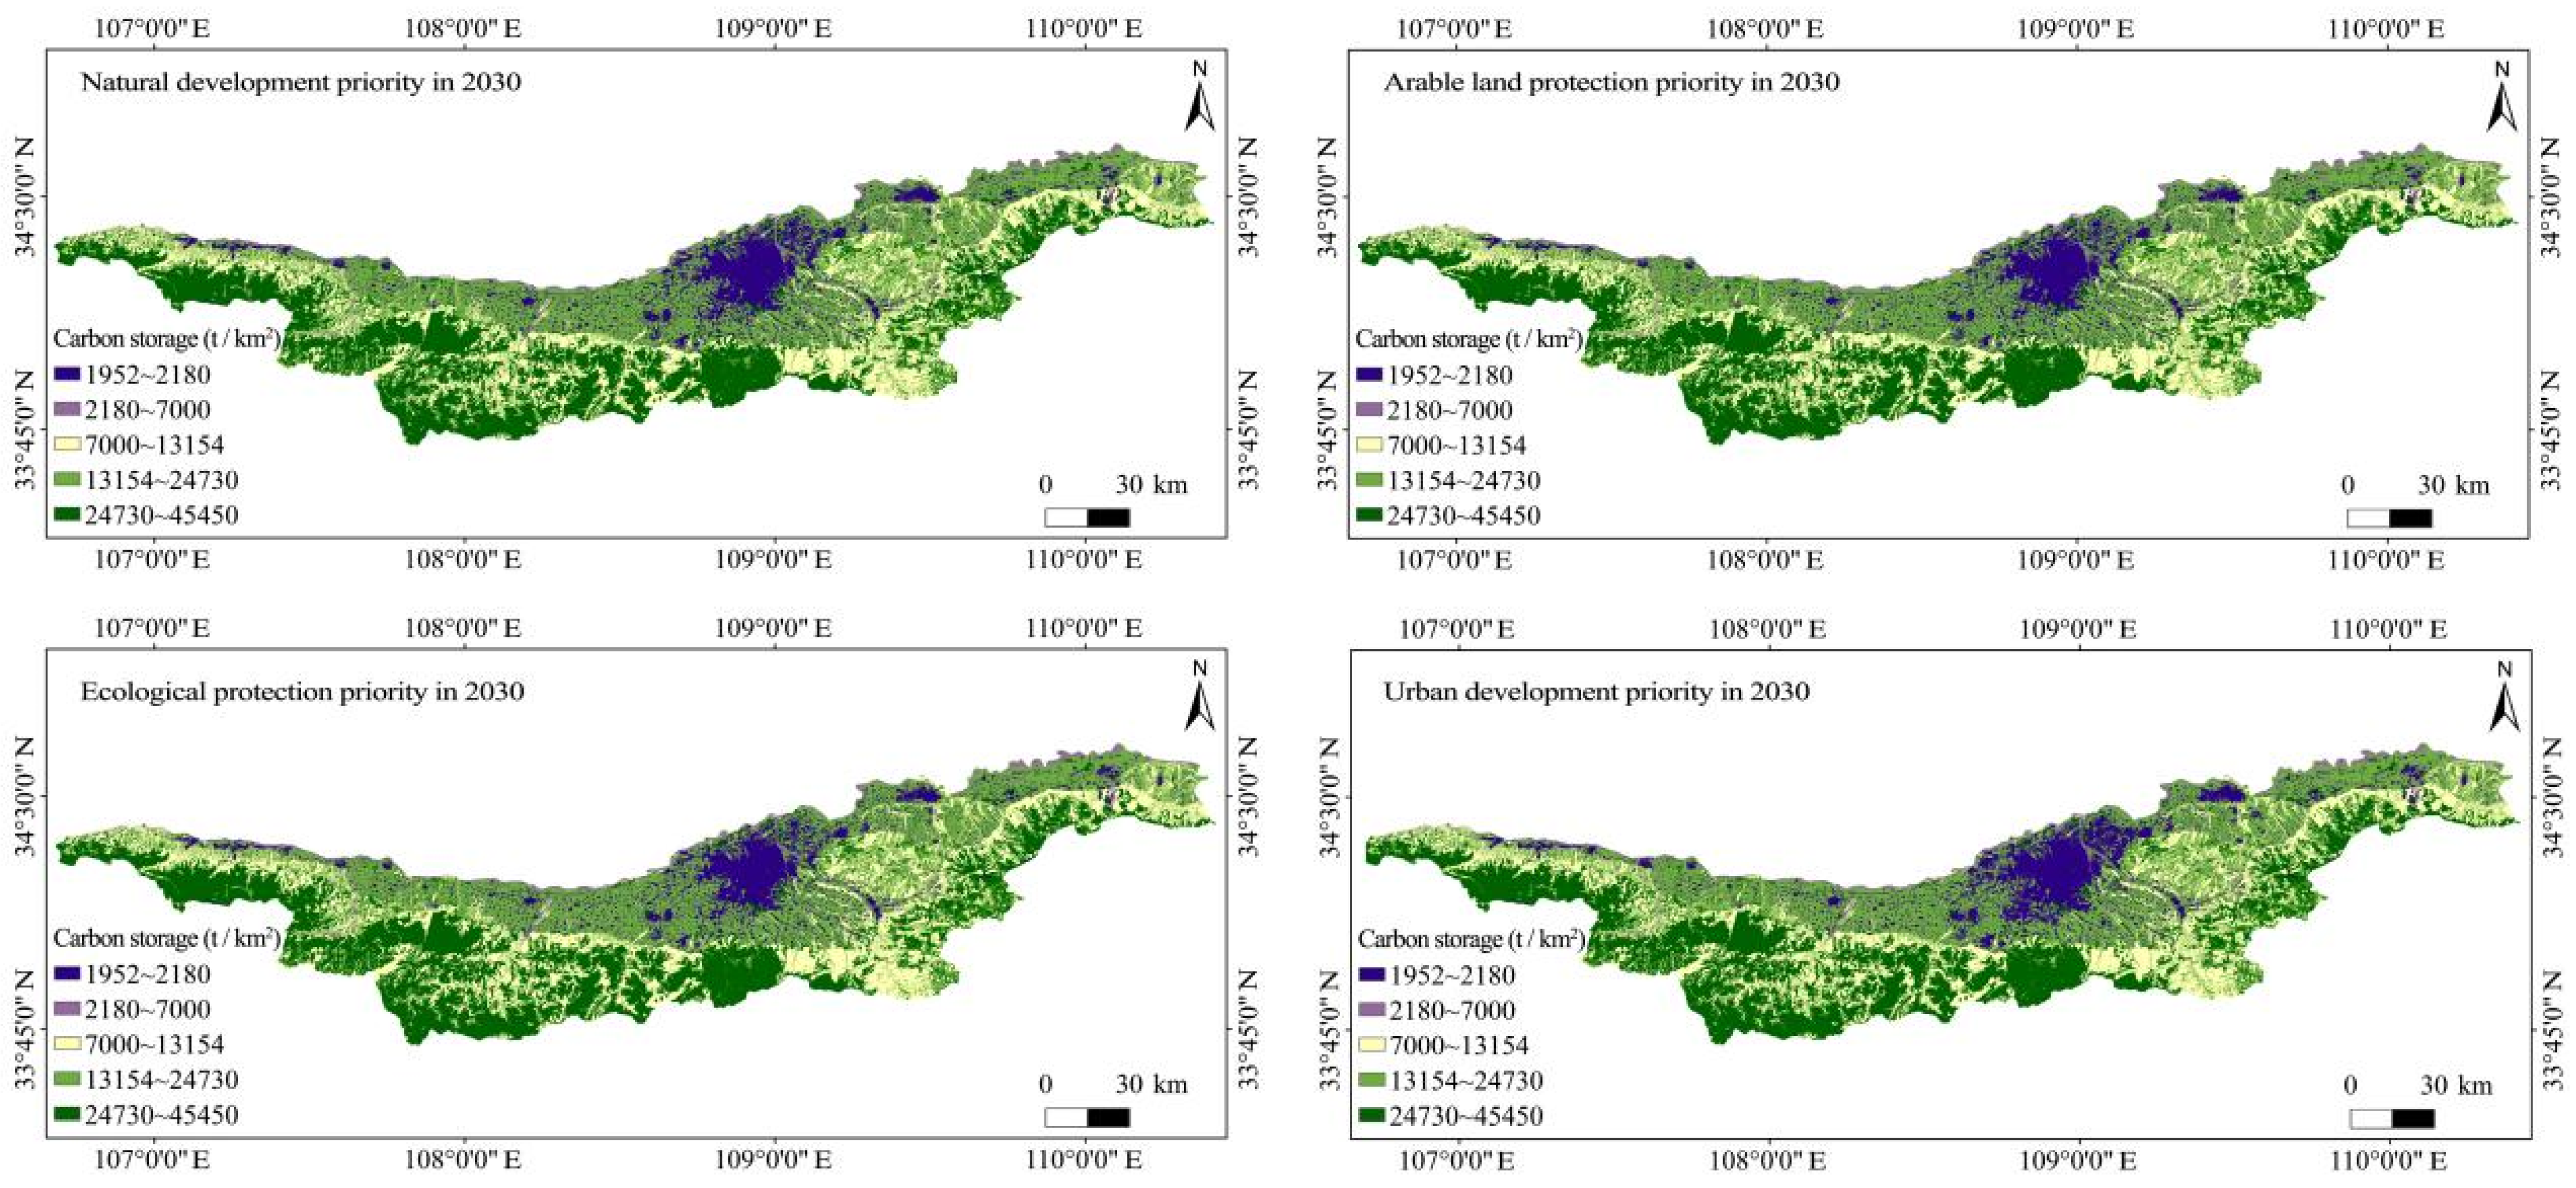
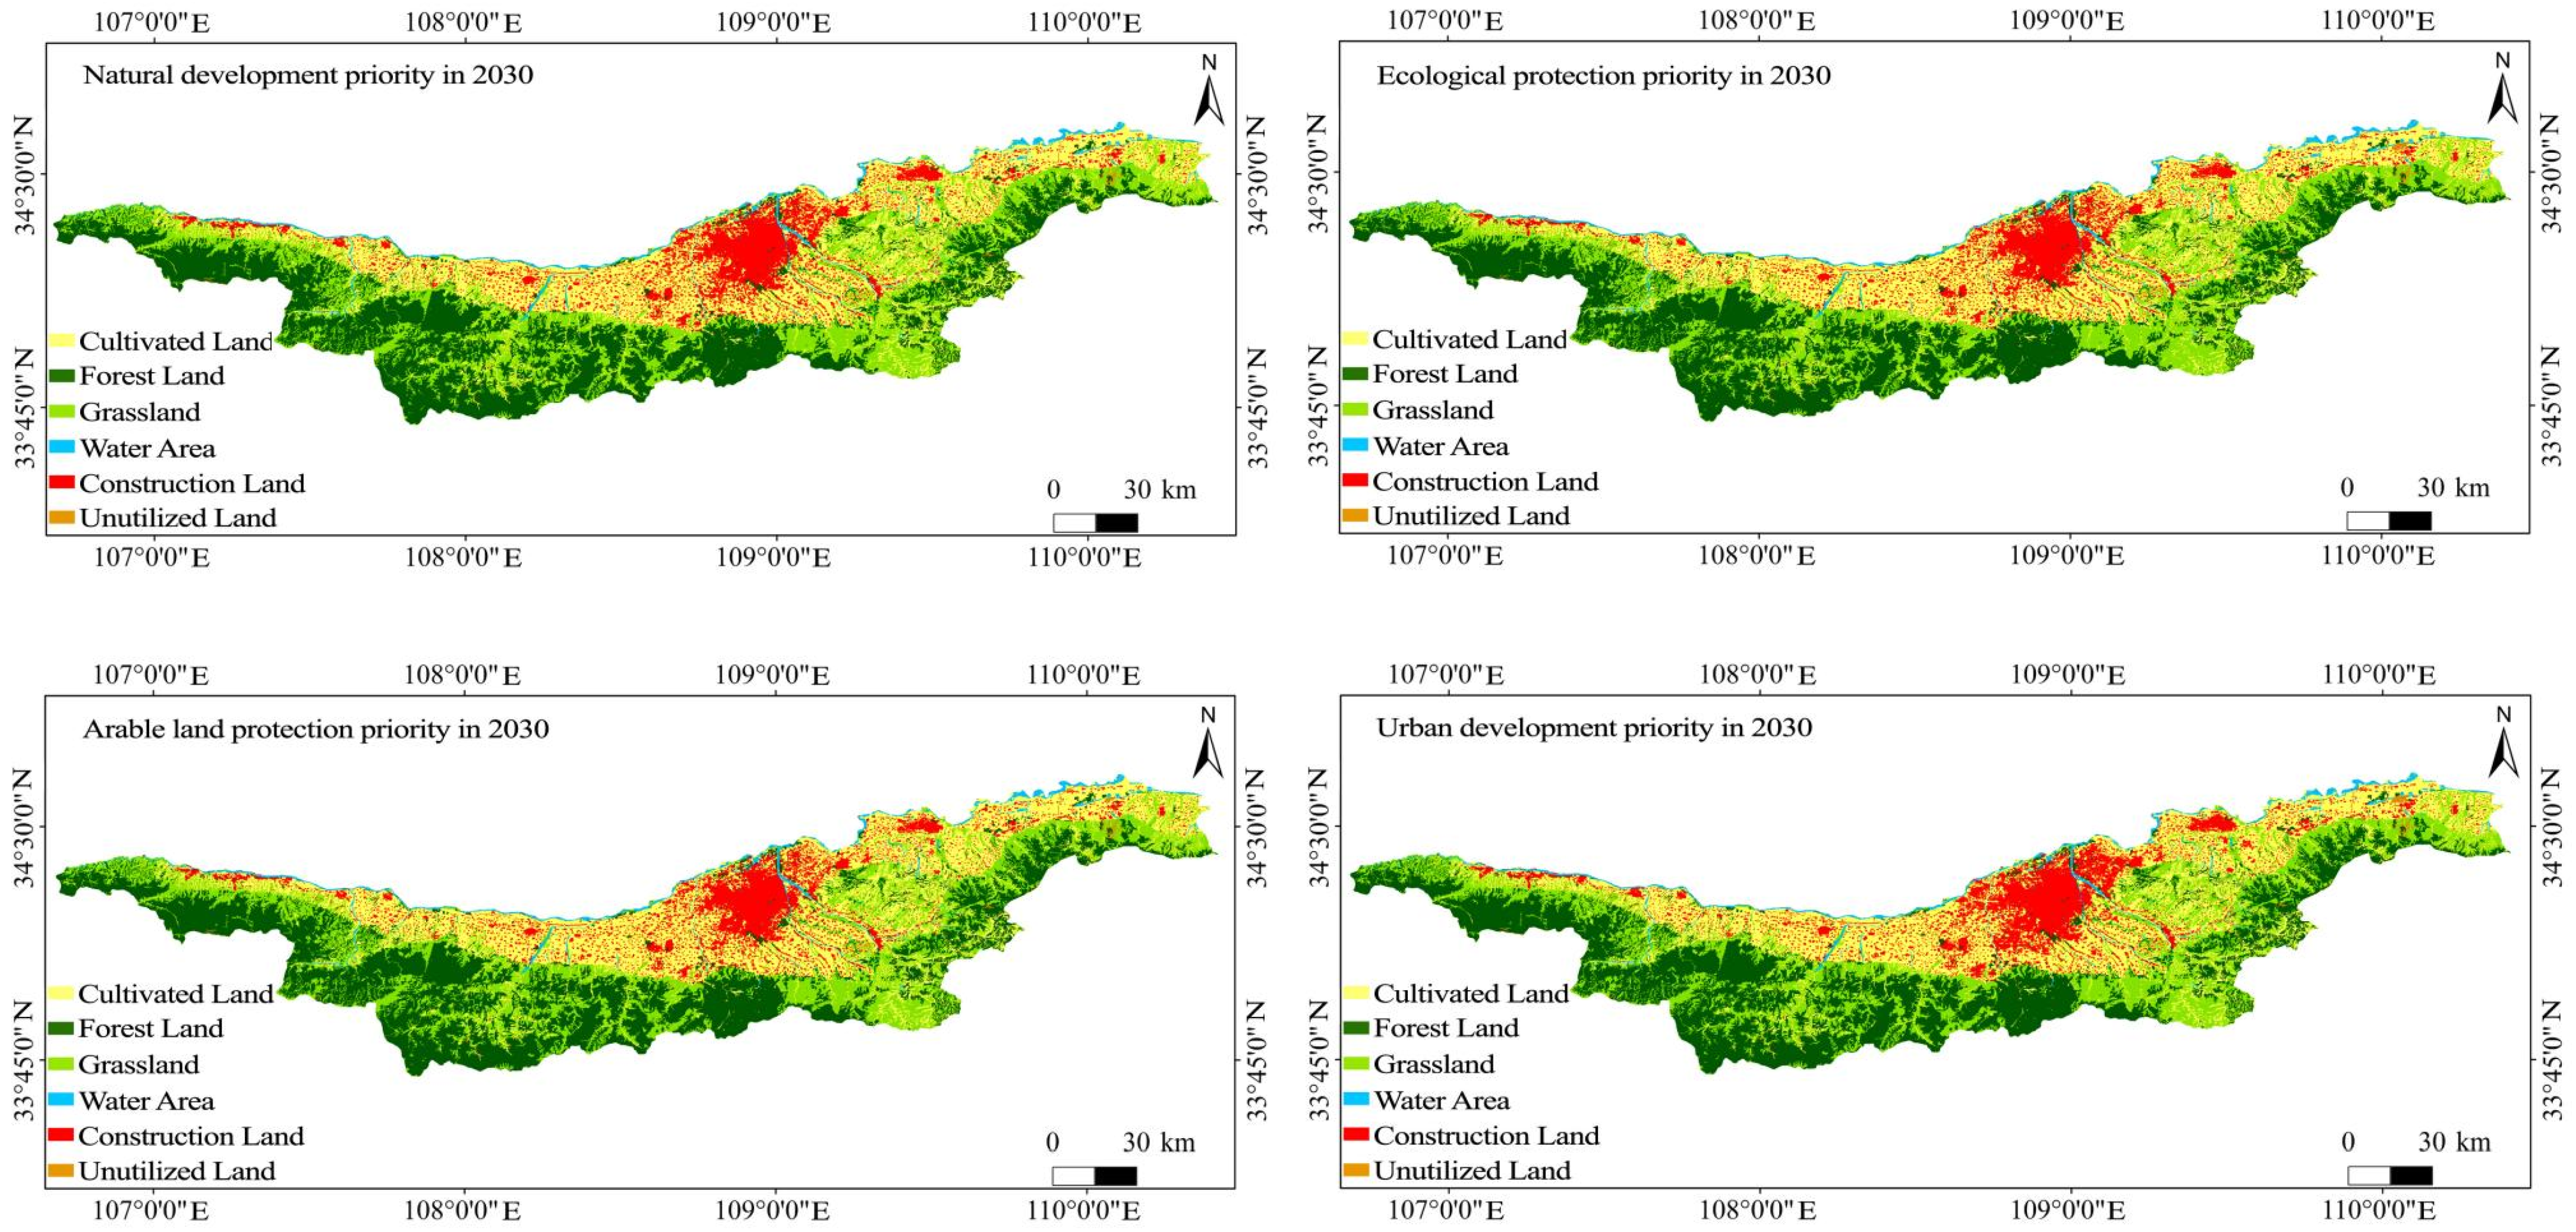
3.3. Land Use Structure Simulation under Four Scenarios in 2030

Based on the land use evolution from 1990 to 2020, combined with the driving factors and the PLUS model, the spatial distribution and structural composition of land use in the Qinling Mountains north slope region in 2030 under the four scenarios of ND, AP, EP, and UD were simulated. As shown in Table 5 and Figure 5, compared to 2020, CL decreased in all four scenarios, while COL, GL, and WA increased constantly. Meanwhile, FL decreased and UL experienced relatively stable conditions. Specifically, the land use structure in the ND scenario continued to follow the same trend of change as in the last 30 years. The CL area decreased to 450,402.93 hm2, while the COL area increased to 151,089.30 hm2. In the AP scenario, CL continued its decline by 9080.10 hm2, compared to 2020, while COL grew by 3925.26 hm2 over the same timeframe. In the EP scenario, the trend of decreasing CL and increasing COL was not curbed, although strict ecological strategies were set. Meanwhile, there was an increase in FL, GL, and WA, which were 170.10 hm2, 16,016.13 hm2, and 4105.08 hm2 higher than 2020, respectively. The UD scenario exhibited the most substantial increase in COL, expanding by 24,918.84 hm2, compared to 2020, equating to a growth rate of 18.07%. This increase in COL was primarily due to the expansion of the pre-existing residential area. Conversely, CL and FL witnessed significant declines during this period, decreasing by 33,039.90 hm2 and 3082.86 hm2, respectively, in comparison to 2020.

3.4. Change in Carbon Storage

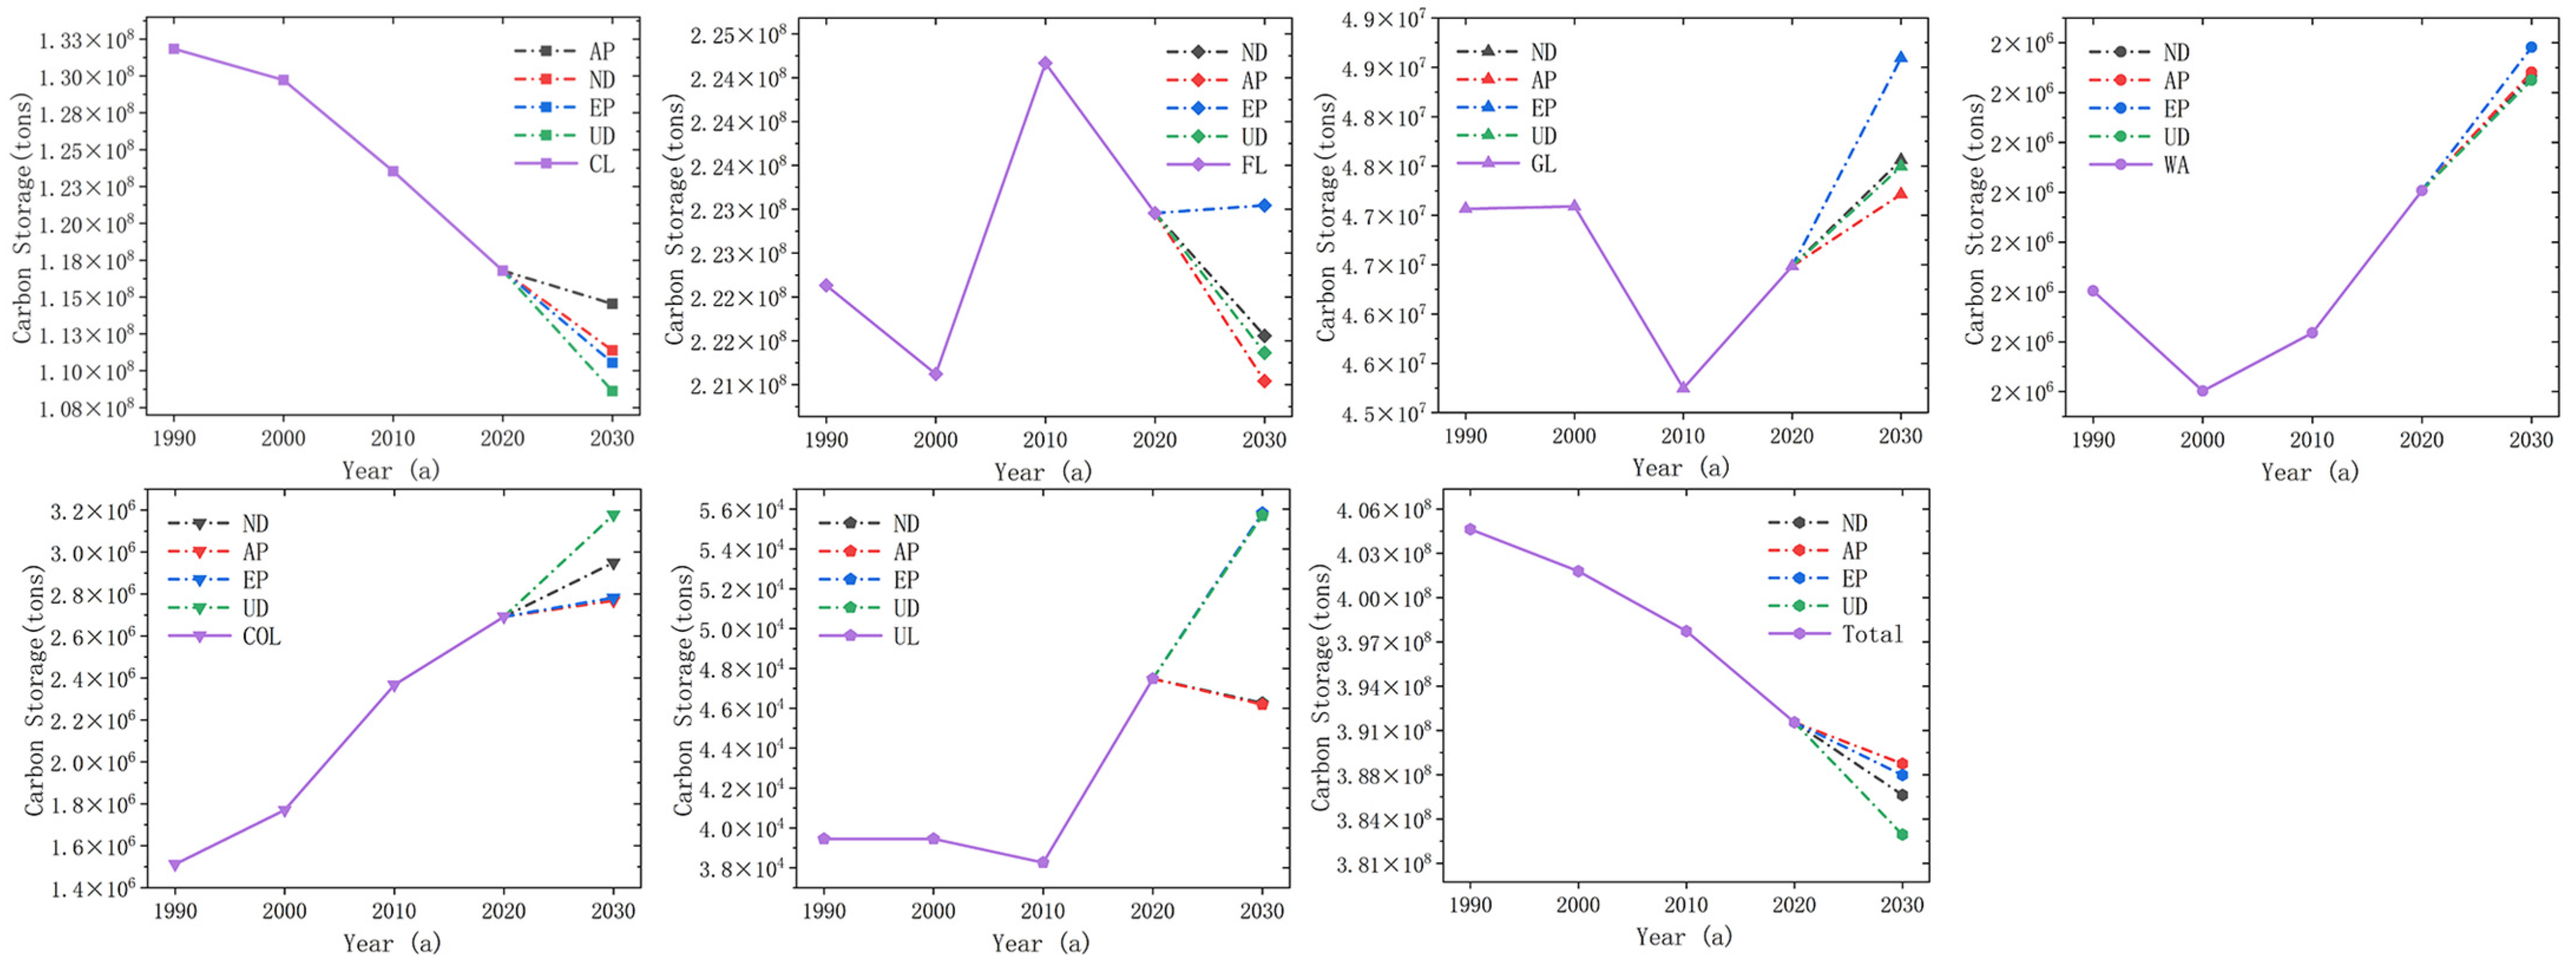
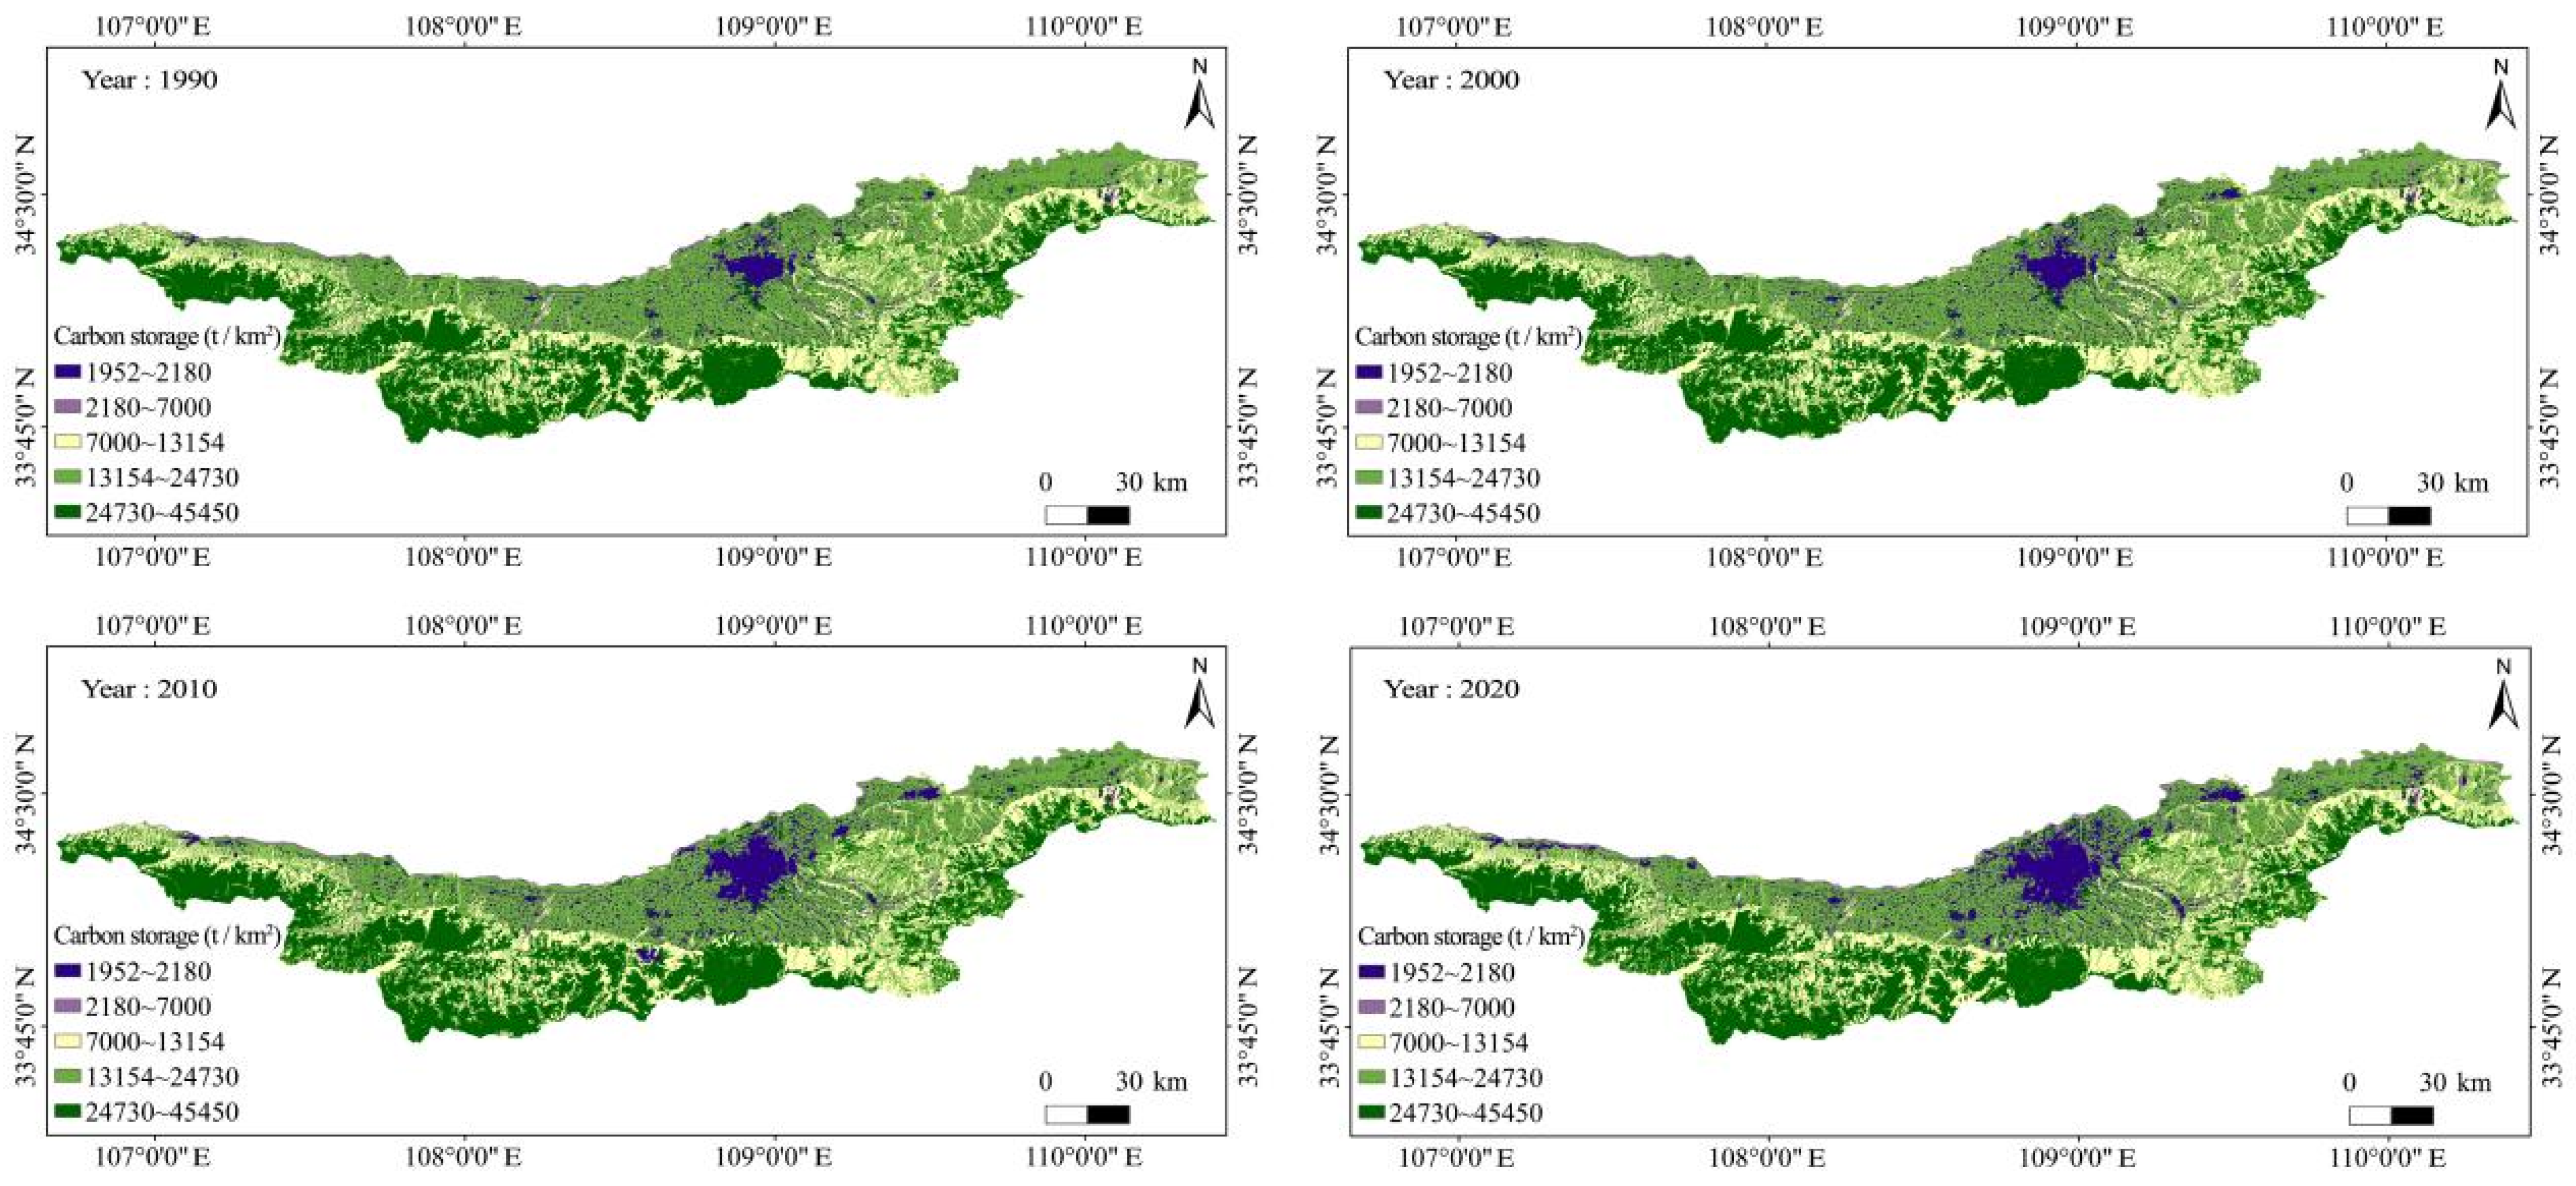
3.4.1. Changes in Carbon Storage from 1990 to 2020

Based on the land use evolution, this study employs the InVEST model to examine carbon storage changes in the Qinling Mountains north slope region from 1990 to 2020. As shown in Figure 6, the expansion of the blue area, which indicates a lower carbon storage capacity, is more pronounced, mainly located near residential areas, while the forested areas remains essentially unchanged. Specifically, from 1990 to 2020, the carbon storage in the region continuously decreased, with a cumulative decrease of 13,519,199.98 tons in three decades. The data in Table 6 shows that carbon storage in CL in the Qinling Mountains north slope region declined precipitously, decreasing by 15,051,919.44 tons between 1990 and 2020, indicating that the reduction of CL due to the expansion of COL was the main culprit for the reduction of carbon storage in the region.

3.4.2. Carbon Storage Simulation in 2030

According to the PLUS model projections of future land use structure, this study employed the InVEST model to simulate carbon storage in the Qinling Mountains north slope region for 2030. Table 7 and Figure 7 present the carbon storage data and its spatial distribution across the four scenarios.
The carbon storage of the Qinling Mountains north slope region by 2030 is estimated to be 386,084,228.55 tons, 388,271,538.57 tons, 387,481,797.07 tons, and 383,315,234.45 tons in the ND, AP, EP, and UD scenarios, respectively. Compared with 2020, they will decrease by 5,078,575.72 tons, 2,891,265.70 tons, 3,681,007.20 tons, and 7,847,569.82 tons, respectively. However, under all four scenario models, carbon storage in GL and WA increased compared to 2020, especially under the EP scenario, where carbon storage in GL and WA peaked since 1990, with carbon storage of 48,592,717.78 tons and 2,390,982.30 tons, respectively. Meanwhile, FL also ended its downward trend since 2010 under the EP scenario, increasing its carbon storage by 77,310.46 tons from 2020. Moreover, Figure 7 visualizes the spatial variation of carbon storage under the four scenarios in 2030, which is most clearly reflected in the blue region of low carbon storage. The ND and UD scenarios have a vast expansion range in the blue region, compared to the AP and EP scenarios.

4. Discussion

This study conducted the first-ever analysis of the spatiotemporal evolution of carbon storage in the Qinling Mountains north slope region using multiple models. Based on the 1990–2020 land use classification and transfer matrix model, this paper utilized the PLUS model to predict the land use structure of the Qinling Mountains north slope region in 2030 under four scenarios. Then, the InVEST model was used to analyze the space-time changes in carbon storage in the region in the past 30 years and simulate the carbon storage in 2030. The integration of these methods served to enhance both the efficiency and precision of the study.
The findings indicate that, between 1990 and 2020, the Qinling Mountains north slope region experienced rapid urbanization, resulting in a significant decrease in total carbon storage, primarily due to the decline in CL and the increase in COL. However, the areas of FL, GL, and WA, although they also varied over the three decades, were generally more stable, showing that the region had been effective in ecological conservation.

4.1. Carbon Storage Analysis for Four Scenarios in 2030

As shown in Figure 8, in the simulation of carbon storage in the four scenarios in 2030, the carbon storage in the Qinling Mountains north slope region was reduced in all scenarios, compared with that in 2020. Specifically, the predominant factor driving this decline is the reduction in CL, a trend that persists even in the AP scenario, failing to counteract the sharp decline in cultivated land area. The carbon storage of CL was reduced by about 2.25 million tons, compared to 2020. However, the area in GL and COL increased year by year from 2010 and, even in the four scenarios in 2030, they also maintained an increasing trend, indicating that the decrease in carbon storage in the region was caused by the boom in urbanization on the one hand. On the other hand, it might also be caused by the relevant government’s policy of returning farmland to grassland.
In conclusion, the simulation results for carbon storage in the four 2030 scenarios, coupled with identifying key contributing factors, underscore the preferential adoption of the AP scenario. This strategy prioritizes safeguarding cultivated land to halt the decline in carbon storage within the region and potentially even achieve an increase in carbon storage. Notably, the AP scenario aligns harmoniously with the national strategy proposed by the Chinese government, emphasizing the importance of “protecting cultivated land to ensure national food security”, which is proposed by the Chinese government today.

4.2. Main Causes of Carbon Storage Decline

As mentioned earlier, the reduction and conversion of cultivated land is the most important factor in the reduction of carbon storage in the Qinling Mountains north slope region. Therefore, this paper focuses on the causes of the continuous reduction of cultivated land in the region over the past three decades, which are mainly caused by the following six aspects: (1) The construction of many illegal villas has encroached on cultivated land. The Qinling Mountains north slope region is surrounded by mountains and water, with four distinct seasons, an excellent natural environment, and convenient transportation; so, since 2000, many real estate developers obtained land development rights in the region and built a large number of villas through a variety of illegal means. Due to the strict ecological and forest protection policies that have existed for a long time in the area, most of these villa areas were mainly encroaching on cultivated land. This kind of development and construction of villas on a large scale, based on substantial financial resources, was the most crucial factor leading to the reduction of cultivated land in the region. Around 2018, the Chinese government carried out severe remediation of the illegal construction of villas in the region, effectively curbing the region’s cultivated land reduction. (2) Accelerated urbanization has encroached on cultivated land. Since 1990, China has entered a period of rapid urbanization, with strong demand for construction lands such as transportation land, industrial land, and residential land. Coupled with the fact that land-related fiscal revenues play a crucial role in promoting urbanization in the local economy, the rapid expansion of urban areas, is also an essential factor that leads to the continuous reduction of cultivated land. According to the data from China’s third land survey, China had about 40,866,700 hm2 of total construction land in 2019, an increase of 8,533,300 hm2, or 26.5%, compared with 2009 [29]. Amidst the wave of urbanization, the construction land in the northern slopes of the Qinling Mountains has experienced substantial growth, mainly concentrated around the core urban area, resulting in a significant expansion of road networks at all hierarchical levels. In 2020, the construction land in this region increased by 13.73%, compared to 2010. (3) Uncontrolled rural self-built house expansion encroaches on cultivated land. Numerous villages exist within the northern slopes of the Qinling Mountains. As economic conditions improve, villagers desire to enhance their living standards. However, China’s dual urban-rural land system and the absence of village construction planning have led villagers in this region to repeatedly encroach on cultivated land and construct houses, violating the law. (4) Erroneous beliefs regarding ecological protection and construction exacerbate the depletion of cultivated land. The northern slopes of the Qinling Mountains are among Shaanxi Province and China’s foremost ecological protection zones. Regrettably, certain local authorities within this ecological sanctuary hold the erroneous belief that the establishment of parks, green spaces, and similar landscapes constitutes ecological protection. This misconception has resulted in the encroachment of cultivated land for afforestation and the excavation of lakes to create artificial landscapes. For example, the Meipi Lake scenic area in Xi’an City, located in the Qinling Mountains north slope region, transformed a large amount of farmland into an artificial water landscape, which not only did not improve the ecological environment but also, because of the deterioration of its own water body, damaged the local ecology, and was forced to suspend operations in 2023. (5) Excessive ecological protection strategies have encroached on cultivated land. For many years, the government’s policy of returning farmland to forests in the Qinling Mountains north slope region has been implemented to protect the local ecosystem, which may increase the region’s carbon storage capacity to a certain extent. However, this should not be at the expense of cultivated land. Cultivated land may be inferior to forests in terms of carbon sink capacity, but it is irreplaceable in safeguarding people’s livelihoods and ensuring food security. (6) The growing emotional detachment of farmers from farmland has also led to a decline in cultivated land. The Qinling Mountains north slope region is close to the cities of Xi’an, Xianyang, Baoji, and Weinan, and many farmers have traveled to the cities to work to raise their incomes. With the gradual integration into urban life, most of these farmers and their descendants will not return to the countryside, and more and more farmers are no longer enthusiastic about cultivating their land and laboring. Reduced attention to cultivated land by farmers groups has resulted in cultivated landowners abandoning cropland protection, making it more susceptible to erosion.

4.3. Suggestions for Increasing Carbon Storage

The Qinling Mountains north slope region, a critical ecological barrier in China, plays a pivotal role in carbon storage, oxygen generation, and water preservation [30]. Furthermore, it represents a key region for enhancing the ecological conditions within the middle and lower reaches of the Yellow River. In addition, this paper finds that the reduction of cultivated land is the primary factor leading to the decline of carbon storage in the region, so protecting CL and further strengthening the protection of ecological environments, such as FL and GL, becomes an important path to increase carbon storage in the region. Consequently, this paper presents nine recommendations aimed at enhancing the region’s carbon storage capacity: (1) A master plan for carbon storage and emissions in the Qinling Mountains north slope region should be formulated by the Shaanxi Provincial Government to improve the region’s carbon sink capacity at the policy level. (2) In the Qinling Mountains north slope region, the regional governments should formulate master plans for rural construction and guide farmers in improving their living environment. (3) The regional government should strictly prohibit landscape construction that occupies cultivated land, such as enclosing fields for forestation and digging lakes for landscaping. (4) Agricultural agencies should crack down on the encroachment of land for illegal construction and strictly protect CL. (5) Agricultural agencies should develop generous agricultural incentives to increase farmers’ participation in agricultural production and encourage more young farmers to return home. (6) Environmental agencies should increase their efforts to protect ecosystems by prohibiting damage to FL, GL, and WA, as well as the pollution of environmental factors, such as soil. (7) Forestry agencies should develop more stringent forest and grassland conservation policies to improve the quality and carbon sink capacity of the region’s terrestrial ecosystems in general. (8) Carbon sink management organizations should establish a carbon sink compensation mechanism and take measures such as fines and off-site compensation for lost carbon sinks to ensure that the capacity of carbon sinks is not reduced. (9) Carbon sink management organizations should conduct real-time monitoring of land use and carbon sink capacity in the Qinling Mountains north slope region using satellite remote sensing, drones, and other technologies.
Overall, strengthening the protection of cultivated land in the region and increasing the willingness of local farmers to engage in agricultural production, while considering the ecological environment, are effective strategies for increasing carbon storage in the Qinling Mountains north slope region.

5. Conclusions

Based on the land use characteristics in 1990, 2020, 2010, and 2020, this paper simulated the spatiotemporal evolution of land use and carbon storage in the Qinling Mountains north slope region in 2030 under four scenarios: Natural development priority, Arable land protection priority, Ecological protection priority, and Urban development priority, using a combination of four models, including the land use classification model, land use transfer matrix model, PLUS model, and InVEST model. The results reveal a consistent decline in carbon storage within the Qinling Mountains north slope region, spanning from the early 1990s to the present. The declining trend in the region has remained the same, even under the four scenarios modeled for 2030, so the region faces a significant challenge in carbon storage increase. This paper presents nine recommendations aimed at augmenting the carbon storage capacity of the region, aligning with the Chinese government’s objective to reach carbon peak by 2030 and attain carbon neutrality by 2060 [31,32].
In this paper, the authors make two exciting discoveries: (1) The ecological environment in the Qinling Mountains north slope region is excellent. Over the past decades, the state and local governments have invested a great deal of effort into the ecological improvement of the region [33,34]. The ecological improvement should have favored the increase of carbon storage, but carbon storage in the region has been declining from 1990 to the present. (2) In the Qinling Mountains north slope region, where the forest cover is high, FL and GL have not been the dominant factors in imaging the changes in carbon storage in the region; instead, CL has become the main protagonist. Therefore, based on these two findings, the authors concluded that the carbon storage capacity of cultivated land has been underestimated in the foothills or shallow mountains. Although FL and GL are the key factors affecting carbon storage, CL also plays a vital role in increasing the carbon storage capacity of the region. The authors anticipate that this paper will serve as a valuable resource, offering references and case studies for examining carbon sinks in the Qinling Mountains north slope region. In addition, the methodology and conclusions of this paper will also contribute to research in other regions in enhancing carbon storage.
Although this paper is the first study on carbon storage in the Qinling Mountains north slope region, meaningful results and findings were also obtained. Nevertheless, achieving carbon neutrality and carbon peak are intricate and multifaceted challenges. This paper focused solely on the carbon storage capacity of terrestrial ecosystems within the Qinling Mountains north slope region, neglecting other facets of carbon sinks, including carbon emissions. Consequently, the study falls short of comprehensively depicting the spatiotemporal evolution of carbon sinks within the region. In the future, this paper intends to optimize the carbon storage model and employ a broader array of carbon sink methodologies to investigate the carbon sinks within the Qinling Mountains north slope region within at least a 5-year cycle. Such efforts will contribute to realizing the region’s carbon neutrality and carbon peak objectives.
During urbanization, crucial ecological zones including the Qinling Mountains north slope region grapple with conflict between urban construction, safeguarding cultivated land, and ecological preservation. In light of the strategic objectives of achieving carbon neutrality and carbon peak, carbon sinks have emerged as a novel challenge. This paper hopes to establish a mechanism to balance urban development, cultivated land protection, ecological protection, and carbon sink enhancement through the study of carbon storage in the Qinling Mountains north slope region. It encourages more scholars to participate in the study of carbon sinks in critical ecological zones to promote their healthy development jointly.

Supplementary Materials

The following supporting information can be downloaded at: https://www.mdpi.com/article/10.3390/land12112063/s1, Table S1: A sample of the land use transition matrix.; Table S2: Land use change information between T1 and T2. Table S3: Confusion matrix accuracy verification in 2020. Tables S4–S6: Land use transfer matrix between 1990 and 2020 (hm2).

Author Contributions

Conceptualization, J.C. and Y.Z.; methodology, J.C. and K.W.; software, J.C. and K.W.; validation, J.C. and K.W.; formal analysis, J.C. and M.L.; investigation, J.C., X.W. and M.L.; resources, L.N. and X.Z.; data curation, J.C. and X.Z.; writing—original draft preparation, J.C.; writing—review and editing, J.C. and K.W.; visualization, J.C., K.W. and X.W.; supervision, J.C. and Y.Z.; project administration, Y.Z. and L.N.; funding acquisition, Y.Z. and X.Z. All authors have read and agreed to the published version of the manuscript.

Funding

This research was funded by the National Natural Science Foundation of China [Grant Number: (31971690)], and Forestry Science and Technology Innovation Project of Shaanxi Province [Grant Number: (SXLK2023-02-25)].

Data Availability Statement

The authors confirm that the data supporting the findings of this study are available within the article and its Supplementary Materials.

Acknowledgments

We are so grateful to the anonymous reviewers and editors for their suggestions.

Conflicts of Interest

The authors declare no conflict of interest.

References

  1. Bolan, N.; Hoang, S.A.; Beiyuan, J.; Gupta, S.; Hou, D.; Karakoti, A.; Joseph, S.; Jung, S.; Kim, K.-H.; Kirkham, M. Multifunctional applications of biochar beyond carbon storage. Int. Mater. Rev. 2022, 67, 150–200. [Google Scholar] [CrossRef]
  2. Kauffman, J.B.; Giovanonni, L.; Kelly, J.; Dunstan, N.; Borde, A.; Diefenderfer, H.; Cornu, C.; Janousek, C.; Apple, J.; Brophy, L. Total ecosystem carbon stocks at the marine-terrestrial interface: Blue carbon of the Pacific Northwest Coast, United States. Glob. Chang. Biol. 2020, 26, 5679–5692. [Google Scholar] [CrossRef] [PubMed]
  3. Sothe, C.; Gonsamo, A.; Arabian, J.; Kurz, W.A.; Finkelstein, S.A.; Snider, J. Large soil carbon storage in terrestrial ecosystems of Canada. Glob. Biogeochem. Cycles 2022, 36, e2021GB007213. [Google Scholar] [CrossRef]
  4. Brönnimann, S. Global warming (1970–present). In The Palgrave Handbook of Climate History; Palgrave Macmillan: London, UK, 2018; pp. 321–328. [Google Scholar]
  5. Chen, J.; Zhang, X.; Wang, K.; Yan, Z.; Zhang, W.; Niu, L.; Zhang, Y. Spatial-Temporal Evolution and Prediction of Carbon Storage in Areas Rich in Ancient Remains: A Case Study of the Zhouyuan Region, China. Land 2023, 12, 1266. [Google Scholar] [CrossRef]
  6. Fernández-Martínez, M.; Sardans, J.; Chevallier, F.; Ciais, P.; Obersteiner, M.; Vicca, S.; Canadell, J.; Bastos, A.; Friedlingstein, P.; Sitch, S. Global trends in carbon sinks and their relationships with CO2 and temperature. Nat. Clim. Chang. 2019, 9, 73–79. [Google Scholar] [CrossRef]
  7. Tobler, W.R. Cellular geography. Philos. Geogr. 1979, 20, 379–386. [Google Scholar]
  8. Verburg, P.H.; Soepboer, W.; Veldkamp, A.; Limpiada, R.; Espaldon, V.; Mastura, S.S. Modeling the spatial dynamics of regional land use: The CLUE-S model. Environ. Manag. 2002, 30, 391–405. [Google Scholar] [CrossRef]
  9. Liu, X.; Liang, X.; Li, X.; Xu, X.; Ou, J.; Chen, Y.; Li, S.; Wang, S.; Pei, F. A future land use simulation model (FLUS) for simulating multiple land use scenarios by coupling human and natural effects. Landsc. Urban Plan. 2017, 168, 94–116. [Google Scholar] [CrossRef]
  10. Liang, X.; Guan, Q.; Clarke, K.C.; Liu, S.; Wang, B.; Yao, Y. Understanding the drivers of sustainable land expansion using a patch-generating land use simulation (PLUS) model: A case study in Wuhan, China. Comput. Environ. Urban Syst. 2021, 85, 101569. [Google Scholar] [CrossRef]
  11. Yang, D.; Liu, W.; Tang, L.; Chen, L.; Li, X.; Xu, X. Estimation of water provision service for monsoon catchments of South China: Applicability of the InVEST model. Landsc. Urban Plan. 2019, 182, 133–143. [Google Scholar] [CrossRef]
  12. Li, X.; Chen, G.; Liu, X.; Liang, X.; Wang, S.; Chen, Y.; Pei, F.; Xu, X. A new global land-use and land-cover change product at a 1-km resolution for 2010 to 2100 based on human–environment interactions. Ann. Am. Assoc. Geogr. 2017, 107, 1040–1059. [Google Scholar] [CrossRef]
  13. Babbar, D.; Areendran, G.; Sahana, M.; Sarma, K.; Raj, K.; Sivadas, A. Assessment and prediction of carbon sequestration using Markov chain and InVEST model in Sariska Tiger Reserve, India. J. Clean. Prod. 2021, 278, 123333. [Google Scholar] [CrossRef]
  14. Piyathilake, I.; Udayakumara, E.; Ranaweera, L.; Gunatilake, S. Modeling predictive assessment of carbon storage using InVEST model in Uva province, Sri Lanka. Model. Earth Syst. Environ. 2022, 8, 2213–2223. [Google Scholar] [CrossRef]
  15. Nel, L.; Boeni, A.F.; Prohászka, V.J.; Szilágyi, A.; Tormáné Kovács, E.; Pásztor, L.; Centeri, C. InVEST Soil Carbon Stock Modelling of Agricultural Landscapes as an Ecosystem Service Indicator. Sustainability 2022, 14, 9808. [Google Scholar] [CrossRef]
  16. González-García, A.; Arias, M.; García-Tiscar, S.; Alcorlo, P.; Santos-Martín, F. National blue carbon assessment in Spain using InVEST: Current state and future perspectives. Ecosyst. Serv. 2022, 53, 101397. [Google Scholar] [CrossRef]
  17. Dampha, N.K. Change detection (1985–2020): Projections on land-use land cover, carbon storage, sequestration, and valuation in Southwestern Gambia. Sustain. Environ. 2021, 7, 1875556. [Google Scholar] [CrossRef]
  18. Abere, T.; Adgo, E.; Afework, S. Trends of land use/cover change in Kecha-Laguna paired micro watersheds, Northwestern Ethiopia. Cogent Environ. Sci. 2020, 6, 1801219. [Google Scholar] [CrossRef]
  19. Hernández-Guzmán, R.; Ruiz-Luna, A.; González, C. Assessing and modeling the impact of land use and changes in land cover related to carbon storage in a western basin in Mexico. Remote Sens. Appl. Soc. Environ. 2019, 13, 318–327. [Google Scholar] [CrossRef]
  20. Guo, B. Study on the evolution, theoretical logic and practical path of China’s green development under the goal of carbon peaking and carbon neutrality. China Price 2023, 8, 12–15+19. [Google Scholar]
  21. Chen, J.; Niu, L.; Song, J.; Wang, K.; Zhang, Y. Analysis on Landscape Elements of Courtyard Building A of Fengchu in Zhouyuan Site in the Early Western Zhou Dynasty. Landsc. Archit. Acad. J. 2023, 40, 101–110. [Google Scholar]
  22. Zhou, X.; Lv, H.; Zhu, T.; Luo, L.; Kong, Y. The Implementation Path of Ecological Preservation and Recovery Based on “Watershed, Function, and Geography”: The Northern Qinling Mountains of Xi’an Section. Planners 2023, 39, 127–133. [Google Scholar]
  23. Committee, E.A.R.A. Shaanxi Province Qinling General Plan for Ecological Environment Protection; Shaanxi Provincial Government: Taiyuan, China, 2020. [Google Scholar]
  24. Dadashpoor, H.; Azizi, P.; Moghadasi, M. Land use change, urbanization, and change in landscape pattern in a metropolitan area. Sci. Total Environ. 2019, 655, 707–719. [Google Scholar] [CrossRef]
  25. Chen, J.; Zhang, Y.; Liu, X.; Sun, X. Analysis of spatial-temporal evolution of landscape patterns in ancient large city-sites based on multi-temporal Landsat imagery: A case study of the Zhouyuan site region in China. Eur. J. Remote Sens. 2022, 55, 471–484. [Google Scholar] [CrossRef]
  26. Luo, S.; Hu, X.; Sun, Y.; Yan, C.; Zhang, X. Multi-scenario land use change and its impact on carbon storage based on coupled Plus-Invest model. Chin. J. Eco-Agric. 2023, 31, 300–314. [Google Scholar] [CrossRef]
  27. Wang, X. Evolution of Ecosystem Services of Weihe River Basin in ShaanXi Qinling MountainsBased on InVEST Model. Master’s Thesis, Northwest University, Xi’an, China, 2022. [Google Scholar]
  28. Yang, L.; Zhao, J.; Zhu, J.; Liu, L.; Zhang, P. Spatial—Temporal change and prediction of carbon stock in the ecosystem of Xi’an based on PLUS and InVEST models. Remote Sens. Nat. Resour. 2022, 34, 175–182. [Google Scholar]
  29. Xu, H.; Qiao, J.L.; Huang, X.F.; Ji, L.L. Survey on the problem of arable land. Economic Daily News, 14 February 2022. Available online: https://xuewen.cnki.net/CCND-JJRB202202140011.html (accessed on 6 July 2023).
  30. Wu, W.Q.; Zhao, Y.; Tian, H.W.; Chen, Y.P. Spatio-temporal variation characteristics and driving mechanism of habitat quality of Qinling Mountains in recent 40 years. J. Earth Environ. 2023, 4, 1–27. [Google Scholar]
  31. Liu, W.; Jiang, W.; Tang, Z.; Han, M. A study on the pathway to carbon peak by 2030 in China—A portfolio analysis based on GDP growth rate. Sci. Sin. (Terrae) 2022, 52, 1268–1282. [Google Scholar]
  32. Li, M.Q.; Chen, S.Q. Synergetic Evolution of Economic Growth and Carbon Neutrality Process of Chinese Cities. Urban Environ. Stud. 2022, 4, 94–110. [Google Scholar]
  33. Zhang, J.X.; Liu, X.; Wang, C.C.; Song, J.X.; Huang, P.; Shi, Y.; Li, Q. Construction of Water Conservation Capacity Evaluation Index System Based on Spatial Heterogeneity in Qinling Mountains. J. Soil Water Conserv. 2022, 36, 290–297. [Google Scholar]
  34. Zhao, T.; Bai, H.Y.; Deng, C.H.; Meng, Q.; Guo, S.Z.; Qi, G.Z. Topographic differentiation effect on vegetation cover in the Qinling Mountains from 2000 to 2016. Acta Ecol. Sin. 2019, 39, 4499–4509. [Google Scholar]
Figure 1. Research scope map.
Land 12 02063 g001
Figure 2. Method flow chart.
Land 12 02063 g002
Figure 3. Land use structure map from 1990 to 2020.
Land 12 02063 g003
Figure 4. Land use conversion maps from 1990 to 2020.
Land 12 02063 g004
Figure 5. Land use structure simulation in 2030.
Land 12 02063 g005
Figure 6. Carbon storage spatial distribution from 1990 to 2020.
Land 12 02063 g006
Figure 7. Carbon storage spatial distribution under four scenarios in 2030.
Land 12 02063 g007
Figure 8. Carbon storage changes in various land use types from 1990 to 2030.
Land 12 02063 g008
Table 1. Drivers of land use change in the Qinling Mountains north slope region.
CategoryNo.Data NameYearSource
Natural Driving Factors1Land use 1990, 2000, 2010, 2020https://www.resdc.cn
(accessed on 14 September 2023)
2Annual average temperature2020http://data.cma.cn
(accessed on 14 September 2023)
3Annual precipitation2020http://data.cma.cn
(accessed on 14 September 2023)
4DEM 2020https://www.gscloud.cn
(accessed on 14 September 2023)
5Slope2020Generated by DEM in ArcGIS Software
6Soil type 2018http://soil.geodata.cn
(accessed on 14 September 2023)
Social Driving Factors1Population size 2019https://www.resdc.cn
(accessed on 14 September 2023)
2GDP density 2019https://www.resdc.cn
(accessed on 14 September 2023)
3Nighttime lighting 2020https://www.resdc.cn
(accessed on 14 September 2023)
4Distance to main roads2020Calculations from ArcGIS software
5Distance to railways 2020Calculations from ArcGIS software
6Distance to highways 2020Calculations from ArcGIS software
Table 2. Carbon density of each land use type in the Qinling Mountains north slope region (t/hm2).
TypeC-aboveC-belowC-SoilC-Dead
CL46.5080.50107.3013.00
FL58.30115.20268.0013.00
GL20.5950.4658.282.22
COL3.505.4510.570.00
WA0.0070.000.000.00
UL9.200.1012.500.00
Note: Cultivated Land (CL); Forest Land (FL); Grassland (GL); Water Area (WA); Construction Land (COL); Unutilized Land (UL); Carbon density of above-ground biomass (C-above); Carbon density of below-ground biomass (C-below); Carbon density of soil organic matter (C-soil); Carbon density of dead organic matter (C-dead).
Table 3. Land use structure from 1990 to 2020.
YearArea
Proportion
CLFLGLCOLWAUL
1990Area/hm2533,134.71489,146.85357,785.1077,482.9827,171.451809.54
Proportion/%35.8632.9124.075.211.830.12
2000Area/hm2524,574.63487,185.84357,966.5490,689.2224,304.861809.54
Proportion/%35.2932.7724.086.101.640.12
2010Area/hm2499,535.91494,049.78343,948.68121,269.9625,971.031755.27
Proportion/%33.6033.2423.148.161.750.11
2020Area/hm2472,269.69490,740.12353,369.79137,921.1330,051.812178.09
Proportion/%31.7733.0123.779.282.020.15
Note: Cultivated Land (CL); Forest Land (FL); Grassland (GL); Water Area (WA); Construction Land (COL); Unutilized Land (UL).
Table 4. Land use change information from 1990 to 2020 (hm2).
TypeIncreaseDecreaseTotal Change DataExchange Change DataNet Change Data
1990–2000
CL5799.6014,359.6820,159.2811,599.208560.08
FL1085.403046.414131.812170.801961.01
GL2597.672416.235013.904832.46181.44
WA1664.554531.146195.693329.102866.59
COL13,215.969.7213,225.6819.4413,206.24
UL0.000.000.000.000.00
Total24,363.1824,363.1848,726.3610,975.5013,387.68
2000–2010
CL35,576.0160,614.7396,190.7471,152.0225,038.72
FL26,342.8219,478.8845,821.7038,957.766863.94
GL26,870.9440,888.8067,759.7453,741.8814,017.86
WA7611.575945.4013,556.9711,890.801666.17
COL38,128.327547.5845,675.9015,095.1630,580.74
UL268.92323.19592.11537.8454.27
Total134,798.58134,798.58269,597.1695,687.7339,110.85
2010–2020
CL26,871.7554,137.9781,009.7253,743.5027,266.22
FL19,215.6322,525.2941,740.9238,431.263309.66
GL32,547.4223,126.3155,673.7346,252.629421.11
WA7549.203468.4211,017.626936.844080.78
COL30,831.0314,179.8645,010.8928,359.7216,651.17
UL694.17271.35965.52542.70422.82
Total117,709.20117,709.20235,418.4087,133.3230,575.88
Note: Cultivated Land (CL); Forest Land (FL); Grassland (GL); Water Area (WA); Construction Land (COL); Unutilized Land (UL).
Table 5. Land use structure simulation under four scenarios in 2030 (hm2).
TypeNDPro (%)APPro (%)EPPro (%)UDPro (%)
CL450,402.93 30.30 463,189.59 31.16 446,993.64 30.07 439,229.79 29.55
FL488,029.05 32.83 487,029.51 32.76 490,910.22 33.02 487,657.26 32.81
GL361,539.45 24.32 358,904.52 24.14 369,385.92 24.85 361,034.82 24.29
WA33,347.70 2.24 33,441.66 2.25 34,156.89 2.30 33,214.86 2.23
COL151,089.30 10.17 141,846.39 9.55 142,524.36 9.59 162,839.97 10.95
UL2122.20 0.14 2118.96 0.14 2559.60 0.17 2553.93 0.17
Note: Cultivated Land (CL); Forest Land (FL); Grassland (GL); Construction Land (COL); Water Area (WA); Unutilized Land (UL); Natural development priority (ND); Arable land protection priority (AP); Ecological protection priority (EP); Urban development priority (UD); Proportion (Pro).
Table 6. Carbon storage of each land use type from 1990 to 2020 (t).
Type
Year
1990200020102020
CL131,844,213.78 129,727,306.00 123,535,230.54 116,792,294.34
FL222,317,243.33 221,425,964.28 224,545,625.01 223,041,384.54
GL47,066,629.91 47,090,498.34 45,246,448.85 46,485,795.87
WA1,902,001.50 1,701,340.20 1,817,972.10 2,103,626.70
COL1,512,467.77 1,770,253.57 2,367,189.62 2,692,220.46
UL39,447.97 39,447.97 38,264.89 47,482.36
Total404,682,004.25 401,754,810.36 397,550,731.01 391,162,804.27
Note: Cultivated Land (CL); Forest Land (FL); Grassland (GL); Construction Land (COL); Water Area (WA); Unutilized Land (UL).
Table 7. Carbon storage of each land use type under four scenarios in 2030 (t).
TypeNDAPEPUD
CL111,384,644.60114,546,785.60110,541,527.20108,621,527.10
FL221,809,203.20221,354,912.30223,118,695.00221,640,224.70
GL47,560,514.6547,213,889.6148,592,717.7847,494,130.57
WA2,334,339.002,340,916.202,390,982.302,325,040.20
COL2,949,263.142,768,841.532,782,075.513,178,636.21
UL46,263.9646,193.3355,799.2855,675.67
Total386,084,228.55 388,271,538.57 387,481,797.07 383,315,234.45
Note: Cultivated Land (CL); Forest Land (FL); Grassland (GL); Construction Land (COL); Water Area (WA); Unutilized Land (UL); Natural development priority (ND); Arable land protection priority (AP); Ecological protection priority (EP); Urban development priority (UD).
Disclaimer/Publisher’s Note: The statements, opinions and data contained in all publications are solely those of the individual author(s) and contributor(s) and not of MDPI and/or the editor(s). MDPI and/or the editor(s) disclaim responsibility for any injury to people or property resulting from any ideas, methods, instructions or products referred to in the content.

