Article

A Data-Driven Farm Typology as a Basis for Agricultural Land Use Decisions

1
Department of Earth and Environmental Sciences, Katholieke Universiteit Leuven, 3001 Leuven, Belgium
2
Flemish Institute for Technological Research, 2400 Mol, Belgium
3
Institute for Science in Society, Radboud University Nijmegen, 6500 GL Nijmegen, The Netherlands
*
Author to whom correspondence should be addressed.
Land 2023, 12(11), 2032; https://doi.org/10.3390/land12112032
Submission received: 30 September 2023 / Revised: 2 November 2023 / Accepted: 4 November 2023 / Published: 8 November 2023
(This article belongs to the Special Issue Geospatial Data for Landscape Change)

Abstract

:
As a large proportion of land is managed by professional family farms, agent-based models are of interest for simulating agricultural land use. This requires a deep understanding of the farm characteristics that influence land use decisions. We developed a methodology to identify a data-driven farm typology by combining participatory methods, multivariate statistical modeling and spatiotemporal parcel-based land cover analysis between 2000 and 2020. A formal questionnaire provided data on the farm characteristics, which were subjected to principal component analysis and k-means clustering. The resulting data-driven typology complemented a production-based approach to understanding land use decisions. The main influencing factors were farm size, share of private land, dominant crops and participation in European schemes such as NATURA2000 and agri-environment-climate measures. Overall, family tradition and a high return on investment were the most important motivations for maintaining current land use practices, while a higher income, income support and diversification were the most important reasons for pursuing new land use options. Differences between the farm characteristics highlighted the importance of the motivations for land use decisions between the farm types. This methodology can be used to generate data-driven typologies suitable for implementing agent-based models to explore sustainable land management options in a changing environment.

1. Introduction

Agriculture’s main challenge for the coming decades will be to reconcile the production of sufficient food and fibre for a growing population and, at the same time, protect and promote the environmental integrity of local landscapes and the global environment in a changing climate [1,2]. Europe’s farmers no longer derive their income solely from food production; they also play an essential role in environmental stewardship in a changing climate [3,4,5,6]. The Common Agricultural Policy (CAP) has moved from price support to producer support, increasingly paying farmers directly for delivered services such as environmentally respectful farming as outlined in the European Green Deal [7]. Support has shifted from unconditional payments for agricultural production to incentives for rural development and environmental stewardship [8]. Subsidies are justified to support public benefits such as maintaining the landscape, looking after the environment, maintaining animal welfare, guaranteeing food security and quality, reducing rural poverty through innovation and combating climate change [7]. A focus on landscape quality beyond the current focus on specific greening measures may leverage attention to cultural landscapes in the CAP [9].
The agriculture sector has experienced a paradigm shift towards providing more public services and underlying sustainable practices or input technologies. Despite many adjustments to the European agricultural policy, production intensification in some regions and land abandonment in other parts of Europe remain the major threats to the functioning of agro-ecosystems, impacting the state of soil, water and air and reducing biodiversity in agricultural landscapes [10]. The targeting of environmental policies requires a farm typology adapted to the specific needs, as demonstrated for the farmland management-environment nexus [11], ecological farming [12], cattle and fodder production [13], natural resource management [14] and nutrient management [15]. The emphasis of the European farm typology has been on economic productivity following the farm accountancy data network [16] and reflects the old rationale of the CAP which was born, in part, out of a wish to boost food production. The gradual transition towards environmental services is a compelling reason for rethinking farm typologies that are more in tune with the broader goals that the sector is aiming for nowadays.
Policies, strategies, programmes and projects that are related to environmental resource management and ecosystem services in rural areas [14,15,17] benefit from understanding the diversity and complexity of agricultural land use and spatial differentiation [18,19], which in turn enables the development of research and planning tools such as agent-based models. These computational models are used to simulate the behaviour and interactions of individual agents within a given environment [20]. In the context of agricultural land use, agents represent farmers who make land use decisions that enable, for example, spatial targeting of greening measures [19]. Agricultural land use is a complex and dynamic process that is situated at the intersection of various functions of farming and the physical environment [21,22]. Arable crops are mostly grown in rotations where successive crops are of different species. Crop rotations were originally developed centuries ago to conserve and maintain soil nutrients. Clovers and other legumes were included to add nitrogen to the soil [23]. Today, the main reason for rotating crops is control of pests and weeds, as changing the crop species limits the opportunities for specific pest and weed populations to develop [24]. For example, potato cyst nematode populations are controlled by allowing potatoes only once in 3 years since 1987 and once in 4 years since 2011 in an arable crop rotation, which is in line with evidence-based research [25]. Establishing crops such as winter cereals or winter oilseed rape in autumn will help manage nutrients and minimise the risk of nitrogen loss by leaching [26].
Agricultural agent-based models rely heavily on understanding the characteristics of farms in relation to farmers’ decision making [18,20]. Farm typology and agricultural land use decisions are interconnected in the context of understanding the complex dynamics of agricultural systems and land use patterns [19]. This study aims to develop a methodology to identify a data-driven farm typology for agricultural land use and decision analysis. The analysis was performed by comparing the proposed typologies of farms with spatial models and crop rotations using multi-annual parcel geodatabases. The methodology was developed using the Dijle catchment in central Belgium, which is particularly suitable as a test area due to its diversity in farms and agricultural land use. The methodology comprises consultative participatory methods such as farm interviews, the administration of a formal questionnaire, multi-annual land cover analysis of agricultural land parcel information, analysis of crop rotations and multivariate statistical modelling. The results of this study are in support of agent-based modelling for enhanced agricultural land use decision making.

2. Materials and Methods

2.1. Literature Review of Farm Typologies

Previous literature reviews have consistently highlighted the variety of methodologies and variables used to develop farm typologies [11,27,28]. These choices are frequently dependent on local circumstances, farm characteristics and targeted policies. There has been considerable variation in the range of farm typology studies, particularly those concerning agricultural land use and environments, in terms of their settings, purposes and methodologies (Table 1). This consistency of farm typology reviews supports the crucial function that farm types have in clarifying the complex processes behind agricultural land use decisions and their resulting environmental effects. Closely related are farmer typology studies, which categorise farmers based on individual characteristics, identities and behaviours. These studies provide clarification regarding the adoption of practices such as soil and water conservation [29], ecosystem service provision [17], ecological farming [30] and the European Green Deal measures [31]. In addition, farming system typologies provide a structured framework, based on socioeconomic factors, resource use and production methods for understanding and analysing the diversity of farming systems and for targeting recommendations [32,33,34].

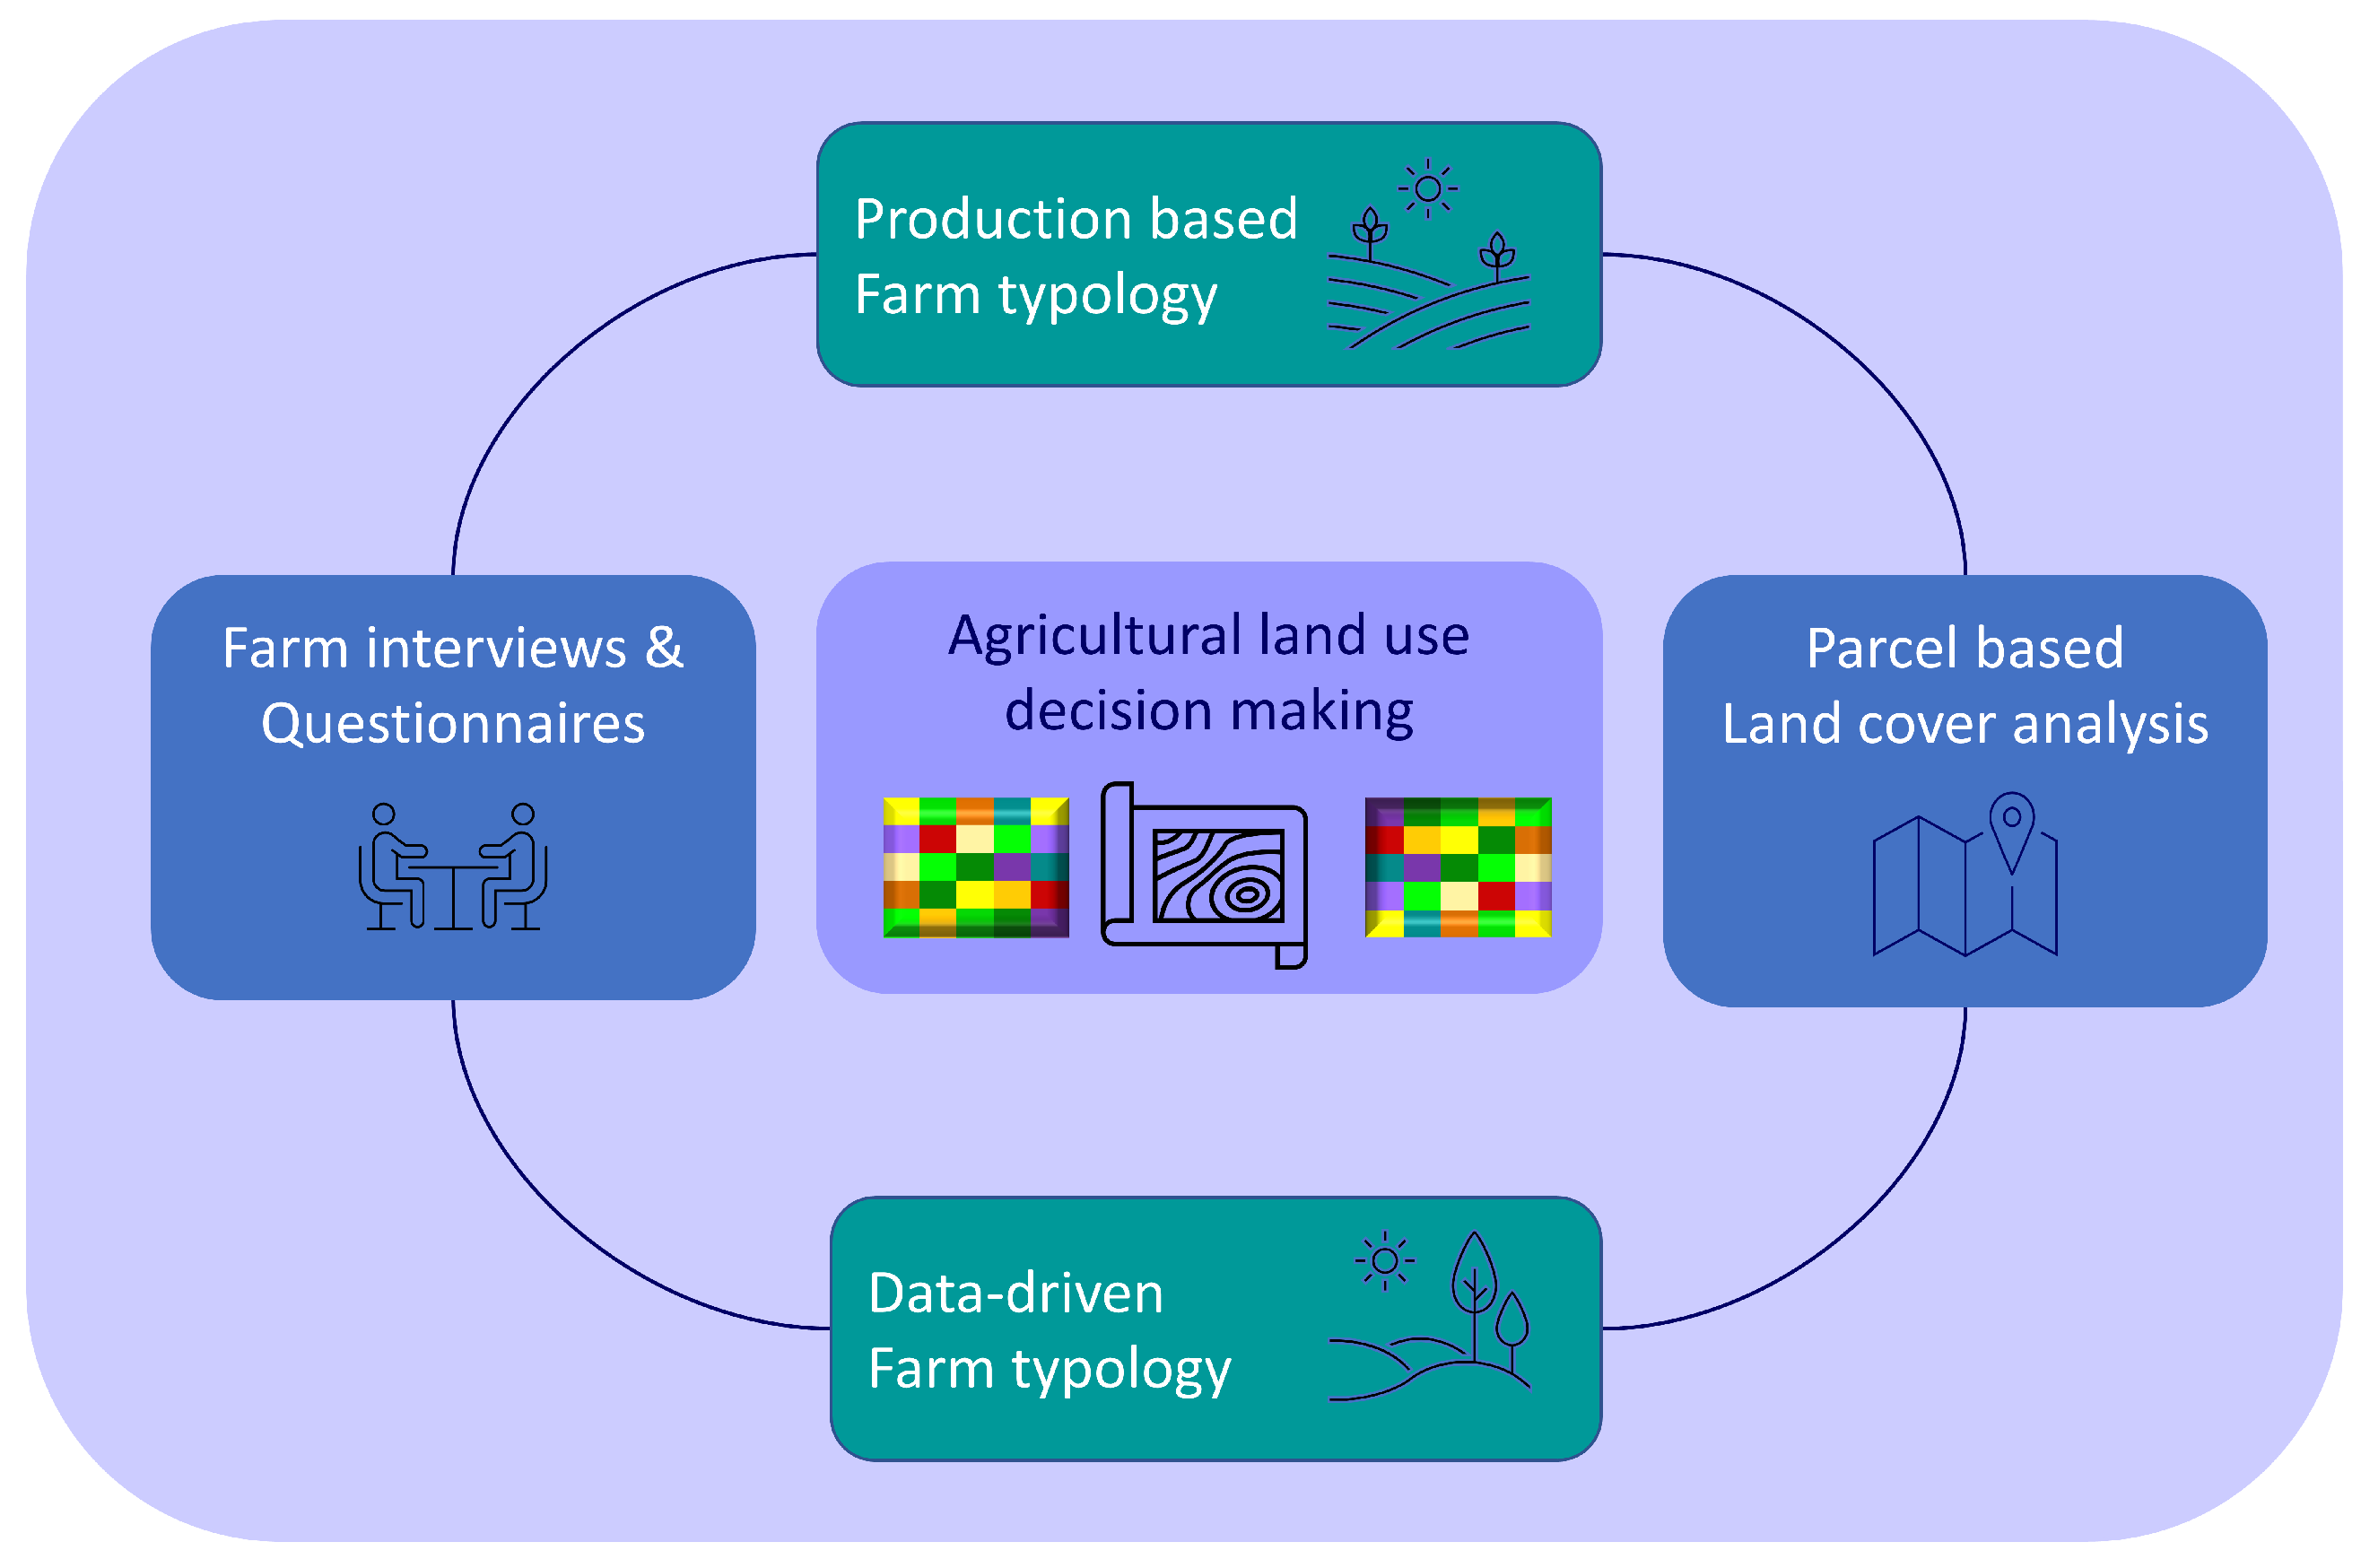
2.2. Research Methodology

A comprehensive research methodology was developed to create a robust data-driven farm typology in support of agricultural land use decision making. Farm characteristics were derived from a farm questionnaire and related to multi-annual parcel-based land cover analysis to identify farm typologies (Figure 1). Multivariate statistical methods were used to establish a data-driven farm typology, which was compared with a farm typology based on economic production activities. The methodology was tested on the Dijle catchment in central Belgium.

2.3. Farm Questionnaire

A questionnaire was sent to all 1171 farmers with agricultural parcels in the study area (i.e., 574 in Vlaams-Brabant and 597 in Brabant-Wallon) [39]. The questionnaire was pilot tested with 10 farmers not belonging to the study population (5 in each region) using a face-to-face interview format. The purpose was to ensure readability, clarity and acceptability of the questions. For both regions, the mailing (in Dutch or French) included an introductory letter, an anonymous questionnaire and a prepaid envelope for returning the completed questionnaire. After a few weeks, a reminder was sent to non-respondents. A total of 237 completed questionnaires were returned and digitally processed, giving a response rate of 20.24%. Our analysis required that all parts of the questionnaire were filled and that the farmers had more than one parcel or more than 2 ha of their total area located in the Dijle catchment, which was the case for 219 respondents, giving a response rate of 21.99%. The questionnaire included farm characteristics, land use decisions related to cropping and livestock systems, decisions related to participation in agri-environment-climate measures and farmers’ personal data [39]. The questions were predominantly multiple-choice, augmented with open-ended options and ranking exercises. The farm characteristics included questions about farm size, ownership and on-farm and off-farm activities. Land use and cover included questions on arable land, livestock, farm management and intensity. Land use and cover decisions were elicited by using multiple-choice questions, where the farmers were asked to rank the three most important motivations for engaging in their current land use and cover or for changing to a new type of land use and cover. The list of motivations was derived from previous research in the region that was focused on farmers’ decision criteria and motivations [39]. The descriptive statistics were calculated with R [40], and the lower, median and upper quartiles of the sample were reported. The environmental farm indicators were the number of agri-environment-climate measures participated in, the farm intensity which was reported per farm activity (crop and livestock) weighted for the farm, the number of inputs such as manure, fertiliser, agri-chemicals and concentrated feed divided by the number of crops and the number of environmentally friendly practices, such as green manure crops, rotation, zero tillage and direct seeding, divided by farm activities.

2.4. Farm Typology

Agricultural holdings can be classified according to different methods. The Belgian government characterises farm types on the basis of economic statistics [41]. The main criterion for classifying farms into different types is the relative distribution of the farm income from different production sources (field crops, dairy cattle, etc.). According to this economic typology, the main farm types in the region are arable farming, horticulture, permanent crops (fruit), cattle farming, pig farming and mixed farming (arable farming + cattle farming). The level of economic income, as documented in the farm accountancy data network (FADN) for Belgium, generally leads to a further classification into small, medium and commercial farms depending on the calculated standard gross margin (prior to 2010) or standard output (from 2010 onward), both of which are used to determine the economic size of farms. The standard output reflects the value of the agricultural products at farm gate price [16]. We explored a data-driven farm typology using multivariate statistics. Our parameterisation and assignment of different groups was based on different farm characteristics, land use and participation in agri-environment-climate measures. A 219 × 26 matrix was constructed using R [40], consisting of 26 standardised variables including farmer age, percentage of employment on the farm, labour on the farm, non-farm activities, non-farm income, number of farm parcels, percentage of parcels rented or owned, agricultural area, area per main crop (wheat, maize, potatoes, sugar beet, chicory, pulses, oilseeds, fruit, vegetables, grass or fallow), animal heads (pigs, horse and cattle), number of agri-environment-climate measures and parcels subject to environment or nature conservation legislation. Since many of the variables were correlated, principal component analysis (PCA) was used to recover a vector space of a lower dimension, onto which the original variables were projected, thus revealing the underlying structure of the data. PCA was performed on the correlation matrix (i.e., all variables were standardised to zero mean and unit variance). Statistical parameters such as the coordinates and contributions of variables and cases, component scores and coefficients, eigenvalues and descriptive statistics helped decide which principal components should be retained to adequately describe the original data set. The scree plot of the eigenvalues of the correlation matrix and the component plane plot provided visual support for the classification of variables and cases, respectively. Two-dimensional plots of the variable vectors in the plane of the first two principal components showed the contributions of the variables to the first components and helped decide on the most important contributing characteristics to the analysis. Non-hierarchical cluster analysis following the k-means algorithm was performed on the scores of the first set of principal components, which together explained more than three quarters of the variance in the data set. The Euclidean distance between the group centroids was used to measure the proximity between groups. The dispersion within classes, expressed as the sums of the squares of the deviations from the group means, was minimised through subsequent iterations to arrive at an optimal number of classes. Records were reassigned until they were located in the group with the nearest centroid. The resulting clusters were compared with the economic production-based farm typology and with the results of parcel-based land cover analysis.

2.5. Parcel-Based Land Cover Analysis

We evaluated the results of the questionnaire survey and multivariate statistics with parcel information from the Land Parcel Identification System (LPIS) databases, which is part of the Integrated Administration and Control System (IACS), the main administrative tool for managing farmers’ applications for income support. The LPIS provides spatial information on the area under the main crops each year [42,43]. LPIS data were available and merged for the period of 2000–2020. More than 70 codes were used, covering the main crop groups of winter cereals, spring cereals, sugar beet, maize, potatoes, legumes, grasses, chicory, vegetables, oilseeds, flax, fruit and trees. The minimum size of a parcel eligible for farm income support was 0.3 ha and 20 m wide before 2004 and 0.1 ha and 10 m wide thereafter. Some farmers may have individual parcels in the area but not all of their holdings. For the statistical analysis of agricultural holdings, farms with only one parcel or with an agricultural area of less than 2 ha of their total area located in the Dijle catchment were excluded from further analysis.

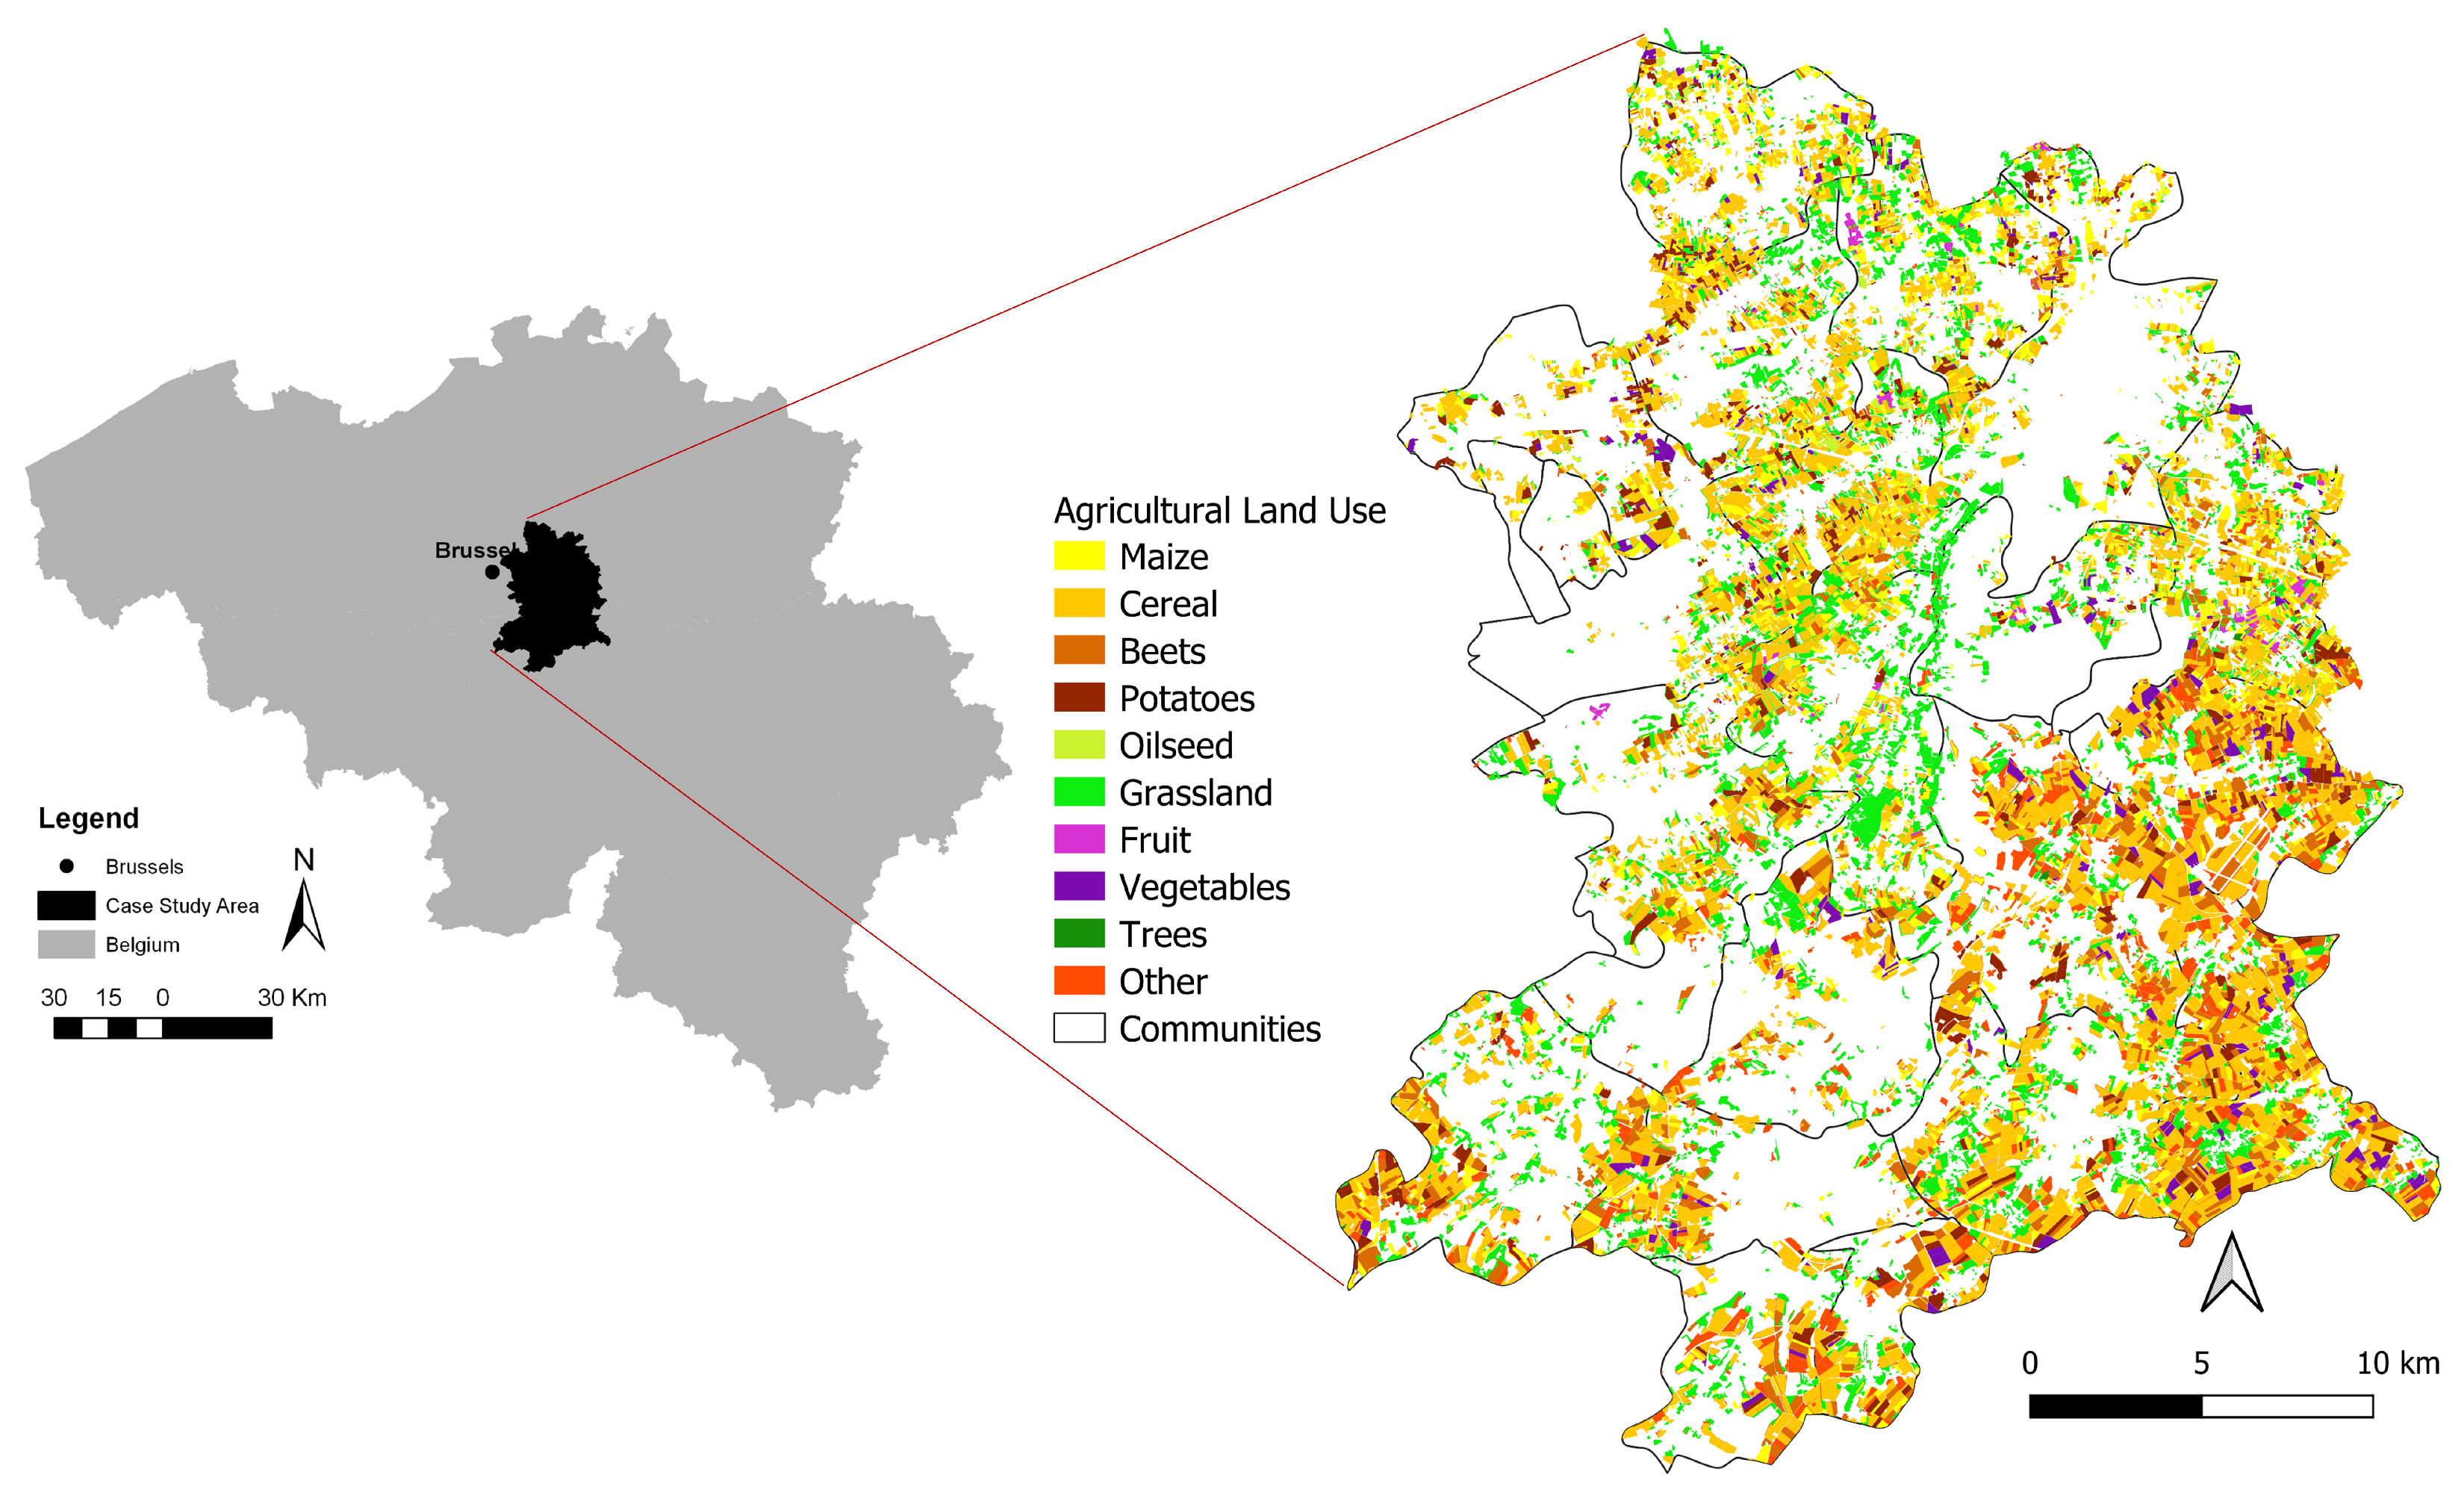
2.6. The Dijle Catchment Study Area

The study area comprised 19 municipalities, of which 13 are located in the province of Vlaams Brabant and 6 are in Brabant Wallon (Figure 2). The area included the Dijle catchment, located east of Brussels in the Belgian loess belt. The topography consists of a loess-covered undulating plateau with locally pronounced sandy outcrops ranging between 80 and 165 m above sea level, into which river valleys have been cut [44]. The alluvial valley system forms green corridors of natural grassland and woodland as part of a unique ecological network protected under NATURA2000 [45]. Within the study area, forests together with natural grasslands cover 21% of the area and have an intertwined ecological and recreational function.
The proximity of the Dijle catchment to Brussels has shaped the landscape with infrastructure networks and urban sprawl along the roads, forming a linear network that cuts through the rural open space. Residential areas, urbanisation, infrastructure and industry cover 35% of the study area. The undulating-to-hilly topography helps absorb the visual impact of urbanisation. Land use changes have resulted in a highly fragmented landscape with spatial, rural and environmental disconnects [46].
Agriculture accounts for 43% of the land use and is highly vulnerable to climate change and adverse weather conditions [47,48,49]. Grass covers almost a quarter of the agricultural land in the area. Agricultural land use in the Dijle catchment is influenced by environmental and ecological concerns. In addition to their regular farming activities, farmers are committed to maintaining the landscape, improving biodiversity and conserving natural resources by combating soil erosion and preserving water quality [39]. Arable land with winter cereal-based crop rotations is located on the loam plateau, while grassland occurs on the slopes or in the wetter valley bottoms and is used for milk and meat production. Vegetable growing is attractive on the edges of urban areas.

3. Results

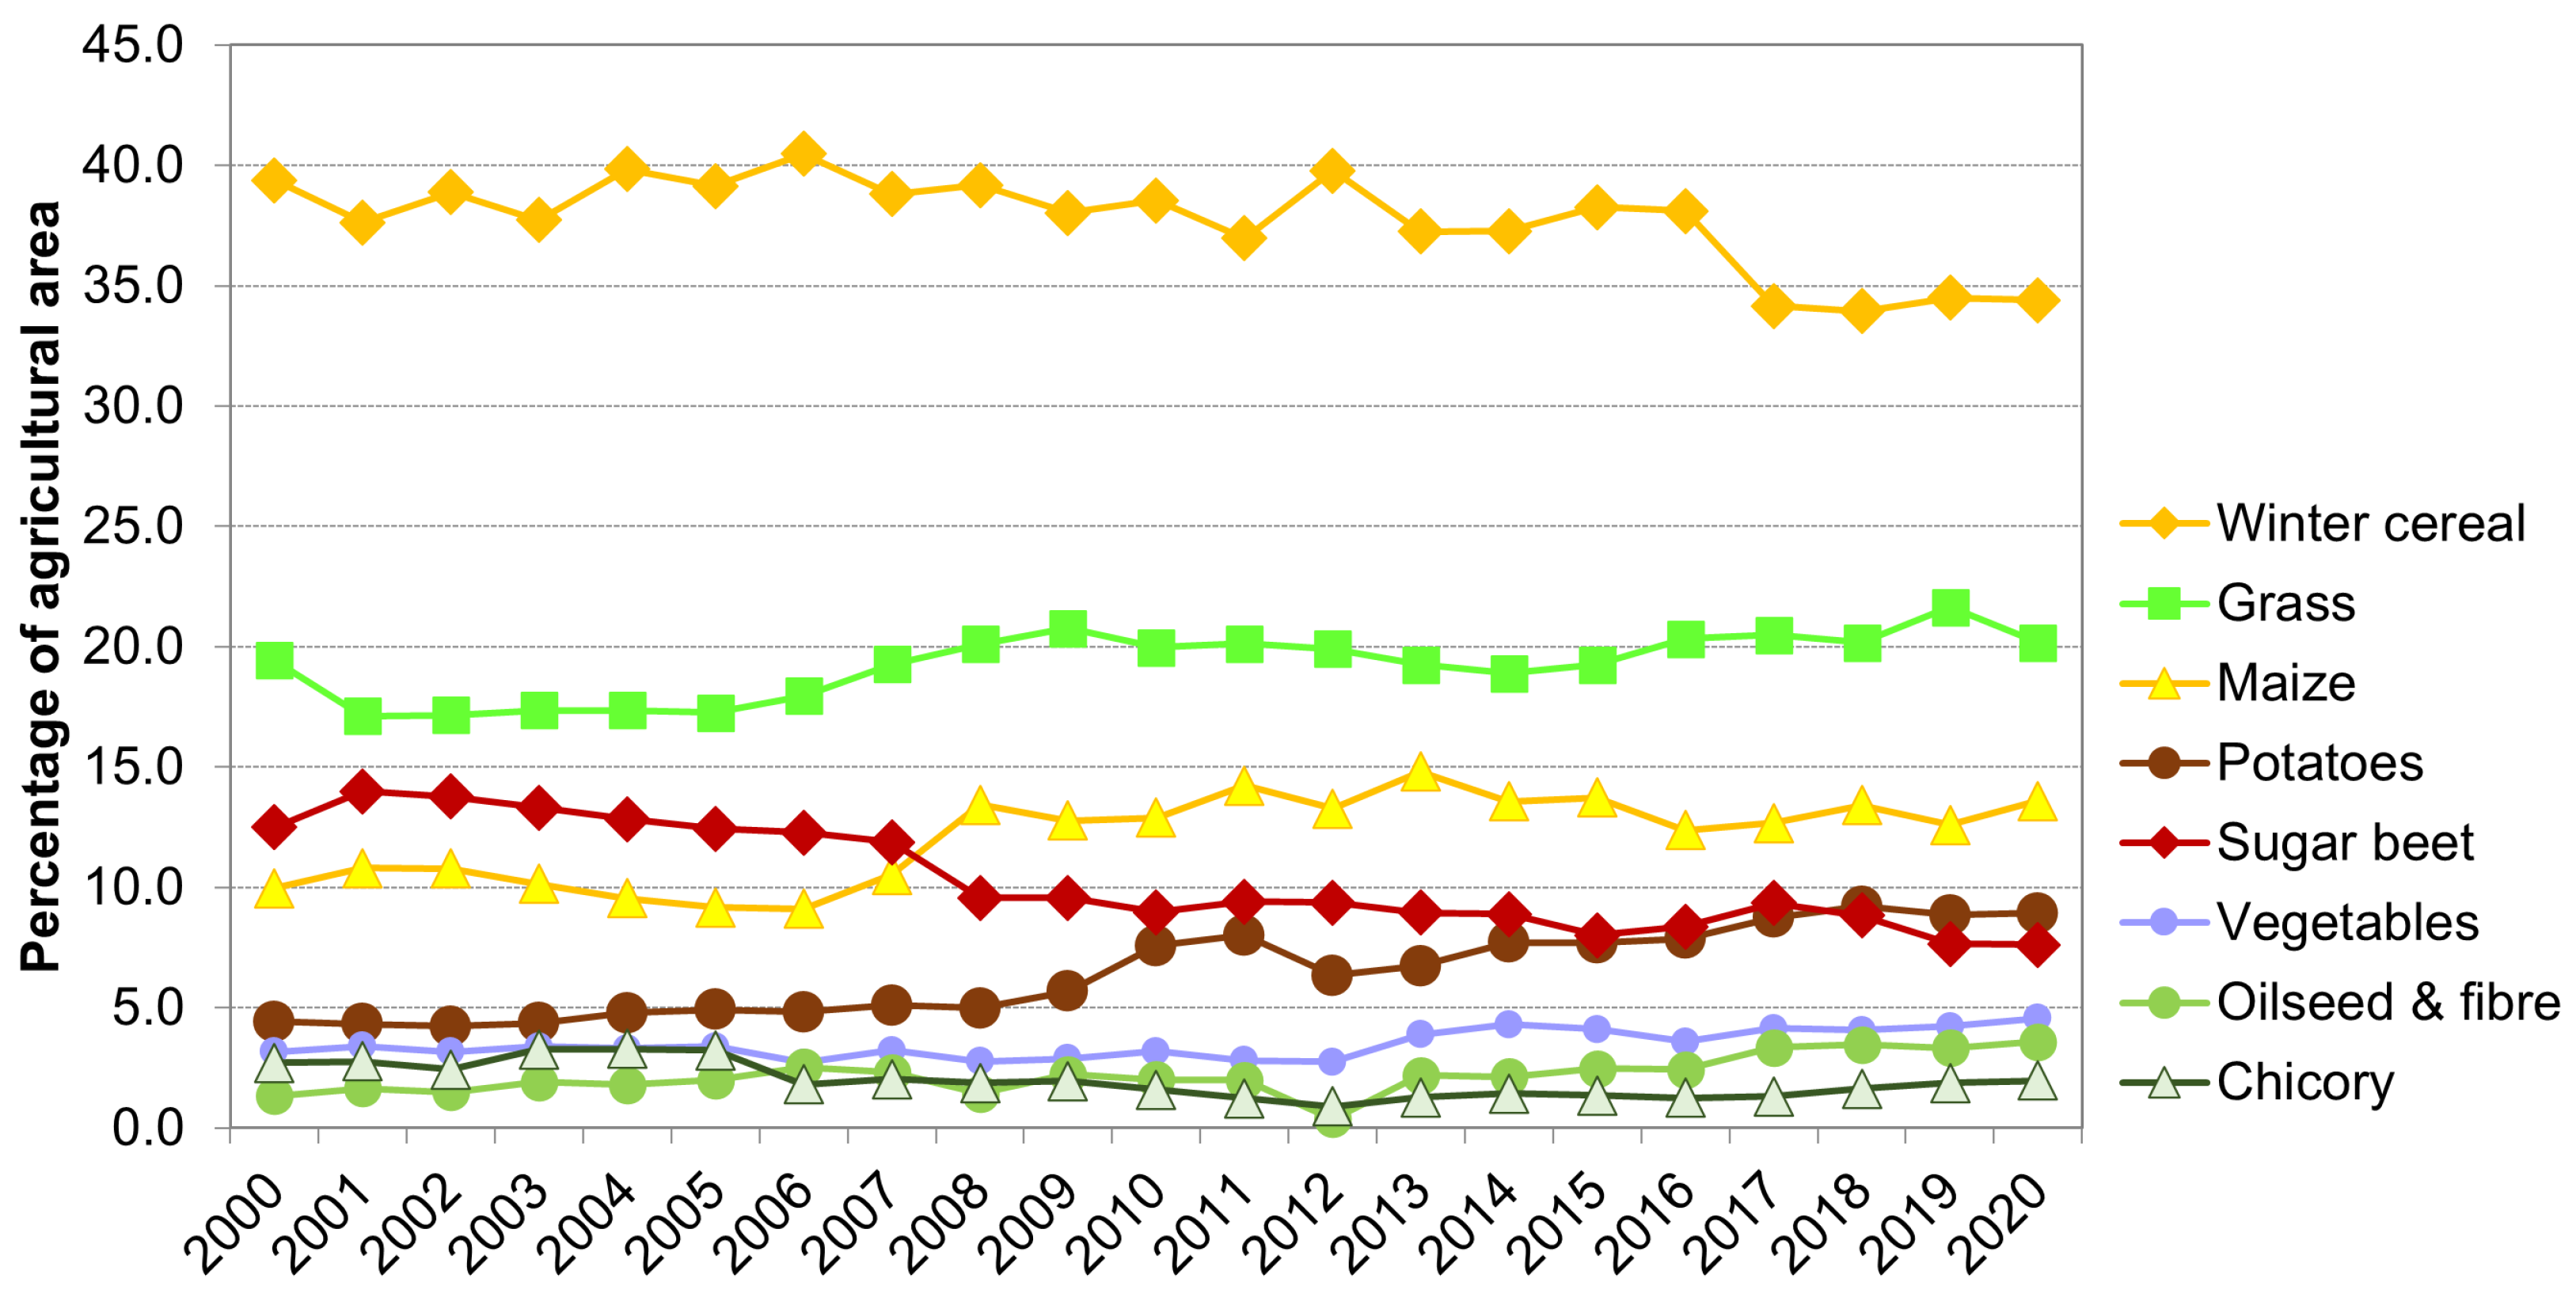
3.1. Agricultural Land Cover in the Dijle Catchment

An analysis of all the agricultural parcels in 2010 (Figure 2) showed that a quarter of the agricultural area in the Dijle catchment was covered with grass (24.8%), either as permanent pasture (14.6%), temporary pasture (3.4%) or mixtures of grasses and legumes (6.8%). The main arable crops were, in decreasing order of area, winter cereals (35.6%), maize (11.6%), sugar beet (9.8%), potatoes (4.1%), vegetables (2.5%), spring cereals (2.4%), chicory (1.5%) and oilseeds (1.3%).
A trend analysis was possible for all registered agricultural areas and crops (Figure 3). The evolution of the surface area of the main arable crops, expressed as a percentage of the total agricultural area, shows the dominance of winter cereals in the cropping systems. Since 2000, the area under grassland has increased by 11.4%, which could also be explained by farmers declaring their pastures in order to comply with the GAEC regulation on permanent pastures that went into effect in 2005. The area under maize has increased by 75% since 2005. Due to the abolition of the sugar quota in 2017, the area under sugar beet has decreased by 27%. The area under chicory has declined by almost 27% overall, and a sharp decrease from 2005 to 2012 was followed by a slow increase from 2012 to 2020. The decline in sugar beet and chicory was offset by a doubling of the area under potatoes and a gradual increase in vegetable cultivation. Although small in terms of total area, oilseed and fibre crops have more than doubled.

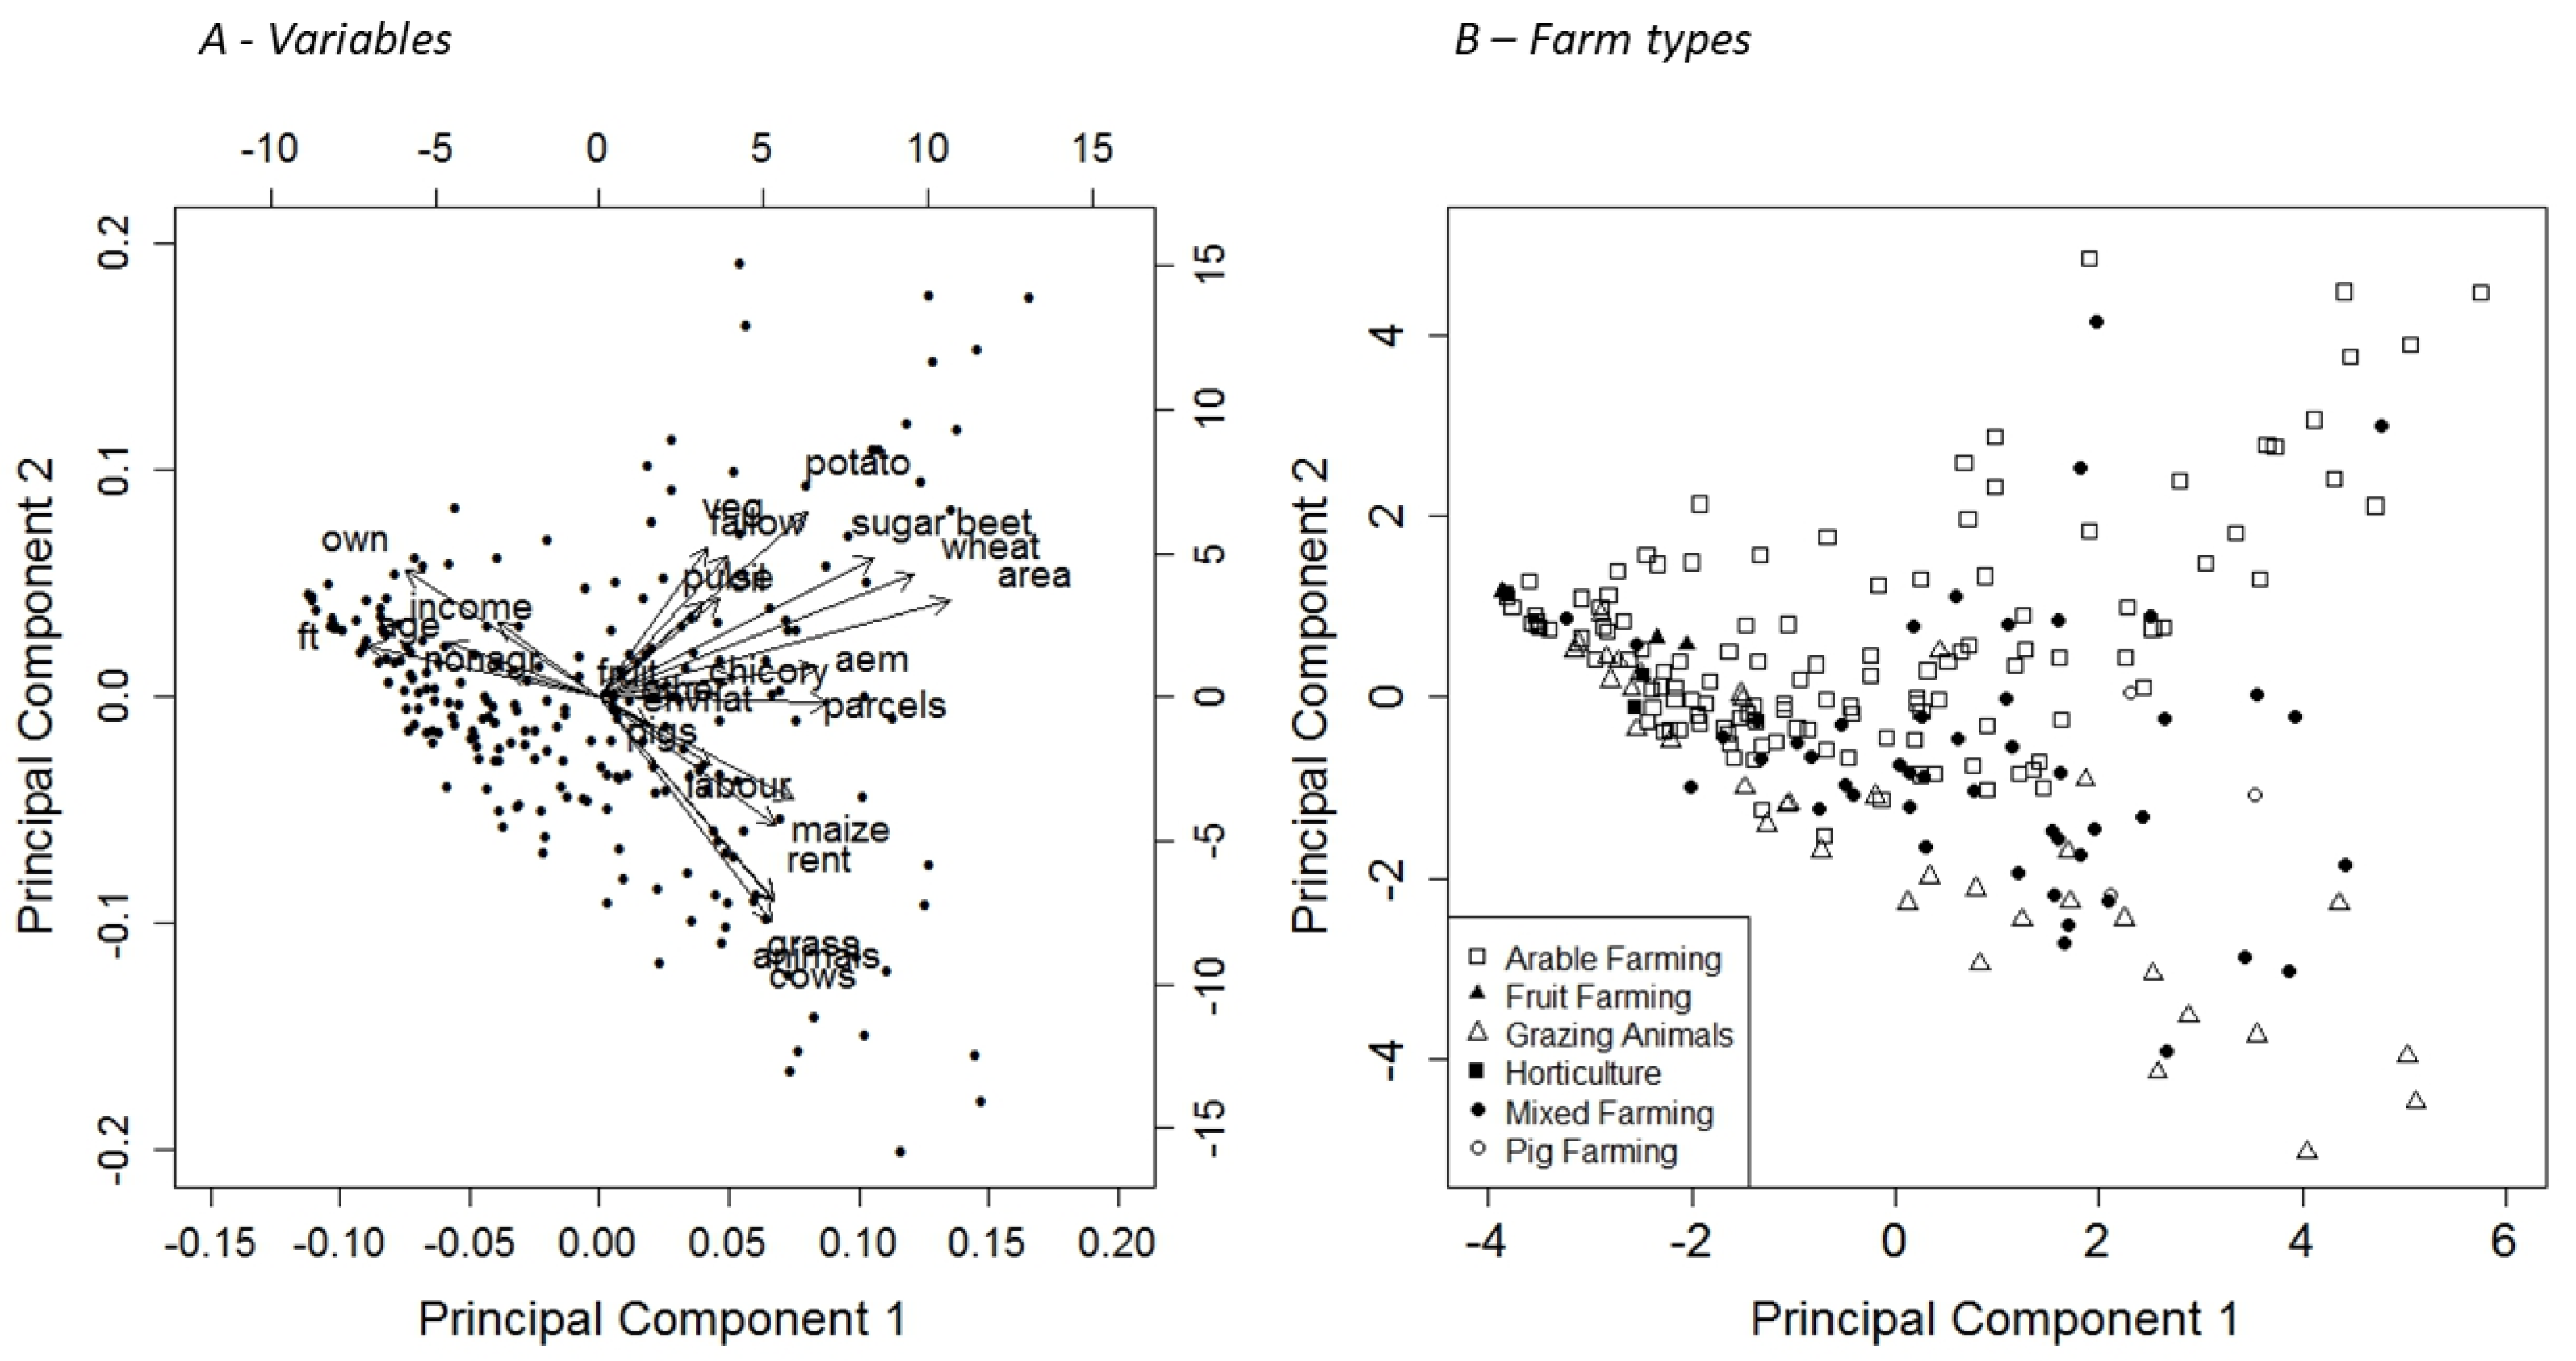
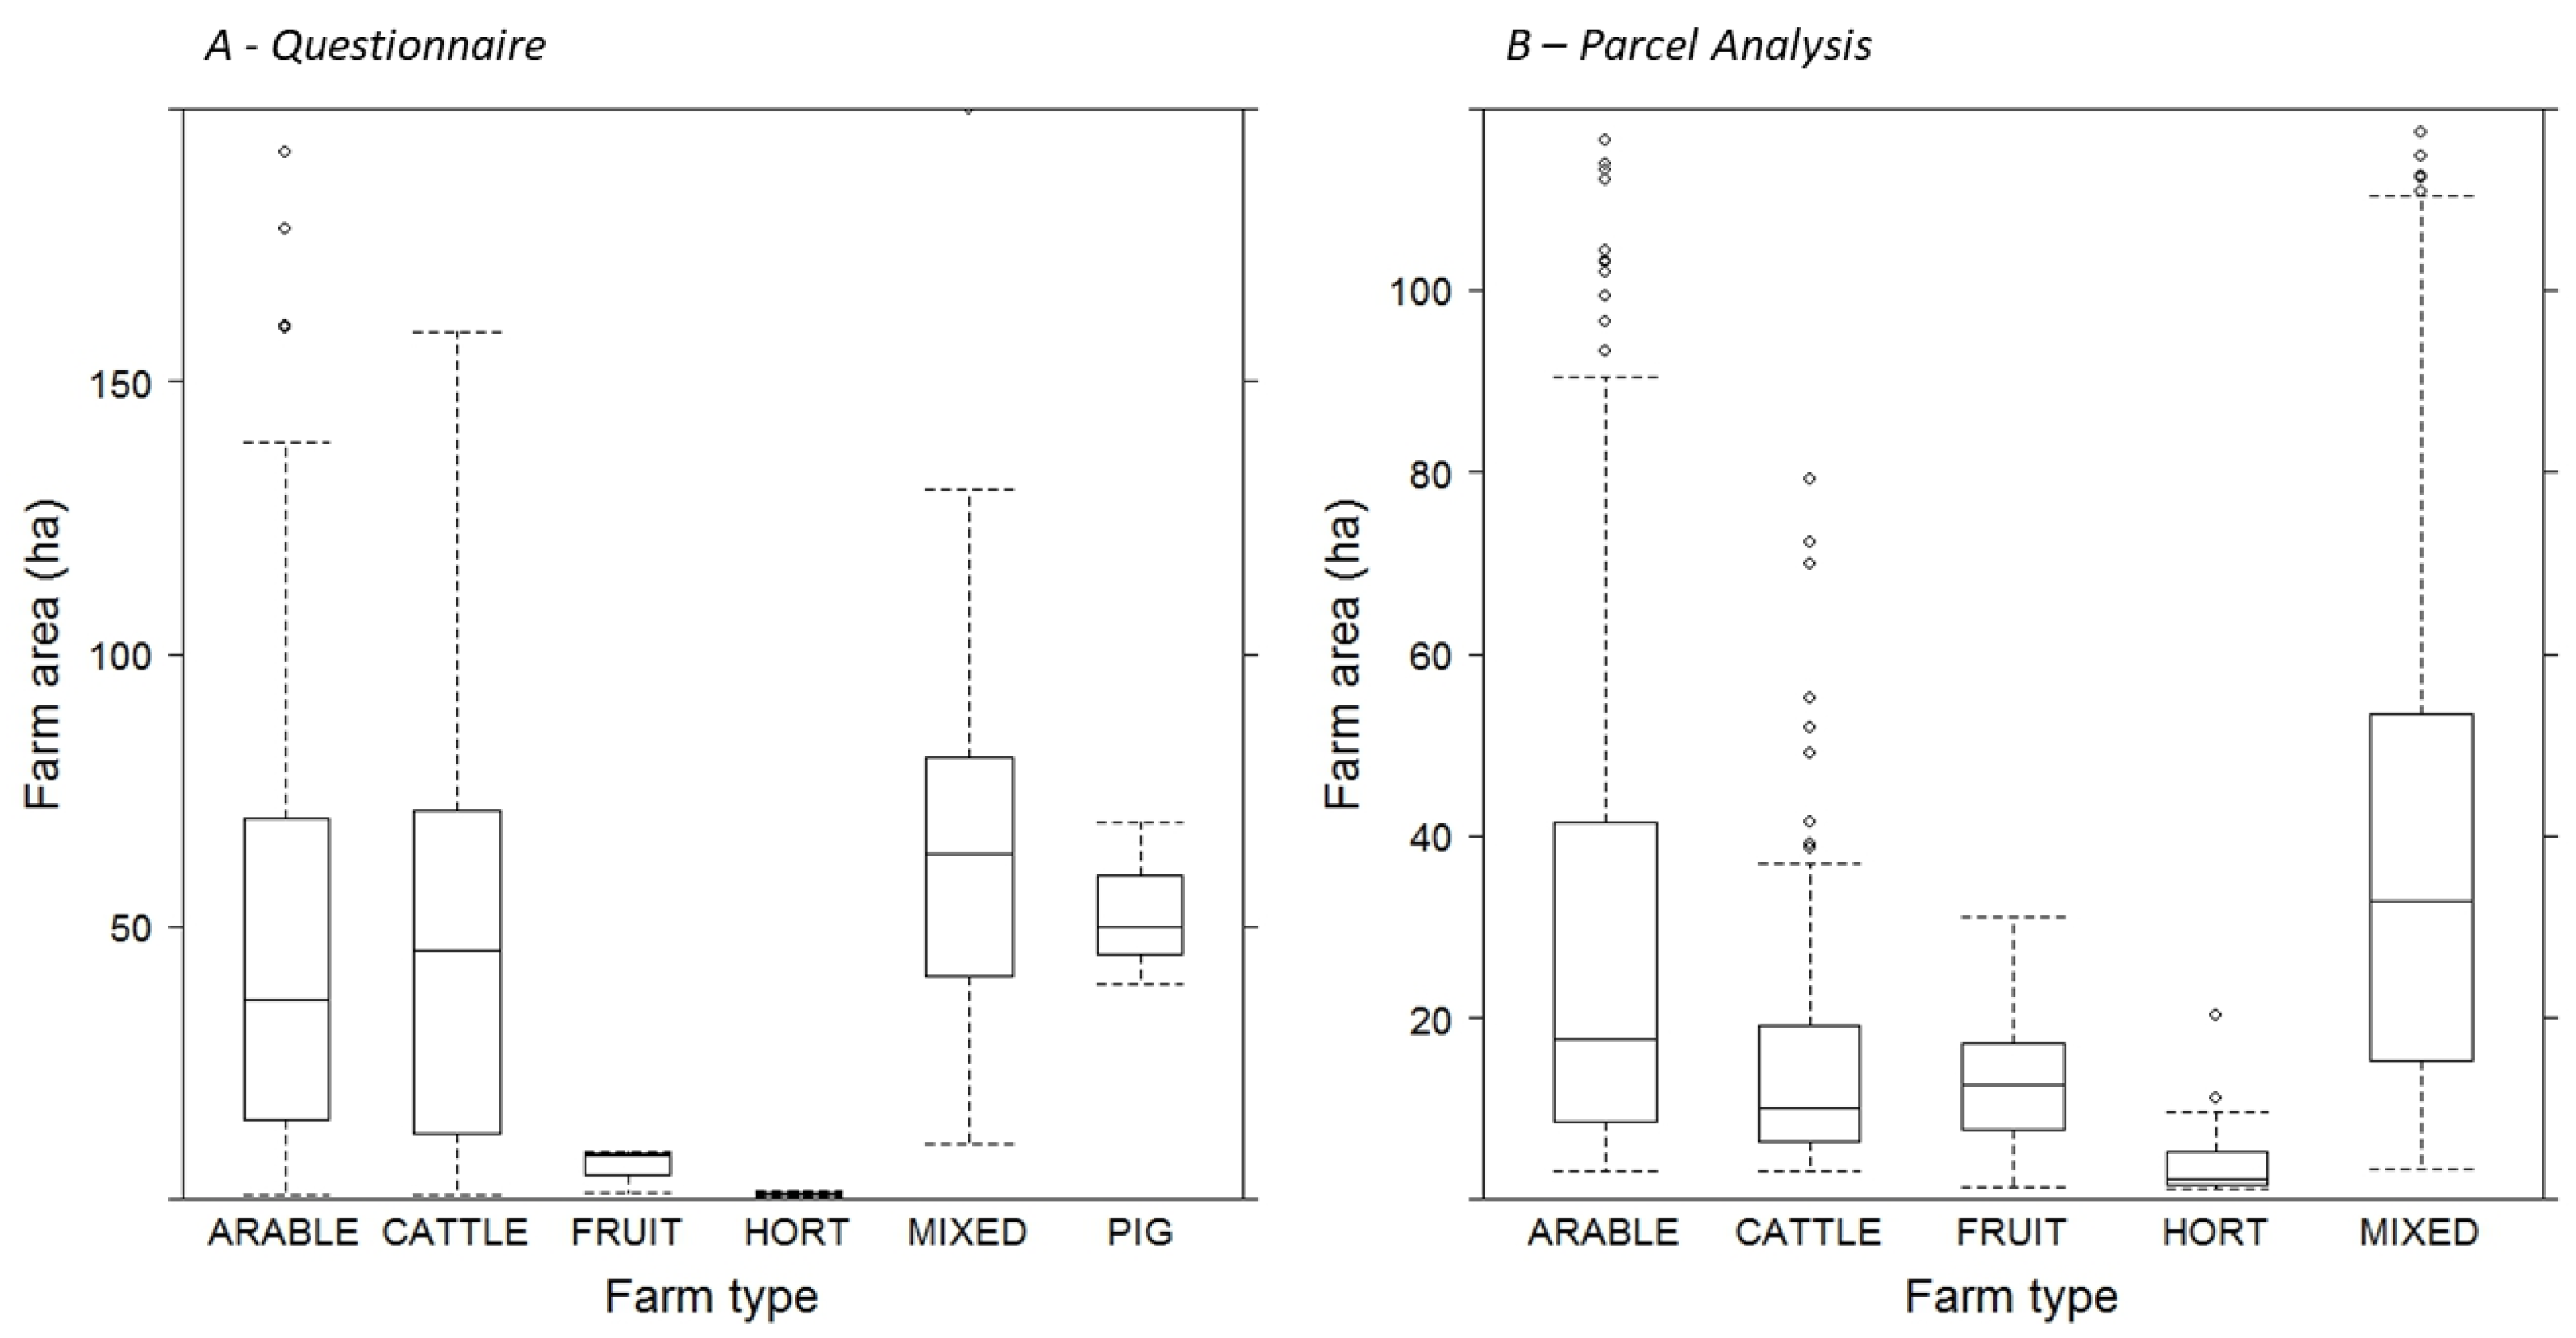
3.2. Farm Typology According to Economic Activities

Agriculture is characterised by diversity in farm size, soil type, climate, crops, livestock and number of livestock, mechanisation, the use of agrochemicals and general intensity of management. Farm size is usually expressed in terms of work units, such as area or livestock. Livestock holdings based on grass and forage crops vary in their intensity of management. Dairy production in the area has a dense stocking rate of more than 2 cows/ha. The more intensive farms have a greater need for nutrients but also produce larger amounts of manure. The most important types of farming that are relevant to the Dijle catchment are, in order of importance as shown by their representation in the questionnaire survey, arable farming, mixed cattle and arable farming, cattle farming, permanent crops (fruit), horticulture and pig farming (Table 2). A comparison between the questionnaire survey and the parcel registration data in the area showed that the distribution of farms in the questionnaire was similar to that derived from the parcel database. Pig farms had more than 800 animals, cattle farms had 132 animals, and mixed farms had 67 animals. The farm size expressed in terms of area (ha) was different for each of the different farm types (Figure 4). The differences in farm size between the survey and the parcel database can be explained by the inclusion of farmers with only part of their farms in the area and the greater representation of horticultural farms, which traditionally have a high number of parcels but a small farm size.
A farm typology according to economic activity showed little difference in farm size between the different farm types, with the exception of fruit and horticulture farms having significantly smaller farm sizes (Figure 4). Mixed farms had the largest farm size (Md = 63.5 ha, n = 48), followed by pig farms (Md = 50 ha, n = 3) and cattle farms (Md = 45.5 ha, n = 36). Arable farms (Md = 36.6 ha, n = 126) maintained moderately large farm sizes, although outliers occurred outside the interquartile range (Figure 4). The smallest farms were the horticultural farms (Md = 1.3 ha, n = 3) and fruit farms (Md = 8 ha, n = 3). The mixed farms managed a larger number of parcels (Md = 21) than arable farms (Md = 11) or cattle farms (Md = 12.5). The pig farmers managed the largest number of parcels (Md = 31) and animals (>800) and grew a wide variety of arable crops. A division according to production activity allowed for a difference in the crops grown. Grassland and maize were mainly maintained by cattle and mixed holdings, whereas root crops were mainly grown by arable and mixed holdings. In addition, the cattle and arable farms had a great deal of rented land, whereas fruit and horticultural activities were developed entirely on the farmers’ own land. The arable and mixed farms were most involved in agri-environment-climate measures. However, most of these differences between farm types were not significant. Therefore, additional variables were needed to classify the farms into clearly different groups with regard to land use and environmental decisions to target agri-environment-climate recommendations for farms.

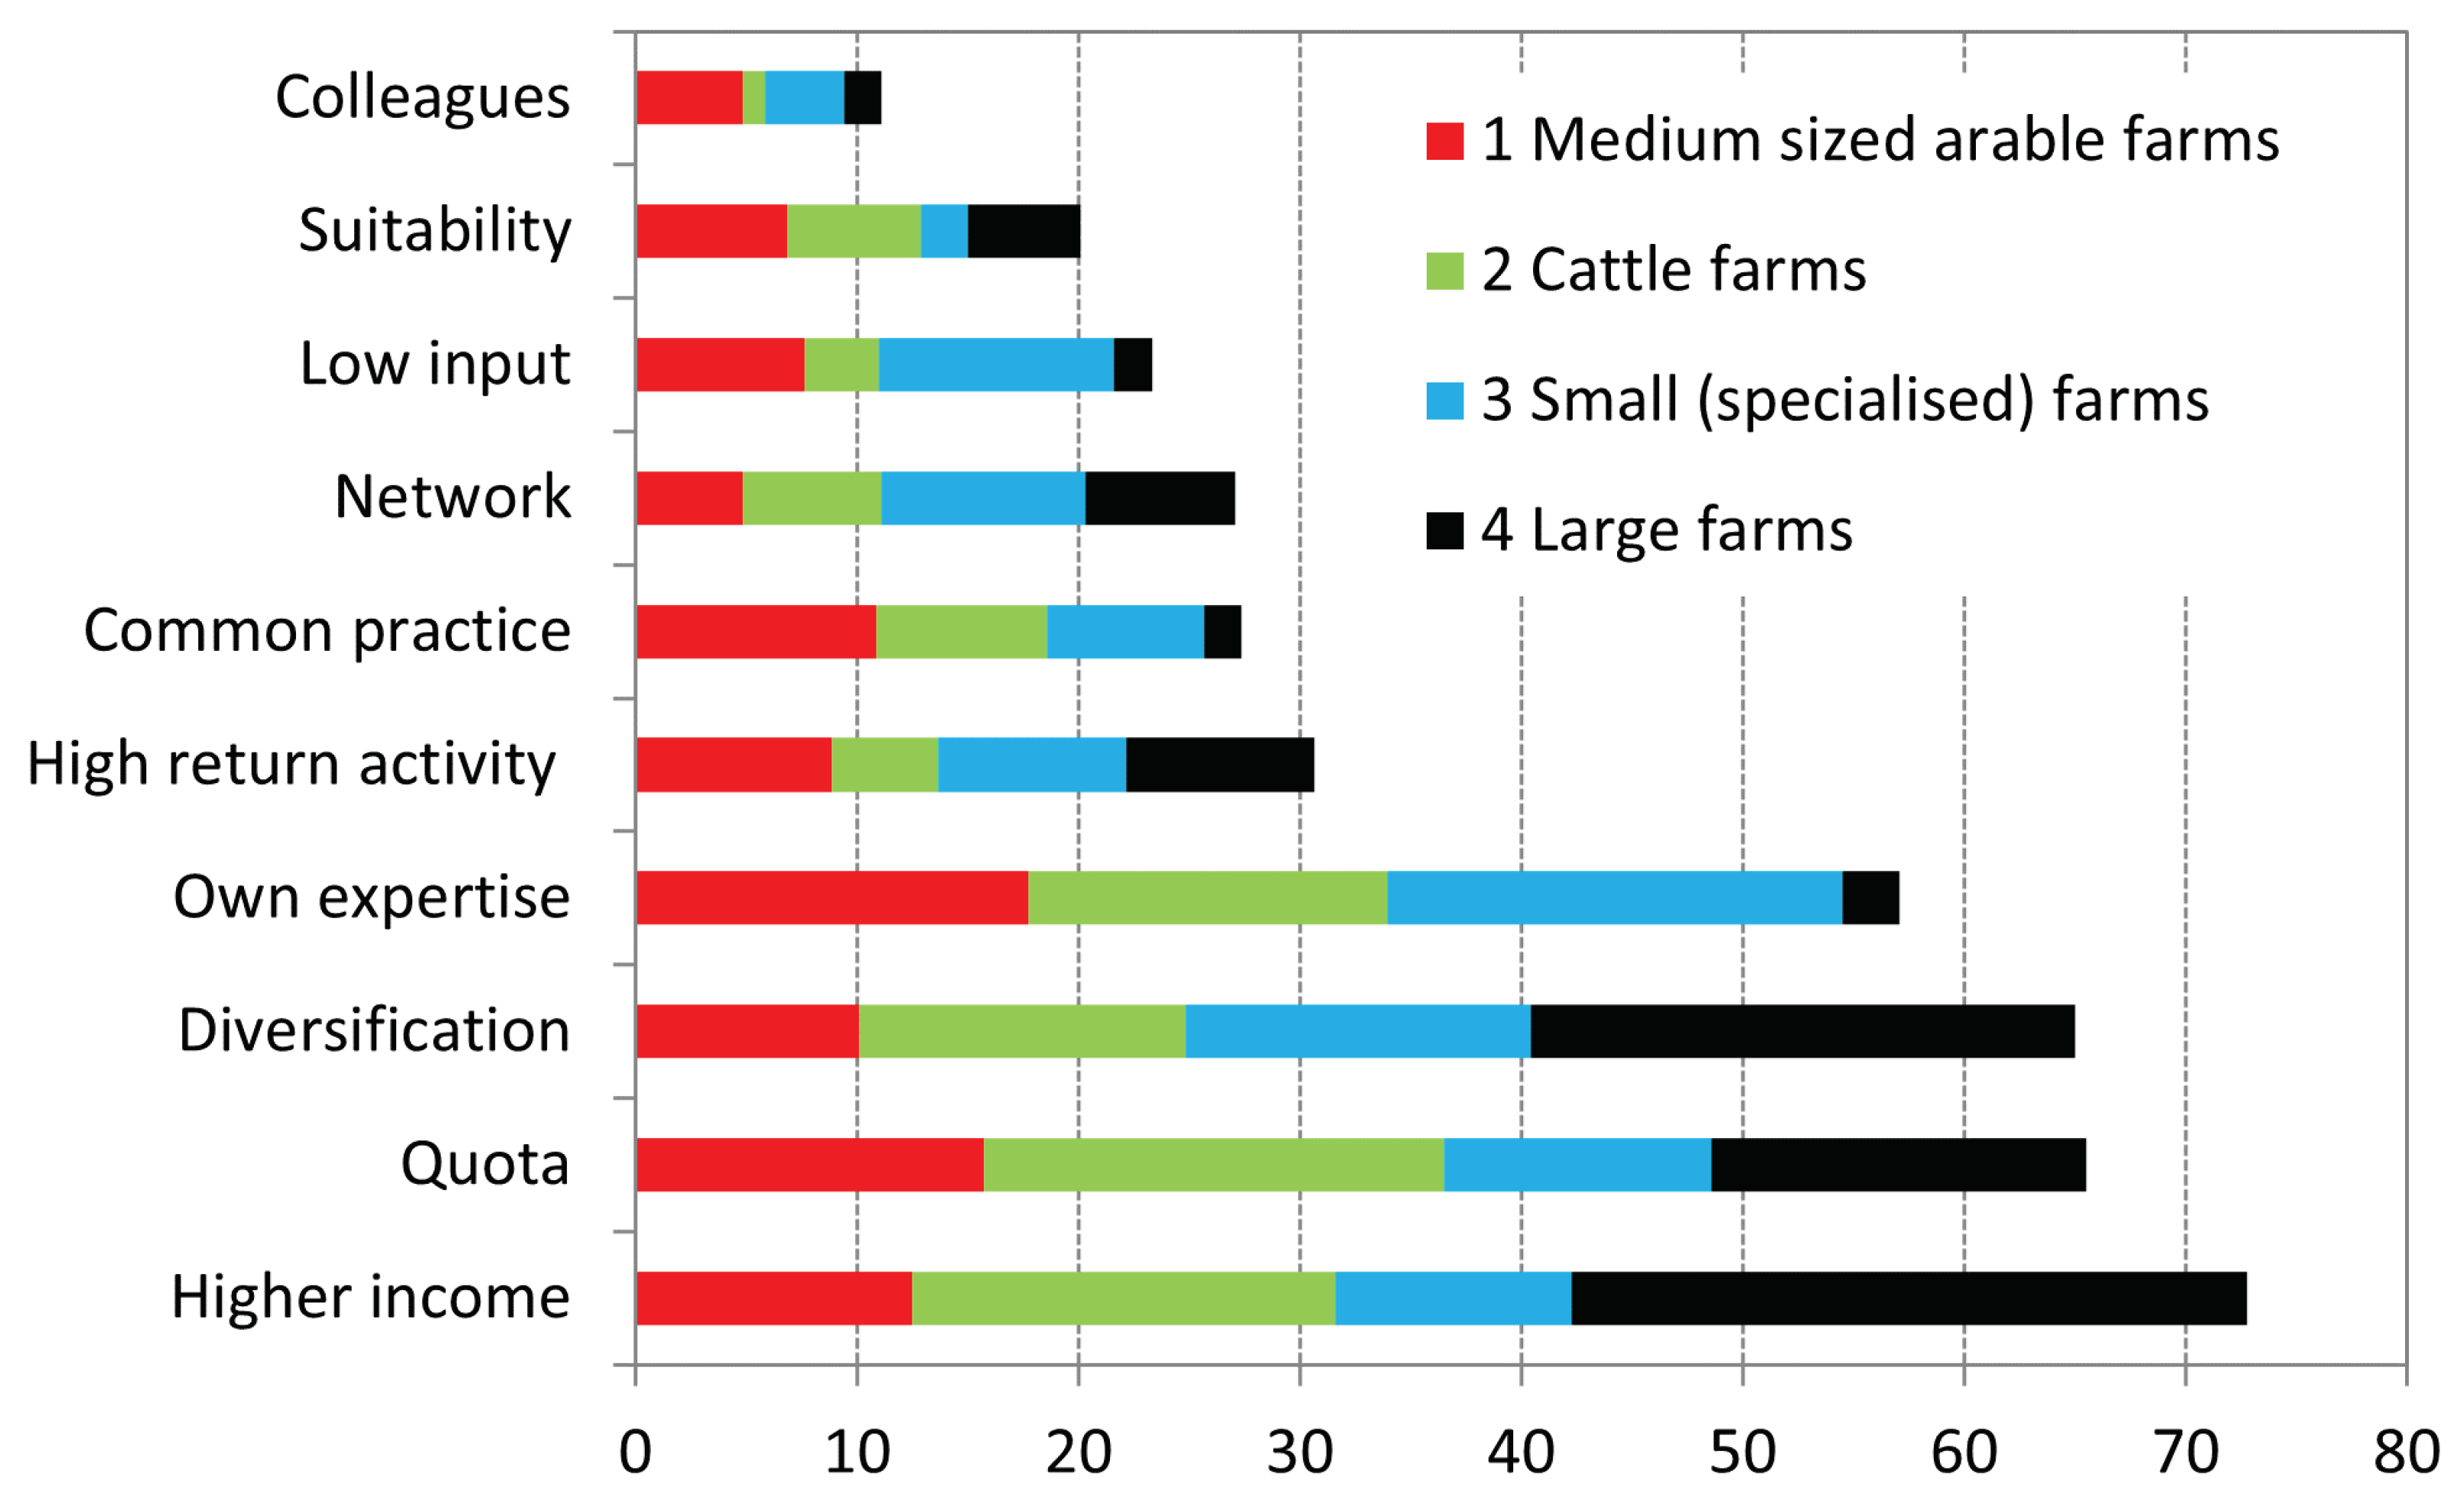
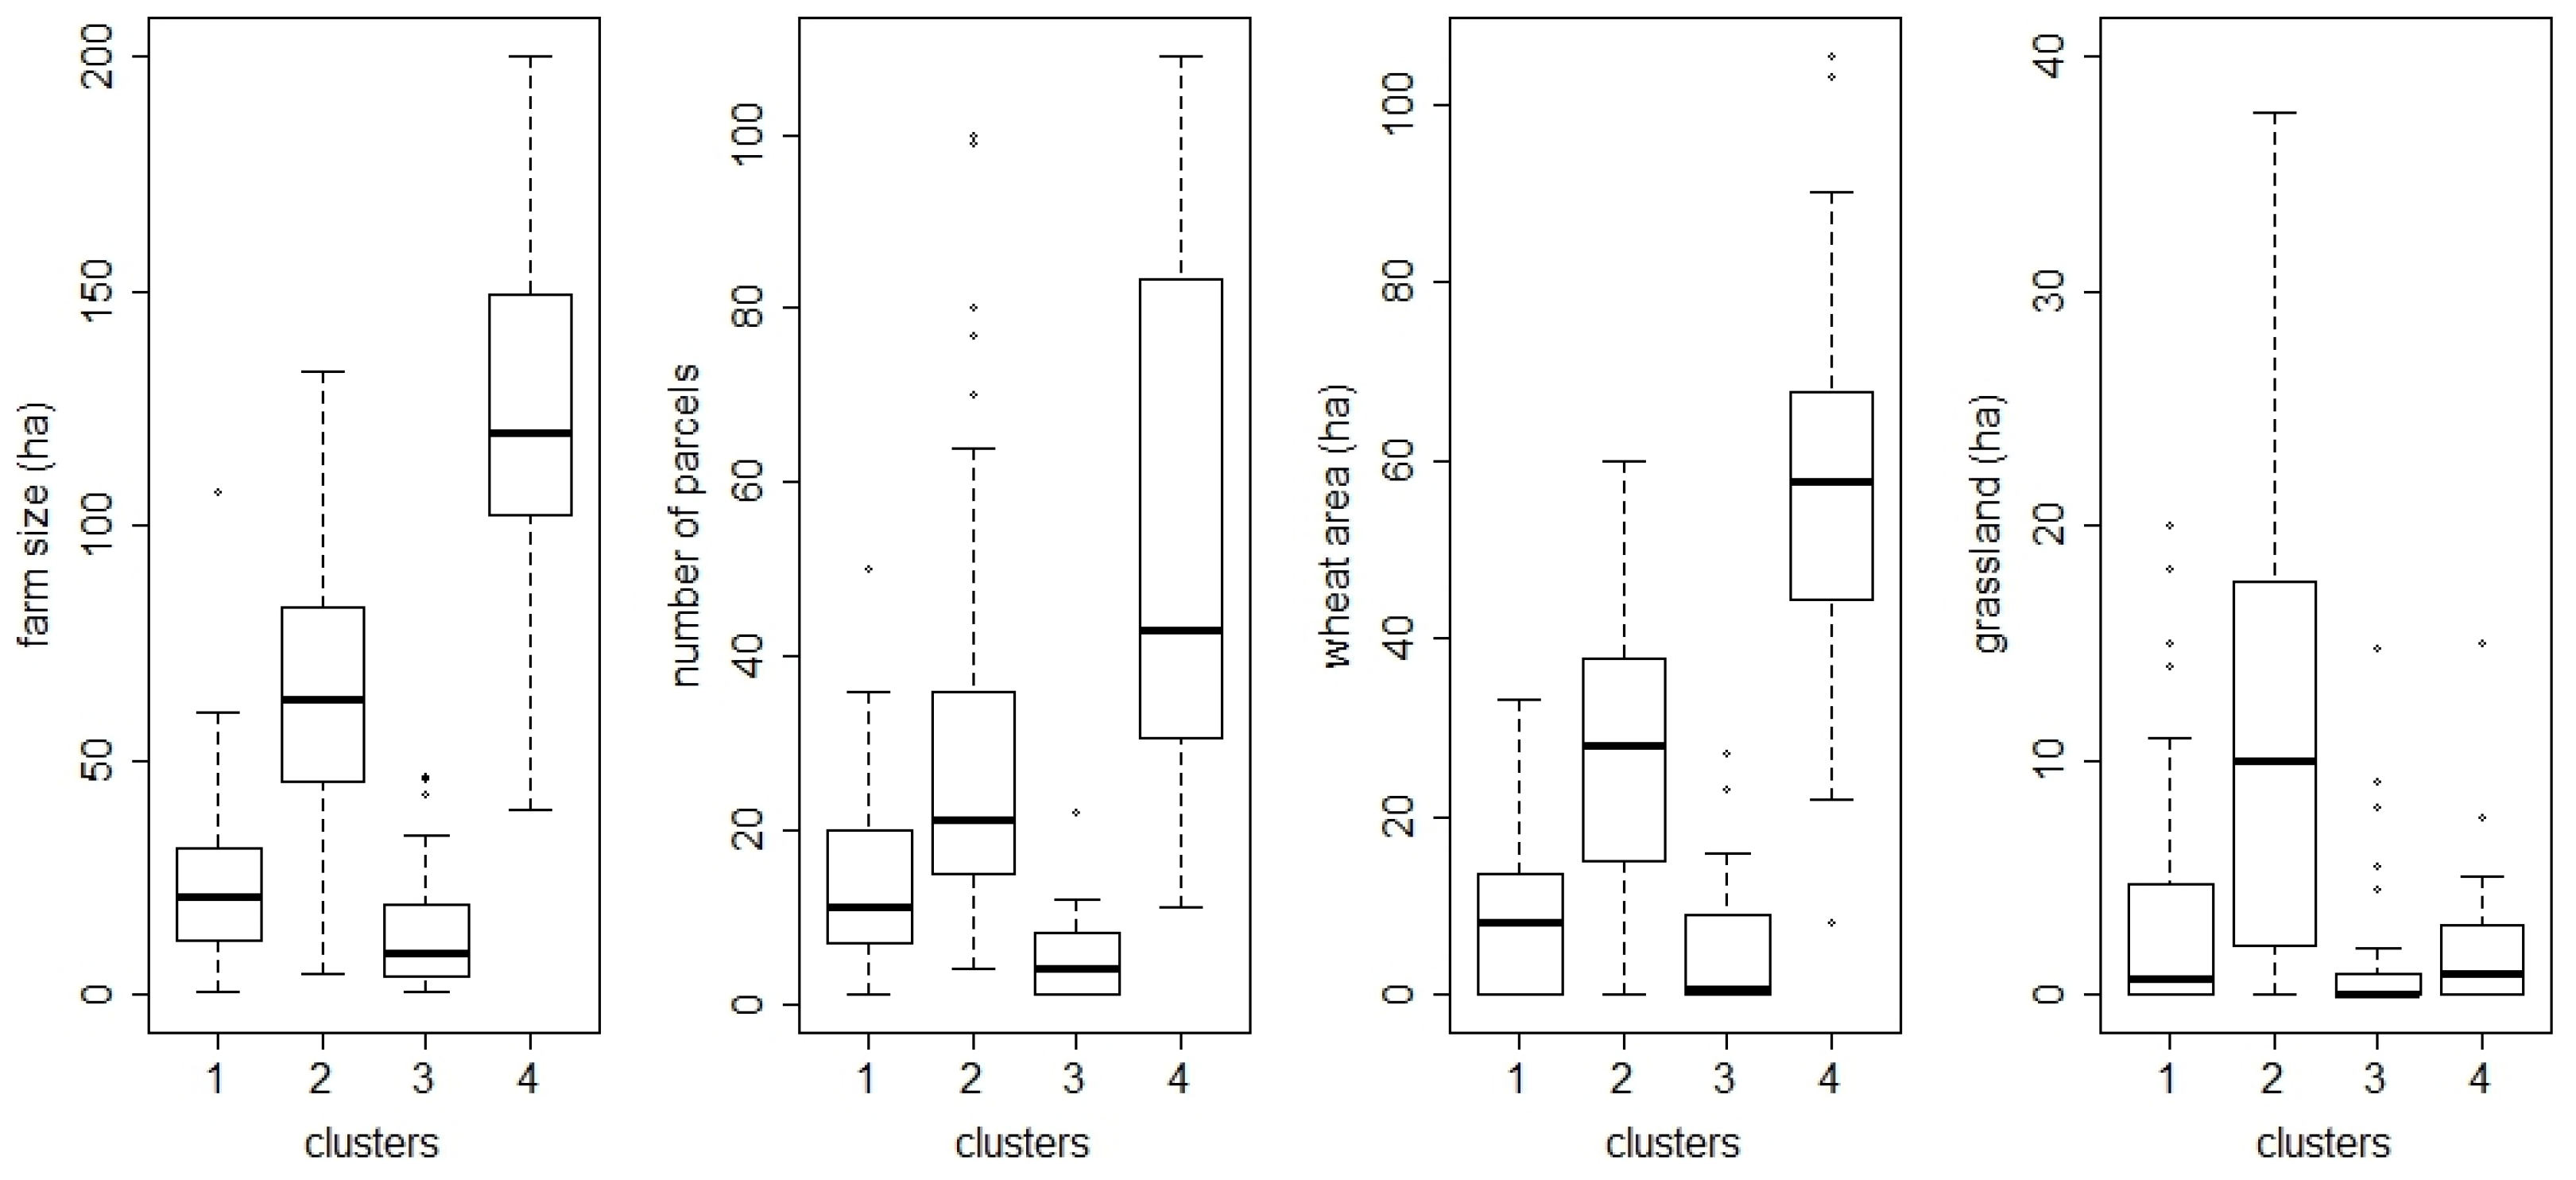
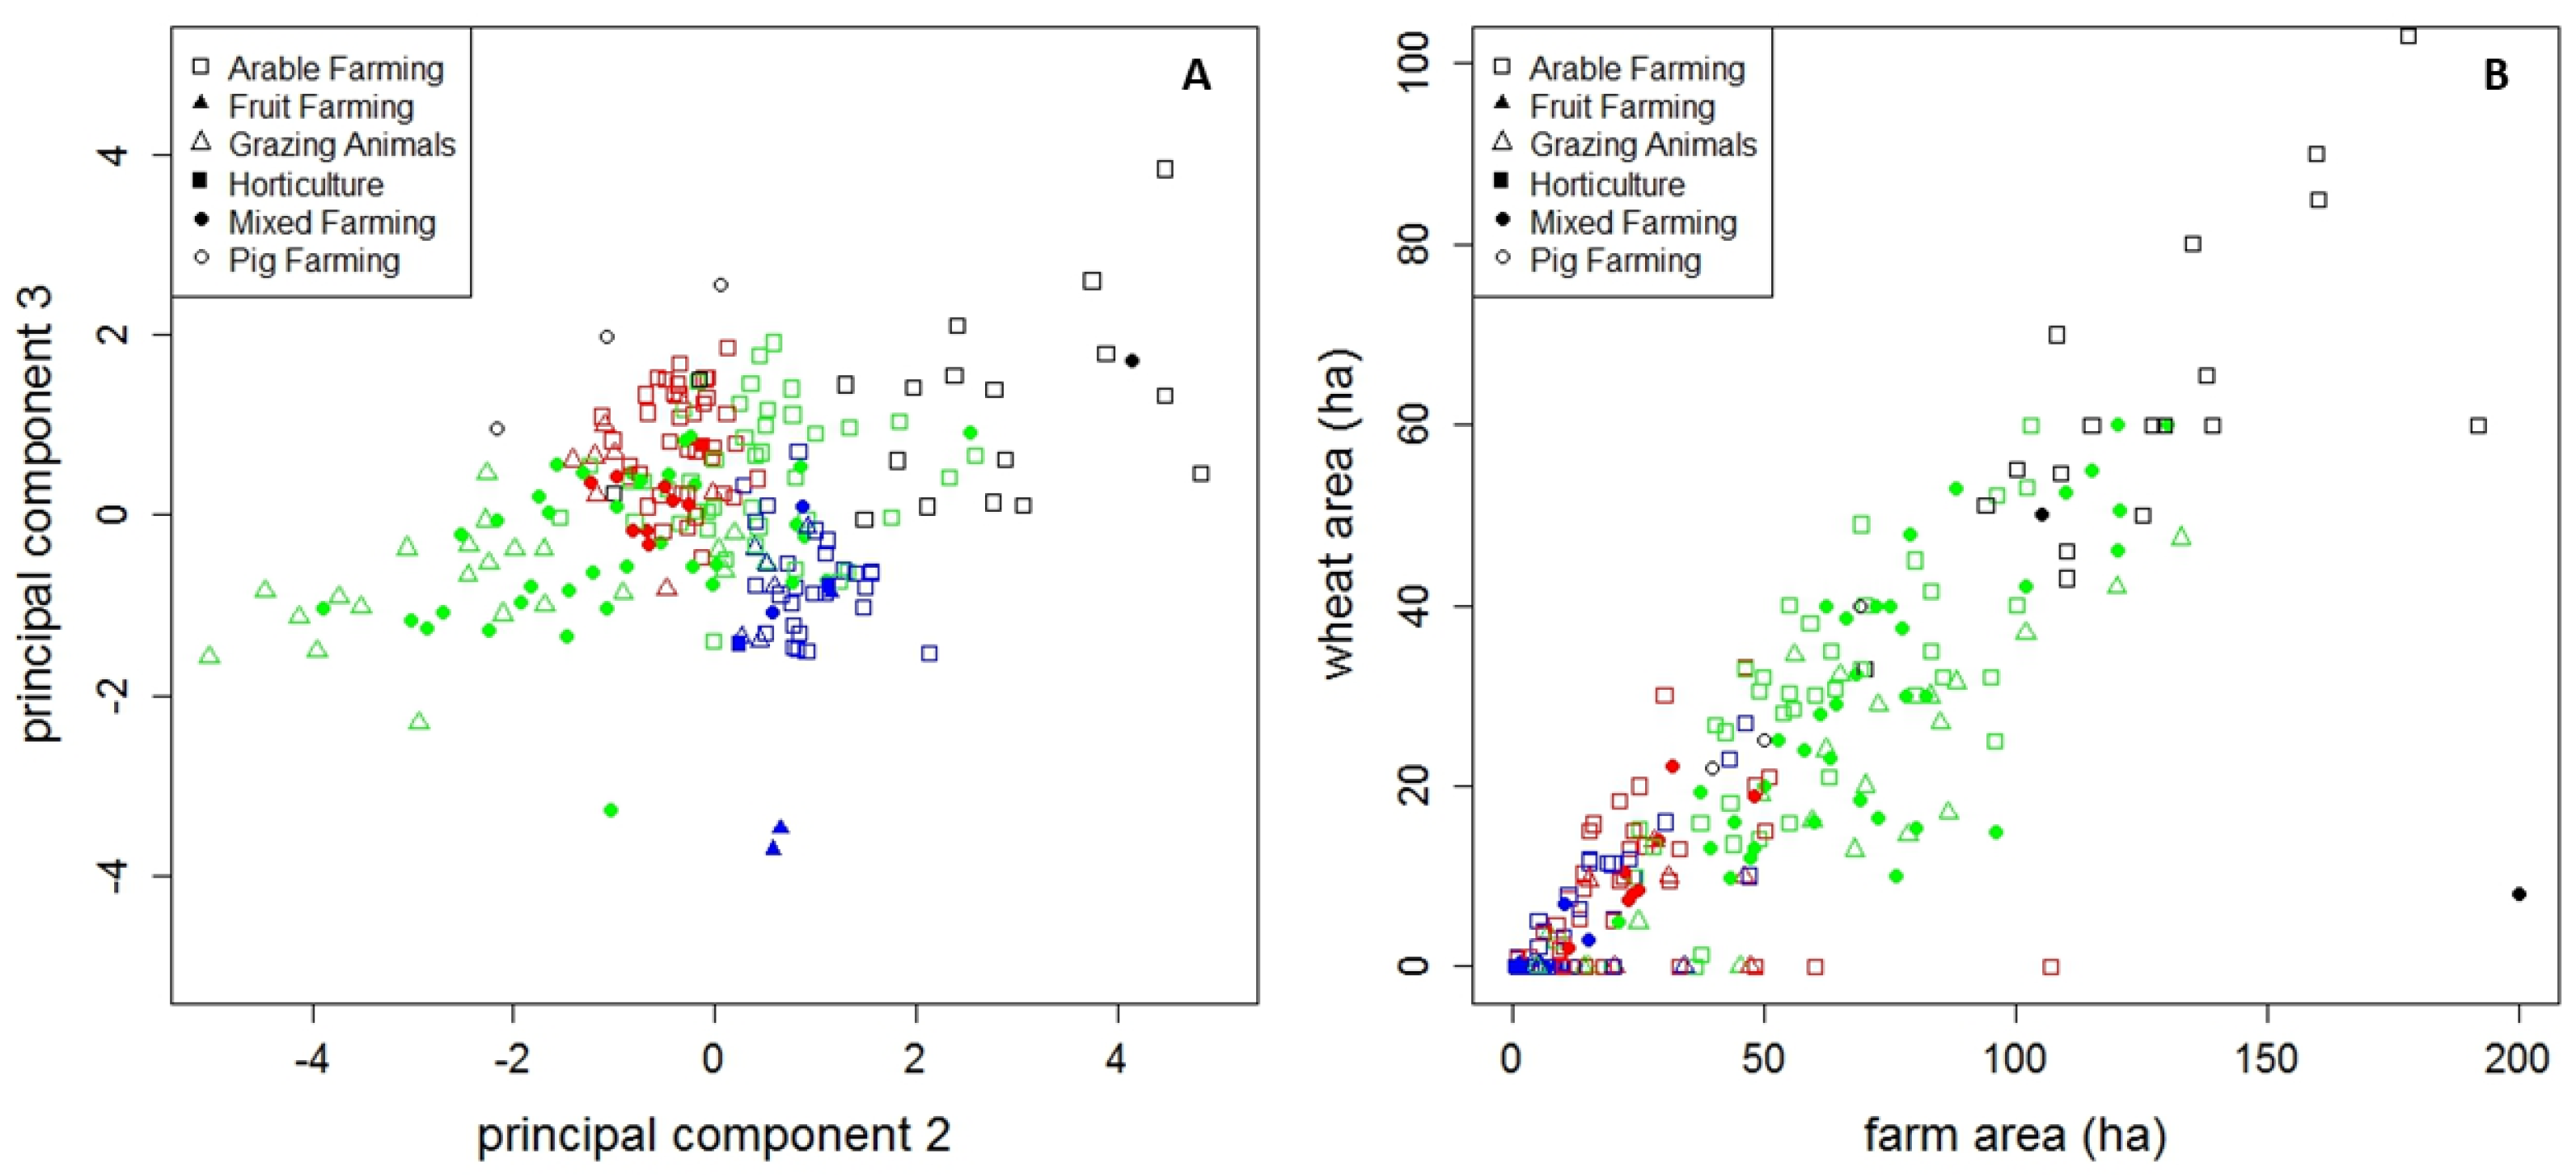
3.3. Cluster-Based Farm Typology

The variables from the questionnaire retained for the multivariate analysis were the farmer’s age, on-farm employment (in %), hired labour (n), off-farm activities (n), farm size (ha), parcels (n), animals (heads), land ownership (% own, % rented), parcels with agri-environment-climate measures (n), parcels in environmental or nature schemes (n), pigs (head), cattle (head) and areas (ha) of wheat, sugar beet, potatoes, chicory, pulses, vegetables, oilseeds, maize, grassland, fruit and fallow land. Multicollinearity in the dataset was removed by using principal components extracted from the correlation matrix of the 26 standardised farm characteristics. The first principal components (PCs) explained 77% of the variation in the dataset. The highest loadings for PC1 were from the variables of the farm area followed by wheat and sugar beet area. For PC2, the highest loadings were from livestock, cattle and grassland area, while for PC3, negative loadings were mainly from land ownership and fruit and vegetable areas. PC4 had high loadings from land ownership and generated off-farm income. Together, these first four PCs explained more than half of the variation in the data set. The interrelationships between the farm characteristics showed the differentiation patterns between the different variables, as shown for the projection of the variables on the plane of the first two principal components (Figure 5A). The lower right quadrant showed a grouping of variables related to cattle rearing (Figure 5A), which was reflected in the projection of the different farm types in the principal component plane (Figure 5B). These variables were the number of animals, grassland, maize area, number of rented parcels and farm labour. The upper right quadrant grouped characteristics that were related to arable farming (Figure 5A) with all major arable crops in the Dijle catchment (i.e., wheat, sugar beet, potatoes, pulses, chicory and fallow). Pig farming and mixed farming (Figure 5B) had characteristics of both variable groups. A third grouping of farm characteristics was related to socioeconomic characteristics such as the age of the farmer, income from and type of farm-related economic activities, percentage of employment on the farm and land ownership. Fruit and horticulture were included in this quadrant.
Successive iterations showed a fairly steep exponential decay of the within-cluster sum of squares towards 4–5 clusters. The Bayesian information criterion value of various Gaussian finite-mixture models fitted by the expectation maximisation algorithm confirmed the use of four clusters. The best model fit was obtained with an ellipsoid distribution and a variable shape, volume and orientation. The four resulting clusters had an unequal membership of 55, 100, 40 and 24 farms. The impact of each cluster on land cover and use was distinctly different as the farm size, number of parcels, grassland and cropped area differed between the clusters (Figure 6). The first cluster was mainly characterised by small- to medium-sized arable farms (Md = 21 ha, n = 55) with around 11 parcels and a fairly small number of cattle or grazing animals. The second cluster was dominated by cattle farms (Md = 27 head, n = 100), which managed around 21 parcels or 63 ha of arable land, of which almost a third was cultivated with maize and grass (Figure 6). The third cluster consisted of small farms in terms of farm area (Md = 9 ha, n = 40) with no livestock and with only a small number of parcels (Md = 4). Cluster 3 included fruit and horticulture farms. The fourth cluster grouped large farms with the highest number of parcels (Md = 43, n = 24), the largest average farm size (Md = 120 ha) and the largest area under arable crops such as wheat (Md = 58 ha) and sugar beet (Md = 18 ha). Cluster 4 also included pig farms with more than 800 animals.
The clusters projected on the plane of the second and third principal components (Figure 7A) showed a clear distinction between medium-sized arable farms (red), small farms (blue) and large farms (black). This could be explained by the loadings of the main farm characteristics on the principal components (i.e., ownership (negative on the y axis) and cattle (positive on the x axis)). A projection of the farm area and wheat area clearly showed the share of wheat in the total cultivated area in a gradient from small- (blue) to medium- (red) and large-scale (black) farms (Figure 7B). The main group in the Dijle catchment contained a mixture of cattle farms and arable farms (green dots in Figure 7). Some of the arable farms in the area also had a small number of grazing animals other than cattle, such as horses, sheep or goats, which explained the presence of grassland parcels on their farms (Table 2).

3.4. Crop Rotations

Among the respondents, 76% reported a main arable crop rotation. A second common arable crop rotation was reported by 47% of farmers, and 34% of farmers reported a third rotation. In total, 343 rotations were reported, of which 92% included wheat in a 5 year rotation, 55% included sugar beet, 46% included barley, 38% included maize, 27% included potatoes and 15% included chicory. The minor crops in the reported rotations were flax, pulses, oilseeds and oats. Vegetables, grass and spelt only occurred in less than 3% of the reported rotations. Of all the responses, 5 year rotations were the most common (40%), followed by 3 year rotations (39%), 4 year rotations (19%) and 2 year rotations (4%). The most common rotations reported by farmers in the Dijle catchment area were the 3 year rotations of “sugar beet–winter wheat–winter barley” and “winter wheat–winter barley–maize”. This was followed by the 5 year crop rotation of “sugar beet–winter wheat–winter barley–chicory–winter wheat”, where chicory is often replaced by peas, maize, potatoes, oilseeds or flax. The sequences “winter wheat–sugar beet–winter wheat–potatoes” and “sugar beet–winter wheat–winter barley–maize” were the most frequently reported 4 year rotations. The 2 year rotations “sugar beet–winter wheat” and “winter wheat–maize” were less frequent among the rotations reported. Vegetables were reported in only 4% of the rotations, often in combination with potatoes or maize. The type of crop rotation differed between farm clusters. Among all respondents that reported crop rotations (76%), 37% had winter wheat in rotation. This was followed by sugar beet (16%), barley (13%), maize (13%) and potatoes (7%). Cluster 1’s farmers (78% response, n = 55) had rotations with more barley, maize and temporary grass than other farmers. Cluster 2’s farmers (82% response, n = 100) had relatively more maize and chicory occurring in their rotations. Cluster 3’s farmers (53%, n = 40) had the lowest response rate and reported more vegetables than other farmers, often including potatoes. Cluster 4’s respondents (100% response rate) reported more sugar beet, potatoes, flax and peas than other clusters. The arable, cattle and mixed farm types could be compared with the crop rotation analysis for the four clusters; the fruit, horticulture and pig farm types had too few responses to be meaningful. The arable farmers reported wheat the most (39%), followed by the mixed farms (38%) and cattle farms (33%). The arable farmers also included more flax and peas in their rotations. The mixed farms had relatively more sugar beet, potatoes and barley, while the cattle farms reported more maize and chicory. Grass in rotation was equally distributed between the three farm types. Despite an expected strong division in land cover between farm types, the differences in crop rotations between the four farm clusters were more pronounced, strongly suggesting that land cover decisions were made according to the most economically important farm activity. The crop rotations reported in the questionnaire were compared with the results of a parcel analysis for the period of 2000–2020. The presence of a crop in the rotation was expressed as a percentage of the total cultivated parcels or as an area equivalent (Table 3). Most rotations included winter cereals (83%) followed by maize (60%), sugar beet (50%) and potatoes (44%). The order of importance corresponded to the crop rotations reported in the questionnaire. Compared with the reported rotations, arable crops were more common in the parcel database. Grasses, spring cereals and vegetables accounted for between 20% and 35% of the area in rotation. Chicory, oilseeds, fodder and flax were minor crops (less than 10%) in rotation, and the reported rotations often included chicory. The presence of monoculture, with a dominance of more than 75%, occurred in 2.6% of the area for winter cereal and 2.3% of the area for maize, which were not reported by the farmers as they were only asked about rotations. Close to urban areas, the vegetable crops included endive, cauliflower and sprouts.
A shift in crop rotations was observed towards an increased occurrence of maize, potatoes, vegetables, pulses and oilseeds in the crop sequences at the expense of grass, cereals, fodder and sugar beet. Winter cereals were by far the most common crop and the first choice after any other crop in the rotation, as reflected by the high transition probabilities (Table 4). Maize was the next most common crop in the rotation, followed by sugar beet or potatoes and spring cereals. Based on a sequence analysis of the parcel database, the most common crop rotations were monoculture grass (19%), monoculture maize (2%), the 2 year rotation “winter wheat–silage maize” (10%), the 4 year rotation “winter wheat–grain maize–winter barley–sugar beet” (5%), the 3 year rotation “winter wheat–winter barley–sugar beet” (4%), the 4 year rotation “winter wheat–sugar beet–winter wheat–potatoes” (3%) and the 5 year rotation “sugar beet–winter wheat–winter barley–chicory–grain maize” (1%). As maize was increasingly introduced into traditional crop rotations, there was a trend towards shorter rotations. Sugar beet was often replaced by other root and tuber crops such as chicory, potatoes or carrots. Other common crop rotations in the region were the more industrial processing-oriented “winter wheat–potatoes–dry beans or peas–sprouts–flax" and the fresh vegetable rotation “potatoes–cauliflower (two crops)–leek–beans–celeriac”. Overall, the high diversity in crop sequences resulted in low percentages of occurrence.

3.5. Land Use Decisions

Family tradition was the main motivation for the current land use of the first three farm clusters (Figure 8). For large farms (cluster 4), a high return was the main motivation for current land use decisions, followed by family tradition, a stable price and low investment. A high return followed by low labour input were the second and third most important motivations for both the cattle farms (cluster 2) and the small (specialised) farms (cluster 3). Low labour input, the availability of subsidies and low investment were the next most important motivations for the medium-sized arable farms (cluster 1). Nature conservation played a minor role in the motivation for engaging in current land use decisions. Agri-environment considerations were more important for medium-sized arable farms and large farms than for cattle farms and small farms.
The main motivations for engaging in new land use were weighted according to their ranks (Figure 9). Overall, higher income, quota use and diversification scored highest for all farmers, although the order of importance differed between the clusters. For medium-sized arable farms and small (specialised) farms, one’s own know-how was the most important motivation for deciding on a new land use, followed by quota use for medium-sized arable farms and diversification for small (specialised) farms. A higher income was ranked only third for the medium arable farms and fifth for the small (specialised) farms. For large farms, a higher income and diversification played an important role in the choice of new land use. Low input was the least important factor for large farms but the fourth most important for small farms. For the cattle farms, a higher income was the most important motivation, closely followed by the use of quotas, which were abolished in 2015 for dairy and in 2017 for sugar beet. Advice from colleagues was the least important motivation for starting a new land use. Reasons for abandoning certain land uses were, in order of importance, price changes, labour requirements, legislation and yield changes, with an almost equal distribution between the four clusters. Only for the large farms was price the dominant reason, followed by yield changes, while for all other farms, labour requirements and legislation were the second and third most important reasons. Environmental considerations such as erosion or water pollution did not play a role in the abandonment of certain land uses.
Bioenergy crops were grown by 10% of the farmers interviewed and were predominantly winter rapeseed. The bioenergy farmers belonged mainly to cluster 4 (large farms, 50% of the farmers) and to a lesser extent to cluster 2 (cattle farms, 8% of farmers). A further 16% of the farmers considered growing bioenergy crops in the future, including 20% of large farms, 18% of medium arable farms and 16% of cattle farms. Only 10% of the small farms considered growing bioenergy crops in the future.
The land market is closely related to land use decisions. More than 65% of the farmers would like to buy more land. Almost half of the farmers (48%) would buy more land if the price fell. For large farms, 63% of the farmers were willing to invest in additional land, while for small farms, the figure was only 38%. More than 26% of the farmers would not invest in more land, and 68% of all respondents would never sell land. Reasons such as off-farm employment, higher land prices or lower income could not motivate many respondents to sell land. Under the conditions of rising land prices, 14% of the farmers, but none of the large farms, would be tempted to sell their land.
The environmental indicators varied between the four farm clusters. The agri-environment- climate measures and practices that the farmers participated in were quite diverse and related to soil, water, landscape and biodiversity. Large farms participated in 2–5 agri-environment-climate measures and reported the highest number of environmental practices (i.e., 5–9 per farm). Their average use of two inputs such as manure or fertiliser per farm activity was the highest of all farm clusters. Their farm intensity was the second-highest. The small (specialised) farms reported a farm intensity of 100%, but this was not reflected in their average input level of only one to two inputs per farm activity, possibly because the listed inputs referred to the arable, cattle and large farms. The small farms participated in up to two agri-environment-climate measures. The cattle farms had a high overall mean input per farm, second only to the large farms due to the presence of animals. The cattle farms reported less opportunity to engage in agri-environment-climate practices such as cultivating cover crops. The most extensive farms were in the medium arable farm group, which reported low average inputs and environmental practices. Similar to the small farms, the medium arable farms were less interested in participating in agri-environment-climate measures.

4. Discussion

Farm typologies provide valuable insights into the diversity of agricultural practices and their impact on land use dynamics [11,12], and they are necessary to define agents in agent-based models [18,19]. Different methods exist to derive farm typologies and capture farm diversity in light of agricultural land use decisions and the environment (Table 1). We combined participatory methods, multivariate statistical modelling and spatiotemporal land cover analysis to develop a data-driven farm typology. A farm typology based on production activity categorises farms according to their primary agricultural economic activity, as exemplified by the European farm typology based on farm characteristics collected in the farm accountancy data network [13,16,35]. This economic approach to a production-based farm typology showed that the farm size varied significantly between farm types from small fruit and horticultural farms to medium-sized arable and mixed farms and large pig and cattle holdings. The number of parcels managed by each type of farm highlights the complexity of land management, owing to different forms of land ownership, fragmentation and land use intensity, as demonstrated in [28,38]. In the Dijle catchment, the choice of crop rotations also varied between farm types. Grassland and maize were mainly grown by livestock and mixed farms, while root crops were mainly grown by arable and mixed farms. Cattle and arable farms tended to have more rented land, while fruit and horticultural activities were typically developed on their own land. Arable and mixed farms were more likely to be involved in agri-environment-climate measures.
The complexity of farm typologies has implications for land use and environmental decision making, which is arguably overlooked by the economic approach to farm typologies [12,19,50]. Similarly, small farms tend to be overlooked, despite their crucial role in food security [36,37]. A data-driven farm typology was found to complement the economic approach to farm typologies based on production activity. Farm size, crop type and area, livestock and land tenure were the most important characteristics in distinguishing farm types. The farm clusters differed in terms of farm size, number of parcels, grassland and arable land. Our results conformed to the findings in [11,15,17,19] in their ability to capture farm diversity in the area. In spite of the obvious interaction between land use decisions and regional land use patterns, individual links between farm characteristics and the spatiotemporal parcel databases could not be made since the farmers’ identities were not available for privacy reasons. The presence of certain crops in rotations differed from what the farmers reported in the questionnaire, which may suggest a possible shift towards shorter rotations. In the same region, the authors of [48] concluded that crop yield losses due to climate change could be compensated by changes in land cover (i.e., crop choice), leading to utility gains. The proposed response of changing crop choice may be valid for adaptation to gradually changing weather patterns such as drought [49] but not for extreme weather events that can disrupt agricultural yields and systems [51]. Such disruptions may require rapid adjustments in land management, land use patterns and crop choice to mitigate climate impact and adapt to climate variability [52].
The motivations behind farmers’ land use decisions, both for current and new land use, revealed that family tradition, high returns and low labour input emerged as key motivators, although their relative importance varied between the different farm clusters. This understanding of motivators could help design policy actions by exploring the full potential of land use decisions [22,50]. Some changes in the area are policy-driven, such as the replacement of sugar beet by other root and tuber crops due to the abolition of a sugar quota. Considerations such as nature conservation seemed to play a minor role in land use decisions. However, farmers’ participation in agri-environment-climate measures showed that large farms tended to participate in more schemes and practices due to their larger size and resources, confirming an earlier finding [39]. Despite differences in land use between farm types, variations in crop rotations had a more pronounced influence, highlighting the importance of different farm characteristics in shaping land use decisions.

5. Conclusions

This research developed a methodology to identify a data-driven farm typology for agricultural land use decision analysis. The results of participatory methods, a formal questionnaire and multivariate analysis, or in this case principal component and cluster analysis, helped capture the complexity and heterogeneity of farming systems and allowed for a data-driven and systematic approach to defining a farm typology complementary to an economic production-based farm typology. Both the economic and data-driven farm typologies are valuable for understanding agricultural land use decisions. The diversity of farm characteristics confirmed that land use decisions and motivations for current and new land use are not the same for different farm types.
The robustness of a data-driven typology was tested on land cover data obtained from the Land Parcel Information System. Farm typologies were compared to spatial patterns and crop rotations using multi-annual parcel geodatabase analysis. The development of farm typologies proved essential to identify the key farm characteristics that influenced land use decisions as demonstrated for farm diversity, crop rotations, motivations for current and new land use decisions, land expansion and willingness to engage in agri-environment-climate measures. The methodology can be used to generate data-driven typologies suitable for leveraging agent-based models to explore sustainable land management options.
The literature review underscores the need for a standardised methodology to capture the intricate relationships between farm types, environmental factors, and policy outcomes, which is supported by recent scientific findings on the subject. In line with previous research, this study identifies a relation between the farm typology, agri-environment-climate practices and policy outcomes. Avenues for further investigation include the integration of economic and data-driven farm typologies for the development of agent-based modelling, the shift that emerging farming practices and innovative technologies can exert on farm typologies and the influence of drivers of change such as climate change, urban sprawl, landscape fragmentation as well as agri-environment-climate policy. Such investigations hold the potential for enhanced comprehension of the complex network of interrelations that govern farm diversity in an ever-changing environment.

Author Contributions

Conceptualisation, A.G. and A.V.H.; methodology, A.G.; software, A.G.; validation, A.G.; formal analysis, A.G.; investigation, A.G. and A.V.H.; data curation, A.G.; writing—original draft preparation, A.G.; writing—review and editing, A.G. and A.V.H.; visualisation, A.G. All authors have read and agreed to the published version of the manuscript.

Funding

This research was funded by Belspo, grant number SD/TA/01A.

Informed Consent Statement

Informed consent was obtained from all persons involved in the study.

Data Availability Statement

Data availability requires consent of the participating farmers.

Acknowledgments

The authors express their gratitude to the farmers that participated in the interviews.

Conflicts of Interest

The authors declare no conflict of interest.

References

  1. Robertson, G.P.; Swinton, S.M. Reconciling agricultural productivity and environmental integrity: A grand challenge for agriculture. Front. Ecol. Environ. 2005, 3, 38–46. [Google Scholar] [CrossRef]
  2. Akpoti, K.; Kabo-bah, A.T.; Zwart, S.J. Review—Agricultural land suitability analysis: State-of-the-art and outlooks for integration of climate change analysis. Agric. Syst. 2019, 173, 172–208. [Google Scholar] [CrossRef]
  3. Dobbs, T.L.; Pretty, J.N. Agri-environmental stewardship schemes and “multifunctionality”. Appl. Econ. Perspect. Policy 2004, 26, 220–237. [Google Scholar] [CrossRef]
  4. Van Huylenbroeck, G.; Vandermeulen, V.; Mettepenningen, E.; Verspecht, A. Multifunctionality of agriculture: A review of definitions, evidence and instruments. Living Rev. Landsc. Res. 2007, 1, 1–43. [Google Scholar] [CrossRef]
  5. García-Martín, M.; Huntsinger, L.; Ibarrola-Rivas, M.J.; Penker, M.; D’Ambrosio, U.; Dimopoulos, T.; Fernández-Giménez, M.E.; Kizos, T.; Muñoz-Rojas, J.; Saito, O.; et al. Landscape products for sustainable agricultural landscapes. Nat. Food 2022, 3, 814–821. [Google Scholar] [CrossRef] [PubMed]
  6. Zhao, J.; Bindi, M.; Eitzinger, J.; Ferrise, R.; Gaile, Z.; Gobin, A.; Holzkämper, A.; Kersebaum, K.C.; Kozyra, J.; Kriaučiūnienė, Z.; et al. Priority for climate adaptation measures in European crop production systems. Eur. J. Agron. 2022, 138, 126516. [Google Scholar] [CrossRef]
  7. EC. The Common Agricultural Policy at a Glance; EC, Directorate-General for Agriculture and Rural Development, Brussels: 2023. Available online: https://agriculture.ec.europa.eu/common-agricultural-policy/cap-overview/cap-glance_en (accessed on 7 November 2023).
  8. Rudnicki, R.; Wiśniewski, Ł.; Biczkowski, M. A spatial typography of environmentally friendly common agricultural policy support relevant to european green deal objectives. Land 2021, 10, 1092. [Google Scholar] [CrossRef]
  9. Schulp, C.J.; Levers, C.; Kuemmerle, T.; Tieskens, K.F.; Verburg, P.H. Mapping and modelling past and future land use change in Europe’s cultural landscapes. Land Use Policy 2019, 80, 332–344. [Google Scholar] [CrossRef]
  10. Stoate, C.; Baldi, A.; Beja, P.; Boatman, N.; Herzon, I.; Van Doorn, A.; De Snoo, G.; Rakosy, L.; Ramwell, C. Ecological impacts of early 21st century agricultural change in Europe—A review. J. Environ. Manag. 2009, 91, 22–46. [Google Scholar] [CrossRef]
  11. Zangue, Y.D.; Melot, R.; Martin, P. Diversity of farmland management practices (FMP) and their nexus to environment: A review. J. Environ. Manag. 2022, 302, 114059. [Google Scholar] [CrossRef]
  12. Rega, C.; Thompson, B.; Niedermayr, A.; Desjeux, Y.; Kantelhardt, J.; D’Alberto, R.; Gouta, P.; Konstantidelli, V.; Schaller, L.; Latruffe, L.; et al. Uptake of Ecological Farming Practices by EU Farms: A Pan-European Typology. EuroChoices 2022, 21, 64–71. [Google Scholar] [CrossRef]
  13. Díaz de Otálora, X.; Dragoni, F.; Del Prado, A.; Estellés, F.; Wilfart, A.; Krol, D.; Balaine, L.; Anestis, V.; Amon, B. Identification of representative dairy cattle and fodder crop production typologies at regional scale in Europe. Agron. Sustain. Dev. 2022, 42, 94. [Google Scholar] [CrossRef]
  14. Emtage, N.; Herbohn, J.; Harrison, S. Landholder profiling and typologies for natural resource–management policy and program support: Potential and constraints. Environ. Manag. 2007, 40, 481–492. [Google Scholar] [CrossRef] [PubMed]
  15. Daxini, A.; Ryan, M.; O’Donoghue, C.; Barnes, A.P.; Buckley, C. Using a typology to understand farmers’ intentions towards following a nutrient management plan. Resour. Conserv. Recycl. 2019, 146, 280–290. [Google Scholar] [CrossRef]
  16. Eurostat. Glossary; Technical Report; Eurostat: Luxembourg, 2023; Available online: https://agriculture.ec.europa.eu/data-and-analysis/farm-structures-and-economics/fadn_en (accessed on 7 November 2023).
  17. Nainggolan, D.; Termansen, M.; Reed, M.S.; Cebollero, E.D.; Hubacek, K. Farmer typology, future scenarios and the implications for ecosystem service provision: A case study from south-eastern Spain. Reg. Environ. Chang. 2013, 13, 601–614. [Google Scholar] [CrossRef]
  18. Valbuena, D.; Verburg, P.H.; Bregt, A.K. A method to define a typology for agent-based analysis in regional land-use research. Agric. Ecosyst. Environ. 2008, 128, 27–36. [Google Scholar] [CrossRef]
  19. Hristov, J.; Clough, Y.; Sahlin, U.; Smith, H.G.; Stjernman, M.; Olsson, O.; Sahrbacher, A.; Brady, M.V. Impacts of the EU’s Common Agricultural Policy “Greening” reform on agricultural development, biodiversity, and ecosystem services. Appl. Econ. Perspect. Policy 2020, 42, 716–738. [Google Scholar] [CrossRef]
  20. Huber, R.; Bakker, M.; Balmann, A.; Berger, T.; Bithell, M.; Brown, C.; Grêt-Regamey, A.; Xiong, H.; Le, Q.B.; Mack, G.; et al. Representation of decision-making in European agricultural agent-based models. Agric. Syst. 2018, 167, 143–160. [Google Scholar] [CrossRef]
  21. Vejre, H.; Abildtrup, J.; Andersen, E.; Andersen, P.S.; Brandt, J.; Busck, A.; Dalgaard, T.; Hasler, B.; Huusom, H.; Kristensen, L.S.; et al. Multifunctional Agriculture and Multifunctional Landscapes—Land Use as an Interface; Springer: Berlin/Heidelberg, Germany, 2007; pp. 93–104. [Google Scholar] [CrossRef]
  22. Schröder, J.J.; Ten Berge, H.F.M.; Bampa, F.; Creamer, R.E.; Giraldez-Cervera, J.V.; Henriksen, C.B.; Olesen, J.E.; Rutgers, M.; Sandén, T.; Spiegel, H. Multi-Functional Land Use Is Not Self-Evident for European Farmers: A Critical Review. Front. Environ. Sci. 2020, 8. [Google Scholar] [CrossRef]
  23. Tariq, M.; Ali, H.; Hussain, N.; Nasim, W.; Mubeen, M.; Ahmad, S.; Hasanuzzaman, M. Fundamentals of Crop Rotation in Agronomic Management. In Agronomic Crops: Volume 1: Production Technologies; Hasanuzzaman, M., Ed.; Springer: Singapore, 2019; pp. 545–559. [Google Scholar] [CrossRef]
  24. Zohry, A.; Ouda, S. Crop Rotation Defeats Pests and Weeds. In Crop Rotation: An Approach to Secure Future Food; Springer International Publishing: Cham, Switzerland, 2018; pp. 77–88. [Google Scholar] [CrossRef]
  25. Ruthes, A.C.; Dahlin, P. The impact of management strategies on the development and status of potato cyst nematode populations in Switzerland: An overview from 1958 to present. Plant Dis. 2022, 106, 1096–1104. [Google Scholar] [CrossRef]
  26. Rathke, G.W.; Behrens, T.; Diepenbrock, W. Integrated nitrogen management strategies to improve seed yield, oil content and nitrogen efficiency of winter oilseed rape (Brassica napus L.): A review. Agric. Ecosyst. Environ. 2006, 117, 80–108. [Google Scholar] [CrossRef]
  27. Bartkowski, B.; Schüßler, C.; Müller, B. Typologies of European farmers: Approaches, methods and research gaps. Reg. Environ. Chang. 2022, 22, 43. [Google Scholar] [CrossRef]
  28. Sklenicka, P. Classification of farmland ownership fragmentation as a cause of land degradation: A review on typology, consequences, and remedies. Land Use Policy 2016, 57, 694–701. [Google Scholar] [CrossRef]
  29. Upadhaya, S.G.; Arbuckle, J.; Schulte, L.A. Farmer typologies integrating latent and observed characteristics: Insights for soil and water conservation outreach. Land Use Policy 2023, 134, 106889. [Google Scholar] [CrossRef]
  30. Barnes, A.P.; Thompson, B.; Toma, L. Finding the ecological farmer: A farmer typology to understand ecological practice adoption within Europe. Curr. Res. Environ. Sustain. 2022, 4, 100125. [Google Scholar] [CrossRef]
  31. Graskemper, V.; Yu, X.; Feil, J.H. Farmer typology and implications for policy design—An unsupervised machine learning approach. Land Use Policy 2021, 103, 105328. [Google Scholar] [CrossRef]
  32. Alvarezl, S.; Timler, C.J.; Michalscheck, M.; Paas, W.; Descheemaeker, K.; Tittonell, P.; Andersson, J.A.; Groot, J.C. Capturing farm diversity with hypothesis-based typologies: An innovative methodological framework for farming system typology development. PLoS ONE 2018, 13, e0194757. [Google Scholar] [CrossRef]
  33. Périnelle, A.; Scopel, E.; Berre, D.; Meynard, J.M. Which Innovative Cropping System for Which Farmer? Supporting Farmers’ Choices Through Collective Activities. Front. Sustain. Food Syst. 2022, 6. [Google Scholar] [CrossRef]
  34. Ruiz-Martinez, I.; Martinetti, D.; Marraccini, E.; Debolini, M. Modeling drivers of farming system trajectories in Mediterranean peri-urban regions: Two case studies in Avignon (France) and Pisa (Italy). Agric. Syst. 2022, 202, 103490. [Google Scholar] [CrossRef]
  35. Andersen, E.; Elbersen, B.; Godeschalk, F.; Verhoog, D. Farm management indicators and farm typologies as a basis for assessments in a changing policy environment. J. Environ. Manag. 2007, 82, 353–362. [Google Scholar] [CrossRef]
  36. Guarín, A.; Rivera, M.; Pinto-Correia, T.; Guiomar, N.; Šūmane, S.; Moreno-Pérez, O.M. A new typology of small farms in Europe. Glob. Food Secur. 2020, 26, 100389. [Google Scholar] [CrossRef]
  37. Guiomar, N.; Godinho, S.; Pinto-Correia, T.; Almeida, M.; Bartolini, F.; Bezák, P.; Biró, M.; Bjørkhaug, H.; Bojnec, Š.; Brunori, G.; et al. Typology and distribution of small farms in Europe: Towards a better picture. Land Use Policy 2018, 75, 784–798. [Google Scholar] [CrossRef]
  38. Van der Zanden, E.H.; Levers, C.; Verburg, P.H.; Kuemmerle, T. Representing composition, spatial structure and management intensity of European agricultural landscapes: A new typology. Landsc. Urban Plan. 2016, 150, 36–49. [Google Scholar] [CrossRef]
  39. Van Herzele, A.; Gobin, A.; Van Gossum, P.; Acosta, L.; Waas, T.; Dendoncker, N.; Henry de Frahan, B. Effort for money? Farmers’ rationale for participation in agri-environment measures with different implementation complexity. J. Environ. Manag. 2013, 131, 110–120. [Google Scholar] [CrossRef] [PubMed]
  40. R Core Team. R: A Language and Environment for Statistical Computing; R Foundation for Statistical Computing: Vienna, Austria, 2023; Available online: https://www.R-project.org/ (accessed on 7 November 2023).
  41. Statbel. Land-en tuinbouwbedrijven Statistieken; Technical Report; Statbel: Brussels, Belgium, 2023. Available online: https://statbel.fgov.be/nl/themas/landbouw-visserij/land-en-tuinbouwbedrijven (accessed on 7 November 2023).
  42. Van De Vreken, P.; Gobin, A.; Baken, S.; Van Holm, L.; Verhasselt, A.; Smolders, E.; Merckx, R. Crop residue management and oxalate-extractable iron and aluminium explain long-term soil organic carbon sequestration and dynamics. Eur. J. Soil Sci. 2016, 67, 332–340. [Google Scholar] [CrossRef]
  43. Gobin, A.; Sallah, A.H.M.; Curnel, Y.; Delvoye, C.; Weiss, M.; Wellens, J.; Piccard, I.; Planchon, V.; Tychon, B.; Goffart, J.P.; et al. Crop Phenology Modelling Using Proximal and Satellite Sensor Data. Remote Sens. 2023, 15, 2090. [Google Scholar] [CrossRef]
  44. Broothaerts, N.; Verstraeten, G.; Kasse, C.; Bohncke, S.; Notebaert, B.; Vandenberghe, J. Reconstruction and semi-quantification of human impact in the Dijle catchment, central Belgium: A palynological and statistical approach. Quat. Sci. Rev. 2014, 102, 96–110. [Google Scholar] [CrossRef]
  45. Verstraeten, G.; Notebaert, B.; Broothaerts, N.; Vandenberghe, J.; De Smedt, P. River Landscapes in the Dijle Catchment: From Natural to Anthropogenic Meandering Rivers. In Landscapes and Landforms of Belgium and Luxembourg; Demoulin, A., Ed.; Springer International Publishing: Cham, Switzerland, 2018; pp. 269–280. [Google Scholar] [CrossRef]
  46. Van Rompaey, A.J.J.; Govers, G.; Puttemans, C. Modelling land use changes and their impact on soil erosion and sediment supply to rivers. Earth Surf. Process. Landf. 2002, 27, 481–494. [Google Scholar] [CrossRef]
  47. Gobin, A. Modelling climate impacts on crop yields in Belgium. Clim. Res. 2010, 44, 55–68. [Google Scholar] [CrossRef]
  48. de Frutos Cachorro, J.; Gobin, A.; Buysse, J. Farm-level adaptation to climate change: The case of the Loam region in Belgium. Agric. Syst. 2018, 165, 164–176. [Google Scholar] [CrossRef]
  49. Zamani, S.; Gobin, A.; Van de Vyver, H.; Gerlo, J. Atmospheric drought in Belgium—Statistical analysis of precipitation deficit. Int. J. Climatol. 2015, 36, 3056–3071. [Google Scholar] [CrossRef]
  50. Brown, C.; Kovács, E.; Herzon, I.; Villamayor-Tomas, S.; Albizua, A.; Galanaki, A.; Grammatikopoulou, I.; McCracken, D.; Olsson, J.A.; Zinngrebe, Y. Simplistic understandings of farmer motivations could undermine the environmental potential of the common agricultural policy. Land Use Policy 2021, 101, 105136. [Google Scholar] [CrossRef]
  51. Gobin, A.; Van de Vyver, H. Spatio-temporal variability of dry and wet spells and their influence on crop yields. Agric. For. Meteorol. 2021, 308–309, 108565. [Google Scholar] [CrossRef]
  52. Smith, P.; Calvin, K.; Nkem, J.; Campbell, D.; Cherubini, F.; Grassi, G.; Korotkov, V.; Le Hoang, A.; Lwasa, S.; McElwee, P.; et al. Which practices co-deliver food security, climate change mitigation and adaptation, and combat land degradation and desertification? Glob. Chang. Biol. 2020, 26, 1532–1575. [Google Scholar] [CrossRef]
Figure 1. Methodology to identify agricultural land use decision making.
Land 12 02032 g001
Figure 2. Location of the study area in Belgium and agricultural land use in 2010.
Land 12 02032 g002
Figure 3. Evolution of major arable crops as percentage of total agricultural area in the Dijle catchment for the period of 2000–2020 (data source: [41]).
Land 12 02032 g003
Figure 4. Farm area (ha) of different farm types according to the questionnaire administered in 2010 (A) and according to parcel analysis for the year 2010 (B). Box = 3 quartiles; whiskers = Q1(3) ± 1.5 ∗ IQR; the dots represent outliers.
Land 12 02032 g004
Figure 5. Projection of the 26 variables (A) and of the different farm types (B) for the first two principal components.
Land 12 02032 g005
Figure 6. Comparison between clusters for farm size, number of parcels, wheat area and grassland, which were selected for their different impacts on agricultural land use. The diamonds represent outliers.
Land 12 02032 g006
Figure 7. Comparison between clusters and farm types projected on the second and third principal components (A) and on the farm and wheat areas (B). Red represents medium–sized arable farms, blue represents small–sized farms, black represents large–sized farms, and green represents cattle and arable farms.
Land 12 02032 g007
Figure 8. Motivations for engaging in current land use in stacked percentages of weighted responses per cluster.
Land 12 02032 g008
Figure 9. Motivations for engaging in new land use in stacked percentages of weighted responses per cluster.
Land 12 02032 g009
Table 1. Selection of farm typology studies related to agricultural land use and environment.
RegionSettingPurposeData CollectionTypology MethodReferences
GlobalFarmland management-environment nexusReviewLiteratureFarmer-led versus policy-driven[11]
GlobalLand degradationReviewLiteratureLand tenure[28]
EuropeAgri-environmental policyReviewLiteratureRecurring farm types[27]
EuropeEnvironmental policyEnvironmental concernsFADN, FSSFarm production intensity[35]
EuropeEcological farmingEnvironmental concernsFADNScoring practices[12]
EuropeSmall-scale farmingFood securityFarmers’ interviewsMultivariate analysis[36,37]
EuropeCattle and fodder productionDiversity analysisFSSMultivariate analysis[13]
EuropeLandscape patternsManagement intensityGeodataExpert-based versus data-driven[38]
AustraliaNatural resources managementMonitoring policiesLandholder managementExpert rules[14]
IrelandNutrient managementEnvironmental concernsFarmers’ interviewsRegression analysis[15]
SwedenCAP greeningBiodiversityFADN, FSSEconomic-ecological models[19]
FADN = farm accountancy data network, FSS = farm structure survey, CAP = common agricultural policy.
Table 2. Distribution of farms and farm size in the survey and in the parcel registration database in the Dijle catchment.
Farm TypeSurvey (n = 219)Parcel Database (n = 996) 1
Arable farming (%)57.541.5
Mixed farming (%)21.935.0
Cattle farming (%)16.417.4
Permanent crops (%)1.41.5
Horticulture (%)1.44.7
Pig farming (%)1.4Not detectable
Median and quartile range of farm size (ha)46.0 (15.2–75.5)18.1 (8.0–41.6)
Median and quartile range of parcels per farm16.0 (8.0–30.5)13.0 (6.0–26.0)
1 Farms having a surface area less than 1 ha or only one parcel of less than 2 ha of their total area in the Dijle catchment were omitted from the Land Parcel Information System database.
Table 3. Dominance of crops in crop rotations in the Dijle catchment for the period of 2000–2020, expressed as percentage of parcels and surface area.
CropOverallDominance (>75%)Dominance (50–75%)Dominance (25–50%)Dominance (<25%)
Winter cereal79.1 (83.3)2.9 (2.6)42.2 (49.1)38.3 (37.2)16.6 (11.2)
Maize61.6 (59.5)3.9 (2.3)9.7 (6.2)30.0 (26.9)56.4 (64.5)
Sugar beet39.7 (49.7)0.0 (0.0)0.1 (0.1)19.5 (21.1)80.4 (78.8)
Potato34.5 (44.4)0.0 (0.0)0.1 (0.0)9.5 (10.8)90.4 (89.2)
Grass43.7 (33.9)37.4 (43.0)10.9 (8.1)17.4 (12.5)34.3 (36.4)
Spring cereal31.5 (28.9)0.2 (0.1)1.2 (0.5)14.8 (11.5)83.7 (87.9)
Vegetables17.7(20.5)0.5 (0.2)0.6 (0.1)6.3(4.1)92.5 (95.6)
Chicory6.3 (8.5)0.0 (0.0)0.2 (0.0)1.7 (2.5)98.1 (97.5)
Oilseed4.3 (5.5)0.0 (0.0)0.0 (0.0)0.5 (0.5)99.5 (99.5)
Fodder6.9 (4.2)0.0 (0.0)0.4 (0.5)6.3 (3.8)93.3 (95.7)
Flax0.7 (1.8)0.0 (0.0)0.0 (0.0)0.0 (0.0)100.0 (100.0)
Table 4. Transition probabilities (%) for different arable crops in rotation for the period of 2000–2020.
CropChicoryFlaxFodderGrassMaizeOilseedsPulsesPotatoesSCerealSBeetVegWCereal
Chicory *0.00.00.01.66.30.00.05.00.00.50.585.8
Flax0.00.00.05.21.00.00.00.02.19.30.082.5
Fodder0.00.03.41.617.50.00.24.76.50.51.863.5
Grass0.00.00.189.94.30.00.10.40.40.50.23.3
Maize0.20.00.64.139.00.10.33.93.84.20.643.0
Oilseeds0.00.00.75.06.11.00.01.90.41.61.980.5
Pulses2.30.00.03.32.30.02.31.30.012.42.673.5
Potatoes0.00.00.83.78.20.10.11.53.12.31.079.0
SCereal0.10.01.94.715.11.40.44.69.53.53.554.9
SugarBeet0.30.20.13.610.10.00.43.41.81.10.678.0
Vegetables0.20.00.72.919.70.10.84.710.05.411.642.8
WCereal1.00.31.23.822.82.31.19.55.312.03.137.2
* Interpretation: After chicory, winter cereals were the most common crop, followed by maize. SBeet = sugar beet, SCereal = spring cereal, WCereal = winter cereal and Veg = vegetables.
Disclaimer/Publisher’s Note: The statements, opinions and data contained in all publications are solely those of the individual author(s) and contributor(s) and not of MDPI and/or the editor(s). MDPI and/or the editor(s) disclaim responsibility for any injury to people or property resulting from any ideas, methods, instructions or products referred to in the content.

