


Production–Living–Ecological Spatial Function Identification and Pattern Analysis Based on Multi-Source Geographic Data and Machine Learning


Abstract
:1. Introduction
2. Materials and Methods
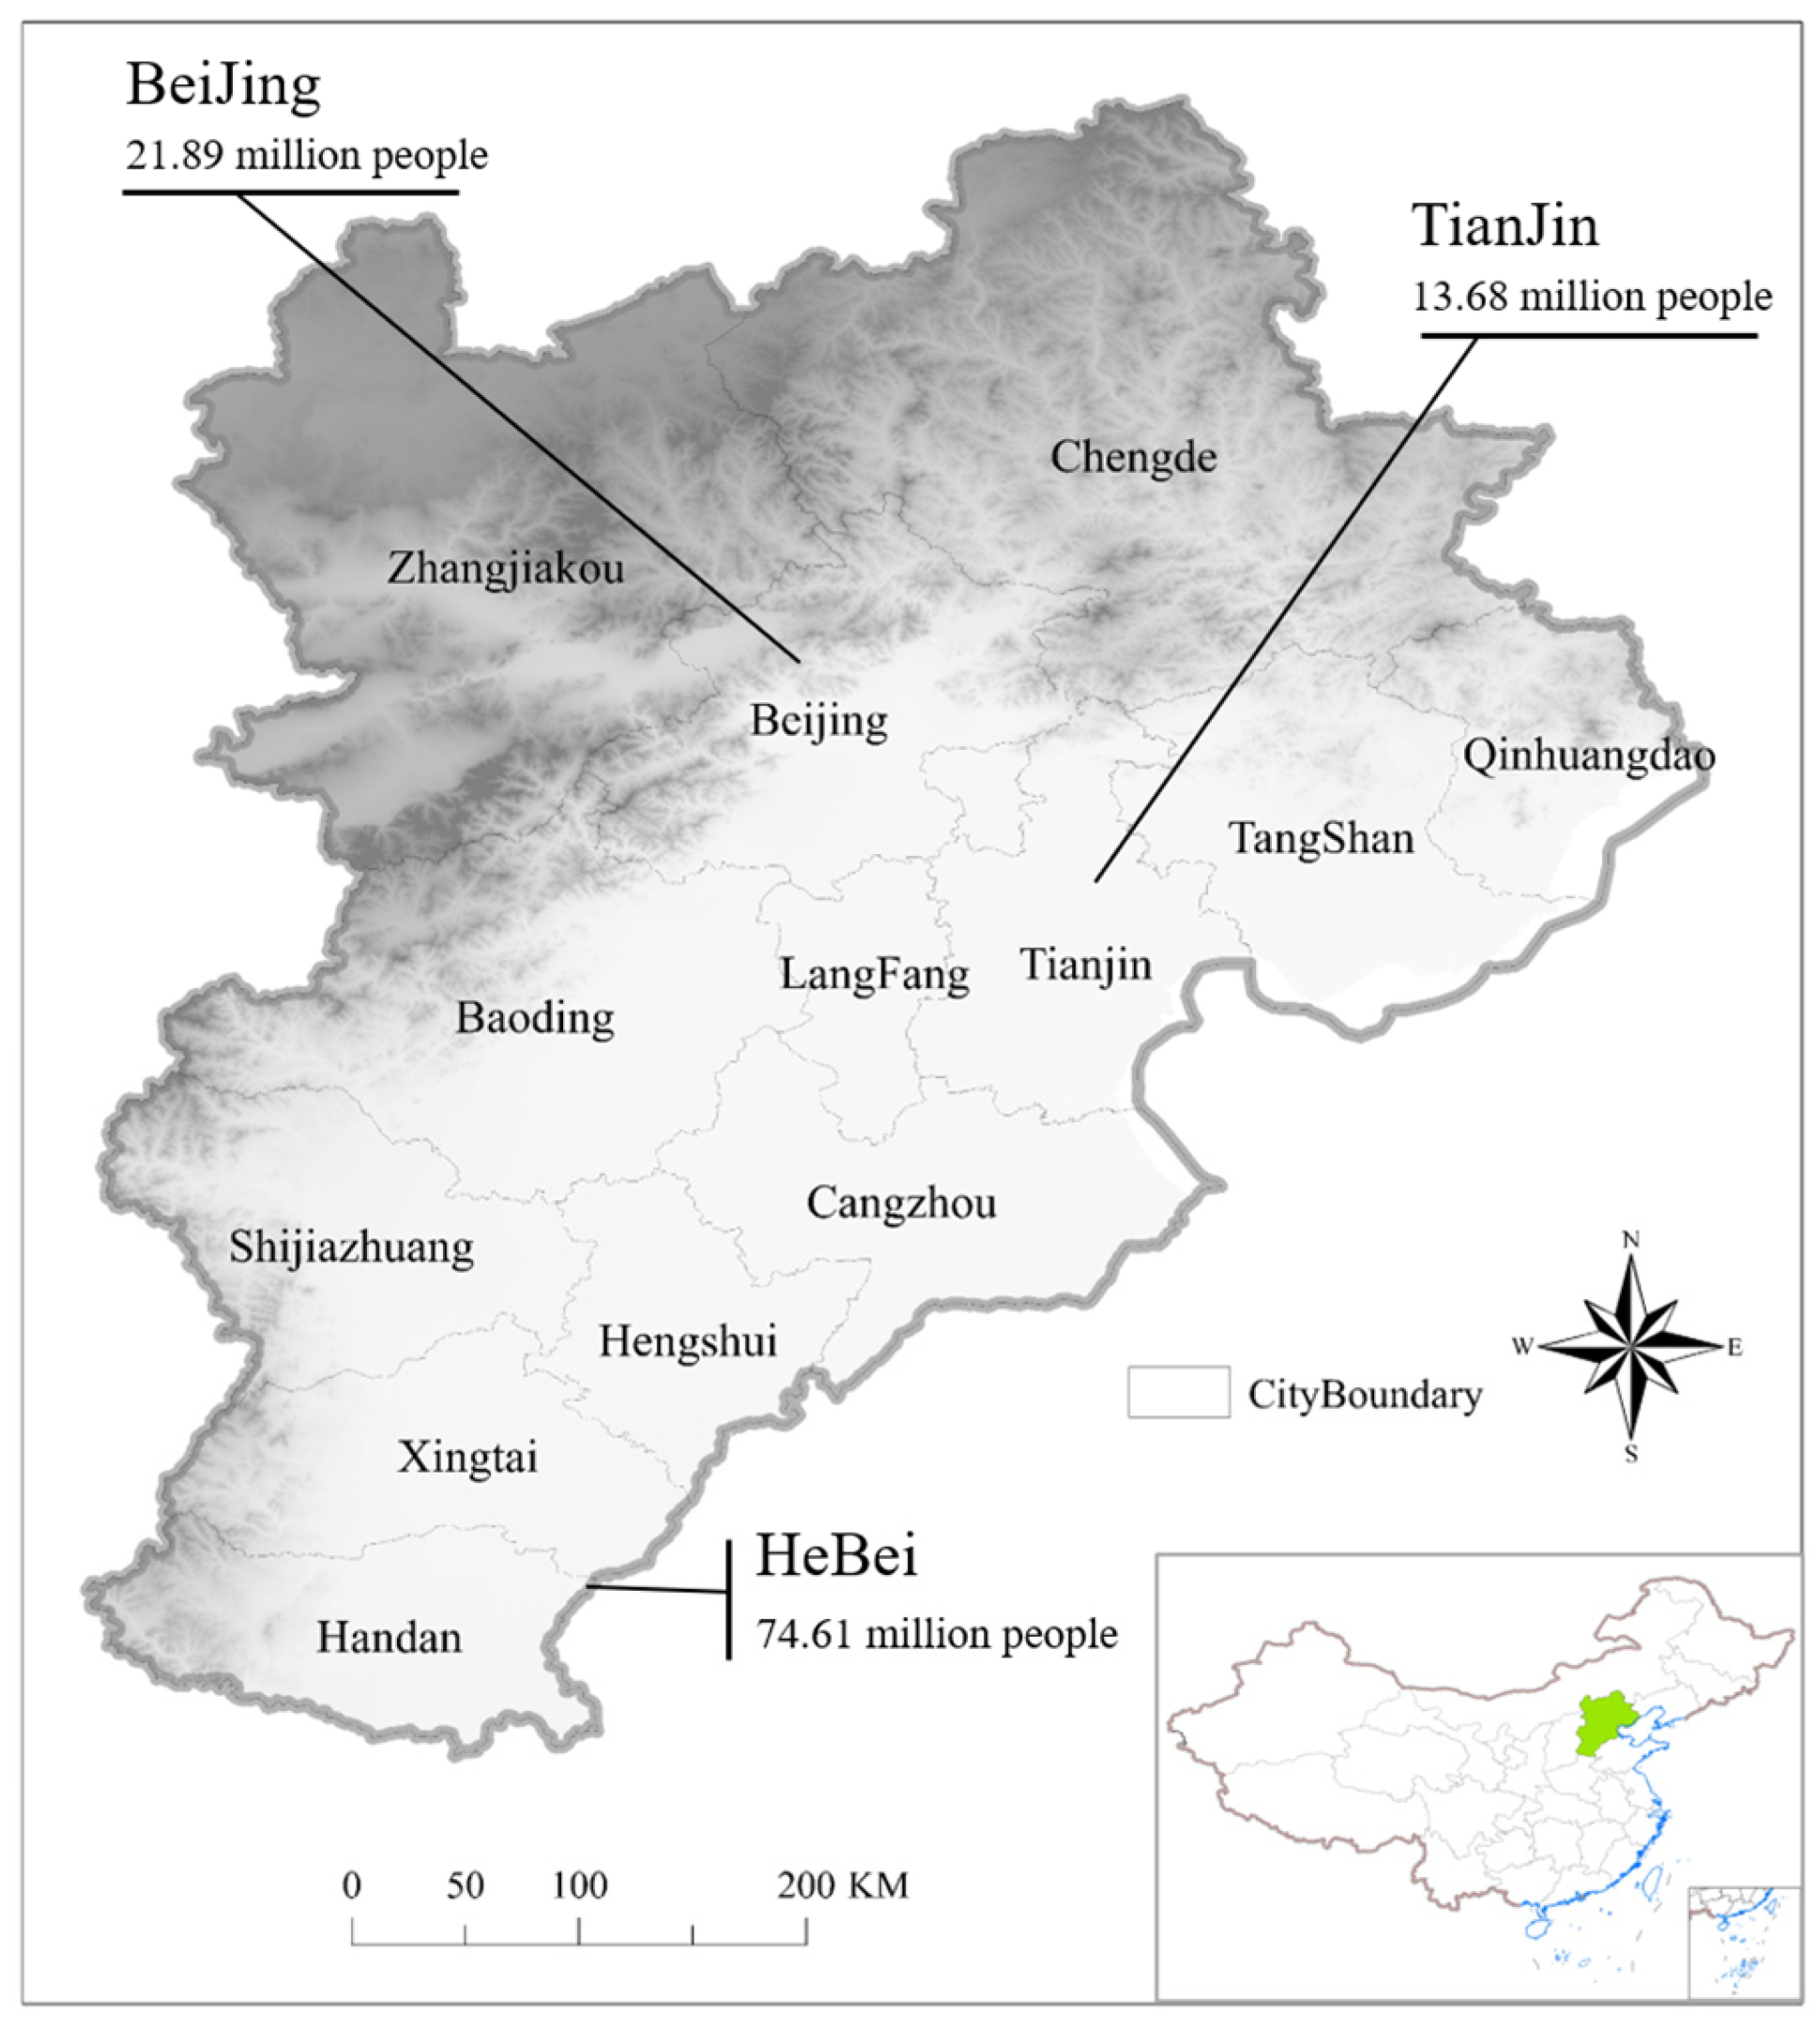
2.1. Study Area
2.2. Research Data
2.2.1. Sentinel-2A Remote-Sensing Data
2.2.2. Night-Time Lighting Data and POI Data
2.3. Research Methods
2.3.1. PLES Spatial Classification System
2.3.2. Object-Oriented Multi-Scale Segmentation Algorithm
2.3.3. Random Forest Classification Algorithm
3. Results
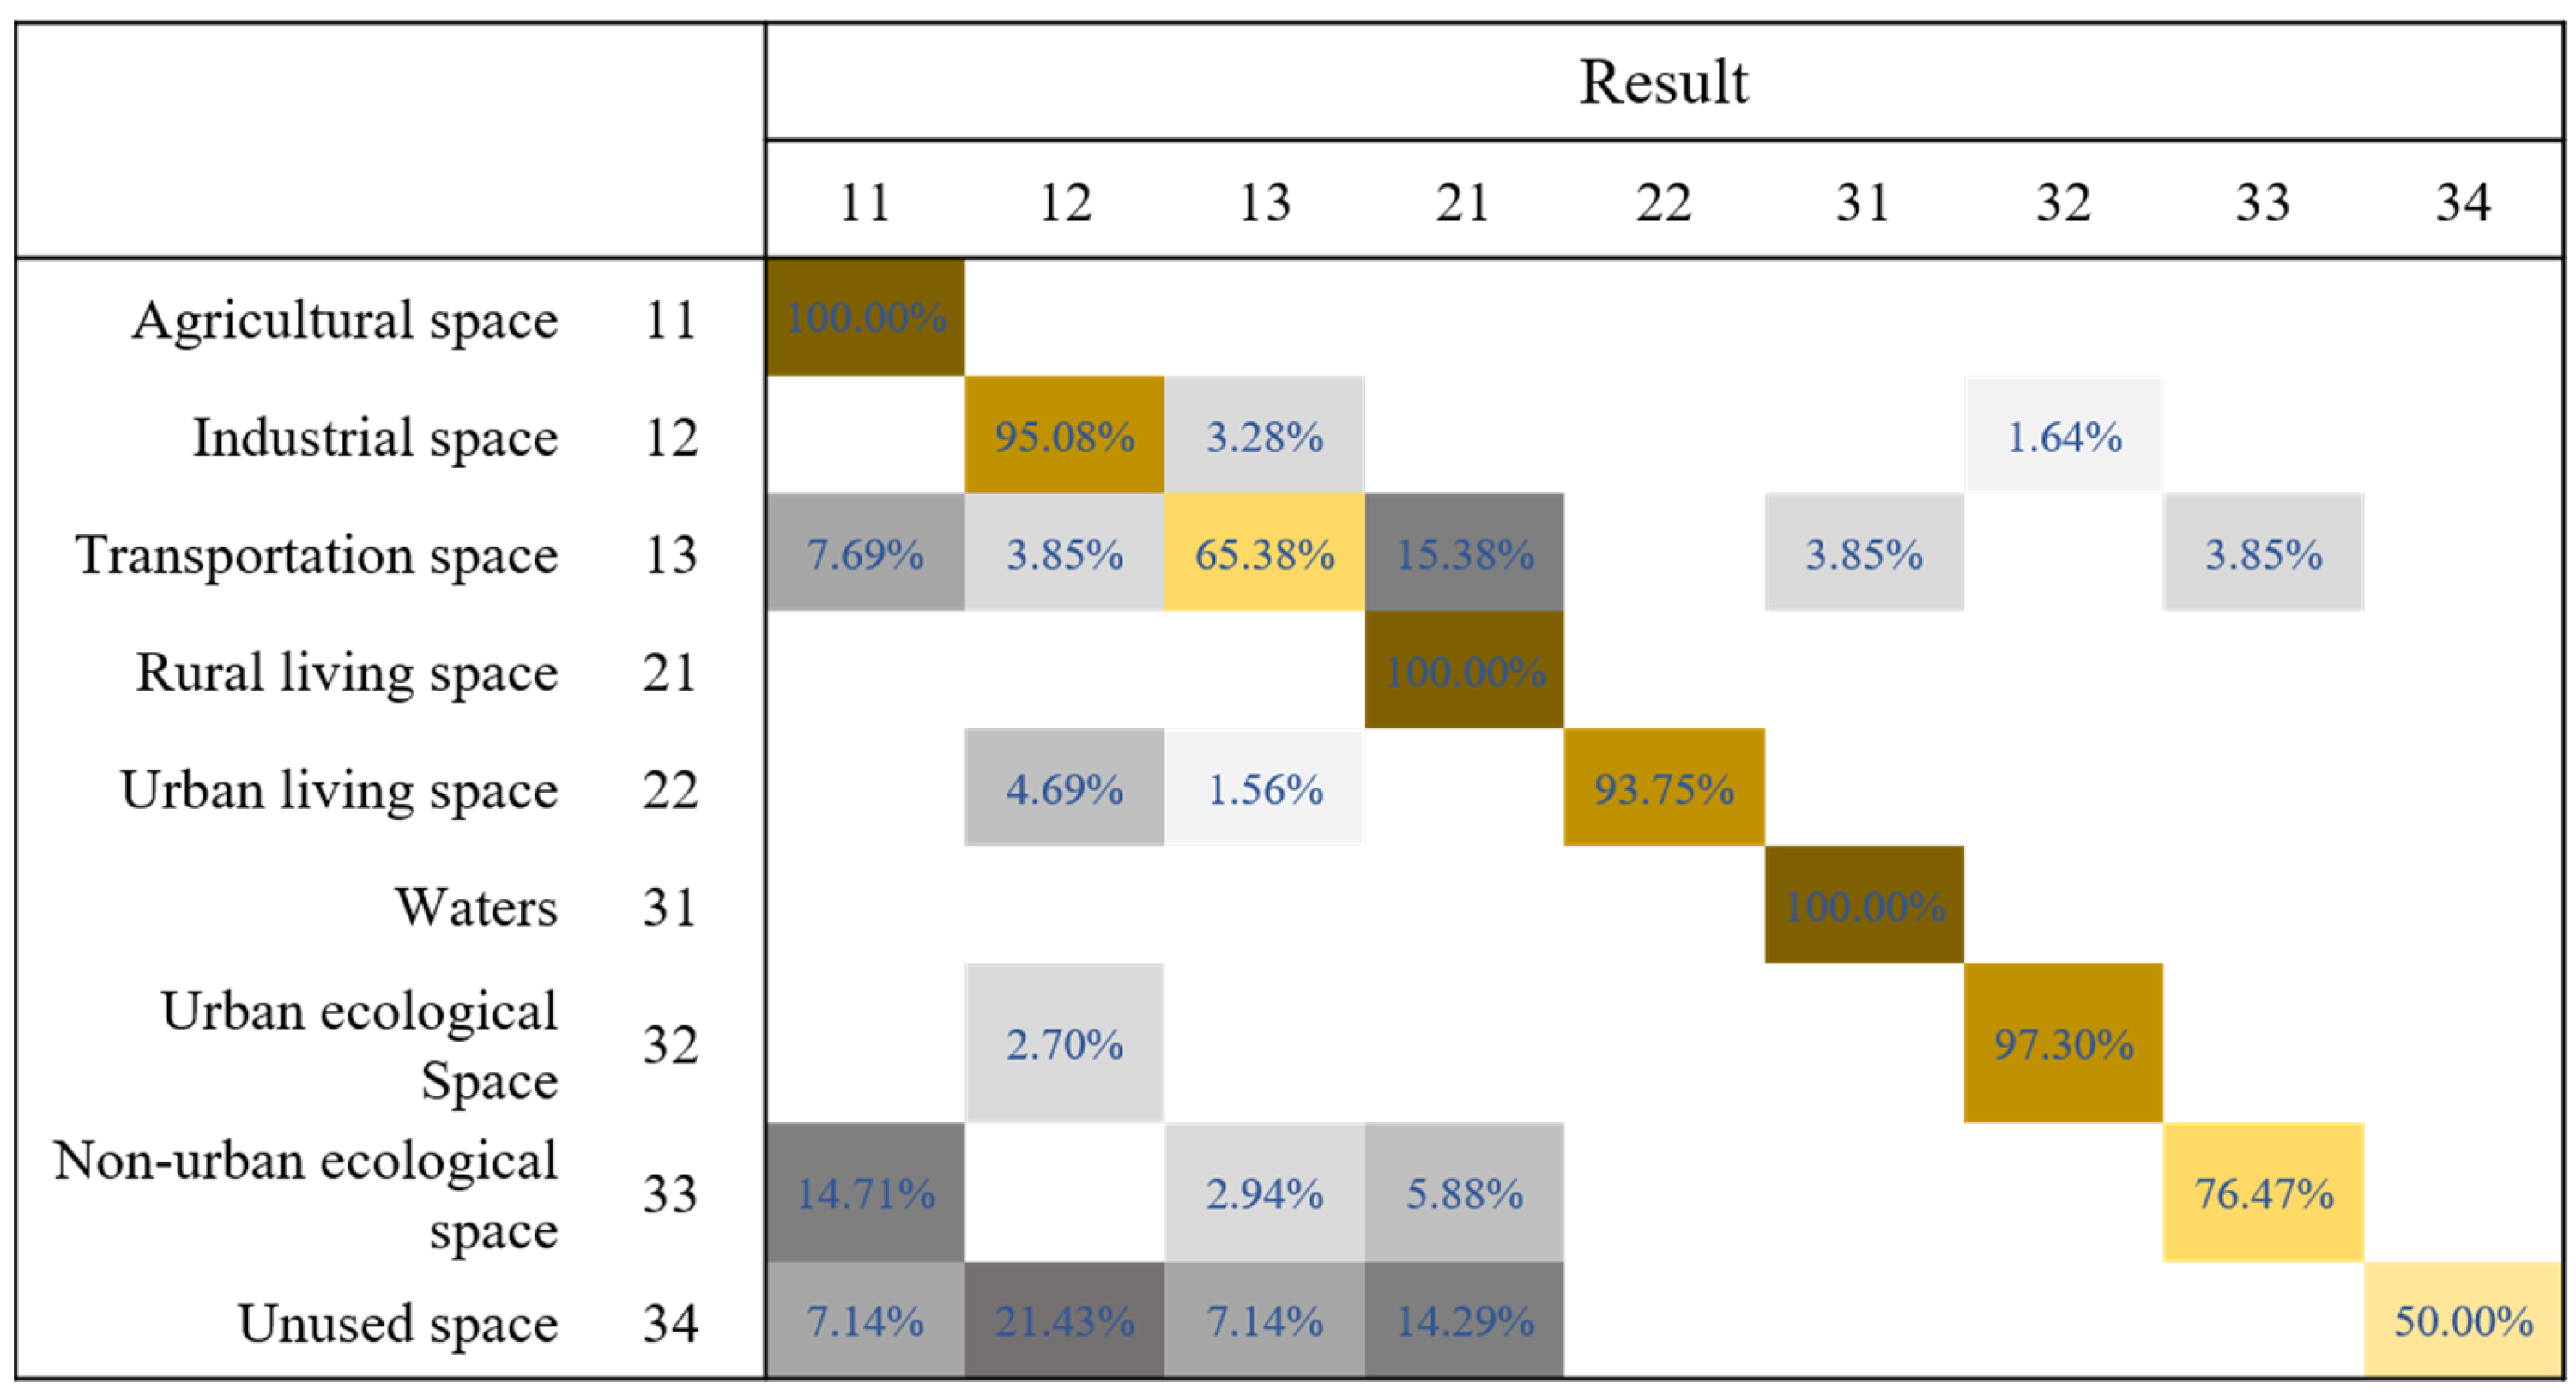
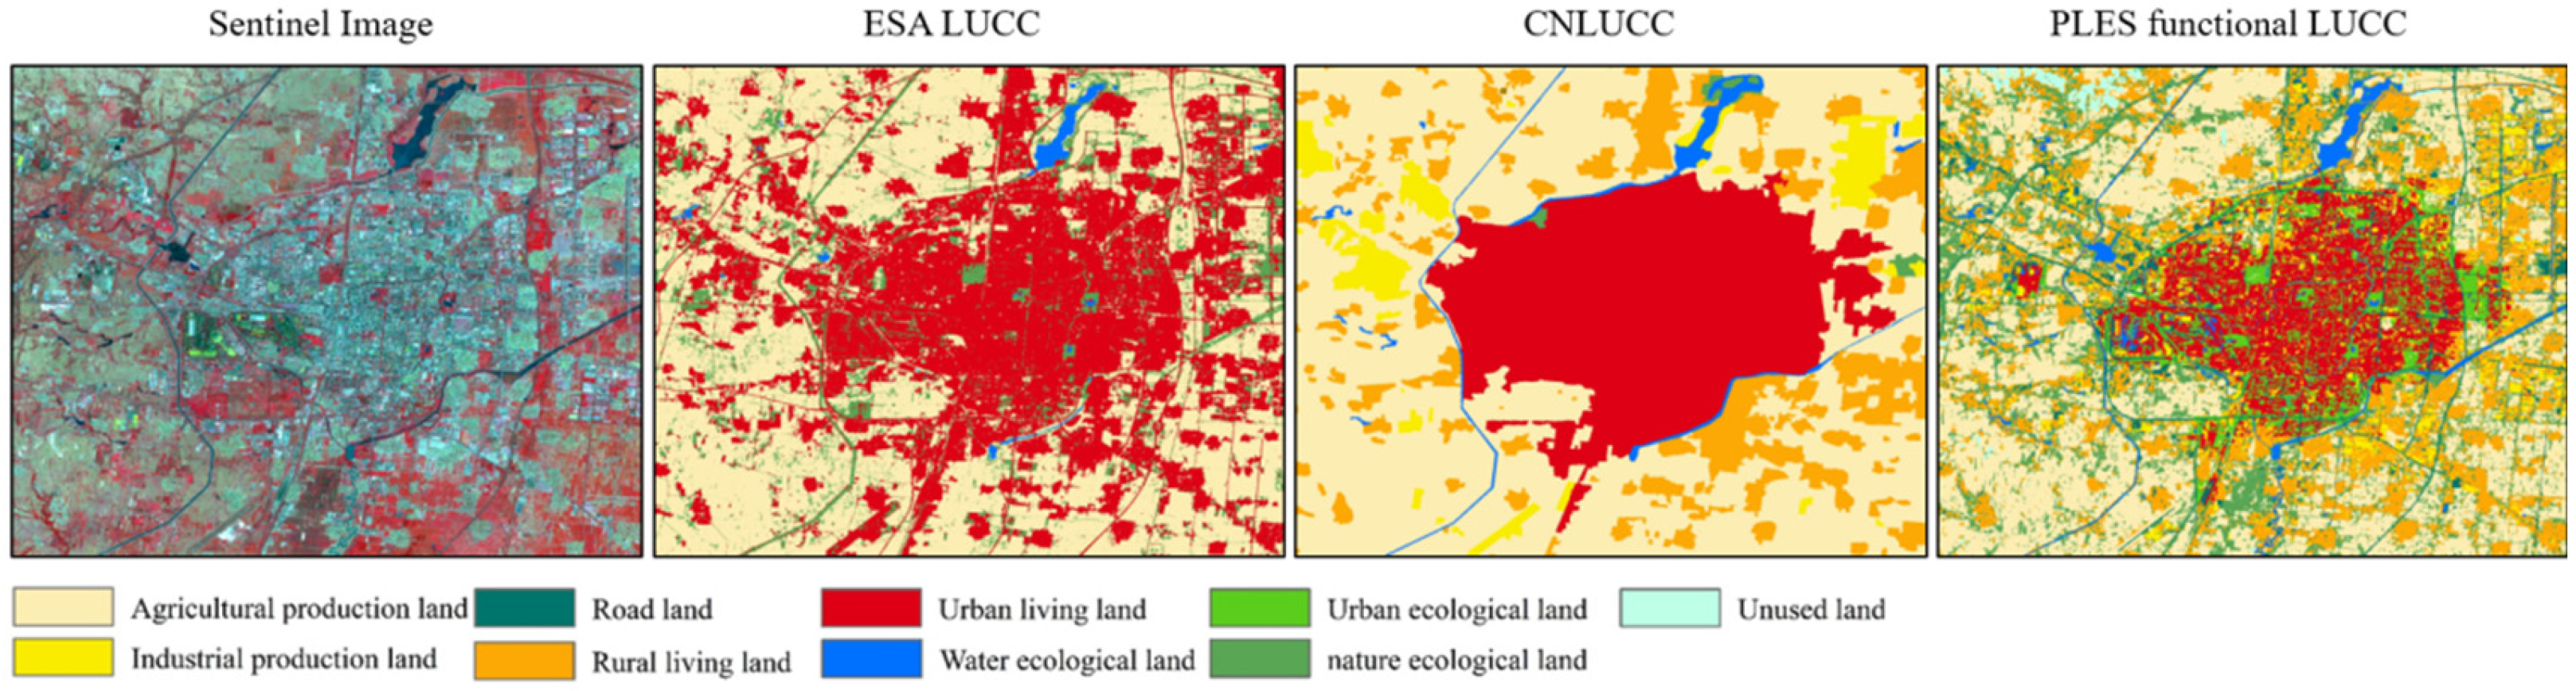
3.1. Object-Oriented Segmentation and Accuracy Evaluation of the Random Forest Algorithm
3.2. Analysis of the Spatial Evolution Pattern of PLES in the BTH Region
4. Discussion
5. Conclusions
- Firstly, multiple-scale segmentation of the study area was performed based on remote-sensing images (Sentinel); then, the spectral, textural, shape, and socio-economic characteristics of the objects were extracted from the remote-sensing image data, night-time light data, and POI data using the segmented objects. Representative samples were selected and labeled based on the nine secondary classifications under PLES categories. These samples were used to train a random forest algorithm, which was then used to classify all the objects in the entire study area. The results showed that features extracted based on object-oriented and multi-source data can better reflect the characteristics of objects from multiple dimensions, which is effective for identifying the functional types of PLES.
- In this study, the segmentation parameters were iteratively optimized using a multi-scale segmentation algorithm, resulting in a good segmentation effect, with the size of the segmented objects depending on the image features, and clear boundaries between different land covers. Nearly 2000 samples covering 9 second-level classifications were selected, and 11 features were extracted from multiple sources of data and used to train the random forest algorithm. The results showed that the random forest model had a strong anti-overfitting ability, could monitor the mutual influence between features, and identified small differences between different land covers. Finally, the model achieved an accuracy of 84.17% on the validation set and can thus meet the demands for large-scale land-use classification.
- The trained model was used to identify the spatial functional PLES types of land in the BTH region in 2016 and 2021, generating a 10 m resolution spatial distribution dataset. Based on this dataset, the spatial distribution patterns and development evolution of the PLES in the BTH region were statistically analyzed. It was found that the PLES in the study area exhibited a zonal distribution. The distribution between Beijing and Tianjin and across Hebei is extremely uneven, with Beijing and Tianjin occupying a substantial proportion of the urban living space, while other cities in Hebei, such as Shijiazhuang, have more clear land-use conflicts in terms of PLES. Furthermore, this imbalance has widened in the past 5 years. Overall, the production space in the BTH has decreased, while the living space and ecological space have increased. As the urban living space expands, urban green space also increases, and the overall layout of the PLES tends to be more reasonable.
Author Contributions
Funding
Data Availability Statement
Conflicts of Interest
References
- Gutman, G.; Janetos, A.C.; Justice, C.O.; Moran, E.F.; Mustard, J.F.; Rindfuss, R.R.; Skole, D.; Turner, B.L., II; Cochrane, M.A. Land Change Science: Observing, Monitoring, and Understanding Trajectories of Change on the Earth’s Surface; Springer: Berlin/Heidelberg, Germany, 2004. [Google Scholar]
- Chen, X.; Yu, L.; Du, Z.; Liu, Z.; Qi, Y.; Liu, T.; Gong, P. Toward sustainable land use in China: A perspective on China’s national land surveys. Land Use Policy 2022, 123, 106428. [Google Scholar] [CrossRef]
- Yang, X.; Chen, X.; Qiao, F.; Che, L.; Pu, L. Layout optimization and multi-scenarios for land use: An empirical study of production-living-ecological space in the Lanzhou-Xining City Cluster, China. Ecol. Indic. 2022, 145, 109577. [Google Scholar] [CrossRef]
- Navin, M.S.; Agilandeeswari, L. Comprehensive review on land use/land cover change classification in remote sensing. J. Spectr. Imaging 2020, 9, a8. [Google Scholar] [CrossRef]
- Pierdicca, N. Bayesian Techniques in Remote Sensing. Adv. Glob. Chang. Res. 2003, 13, 49–64. [Google Scholar]
- Toth, D.; Aach, T. Improved minimum distance classification with gaussian outlier detection for industrial inspection. In Proceedings of the International Conference on Image Analysis & Processing, Palermo, Italy, 26–28 September 2001; IEEE Computer Society: Washington, DC, USA, 2001; pp. 584–588. [Google Scholar]
- Kandrika, S.; Roy, P.S. Land use land cover classification of Orissa using multi-temporal IRS-P6 awifs data: A decision tree approach. Int. J. Appl. Earth Obs. Geoinf. 2008, 10, 186–193. [Google Scholar] [CrossRef]
- Yuan, F.; Sawaya, K.E.; Loeffelholz, B.C.; Bauer, M.E. Land cover classification and change analysis of the Twin Cities (Minnesota) Metropolitan Area by multitemporal Landsat remote sensing. Remote Sens. Environ. 2005, 98, 317–328. [Google Scholar] [CrossRef]
- Atkinson, P.M.; Lewis, P. Geostatistical classification for remote sensing: An introduction. Comput. Geosci. 2000, 26, 361–371. [Google Scholar] [CrossRef]
- Khatami, R.; Mountrakis, G.; Stehman, S.V. A meta-analysis of remote sensing research on supervised pixel-based land-cover image classification processes: General guidelines for practitioners and future research. Remote Sens. Environ. 2016, 177, 89–100. [Google Scholar] [CrossRef]
- Dorren, L.K.A.; Maier, B.; Seijmonsbergen, A.C. Improved Landsat-based forest mapping in steep mountainous terrain using object-based classification. For. Ecol. Manag. 2003, 183, 31–46. [Google Scholar] [CrossRef]
- Peña, J.M.; Gutiérrez, P.A.; Hervás-Martínez, C.; Six, J.; Plant, R.E.; López-Granados, F. Object-based image classification of summer crops with machine learning methods. Remote Sens. 2014, 6, 5019–5041. [Google Scholar] [CrossRef]
- Li, M.; Zang, S.Y.; Zhang, B.; Li, S.S.; Wu, C.S. A review of remote sensing image classification techniques: The role of spatio-contextual information. Eur. J. Remote Sens. 2014, 47, 389–411. [Google Scholar] [CrossRef]
- Hussain, M.; Chen, D.; Cheng, A.; Wei, H.; Stanley, D. Change detection from remotely sensed images: From pixel-based to object-based approaches. ISPRS J. Photogramm. Remote Sens. 2013, 80, 91–106. [Google Scholar] [CrossRef]
- Moskal, L.M.; Styers, D.M.; Halabisky, M. Monitoring urban tree cover using object-based image analysisand public domain remotely sensed data. Remote Sens. 2011, 3, 2243–2262. [Google Scholar] [CrossRef]
- Li, M.; Bijker, W.; Stein, A. Use of binary partition tree and energy minimization for object-based classification of urban land cover. ISPRS J. Photogramm. Remote Sens. 2015, 102, 48–61. [Google Scholar] [CrossRef]
- Yin, J.; Dong, J.; Hamm, N.A.; Li, Z.; Wang, J.; Xing, H.; Fu, P. Integrating remote sensing and geospatial big data for urban land use mapping: A review. Int. J. Appl. Earth Obs. Geoinf. 2021, 103, 102514. [Google Scholar] [CrossRef]
- Memon, N.; Parikh, H.; Patel, S.B.; Patel, D.; Patel, V.D. Automatic land cover classification of multi-resolution dualpol data using convolutional neural network (CNN). Remote Sens. Appl. Soc. Environ. 2021, 22, 100491. [Google Scholar] [CrossRef]
- Bao, H.; Ming, D.; Guo, Y.; Zhang, K.; Zhou, K.; Du, S. DFCNN-based semantic recognition of urban functional zones by integrating remote sensing data and POI data. Remote Sens. 2020, 12, 1088. [Google Scholar] [CrossRef]
- Chang, S.; Wang, Z.; Mao, D.; Guan, K.; Jia, M.; Chen, C. Mapping the essential urban land use in changchun by applying random forest and multi-source geospatial data. Remote Sens. 2020, 12, 2488. [Google Scholar] [CrossRef]
- Hu, T.; Yang, J.; Li, X.; Gong, P. Mapping urban land use by using landsat images and open social data. Remote Sens. 2016, 8, 151. [Google Scholar] [CrossRef]
- Zhang, S.; Li, C.; Sun, J.; Wang, J. Identification of Urban Functional Zones Using High-Resolution Remote Sensing Images and Socioeconomic Big Data. ISPRS Int. J. Geo-Inf. 2021, 10, 242. [Google Scholar]
- Zhang, X.; Du, S.; Wang, Q. Hierarchical semantic cognition for urban functional zones with VHR satellite images and POI data. ISPRS J. Photogramm. Remote Sens. 2017, 132, 170–184. [Google Scholar] [CrossRef]
- Feng, Y.; Huang, Z.; Wang, Y.; Wan, L.; Liu, Y.; Zhang, Y.; Shan, X. An SOE-Based Learning Framework Using Multisource Big Data for Identifying Urban Functional Zones. IEEE J. Sel. Top. Appl. Earth Obs. Remote Sens. 2021, 14, 7336–7348. [Google Scholar] [CrossRef]
- Kamusoko, C.; Kamusoko, O.W.; Chikati, E.; Gamba, J. Mapping urban and peri-urban land cover in Zimbabwe: Challenges and opportunities. Geomatics 2021, 1, 114–147. [Google Scholar] [CrossRef]
- Bruzzone, L.; Demir, B. A review of modern approaches to classification of remote sensing data. Land Use Land Cover. Mapp. Eur. Pract. Trends 2014, 18, 127–143. [Google Scholar]
- Zhang, H.B.; Li, M.H.; Zhang, Q.L. Construction of land classification system and land type identification for territorial spatial planning based on multi-source data. Trans. Chin. Soc. Agric. Eng. 2020, 36, 261–269. [Google Scholar]
- Jin, X.; Lu, Y.; Lin, J.; Qi, X.; Hu, G.; Li, X. Research on the evolution of spatiotemporal patterns of production-living-ecological space in an urban agglomeration in the Fujian Delta region, China. Acta Ecol. Sin. 2018, 38, 4286–4295. [Google Scholar]
- Liu, J.L.; Liu, Y.S.; Li, Y.R.; Liu, J.L.; Liu, Y.S.; Li, Y.R. Classification evaluation and spatial-temporal analysis of “production-living-ecological” spaces in China. Acta Geogr. Sin. 2017, 72, 1290–1304. [Google Scholar]
- Lin, J.; Wu, Y.X.; Wu, J.Y. Construction of the spatial planning system: With discussions on the relationship between spatial planning, territorial spatial regulation, and natural resources supervision. City Plan. Rev. 2018, 42, 9–17. [Google Scholar]
- Ji, Z.X.; Liu, C.; Xu, Y.Q.; Huang, A.; Lu, L.H.; Duan, Y.M. Identification and optimal regulation of the production-living-ecological space based on quantitative land use functions. Trans. Chin. Soc. Agric. Eng. 2020, 36, 222–231. [Google Scholar]
- Fu, J.; Bu, Z.; Jiang, D.; Lin, G.; Li, X. Sustainable land use diagnosis based on the perspective of production–living–ecological spaces in China. Land Use Policy 2022, 122, 106386. [Google Scholar] [CrossRef]
- Li, G.D.; Fang, C.L. Quantitative function identification and analysis of urban ecological-production-living spaces. Acta Geogr. Sin. 2016, 71, 49–65. [Google Scholar]
- Xia, N.; Hai, W.; Tang, M.; Song, J.; Quan, W.; Zhang, B.; Ma, Y. Spatiotemporal evolution law and driving mechanism of production–living–ecological space from 2000 to 2020 in Xinjiang, China. Ecol. Indic. 2023, 154, 110807. [Google Scholar] [CrossRef]
- Fu, C.; Tu, X.; Huang, A. Identification and characterization of Production–living–ecological space in a central urban area based on POI data: A case study for Wuhan, China. Sustainability 2021, 13, 7691. [Google Scholar] [CrossRef]
- Hao, L.; Yu, J.; Du, C.; Wang, P. A policy support framework for the balanced development of economy-society-water in the Beijing-Tianjin-Hebei urban agglomeration. J. Clean. Prod. 2022, 374, 134009. [Google Scholar] [CrossRef]
- Wang, Y.; Xie, Y.; Qi, L.; He, Y.; Bo, H. Synergies evaluation and influencing factors analysis of the water–energy–food nexus from symbiosis perspective: A case study in the Beijing–Tianjin–Hebei region. Sci. Total Environ. 2022, 818, 151731. [Google Scholar] [CrossRef] [PubMed]
- Cui, Y. The coordinated relationship among industrialization, environmental carrying capacity and green infrastructure: A comparative research of Beijing-Tianjin-Hebei region, China. Environ. Dev. 2022, 44, 100775. [Google Scholar] [CrossRef]
- Zheng, Y.; Tang, L.; Wang, H. An improved approach for monitoring urban built-up areas by combining NPP-VIIRS nighttime light, NDVI, NDWI, and NDBI. J. Clean. Prod. 2021, 328, 129488. [Google Scholar] [CrossRef]
- Jiang, S.; Alves, A.; Rodrigues, F.; Ferreira, J., Jr.; Pereira, F.C. Mining point-of-interest data from social networks for urban land use classification and disaggregation. Comput. Environ. Urban Syst. 2015, 53, 36–46. [Google Scholar] [CrossRef]
- Fathizad, H.; Ardakani, M.A.H.; Mehrjardi, R.T.; Sodaiezadeh, H. Evaluating desertification using remote sensing technique and object-oriented classification algorithm in the Iranian central desert. J. Afr. Earth Sci. 2018, 145, 115–130. [Google Scholar] [CrossRef]
- Carbonell, J.G.; Michalski, R.S.; Mitchell, T.M. Machine learning: A historical and methodological analysis. AI Mag. 1983, 4, 69. [Google Scholar]
- Zanaga, D.; Van De Kerchove, R.; Daems, D.; De Keersmaecker, W.; Brockmann, C.; Kirches, G.; Wevers, J.; Cartus, O.; Santoro, M.; Fritz, S.; et al. ESA WorldCover 10 m 2021 v200. 2022. Available online: https://zenodo.org/records/7254221 (accessed on 20 February 2023).
- Xu, X.; Liu, J.; Zhang, S.; Li, R.; Yan, C.; Wu, S. China’s Multi-Period Land Use Land Cover Remote Sensing Monitoring Data Set (CNLUCC); Resource and Environment Data Cloud Platform: Beijing, China, 2018. [Google Scholar]
- Rosier, J.F.; Taubenböck, H.; Verburg, P.H.; van Vliet, J. Fusing Earth observation and socioeconomic data to increase the transferability of large-scale urban land use classification. Remote Sens. Environ. 2022, 278, 113076. [Google Scholar] [CrossRef]
- Zhang, X.; Liu, L.; Wang, Y.; Hu, Y.; Zhang, B. A SPECLib-based operational classification approach: A preliminary test on China land cover mapping at 30 m. Int. J. Appl. Earth Obs. Geoinf. 2018, 71, 83–94. [Google Scholar] [CrossRef]


| Feature Type | Bands | Data Source |
|---|---|---|
| Spectral features | B8 | Sentinel-2A |
| B4 | Sentinel-2A | |
| B3 | Sentinel-2A | |
| B2 | Sentinel-2A | |
| NDVI | Sentinel-2A | |
| Shape features | Area | Object segmentation |
| Perimeter | Object segmentation | |
| Texture features | Structure ratio | Object segmentation |
| Second-order moment | GEE | |
| Relevance | GEE | |
| Entropy | GEE | |
| Socioeconomic features | Night light value | NPP/VIIRS |
| POIs density | Nucleation density of POIs |
| Level 1 Classification | Level 2 Classification | Code |
|---|---|---|
| Production area | Agricultural space | 11 |
| Industrial space | 12 | |
| Transportation space | 13 | |
| Living area | Rural living space | 21 |
| Urban living space | 22 | |
| Ecological area | Waters | 31 |
| Urban ecological space | 32 | |
| Non-urban ecological space | 33 | |
| Unused space | 34 |
| Plan A | Plan B | Plan C | ||||||||||
|---|---|---|---|---|---|---|---|---|---|---|---|---|
| PA/% | UA/% | OA/% | Kappa | PA/% | UA/% | OA/% | Kappa | PA/% | UA/% | OA/% | Kappa | |
| Agricultural space | 0.87 | 0.89 | 85.06 | 82.66 | 0.82 | 0.98 | 87.64% | 85.74% | 0.98 | 0.96 | 93.97 | 92.98 |
| Industrial space | 0.89 | 0.96 | 0.93 | 0.96 | 0.93 | 1.00 | ||||||
| Transportation space | 0.76 | 0.76 | 0.94 | 0.61 | 0.89 | 0.89 | ||||||
| Rural living space | 0.89 | 0.91 | 0.90 | 0.93 | 0.97 | 0.97 | ||||||
| Urban living space | 0.90 | 0.86 | 0.89 | 0.96 | 1.00 | 0.96 | ||||||
| Waters | 0.95 | 0.93 | 1.00 | 0.91 | 0.84 | 0.84 | ||||||
| Urban ecological Space | 0.68 | 0.73 | 0.75 | 0.77 | 0.94 | 1.00 | ||||||
| Non-urban ecological space | 0.53 | 0.47 | 0.77 | 0.67 | 0.79 | 0.81 | ||||||
| Unused space | 0.86 | 0.60 | 0.83 | 0.62 | 1.00 | 0.57 | ||||||
| PLES Type | Area in 2016 (km2) | Area in 2021 (km2) |
|---|---|---|
| Agricultural space | 807.86 | 786.45 |
| Industrial space | 26.05 | 27.14 |
| Transport space | 61.42 | 44.46 |
| Rural living space | 280.15 | 267.63 |
| Urban living space | 35.13 | 40.02 |
| Waters | 100.99 | 107.37 |
| Urban ecological space | 22.17 | 28.89 |
| Non-urban ecological space | 1500.08 | 1527.95 |
| Unused space | 6.74 | 10.68 |
Disclaimer/Publisher’s Note: The statements, opinions and data contained in all publications are solely those of the individual author(s) and contributor(s) and not of MDPI and/or the editor(s). MDPI and/or the editor(s) disclaim responsibility for any injury to people or property resulting from any ideas, methods, instructions or products referred to in the content. |
© 2023 by the authors. Licensee MDPI, Basel, Switzerland. This article is an open access article distributed under the terms and conditions of the Creative Commons Attribution (CC BY) license (https://creativecommons.org/licenses/by/4.0/).
Share and Cite
Bu, Z.; Fu, J.; Jiang, D.; Lin, G. Production–Living–Ecological Spatial Function Identification and Pattern Analysis Based on Multi-Source Geographic Data and Machine Learning. Land 2023, 12, 2029. https://doi.org/10.3390/land12112029
Bu Z, Fu J, Jiang D, Lin G. Production–Living–Ecological Spatial Function Identification and Pattern Analysis Based on Multi-Source Geographic Data and Machine Learning. Land. 2023; 12(11):2029. https://doi.org/10.3390/land12112029
Chicago/Turabian StyleBu, Ziqiang, Jingying Fu, Dong Jiang, and Gang Lin. 2023. "Production–Living–Ecological Spatial Function Identification and Pattern Analysis Based on Multi-Source Geographic Data and Machine Learning" Land 12, no. 11: 2029. https://doi.org/10.3390/land12112029
APA StyleBu, Z., Fu, J., Jiang, D., & Lin, G. (2023). Production–Living–Ecological Spatial Function Identification and Pattern Analysis Based on Multi-Source Geographic Data and Machine Learning. Land, 12(11), 2029. https://doi.org/10.3390/land12112029