Communication

Remote-Sensed Tree Crown Diameter as a Predictor of Stem Diameter and Above-Ground Biomass in Betula pendula Roth and Populus tremuloides Michx. × Populus tremula L. Plantations

by
Toms Artūrs Štāls
1,2,*,
Arta Bārdule
1,
Kārlis Dūmiņš
1,
Kristaps Makovskis
1 and
Dagnija Lazdiņa
1
1
Latvian State Forest Research Institute Silava, LV-2169 Salaspils, Latvia
2
Faculty of Geography and Earth Sciences, University of Latvia, LV-1004 Riga, Latvia
*
Author to whom correspondence should be addressed.
Land 2023, 12(11), 2006; https://doi.org/10.3390/land12112006
Submission received: 22 September 2023 / Revised: 20 October 2023 / Accepted: 30 October 2023 / Published: 2 November 2023

Abstract

:
Striving for climate neutrality and wider implementation of climate change mitigation measures including tree introduction in agricultural land, request for approaches and general allometric models for estimating carbon (C) stock in tree above-ground biomass (AGB) based on relatively easily obtainable remote sensing data is increasing. Here, we present estimates of individual trees’ crown diameters (CDs) for Betula pendula Roth (B. pendula) and Populus tremuloides Michx. × Populus tremula L. (P. tremuloides × P. tremula) in 11-year-old tree plantations (tree height ranged up to 12.8 and 18.1 m, respectively) in the hemiboreal region of Europe (in Latvia). Individual trees’ CDs were measured using a drone orthophoto map. Afterwards, linear equations were developed to predict individual trees’ stem diameters at breast height (DBHs) and, consequently, tree AGB (which was then converted to C stock) from remote-sensed tree CD data. RMSEs of the prediction models of tree stem DBH were in the ranges of 1.87–2.12 cm for B. pendula and 2.50–3.12 cm for P. tremuloides × P. tremula. This demonstrated approach is applicable to carry out, for instance, a self-assessment and approximate C stock in the AGB of selected tree species by land owners, managers, and other implementers of climate change mitigation measures.

1. Introduction

At present, various active and passive remote sensing technologies based on different platforms (terrestrial, airborne, space-borne) are widely used in the estimation of both open-grown or scattered trees outside forest land and forest biophysical variables, including at the individual tree level (e.g., [1,2,3,4,5,6,7,8]). Results of previous studies have confirmed that remote-sensing estimation of crown variables is a quick and effective alternative to field measurements to characterize tree crown attributes reflecting the spatial distribution of tree branches and stems [2,6]. One of the tree crown attributes that may be determined using remote sensing technologies—if the boundary between the crowns of two adjacent trees is identifiable—is the tree’s CD, also called the crown width (the horizontal projection of a tree crown in a selected direction) [1,6,9,10]. Furthermore, it has been underlined that the CD is more accurately determined on large-scale photographs than on the ground, although this comparison involves certain limitations [9].
In general, the tree’s crown size reflects the growth of the tree due to the close relation of crown size to the photosynthetic capacity of a tree [2,10,11,12]. In addition, the tree’s crown mirrors the species-specific branching pattern (developed during phylogeny), as well as being a multipurpose ecological indicator reflecting site conditions and resource competition (developed during ontogenesis) [2,6,12]. Studies conducted so far have concluded that measurements of a tree’s CD can be used to predict the tree’s stem diameter (e.g., [3,13,14,15]) and to improve estimates of other tree biophysical variables including volume and biomass [1]. Estimating the tree stem diameter from the CD is of high interest because the tree stem diameter is a common tree dimensional characteristic that is used to quantify trees and their stand structure, tree biomass, and, consequently, sequestered C [3,14]. Furthermore, the quantitative information on tree CD and tree CD–stem diameter at breast height ratios may contribute to forest management (for instance, to devising thinning regimes and regulating stand density) and optimize forest ecological benefits [7,11].
During the last decade, in the land sector—including agriculture and forestry—international interest in capturing carbon dioxide (CO2) from the atmosphere has increased significantly. Furthermore, the need for urgent action regarding climate change mitigation is underlined by international climate policy such as, for example, the Paris Agreement [16] and the European Green Deal [17]. In the agricultural sector, effective C farming practices include tree introduction on agricultural land [18]. Recent global estimates show that increasing tree cover on agricultural land by 10% would sequester more than 18 Pg C [19]. Therefore, there is a growing need for both monitoring and quantitative estimation approaches (including self-assessment) of C stock captured and stored in tree biomass.
This study focuses on two fast-growing and economically significant deciduous tree species (B. pendula and P. tremuloides × P. tremula), planted in a regular grid on agricultural land in the hemiboreal region of Europe (in Latvia). Over the last ten years, B. pendula has been the most frequently planted deciduous tree species on agricultural land in Latvia (14,679 ha [20]), while the potentially fast-growing Populus spp. (aspen) has been used for afforestation and the establishment of plantation forests only on 723 ha [20], mostly due to the high risk of browsing damage (Figure 1). Lutter et al. (2021) recently estimated the climate benefit of different tree species, including B. pendula and P. tremuloides × P. tremula, on former agricultural land in northern Europe and concluded that the total climate benefit (expressed as the sum of removed CO2 from the atmosphere due to increased C stocks in stem wood, branches, and roots, and avoided CO2-emissions related to substitution effects) over 100 years is 782 Mg CO2 eqv. ha−1 for B. pendula and 771 Mg CO2 eqv. ha−1 for P. tremuloides × P. tremula [21]. Regarding the climate benefits that arise from tree introduction on agricultural land, in addition to the selected tree species, the annual increments in biomass, the outcome of assortments from harvested wood, and the length of the rotation cycle are of great importance [21]. Current national legislation in Latvia states that the maximum growing cycle of permanent plantations in agricultural land without a land-use-type change “is up to 15 years after which the crop is renewed or the use of the land for the growing of other agricultural crops is continued” [22]. At the same time, Populus spp. plantations can be declared as short rotation coppices (SRC) with a maximum rotation of five years and are eligible for direct payments [23]; however, only 49.5 ha of Populus spp. SRC was declared for the receipt of direct payments under the common agricultural policy in 2022 in Latvia [24]. An alternative option for tree introduction on agricultural land is the establishment of plantation forests—forest stands established through afforestation—but this action involves a land-use-type change from agricultural land to forest land and a land registration in the State Forest Register. In 2022, 1519 ha plantation forests of B. pendula and 49 ha plantation forests of Populus spp. were established in Latvia, and the dynamics since 2013 are shown in Figure 1 [20].
Recent technological developments and the availability of remote-sensing methods are revolutionizing the approaches to tree-dominated ecosystem studies [3]. In addition, remote-sensing methods have become more and more available to different monitoring programmes and land owners and managers [25]. Thus, the request for approach descriptions, protocols, and general allometric models for estimating both the stem diameter and AGB based on remote sensing data is increasing. The objective of this study was to estimate individual trees’ CDs of selected tree species (B. pendula and P. tremuloides × P. tremula) using a drone orthophoto map—which, compared to other data formats, is easy to obtain, create, and understand—as well as to estimate relationships between individual trees’ CDs and their stem DBHs and to demonstrate the prediction approach of sequestered C in tree AGB based on developed equations linking individual tree CD and stem DBH. We hypothesized that tree CD—a variable that is relatively easy to determine using remote sensing techniques—can be used for the prediction of stem DBH and, consequently, tree biomass and sequestered C in tree AGB.

2. Materials and Methods
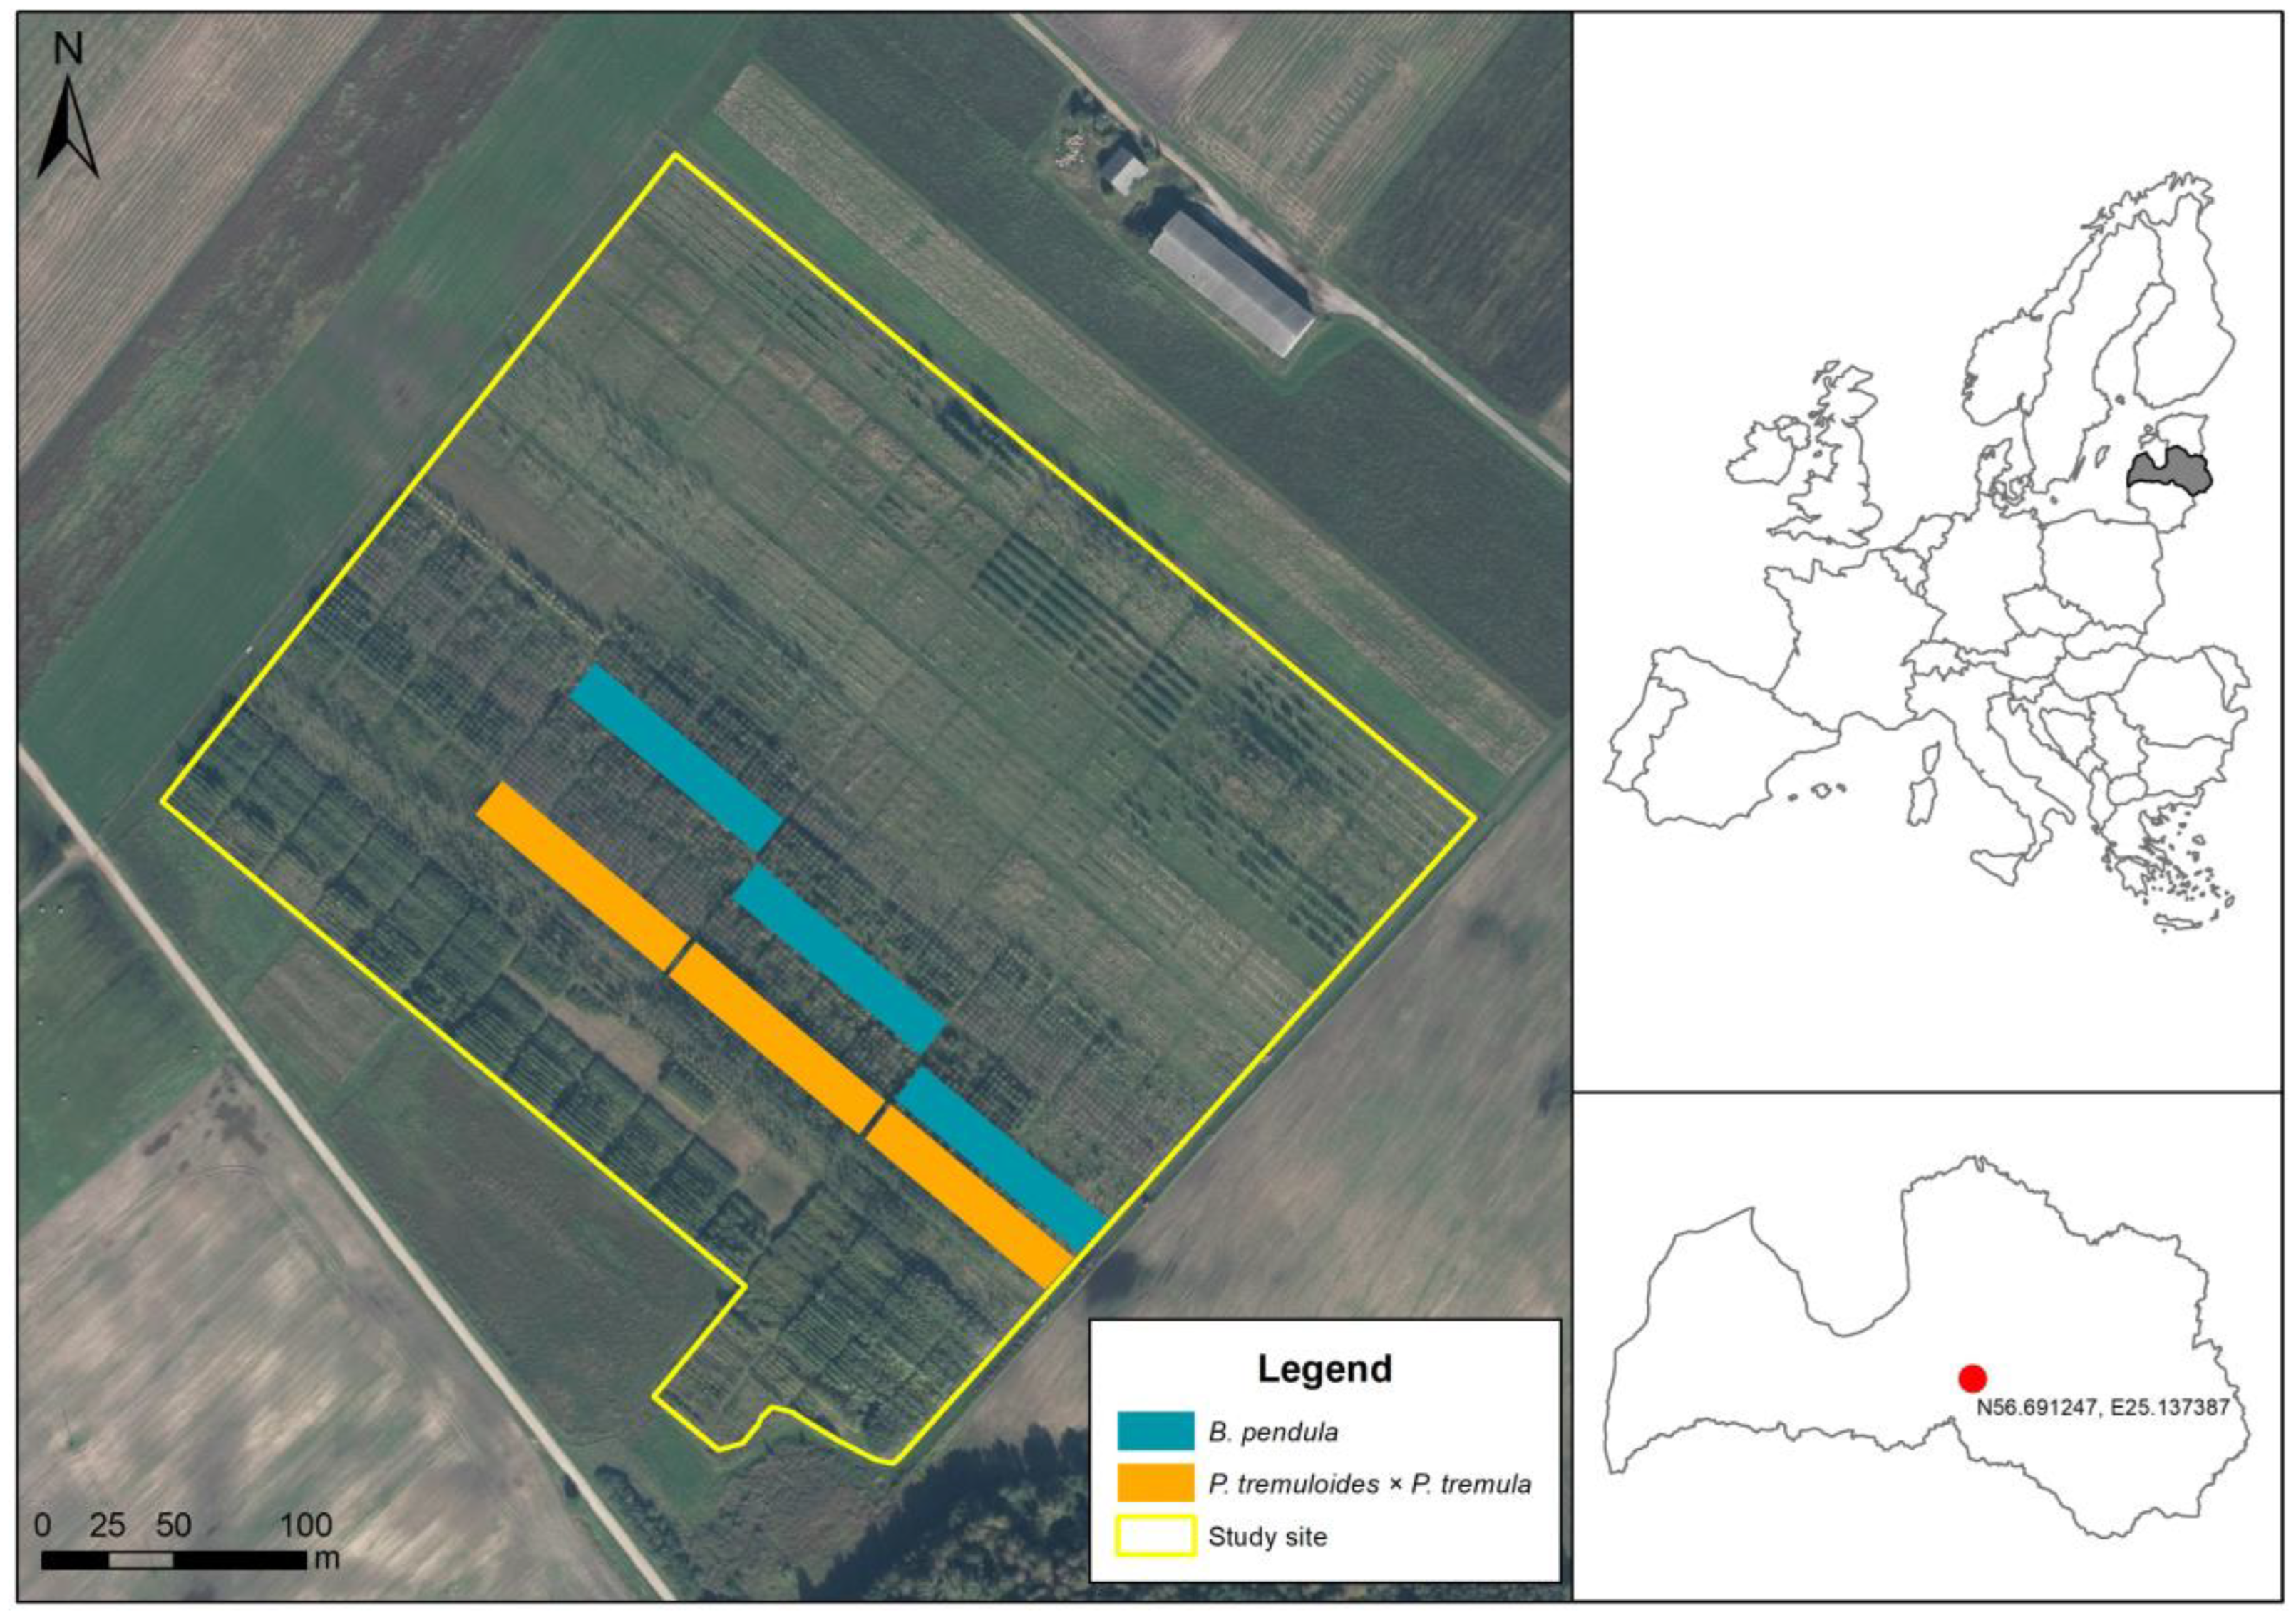
2.1. Study Site

The study was conducted on a deciduous tree (B. pendula and P. tremuloides × P. tremula) plantation (56.691247, 25.137387) established in 2011 on agricultural land (former cropland) with mineral soil (Luvic Stagnic Phaeozem, Hypoalbic and Mollic Stagnosol, Ruptic, Calcaric, Endosiltic [26,27]) in the central part of Latvia, Skrīveri district (Figure 2). In the topsoil (0–20 cm depth), the dominant soil texture class was loam, while the deeper soil layers (20–80 cm depth) were sandy loam.
In the period of 2011–2022, in the study area, the mean annual air temperature ranged from 6.06 °C (in 2012) to 8.67 °C (in 2020) with mean of 7.46 °C, while the annual precipitation ranged from 558 mm in 2019 to 935 mm in 2012 with mean of 772 mm [28].
One-year-old container seedlings of B. pendula and P. tremuloides × P. tremula were planted in the spring of 2011. Distance between trees (planting spot) was 2.5 × 2.5 m for B. pendula and 2.0 × 2.0 m for P. tremuloides × P. tremula, stand density was 1600 and 2500 trees ha−1, respectively (according to the best practices in the region and restrictions for establishment of plantation forests and SRC for energy wood production [29]). Producer of B. pendula seedlings was JSC “Latvijas Finieris” nursery “Zābaki” (Latvia); producer of P. tremuloides × P. tremula seedlings was JSC “Latvia’s State Forests” seeds and plants “Kalsnava” (Latvia). Seedlings of each tree species were planted in 12 plots with an area of 0.044 ha each; the experiment (16 ha in total) was established to estimate impact of application of wood ash, wastewater sludge, and by-product of biogas production (digestate) on biomass production of different deciduous trees and various environmental variables (e.g., [30,31]). Plantation was fenced in autumn 2012 to avoid browsing damage. In 2022, all trees were counted and survival rate for initially planted B. pendula was 69.1%, while for P. tremuloides × P. tremula, 72.1% (trees with DBH < 6.00 cm were counted as shoots and excluded from survival rate estimation).

2.2. Estimation of Tree Crown Diameter

The trees’ horizontal CDs of B. pendula and P. tremuloides × P. tremula were measured using a drone orthophoto map taken in February 2022 (when the ground was covered with snow). The CDs of all standing trees of corresponding tree species, including shoots in P. tremuloides × P. tremula plantation, were measured. Measurements of the tree crowns were taken manually in two directions at the widest point, corresponding to the rows and columns of trees planted (in the SW–NE and NW–SE directions, Figure 3). In total, 2156 trees were measured—including 856 B. pendula and 1300 P. tremuloides × P. tremula—in ArcGIS software (ArcGIS 10.2.2.). Images for the orthophoto map were captured at a height of 100 m, with a density of 24 images per 1 hectare, and, later on, processed in Agisoft Metashape software (Agisoft Metashape Professional 1.8.5).

2.3. Measurements and Calculations of Additional Variables

In February 2022, stem DBH of all individual trees was measured. Tree height was calculated using DBH–height curve developed based on tree height measurements of sample trees (139 sample trees of B. pendula with DBHs ranging from 2.5 to 15.4 cm and height ranging from 5.1 to 13.5 m; 144 sample trees of P. tremuloides × P. tremula with DBHs ranging from 2.7 to 19.0 cm and height ranging from 5.0 to 19.5 m), according to the Naslund (1937) [32]. The above-ground biomass (AGB) of the surveyed trees was calculated using allometric models developed in Latvia and recommended for reporting the biomass stock in Latvia (R2 is 0.987 and RSME is 19.0 for B. pendula; R2 is 0.984 and RMSE is 17.4 for P. tremuloides × P. tremula) [33]. Individual trees’ AGB ranged up to 83.8 kg for B. pendula (average 26.5 ± 0.6 kg) and up to 132.2 kg for P. tremuloides × P. tremula (average 30.7 ± 0.8 kg), while tree height ranged up to 12.8 m for B. pendula (average 10.6 ± 0.1 m) and up to 18.1 m for P. tremuloides × P. tremula (average 12.4 ± 0.1 m). To calculate C stock in tree AGB, it was assumed that the C content in biomass is 48% for both tree species [34,35].
In addition, several variables characterizing competitive conditions of trees were calculated from orthophoto map: (i) average distance to the eight-nearest trees; (ii) average distance to the four-nearest trees; (iii) minimum distance of the nearest tree; (iv) maximum distance to the one of the four-nearest trees.

2.4. Statistical Analysis

All statistical analyses were conducted using R [36]. Normal distribution and homogeneity of variance of the data were tested using a Shapiro–Wilk normality test and Quantile-Comparison Plot (function “qqPlot()” from R package “car” [37]). Significance of difference in trees’ CDs between two measurement directions (SW–NE and NW–SE) grouped by tree species was evaluated using the Wilcoxon signed-rank test with continuity correction. To relate individual trees’ CD values to other tree variables (stem DBH and tree biomass), simple regression analysis and Pearson’s correlation (r) analysis were carried out. A significance level of p < 0.05 was used. The root mean square error (RMSE) was used to measure how far model’s predicted values (tree stem diameter and biomass) were from observed/actual values in a regression analysis.
In the box plots (R package “ggplot2” [38]), the medians are shown as bold lines, the mean values are shown as yellow squares, the boxes correspond to the lower and upper quartiles, the whiskers show the minimal and maximal values (within 150% of the interquartile range from the median), and the black dots show outliers of the datasets.

3. Results

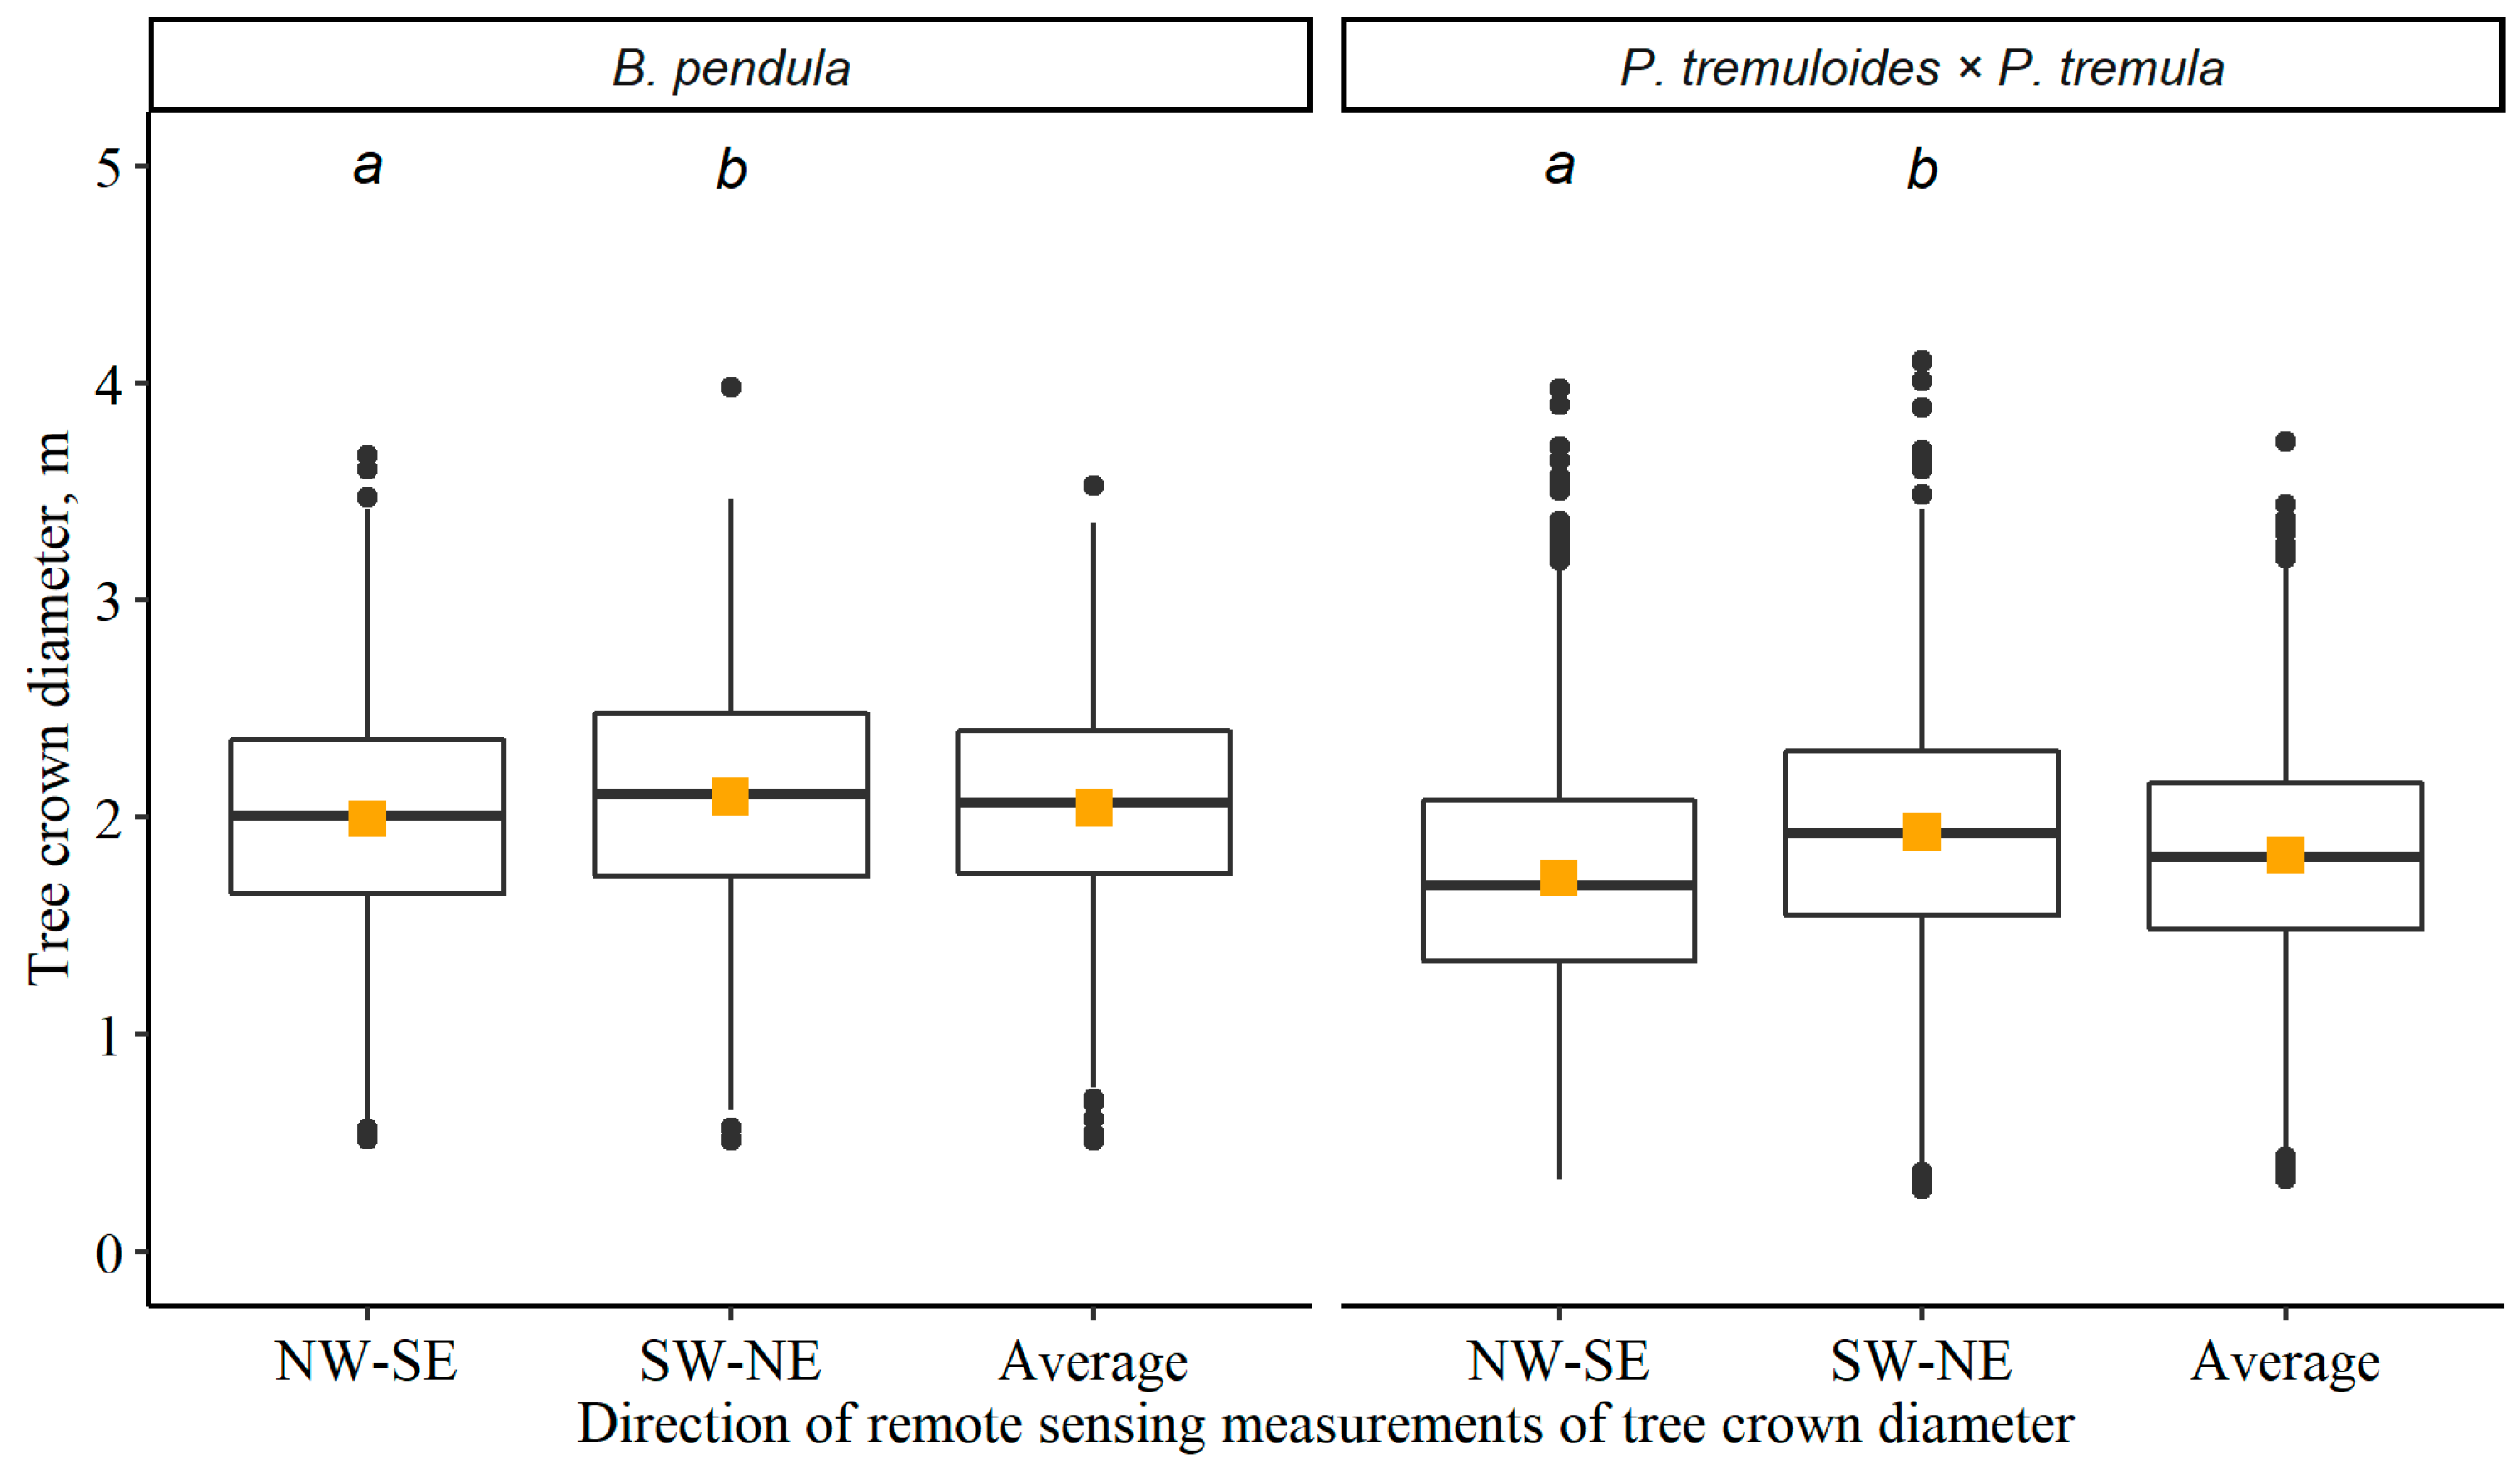
3.1. Tree Crown Diameter and Impact of Survival of the Adjacent Trees

The average tree CD of B. pendula in an 11-year-old plantation grown on agricultural land with mineral soil (measurements of all trees are pooled regardless of survival of the adjacent tree) ranged up to 3.53 m with an average of 2.04 ± 0.02 m (mean value ± S.E. here and further in the text), while the average tree CD of P. tremuloides × P. tremula ranged up to 3.73 m with an average of 1.82 ± 0.02 m (Figure 4). The difference in the trees’ CDs for the same tree species measured in two different directions is statistically significant (p < 0.001), there were higher tree CDs estimated in the SW–NE direction for both tree species (by 0.10 m for B. pendula and 0.21 m for P. tremuloides × P. tremula). Nevertheless, positive correlations between the tree crown diameters estimated in different directions were found (r = 0.72 for B. pendula and r = 0.63 for P. tremuloides × P. tremula, Figure 5).
Gaps of non-surviving trees in plantations, where trees are planted in a regular grid, can provide additional space for tree crown development. To estimate the impact of the survival of adjacent trees on a tree’s CD, we related the average tree CD of individual trees to several variables that characterize the competitive conditions of trees, including the average distance to the four- and eight-nearest trees, and the minimum and maximum distance of the four-nearest trees. The average distance to the four-nearest trees ranged up to 4.60 m for B. pendula and 4.18 m for P. tremuloides × P. tremula, while the average distance to the eight-nearest trees ranged up to 5.27 m for B. pendula and 5.04 m for P. tremuloides × P. tremula. The average distance to both the four- and eight-nearest trees is smaller for P. tremuloides × P. tremula (2.30 ± 0.01 m and 2.88 ± 0.01 m, respectively) than for B. pendula (2.81 ± 0.01 m and 3.51 ± 0.01 m, respectively) due to the difference in tree planting design (a 2.5 × 2.5 m grid for B. pendula and a 2.0 × 2.0 m grid for P. tremuloides × P. tremula). The minimum average distance of the nearest trees ranged up to 3.46 m for B. pendula and 4.07 m for P. tremuloides × P. tremula, indicating the non-surviving trees. The maximum average distance of the four-nearest trees ranged up to 5.49 for B. pendula and 5.27 m for P. tremuloides × P. tremula. However, only weak correlations (r < 0.38) between the average tree crown diameter and the selected values characterizing the competitive conditions of trees were found.

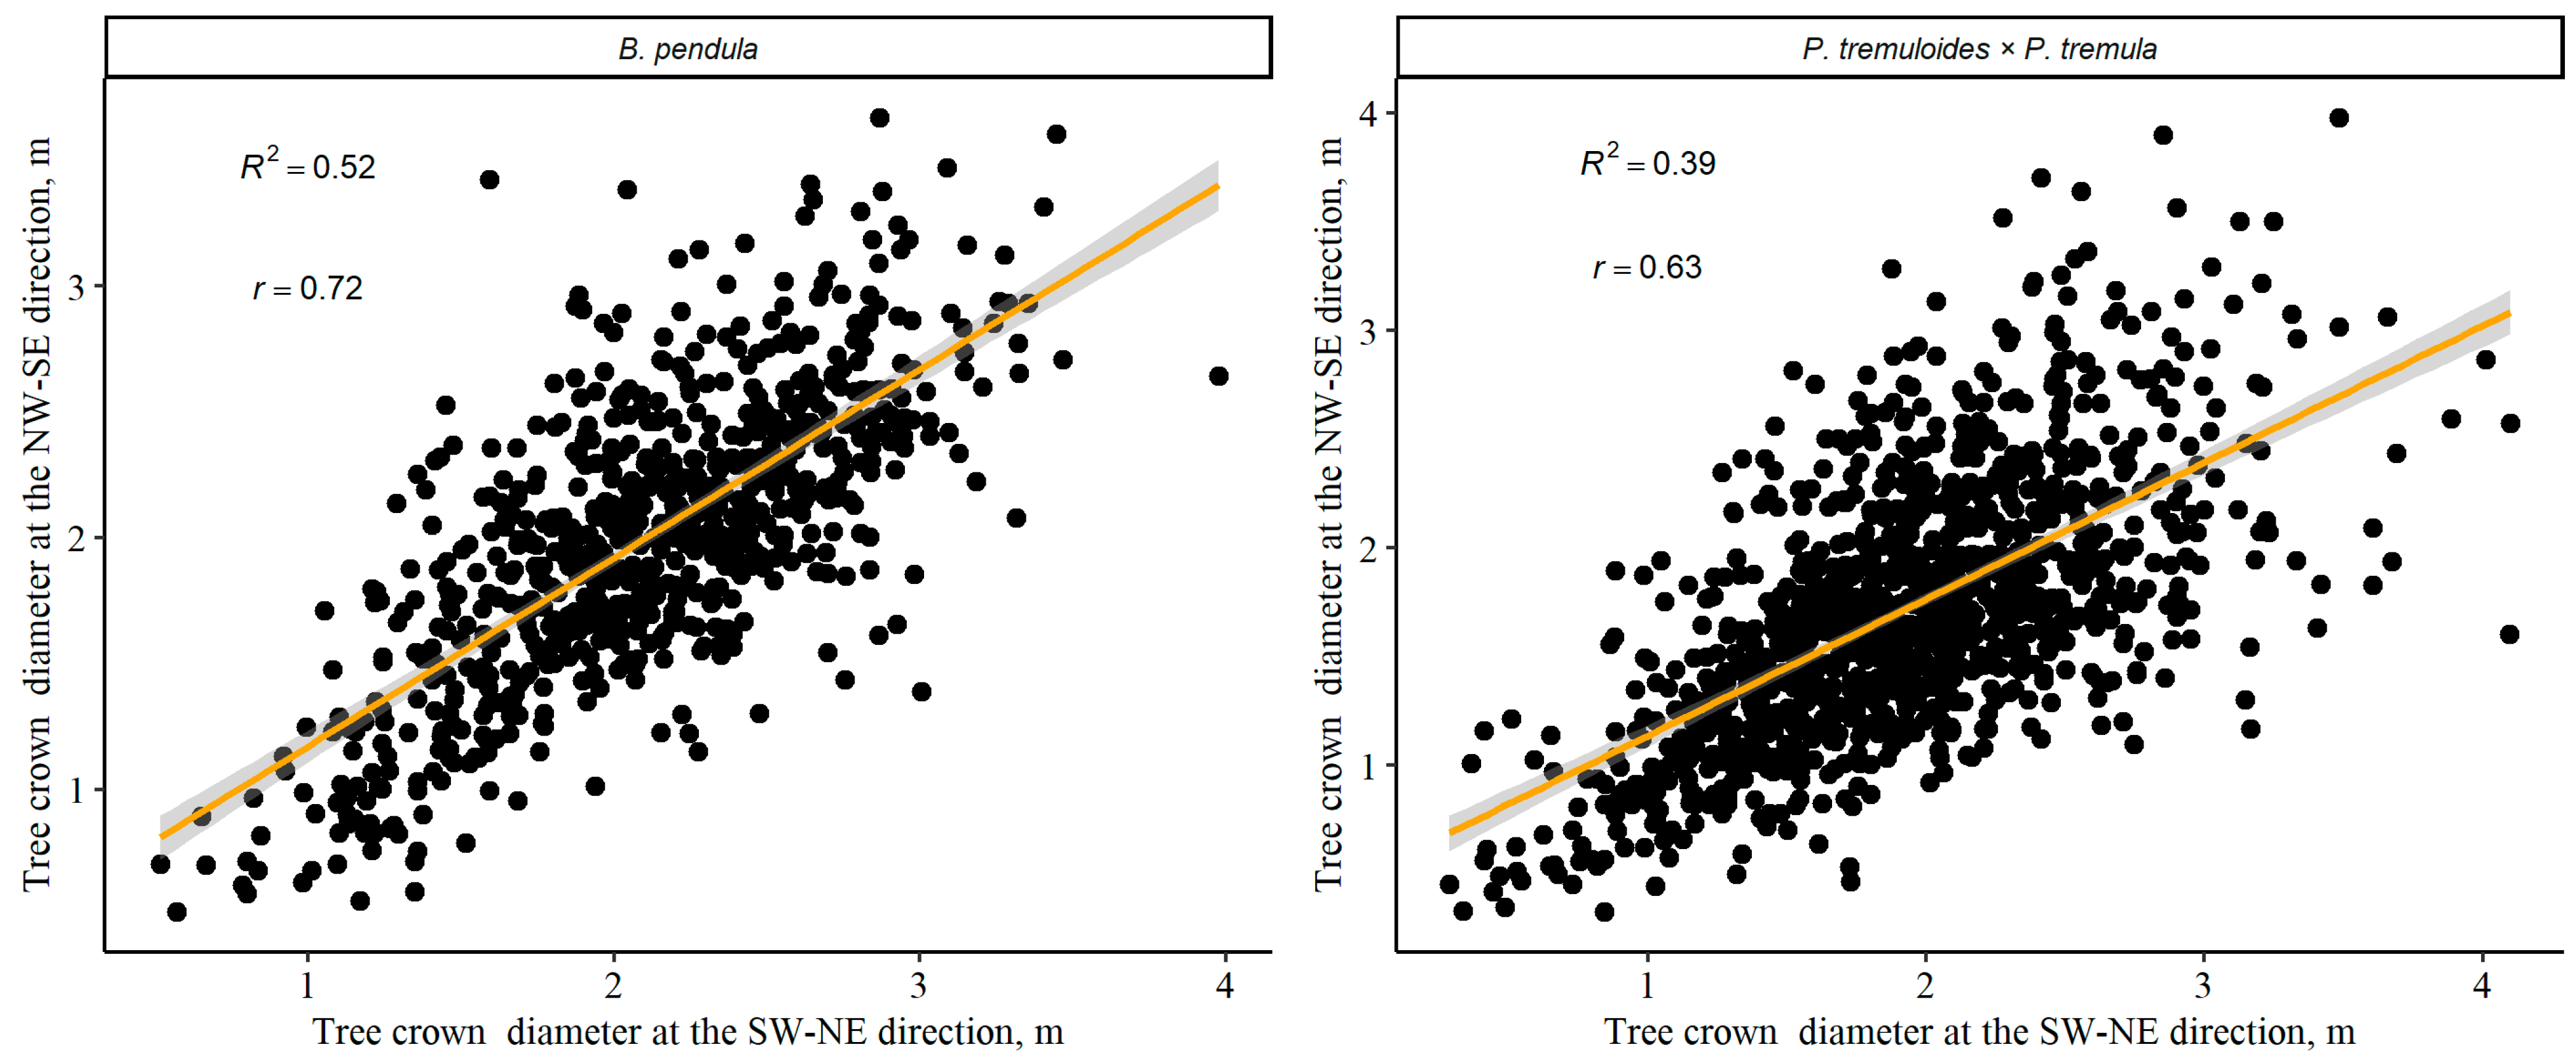
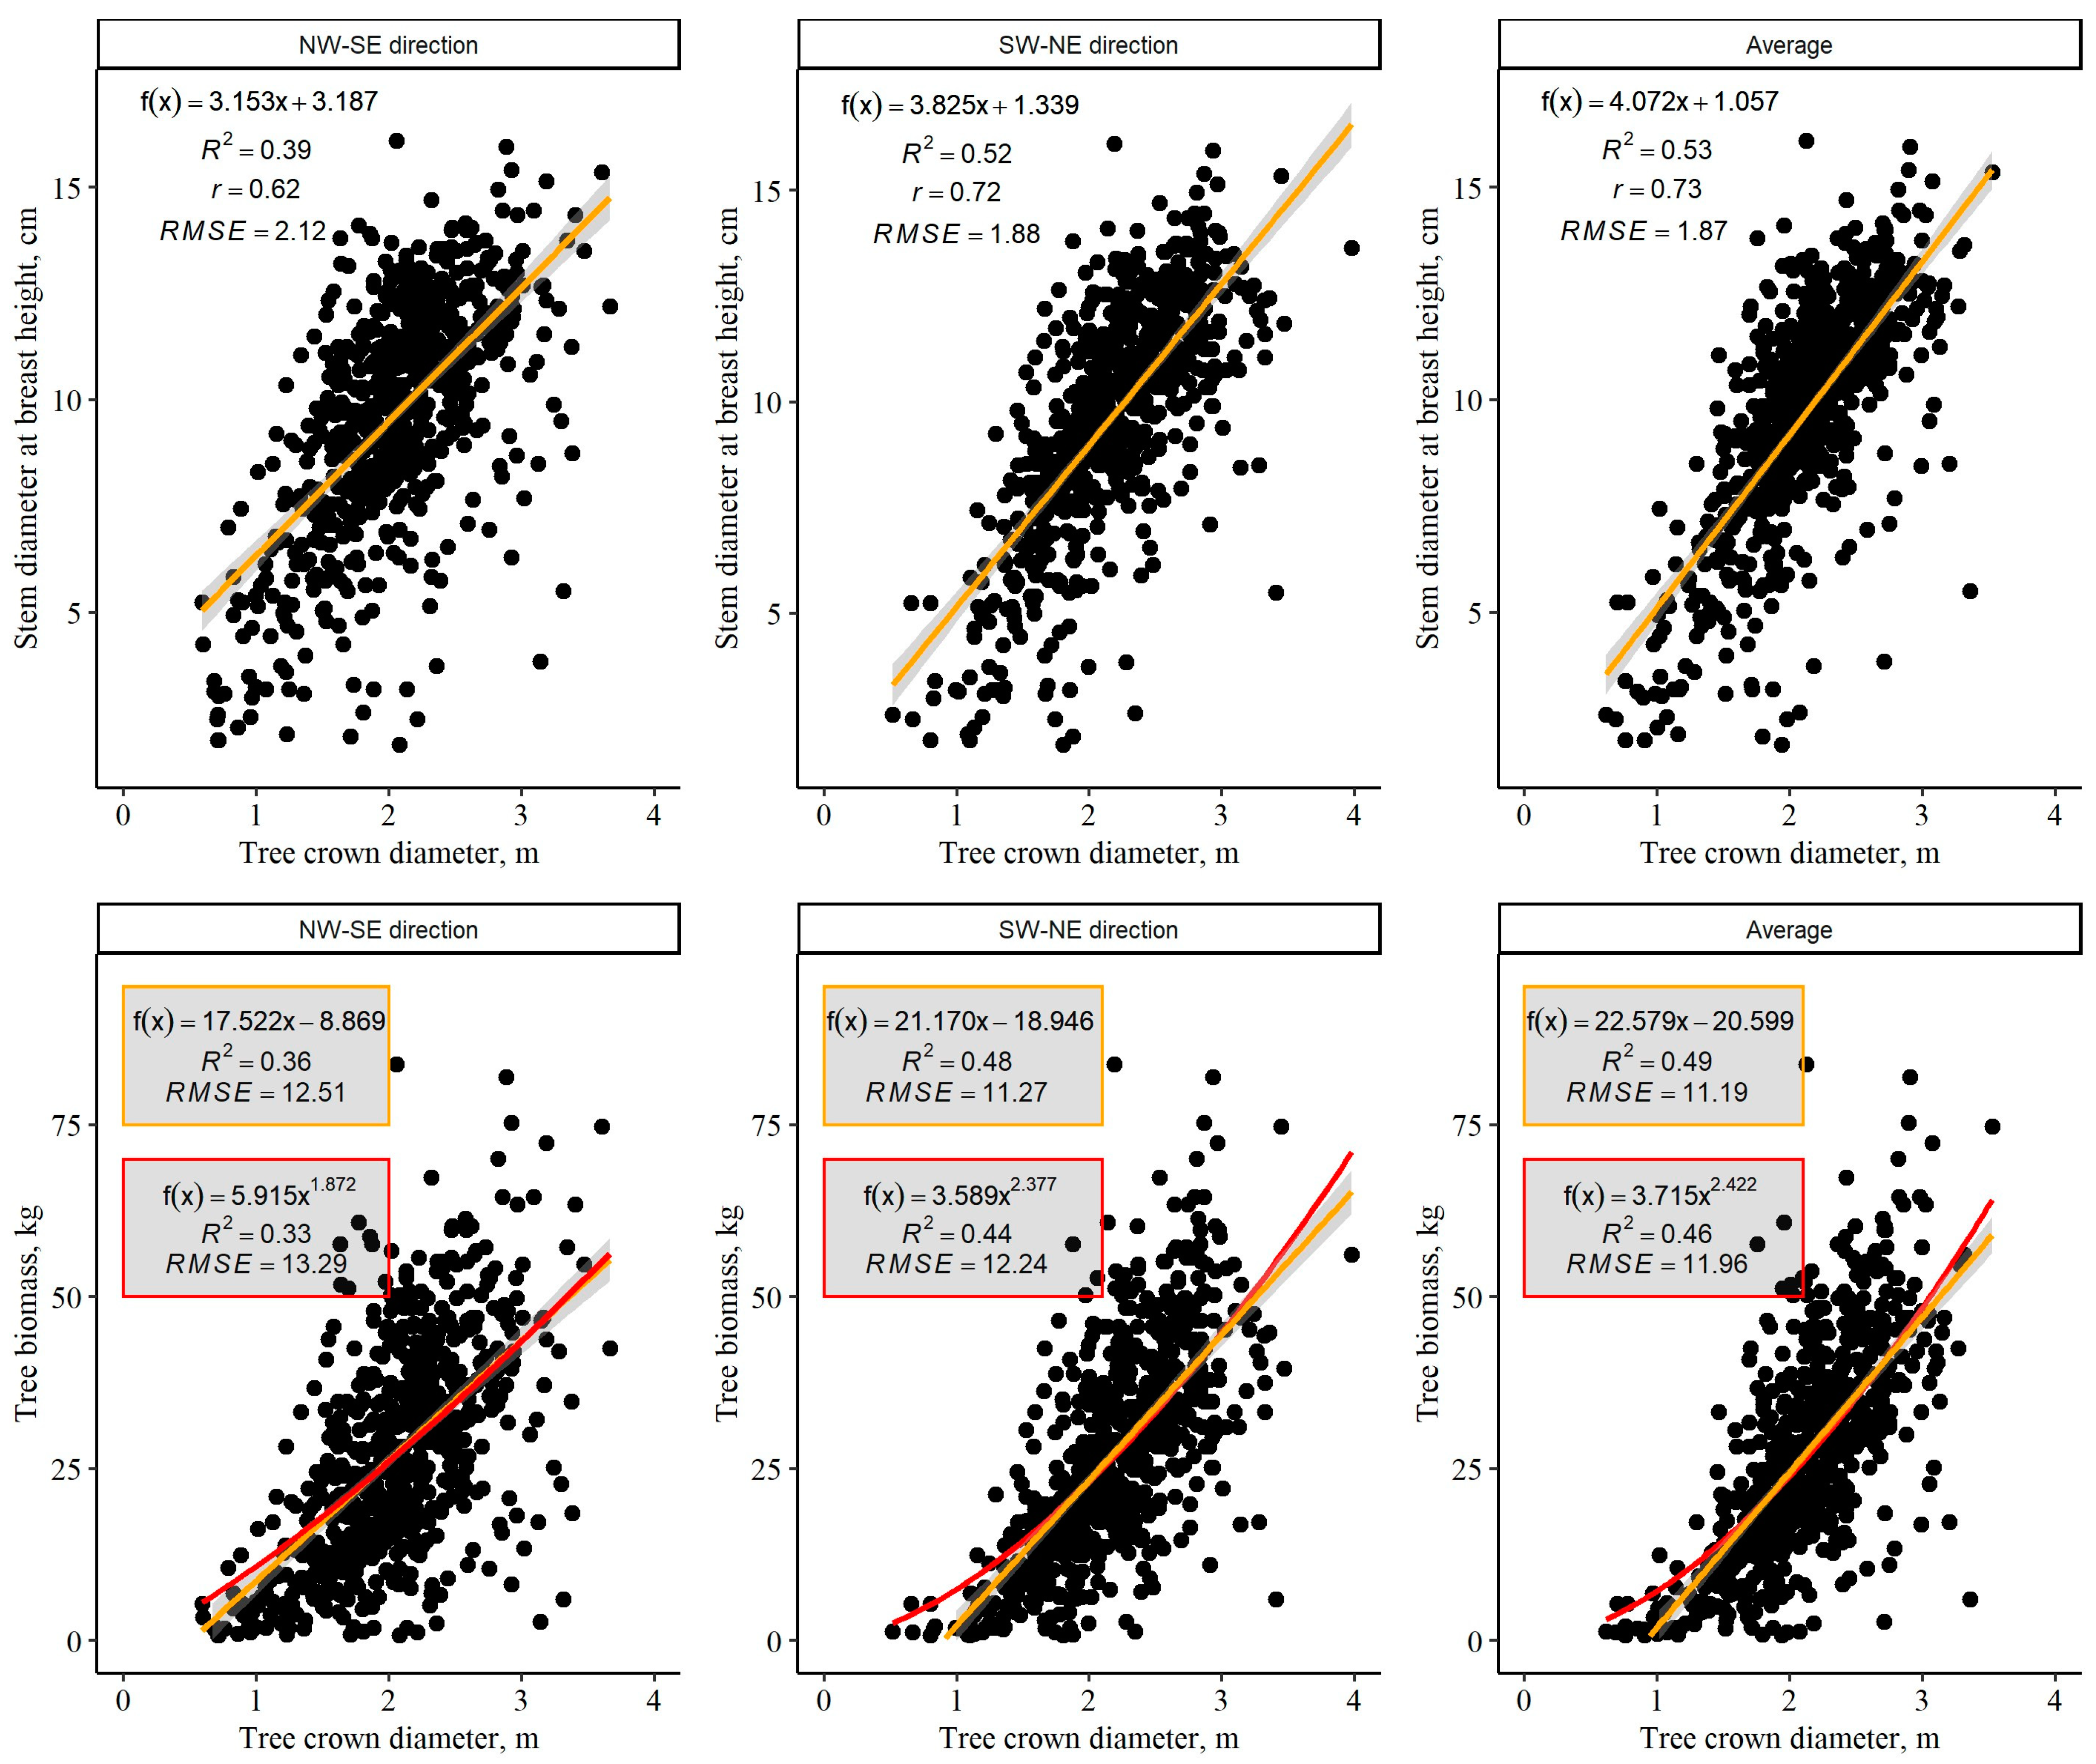
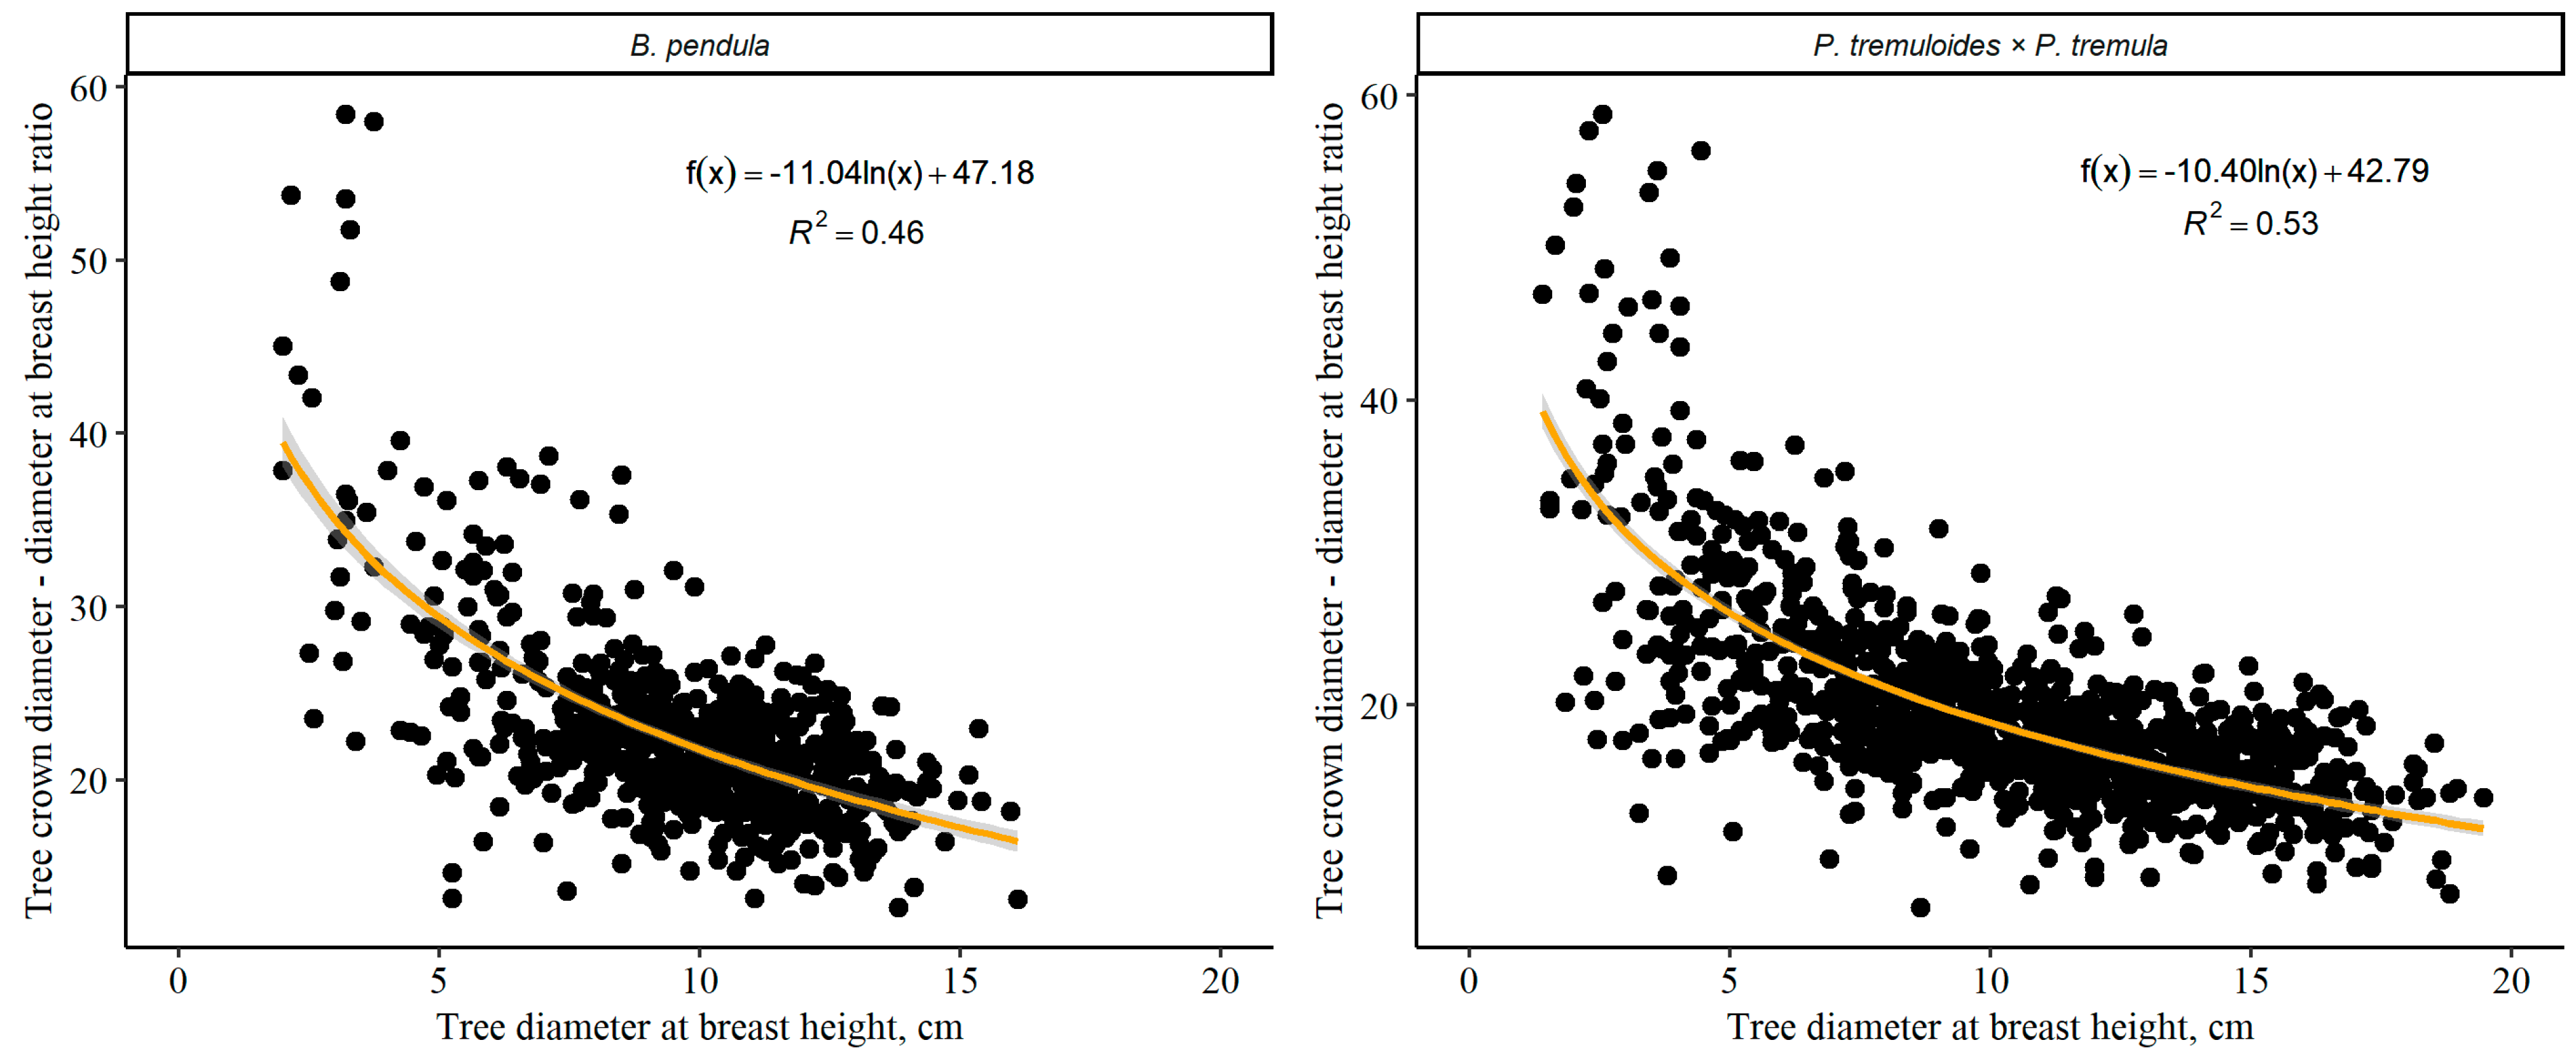
3.2. Relationship between Individual Tree Crown Diameter and Other Tree Variables

Simple linear regressions (p < 0.001) describing the relationships between individual tree CD and stem DBH as well as biomass of B. pendula and P. tremuloides × P. tremula are shown in Figure 6 and Figure 7, respectively. For B. pendula, the strongest correlation was found between the individual trees’ CDs (average of the SW–NE and NW–SE directions) and stem DBHs (R2 = 0.53, r = 0.73). While for P. tremuloides × P. tremula, the strongest correlation was found between the individual trees’ CDs measured in the SW–NE direction and stem DBHs (R2 = 0.58, r = 0.76). For both tree species, weaker correlations were found between the individual trees’ CDs and AGB (R2 ranged from 0.27 to 0.51, r ranged from 0.52 to 0.71). The tree stem DBH is a directly measured tree variable, unlike tree AGB, which is a calculated tree variable based on stem DBH and, thus, includes some uncertainty. This could also be one of the reasons for the stronger correlations between the tree CD and stem DBH, compared to tree AGB.
We tested the agreement (linear model) between the predicted stem diameter from remote-sensed CD data and field data based on RMSEs, which were in the range of 1.87–2.12 cm for B. pendula and 2.50–3.12 cm for P. tremuloides × P. tremula. RMSEs describing the agreement between the predicted individual trees’ AGB from remote-sensed CD data and the calculated values based on field stem DBH data (linear model) were in the range of 11.19–12.51 kg for B. pendula and 18.53-22.55 kg for P. tremuloides × P. tremula.
Since the analyzed dataset was obtained in an 11-year-old tree plantation and does not include a sufficient quantity of trees with smaller CDs (<1 m), the developed models (linear equations, Figure 6 and Figure 7) have usage limitations—these models are not applicable in the cases of trees with a small value for CDs. Thus, in situations where the linear model generates negative values of tree AGB, the use of a non-linear (power) model is more suitable, although the RMSEs of non-linear models are slightly higher than those of linear models (Figure 6 and Figure 7).
Figure 8 illustrates the tree crown diameter–stem diameter at breast height ratios, (CD/DBH ratios) at different stem DBHs for B. pendula and P. tremuloides × P. tremula. The patterns of changes in CD/DBH ratios at different stem DBHs are similar for both tree species—the CD/DBH ratio reduces as the stem diameter increases. The CD/DBH ratio was slightly higher for B. pendula than for P. tremuloides × P. tremula at the same stem DBH.

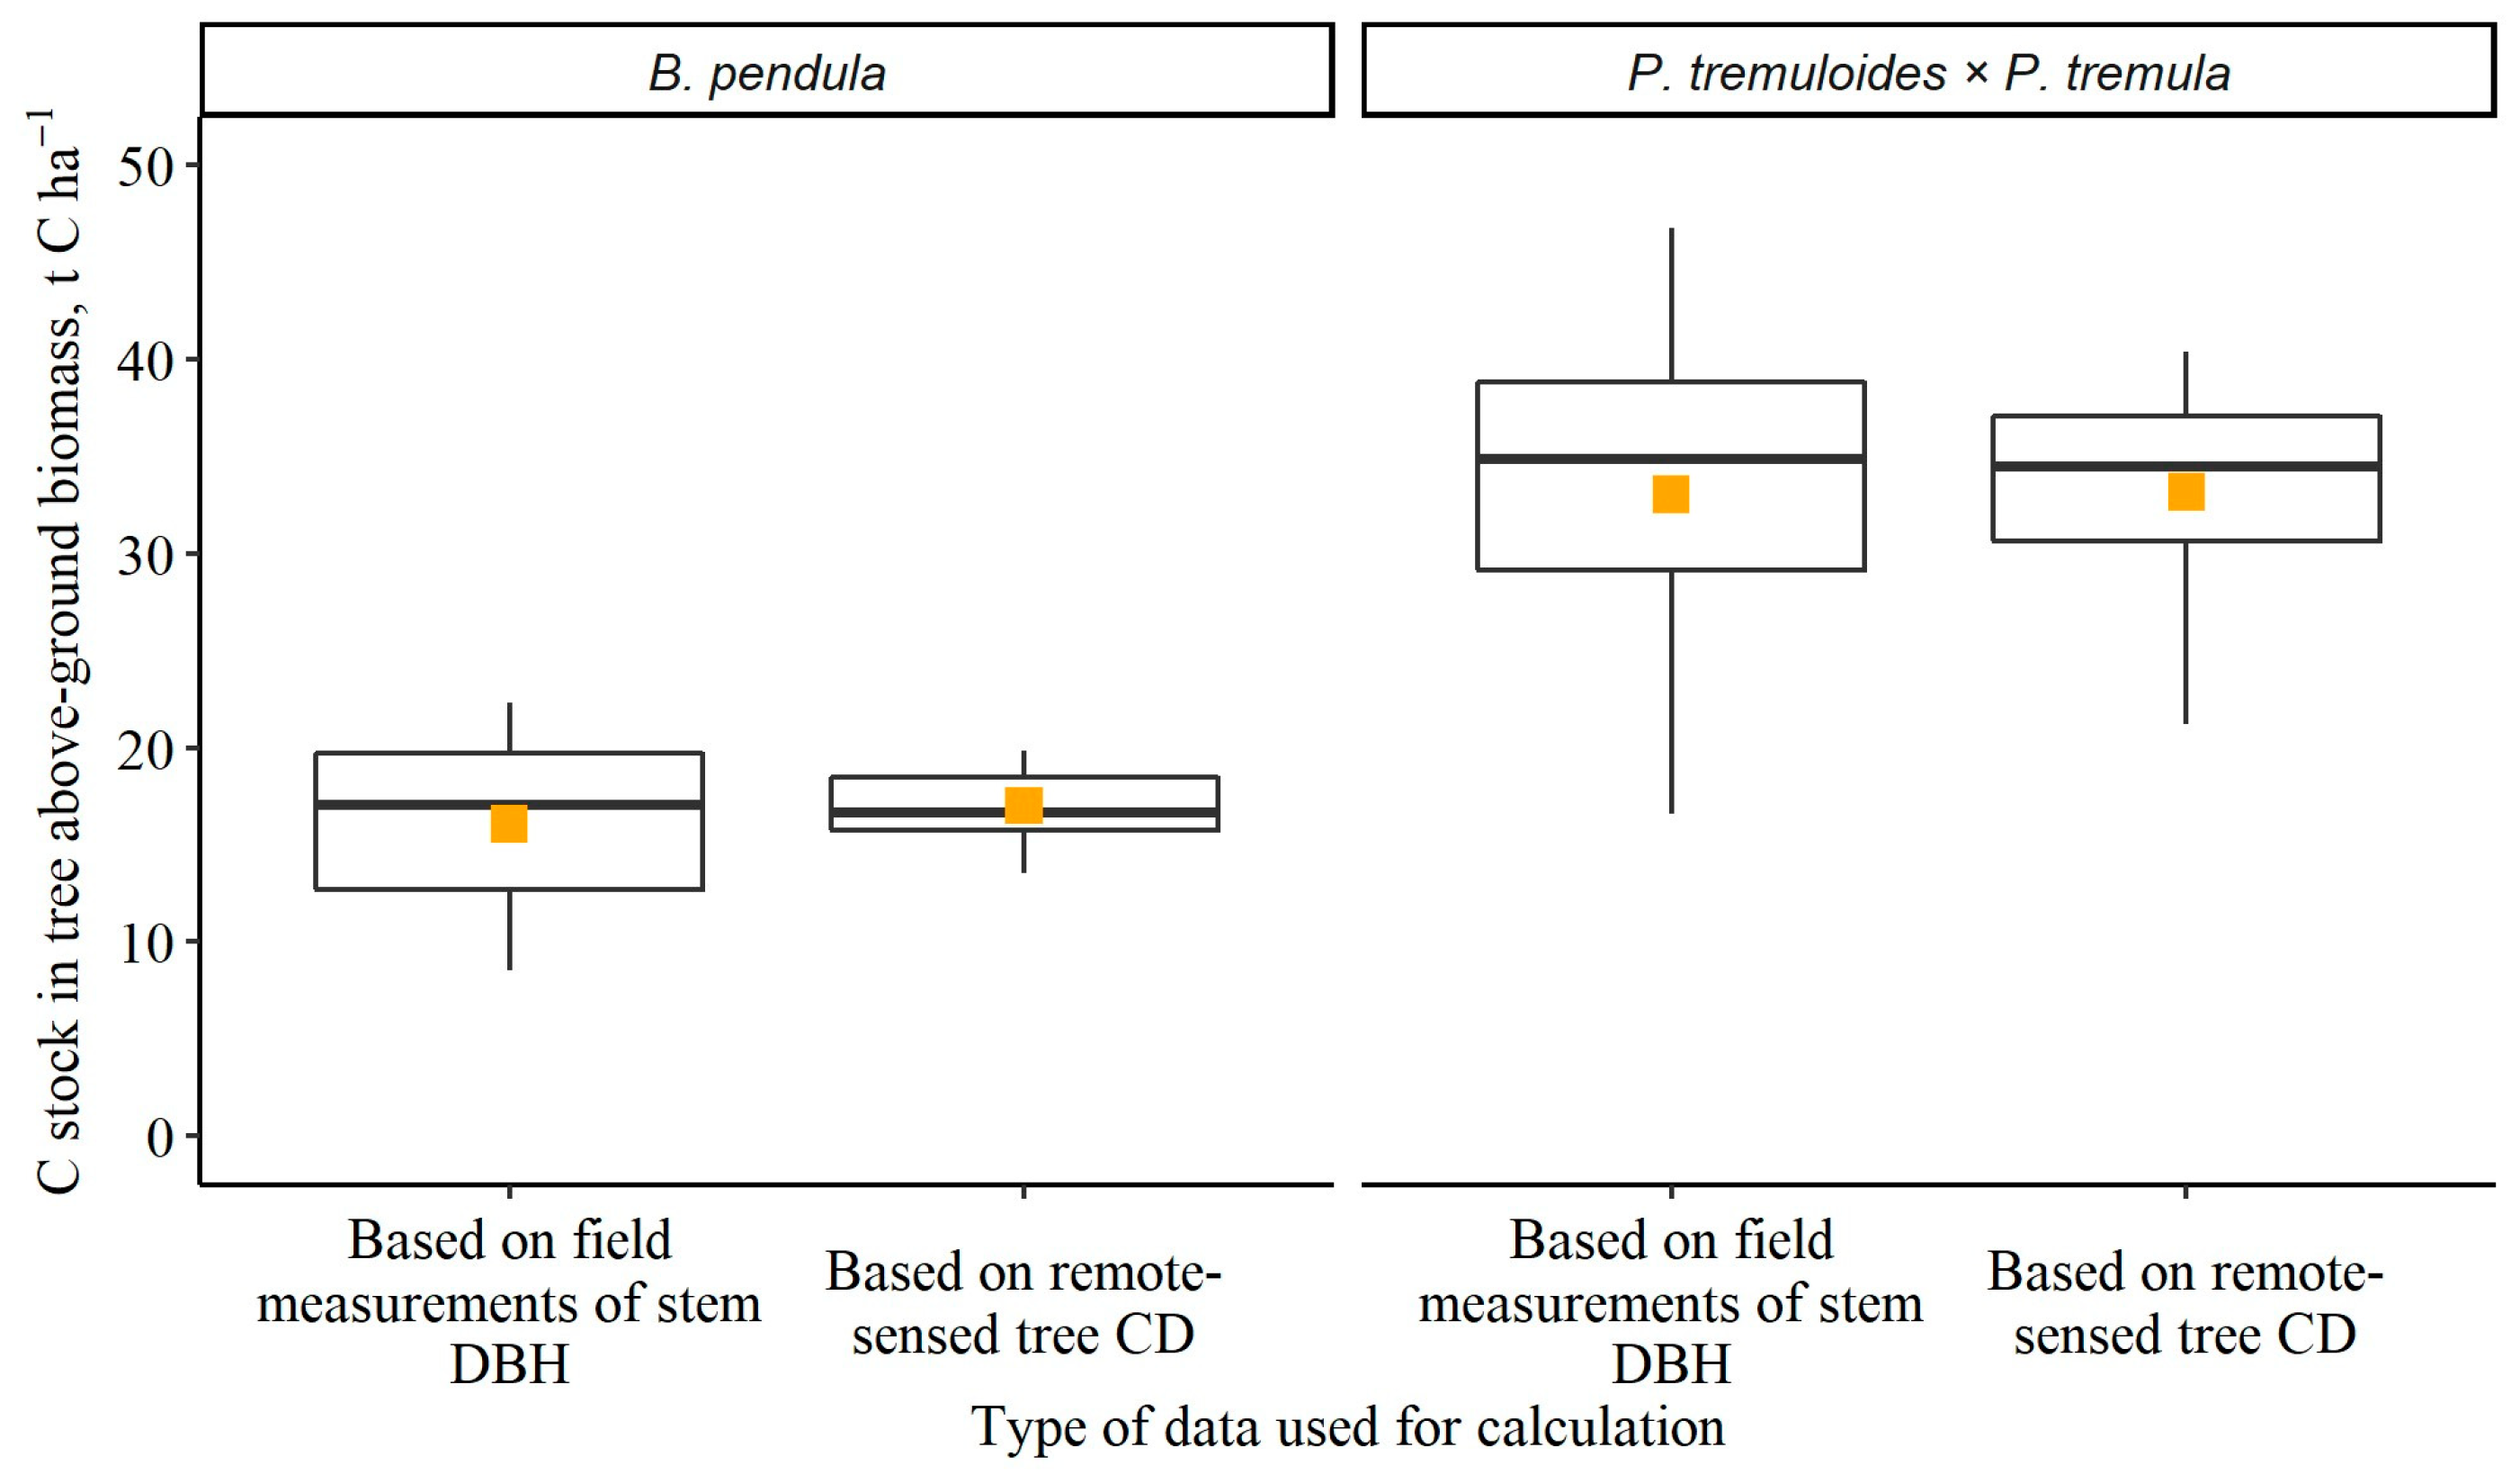
3.3. Estimation of Approximate C Stock in Tree Above-Ground Biomass

To analyse the possibilities of use of the remote-sensed tree CD data and the elaborated equations describing the relationship between individual trees’ CDs and AGB (Figure 6 and Figure 7) to calculate the approximate C stock in tree AGB, we compared the results of the C stock calculations (Figure 9) based on (i) direct (field) measurement data of tree stem DBH, and (ii) based on remote-sensed (CD) data and the elaborated equations (Figure 6 and Figure 7). The average C stock in tree AGB in an 11-year-old plantation of B. pendula is 16.1 ± 1.3 and 17.0 ± 0.6 t C ha−1, according to the calculations based on direct (field) measurement data of the tree stem DBH and based on remote-sensed tree CD data and the elaborated equations, respectively. The average C stock in tree AGB in plantations of P. tremuloides × P. tremula is higher at 33.1 ± 2.7 and 33.2 ± 1.8 t C ha−1, according to the calculations based on direct (field) measurement data of the tree stem DBH and based on remote-sensed tree CD data and the elaborated equations, respectively. The difference in the result of calculated C stock in tree AGB between both types of calculations is 5.7% for B. pendula and 0.4% for P. tremuloides × P. (thus, within the range of uncertainties).

4. Discussion and Conclusions

This study focused on two deciduous tree species (B. pendula and P. tremuloides × P. tremula) planted in a regular grid on agricultural land in the hemiboreal region of Europe (in Latvia). Both studied tree species are fast-growing, with a conical/pyramidal crown, and are light demanding; thus, crown competition influences growth and yield [39,40,41]. The results of tree CD estimates in the 11-year-old plantation showed that the average tree CD of B. pendula (2.04 ± 0.02 m) is slightly wider than the average CD of P. tremuloides × P. tremula (1.82 ± 0.02 m). Also, the tree CD/DBH ratio was slightly higher for B. pendula than for P. tremuloides × P. tremula at the same stem DBH. The difference in average CD between both tree species could be explained by both different species-specific branching patterns and different distances between the trees in rows. B. pendula seedlings were planted with a slightly wider distance between the trees, providing more space for wider crown development. We found that the average tree CD measured in the SW–NE direction is wider for both tree species. Thus, tree crowns were asymmetric, and elongated parallel to the direction of the more abundant incoming solar radiation and prevailing winds (SW direction). This is in line with previous studies, which explain the asymmetry of tree crowns as combinations of different factors such as local competition, the directionality of solar radiation, neighbourhood stand structure, and topographical site conditions (e.g., [42,43]).
As ~30% of the initially planted trees on the plantation did not survive, we analysed the impact of competitive conditions on individual trees’ CDs (the presence of adjacent trees). No statistically significant impact of non-surviving adjacent trees on CD was detected, although several individual cases of a clear impact of competitive conditions on individual trees’ CDs were observed based on the visual assessment of the orthophoto map. However, in general, the results show that the planting design (distance between the trees in rows) has been chosen optimally and that the trees have not yet reached such dimensions as to compete with each other for resources. For instance, a study in Western European conditions concluded that the distance between target B. pendula should be around 8–12 m to produce stems with a DBH of 40–60 cm [44]. At the same time, Hemery et al. (2005)—based on their elaborated regression parameters for predicting tree CD from DBH and vice versa—calculated that in fully occupied stands with no crown overlap when the mean DBH are 60 cm and CD is 12.7 m, the numbers of trees per hectare is 86 [11]. These mentioned research results, as well as the results of our study, demonstrate the possibilities of applying developed equations between tree CD and stem DBH in the management of tree plantations (for instance, thinning regimes) and underline that the distance between planted trees should be selected, among other factors, based on the planned length of the rotation cycle.
The results of the current study show that individual tree CD data obtained from a drone orthophoto map can be used to predict tree DBH with acceptable accuracy and, consequently, to approximate tree AGB in B. pendula and P. tremuloides × P. tremula plantations. Usually, to estimate the tree biomass from stem DBH and height, different allometric models and conversion equations—including stand height curves elaborated from measurements of only some trees representing different diameter classes (small, medium, and large)—were used. A similar approach—where models are developed from the field measurements of the DBH of only some trees of different diameter classes—could be used to predict tree DBH and, consequently, tree AGB from tree CD data obtained from a drone orthophoto map. Previous studies across the world’s forests as well as for individual tree species have shown that estimating the tree stem diameter and AGB from attributes that can be remotely sensed requires accounting for both the CD and tree height [3,13,15,45]. Within this study, the CD was the only measured variable; to measure tree height remotely, a digital elevation model (DEM) is necessary but acquiring a DEM is a more complex process. Nevertheless, developed models where the CD is the only independent variable are suitable for individual trees’ DBH prediction; RMSEs were in the range of 1.87–2.12 cm for B. pendula and 2.50–3.12 cm for P. tremuloides × P. tremula. Based on the conclusions of previous studies [3,13,15], it is very possible that the precision of the models developed within this study may be increased by adding tree height as a second independent variable; thus, tree height is desirable to include in future studies and model development. It must also be taken into account that the tree CD/DBH ratio reduces as the stem diameter increases. This is in line with previous studies that, in addition, concluded that the CD/DBH ratio begins to stabilize around a stem DBH of 30 cm [11]. Thus, the goodness-of-fit of models predicting stem DBH from tree CD data could be even higher for trees with a DBH higher than 30 cm. Our study covered trees with a DBH of limited range—up to 16.1 cm for B. pendula and up to 19.5 cm for P. tremuloides × P. tremula. Nevertheless, previous studies have confirmed that a strong linear relationship between the CD and stem DBH persist also for wider ranges of stem DBH (e.g., [11,44]). The possible applications and uses of the tree CD/DBH ratio are discussed in more detail by, for instance, Hemery et al. (2005) [11].
Estimating the C storage in living tree biomass is essential to support the implementation of climate change mitigation measures (e.g., [46]). We demonstrated an approach of approximating C stock estimation in tree AGB based on relatively easily and quickly obtainable remote-sensed data. This approach can be used as captured CO2 self-assessment by, for instance, land owners, managers, and other implementers of climate change mitigation measures. Thus, this communication indirectly supports the quantification of the impact of climate change mitigation measures on agricultural land. However, these developed models describing the relationships between individual tree CD and tree AGB (linear equations, Figure 6 and Figure 7) have usage limitations—these models are not applicable in the cases of trees with small values of CDs (<1 m). The directions for future research include further work on increasing the precision of the models for AGB prediction to approximate C stock in living tree biomass (for instance, by adding tree height as a second independent variable), for different tree species with a wider range of DBH as well as for various tree-dominated systems, including agroforestry systems, riparian buffer tips, and scattered trees.

Author Contributions

Conceptualization, D.L. and T.A.Š.; methodology, T.A.Š.; software, A.B. and T.A.Š.; validation, K.M., K.D. and T.A.Š.; formal analysis, T.A.Š.; investigation, A.B.; resources, K.D. and T.A.Š.; data curation, A.B., K.D. and K.M.; writing—original draft preparation, A.B. and T.A.Š.; writing—review and editing, K.D., D.L. and K.M.; visualization, A.B. and T.A.Š.; supervision, D.L.; project administration, K.M.; funding acquisition, D.L and K.M. All authors have read and agreed to the published version of the manuscript.

Funding

This research was funded by the European Regional Development Fund’s (ERDF) projects (1) “Elaboration of innovative White Willow—perennial grass agroforestry systems on marginal mineral soils improved by wood ash and less demanded peat fractions amendments”, agreement No. 1.1.1.1/19/A/112 (contribution of Arta Bārdule, Kārlis Dūmiņš, Kristaps Makovskis and Dagnija Lazdiņa) and (2) “Climate change mitigation potential of trees in shelter belts of drainage ditches in cropland and grassland”, agreement No. 1.1.1.1/21/A/030 (Toms Artūrs Štāls’ contribution, article processing charge).

Data Availability Statement

Data are available upon request made to the corresponding author, Toms Artūrs Štāls.

Acknowledgments

We would like to thank Jānis Ivanovs from LSFRI Silava for their consultation regarding remote sensing technologies.

Conflicts of Interest

The authors declare no conflict of interest. The funders had no role in the design of this study; in the collection, analyses, or interpretation of data; in the writing of the manuscript; or in the decision to publish the results.

References

  1. Popescu, S.C.; Wynne, R.H.; Nelson, R.F. Measuring individual tree crown diameter with lidar and assessing its influence on estimating forest volume and biomass. Can. J. Remote Sens. 2003, 29, 564–577. [Google Scholar] [CrossRef]
  2. Panagiotidis, D.; Abdollahnejad, A.; Surový, P.; Chiteculo, V. Determining tree height and crown diameter from high-resolution UAV imagery. Int. J. Remote Sens. 2017, 38, 2392–2410. [Google Scholar] [CrossRef]
  3. Jucker, T.; Caspersen, J.; Chave, J.; Antin, C.; Barbier, N.; Bongers, F.; Dalponte, M.; van Ewijk, K.Y.; Forrester, D.I.; Haeni, M.; et al. Allometric equations for integrating remote sensing imagery into forest monitoring programmes. Glob. Chang. Biol. 2017, 23, 177–190. [Google Scholar] [CrossRef]
  4. Dalponte, M.; Frizzera, L.; Ørka, H.O.; Gobakken, T.; Næsset, E.; Gianelle, D. Predicting stem diameters and aboveground biomass of individual trees using remote sensing data. Ecol. Indic. 2018, 85, 367–376. [Google Scholar] [CrossRef]
  5. Liu, Z.; Long, J.; Lin, H.; Du, K.; Xu, X.; Liu, H.; Yang, P.; Zhang, T.; Ye, Z. Interpretation and mapping tree crown diameter using spatial heterogeneity in relation to the radiative transfer model extracted from GF-2 images in planted boreal forest ecosystems. Remote Sens. 2023, 15, 1806. [Google Scholar] [CrossRef]
  6. Guo, Q.; Su, Y.; Hu, T. Applications of LiDAR in biodiversity conservation, ecohydrology, and ecological process modeling of forest ecosystems. In LiDAR Principles, Processing and Applications in Forest Ecology; Guo, Q., Su, Y., Hu, T., Eds.; Academic Press: Cambridge, MA, USA, 2023; pp. 407–442. [Google Scholar]
  7. Hu, L.; Xu, X.; Wang, J.; Xu, H. Individual tree crown width detection from unmanned aerial vehicle images using a revised local transect method. Ecol. Inform. 2023, 75, 102086. [Google Scholar] [CrossRef]
  8. Ivanovs, J.; Lazdiņš, A.; Lang, M. The influence of forest tree species composition on the forest height predicted from airborne laser scanning data—A case study in Latvia. Balt. For. 2023, 29, 663. [Google Scholar] [CrossRef]
  9. Wynne, R.H. Forest mensuration with remote sensing: A retrospective and a vision for the future. In Forest Mensuration with Remote Sensing; Gen. Tech. Rep. SRS 75; Department of Agriculture, Forest Service, Southern Research Station: Asheville, NC, USA, 2004; pp. 109–116. [Google Scholar]
  10. AWF-Wiki. Crown Attributes. Available online: http://wiki.awf.forst.uni-goettingen.de/wiki/index.php/Crown_attributes (accessed on 14 September 2023).
  11. Hemery, G.E.; Savill, P.S.; Pryor, S.N. Applications of the crown diameter–stem diameter relationship for different species of broadleaved trees. For. Ecol. Manag. 2005, 215, 285–294. [Google Scholar] [CrossRef]
  12. Freudenberg, M.; Magdon, P.; Nölke, N. Individual tree crown delineation in high-resolution remote sensing images based on U-Net. Neural. Comput. Appl. 2022, 34, 22197–22207. [Google Scholar] [CrossRef]
  13. Bonnor, G.M. Stem diameter estimates from crown width and tree height. Commonw. For. Rev. 1968, 47, 8–13. [Google Scholar]
  14. Lockhart, B.R.; Weih, R.C., Jr.; Smith, K.M. Crown radius and diameter at breast height relationships for six bottomland hardwood species. J. Ark. Acad. Sci. 2005, 59, 110–150. [Google Scholar]
  15. Kalliovirta, J.; Tokola, T. Functions for Estimating Stem Diameter and Tree Age Using Tree Height, Crown Width and Existing Stand Database Information. Silva Fenn. 2005, 39, 227–248. [Google Scholar] [CrossRef]
  16. The Paris Agreement. Available online: https://unfccc.int/process-and-meetings/the-paris-agreement (accessed on 11 October 2023).
  17. European Commission. The European Green Deal. Available online: https://commission.europa.eu/strategy-and-policy/priorities-2019-2024/european-green-deal_en (accessed on 11 October 2023).
  18. European Commission. Carbon farming. Available online: https://climate.ec.europa.eu/eu-action/sustainable-carbon-cycles/carbon-farming_en (accessed on 14 September 2023).
  19. Zomer, R.J.; Bossio, D.A.; Trabucco, A.; Noordwijk, M.; Xu, J. Global carbon sequestration potential of agroforestry and increased tree cover on agricultural land. Circ. Agric. Syst. 2022, 2, 1–10. [Google Scholar] [CrossRef]
  20. Oficiālās Statistikas Portals. Afforestation (ha) 2013–2022. Available online: https://data.stat.gov.lv/pxweb/lv/OSP_PUB/START__NOZ__ME__MEA/MEP042 (accessed on 14 September 2023).
  21. Lutter, R.; Stål, G.; Arnesson Ceder, L.; Lim, H.; Padari, A.; Tullus, H.; Nordin, A.; Lundmark, T. Climate benefit of different tree species on former agricultural land in northern Europe. Forests 2021, 12, 1810. [Google Scholar] [CrossRef]
  22. Ministru Kabineta Noteikumi Nr. 198 “Tiešo Maksājumu Piešķiršanas Kārtība Lauksaimniekiem”. Available online: https://likumi.lv/ta/id/341260-tieso-maksajumu-pieskirsanas-kartiba-lauksaimniekiem#piel1&pd=1 (accessed on 14 September 2023).
  23. Lauksaimniecības un Lauku Attīstības Likums. Available online: https://likumi.lv/ta/id/87480-lauksaimniecibas-un-lauku-attistibas-likums (accessed on 14 September 2023).
  24. Lauku Atbalsta Dienests. Platību Maksājumu Statistika. Available online: https://www.lad.gov.lv/lv/platibu-maksajumu-statistika (accessed on 14 September 2023).
  25. White, J.C.; Coops, N.C.; Wulder, M.A.; Vastaranta, M.; Hilker, T.P.; Tompalski, P. Remote sensing technologies for enhancing forest inventories: A review. Can. J. Remote Sens. 2016, 42, 619–641. [Google Scholar]
  26. Kārkliņš, A.; Rancāne, S. Augsnes Apraksts, Reģ. Nr. AI0103; LLU Augsnes un Augu Zinātņu Institūts: Skrīveri, Latvija, 2012; pp. 1–2. [Google Scholar]
  27. Kārkliņš, A.; Rancāne, S. Augsnes Apraksts, Reģ. Nr. AI0104; LLU Augsnes un Augu Zinātņu Institūts: Skrīveri, Latvija, 2012; pp. 1–2. [Google Scholar]
  28. Latvian Environment, Geology and Meteorology Centre. Meteorological Network. Available online: https://videscentrs.lvgmc.lv/ (accessed on 14 September 2023).
  29. Ministru Kabineta Noteikumi Nr. 108 “Meža Ieaudzēšanas un Plantāciju Mežu Noteikumi”. Available online: https://likumi.lv/ta/id/4754-meza-ieaudzesanas-un-plantaciju-mezu-noteikumi (accessed on 21 September 2023).
  30. Bārdulis, A.; Purviņa, D.; Makovskis, K.; Bārdule, A.; Lazdiņa, D. Soil-to-atmosphere GHG fluxes in hemiboreal deciduous tree and willow coppice based agroforestry systems with mineral soil. Land 2023, 12, 715. [Google Scholar] [CrossRef]
  31. Bardule, A.; Grinfelde, I.; Lazdina, D.; Bardulis, A.; Sarkanabols, T. Macronutrient leaching in a fertilized juvenile hybrid aspen (Populus tremula L. × P. tremuloides Michx.) plantation cultivated in an agroforestry system in Latvia. Hydrol. Res. 2018, 49, 407–420. [Google Scholar] [CrossRef]
  32. Naslund, M. Skogsförsöksanstaltens Gallringsförsök i Tallskog. [Forest Research Institute’s Thinning Experiments in Scots Pine Forests]; Meddelanden från Statens Skogsförsöksanstalt: Stockholm, Sweden, 1937; p. 249. [Google Scholar]
  33. Liepiņš, J.; Lazdiņš, A.; Liepiņš, K. Equations for estimating above- and belowground biomass of Norway spruce, Scots pine, birch spp. and European aspen in Latvia. Scand. J. For. Res. 2018, 33, 58–70. [Google Scholar] [CrossRef]
  34. Lamlom, S.H.; Savidge, R.A. A reassessment of carbon content in wood: Variation within and between 41 North American species. Biomass Bioenergy 2003, 25, 381–388. [Google Scholar] [CrossRef]
  35. IPCC. 2006 IPCC Guidelines for National Greenhouse Gas Inventories; Prepared by the National Greenhouse Gas Inventories Programme; Eggleston, H.S., Buendia, L., Miwa, K., Ngara, T., Tanabe, K., Eds.; IGES: Tokyo, Japan, 2006. Available online: https://www.ipcc-nggip.iges.or.jp/pub-lic/2006gl/index.html (accessed on 4 September 2023).
  36. R Core Team. The R Project for Statistical Computing. Available online: https://www.R-project.org (accessed on 14 September 2023).
  37. Fox, J.; Weisberg, S. An R Companion to Applied Regression, 3rd ed.; Sage: Thousand Oaks, CA, USA, 2019; Available online: https://socialsciences.mcmaster.ca/jfox/Books/Companion/ (accessed on 4 September 2023).
  38. Wickham, H. ggplot2: Elegant Graphics for Data Analysis; Springer: New York, NY, USA, 2016. Available online: https://ggplot2.tidyverse.org (accessed on 4 September 2023).
  39. Niemistö, P. Influence of initial spacing and row-to-row distance on the growth and yield of silver birch (betula pendula). Scand. J. For. Res. 1995, 10, 245–255. [Google Scholar] [CrossRef]
  40. Broks, J. Meža Enciklopēdija, 1st ed.; Apgāds Zelta grauds: Rīga, Latvia, 2003; p. 368. [Google Scholar]
  41. Tuvikene, M. Growth and Management of Silver Birch and Hybrid Aspen in Southern Sweden. Master’s Thesis, Swedish University of Agricultural Sciences, Uppsala, Sweden, 2021. [Google Scholar]
  42. Rouvinen, S.; Kuuluvainen, T. Structure and asymmetry of tree crowns in relation to local competition in a natural mature Scots pine forest. Can. J. For. Res. 1997, 27, 890–902. [Google Scholar]
  43. Aakala, T.; Shimatani, K.; Abe, T.; Kubota, Y.; Kuuluvainen, T. Crown asymmetry in high latitude forests: Disentangling the directional effects of tree competition and solar radiation. Oikos 2016, 125, 1035–1043. [Google Scholar]
  44. Dubois, H.; Claessens, H.; Ligot, G. Towards silviculture guidelines to produce large-sized Silver birch (Betula pendula Roth) logs in western Europe. Forests 2021, 12, 599. [Google Scholar]
  45. Malek, S.; Miglietta, F.; Gobakken, T.; Næsset, E.; Gianelle, D.; Dalponte, M. Prediction of stem diameter and biomass at individual tree crown level with advanced machine learning techniques. iForest 2019, 12, 323–329. [Google Scholar] [CrossRef]
  46. Nonini, L.; Fiala, M. Estimation of carbon storage of forest biomass for voluntary carbon markets: Preliminary results. J. For. Res. 2019, 32, 329–338. [Google Scholar]
Figure 1. Afforestation and establishment of plantation forests of Betula spp. and Populus spp. in Latvia since 2013 [20].
Land 12 02006 g001
Figure 2. Location of the studied B. pendula and P. tremuloides × P. tremula plantations in Latvia.
Land 12 02006 g002
Figure 3. Example of estimation of tree crown diameters using a drone orthophoto map. Orange and yellow lines show tree crown diameters of P. tremuloides × P. tremula at SW–NE and NW–SE directions, respectively; green and blue lines show tree crown diameters of B. pendula at SW–NE and NW–SE directions, respectively.
Land 12 02006 g003
Figure 4. Tree crown diameter of B. pendula and P. tremuloides × P. tremula in 11-year-old tree plantation on agricultural land in Latvia belonging to the hemiboreal region. In the figure, all trees are pooled regardless of survival of the adjacent tree. Statistically significant differences (p < 0.05) between different measurement directions (SW–NE and NW–SE) within the same tree species are shown with different lowercase letters.
Land 12 02006 g004
Figure 5. Relationship between tree crown diameters of B. pendula and P. tremuloides × P. tremula measured in different directions (SW–NE and NW–SE) in 11-year-old tree plantation. Grey area shows confidence interval of regression.
Land 12 02006 g005
Figure 6. Regressions describing relationships between individual trees’ crown diameters and stem diameters at breast height and tree above-ground biomass of B. pendula. In the figure, all values of individual trees’ crown diameters are pooled regardless of survival of the adjacent tree. Grey area show confidence interval of regression.
Land 12 02006 g006
Figure 7. Regressions describing relationships between individual trees’ crown diameters and stem diameters at breast height and tree above-ground biomass of P. tremuloides × P. tremula. In the figure, all values of individual trees’ crown diameters are pooled regardless of survival of the adjacent tree. Grey area shows confidence interval of regression.
Land 12 02006 g007
Figure 8. Tree crown diameter—stem diameter at breast height ratios at different diameters at breast height for B.pendula and P. tremuloides × P. tremula. In the figure, grey area shows confidence interval of regression.
Land 12 02006 g008
Figure 9. Carbon (C) stock in tree above-ground biomass in 11-year-old plantations of B. pendula and P. tremuloides × P. tremula calculated based on (i) direct (field) measurement data of tree stem diameter at breast height (DBH) and (ii) based on remote-sensed crown diameter (CD) data and elaborated equations describing relationship between individual tree crown diameter and above-ground biomass. Boxplots show variation in carbon stock in tree above-ground biomass among different plots.
Land 12 02006 g009
Disclaimer/Publisher’s Note: The statements, opinions and data contained in all publications are solely those of the individual author(s) and contributor(s) and not of MDPI and/or the editor(s). MDPI and/or the editor(s) disclaim responsibility for any injury to people or property resulting from any ideas, methods, instructions or products referred to in the content.

