Article

Multi-Temporal Change of LULC and Its Impact on Carbon Storage in Jiangsu Coastal, China

1
Nanjing Institute of Environmental Sciences, Ministry of Ecology and Environment, Nanjing 210042, China
2
The Key Laboratory of Land Surface Pattern and Simulation, Institute of Geographical Sciences and Natural Resources Research, Chinese Academy of Sciences, Beijing 100101, China
*
Author to whom correspondence should be addressed.
Land 2023, 12(10), 1943; https://doi.org/10.3390/land12101943
Submission received: 25 July 2023 / Revised: 31 August 2023 / Accepted: 26 September 2023 / Published: 20 October 2023
(This article belongs to the Special Issue Land Use Effects on Carbon Storage and Greenhouse Gas Emissions)

Abstract

:
Coastal is the coupling of socio-economic and fragile ecosystems area existing development and protection problems, with lots of reserve land resources (i.e., bottomland and tidal flats). Analyzing and predicting the carbon storage changes caused by land use/land cover (LULC) on the Jiangsu coast were critical for revealing the potential problems of land surface changes and sustainable development. Then, we utilized the single dynamic degree and transfer in/out contribution, exploring the characteristics of LULC change in the study area from 1980 to 2018. Using the InVEST model, PLUS-LEAS model, and PLUS-Markov chain module, we assessed the spatiotemporal of the study area at the county level to reveal the LULC change strategy and driving factor contribution, as well as the composition of LULC and carbon storage in 2036. The results show that the LULC structure in the study area significantly changed from 1980 to 2018, in which the tidal flat and high coverage grassland decreased by 552.84 km2 and 383.71 km2 while the reservoir ponds and urban residential land increased by 1210.69 km2 and 101.70 km2. The major driving factor of LULC change has shifted from a single-factor to multi-factor coupling, and the influence contribution of human activity increased by 6.73%, especially the population. The carbon storage of study areas showed a significant decrease trend during 1980–2010, followed by a slight increase during 2010–2018. High-density carbon storage was mainly distributed in Lianyungang and Nantong and presented a decreasing trend along the coastline extending inland. The dry land and reservoir ponds are the main composition of LULC types in 2036, and the carbon storage increased to 2.39 × 10⁸ t. In addition, more than decades of LULC change will cover part or all of the land use change process and trends, especially high-covered grasslands, so we suggest a 10-year LULC change to analyze coastal areas with lots of tidal flats and bottomlands. Therefore, this study can provide reference and theoretical guidance for ecologically sustainable development and future LULC evolution in coastal cities.

1. Introduction

Coastal areas are the transitional zones between land and ocean widely recognized as a vital component of the biosphere due to their diverse natural systems and resources [1]. The Jiangsu coast has the largest tidal flat (i.e., reserve land resources) and storm surges, which makes it susceptible to human activities [2]. As economic development shifts to coastal, the intensity of coastal land development has significantly increased, making resource development and protection a critical point in sustainable development [3]. Under the influence of globalization and industrialization, the contradiction between land supply and demand in coastal areas sharply increased, making efficient land use and allocation a possible strategy to relieve the pressure of land use [4,5,6]. Land use/land cover (LULC) change (i.e., ecological protection and industrial expansion affected by nature, society, and economy) directly or indirectly regulates carbon storage. For example, the total carbon storage on the Jiangsu coast in 2010 was 2.98 × 10⁸ t, and the cultivated land decrease will contribute the most to carbon loss in the future, while only the optimized land use structure can make the carbon storage increase [7]. The conflict and contradiction in those processes become even more outstanding, making it a primary approach to achieving sustainable development [8,9,10]. Furthermore, studying the LULC change and their driving factors in coastal areas over the past 30 years is beneficial for further understanding the spatiotemporal characteristics and evolution of LULC changes. Therefore, accurately predicting the development trend of LULC and identifying LULC issues (i.e., ecological land loss and farmland reduction) provide a theoretical basis and scientific reference for LULC development and precise regulation.
Due to the significant effect that LULC change can have on carbon storage, many scholars have explored land use management and prediction of ecosystem services [11]. For example, the United Kingdom conducted an early land use survey in planning agriculture reasonably and effectively [12]. However, recent year’s studies on LULC at home and abroad mainly focused on exploring the mechanism of change, influence, and prediction [13,14,15]. The research on the mechanism of the LULC model mainly includes CLUES [16,17], ESMs [18], SD [19], logistic-CA-Markov [20], FLUS [21], and PLUS [22]. Compared with other LULC dynamic models, the PLUS model is based on an adaptive competition strategy, containing land expansion strategies and CA models for LULC dynamic simulation. Therefore, this model can fully reveal the complex evolution of multi-land type, potential transition, and nonlinear relationship, making it widely used in exploring the mechanism of LULC change and high-precision prediction [23]. LULC change can significantly affect ecosystem functions and processes, for example, ecosystem service [24], carbon storage [25], water cycle [26], and climate change [27]. With the intensification and extreme climate change, the coast is becoming a vital carbon sink and oxygen source area and study hotspots in recent years on carbon storage [1,28].
Previous research on LULC and its impacts in coastal areas focused on administrative units and single temporal change studies [15,29,30], with little consideration of the special of the coastal and drawbacks of single temporal LULC in reflecting the evolution process of the ecosystem. In addition, analyzing and predicting the changes in coastal area carbon storage caused by LULC can reveal the potential issues of surface change and sustainable development strategy. Therefore, we used LULC data and InVEST models in 1980, 1990, 2000, 2010, and 2018 to identify the research scope by analyzing the changing trend of carbon storage extension inland along the coastline loop. Then, we explore the change process of LULC using the single dynamic degree and transfer in/out contribution rate in 10-year, 20-year, and 30-year LULC change intervals. For all this, we discuss the LULC dominant driving factor and carbon storage change with the PLUS-LEAS model and the PLUS Markov chain module and finally predict the LULC composition and carbon storage in 2036.

2. Materials and Methods
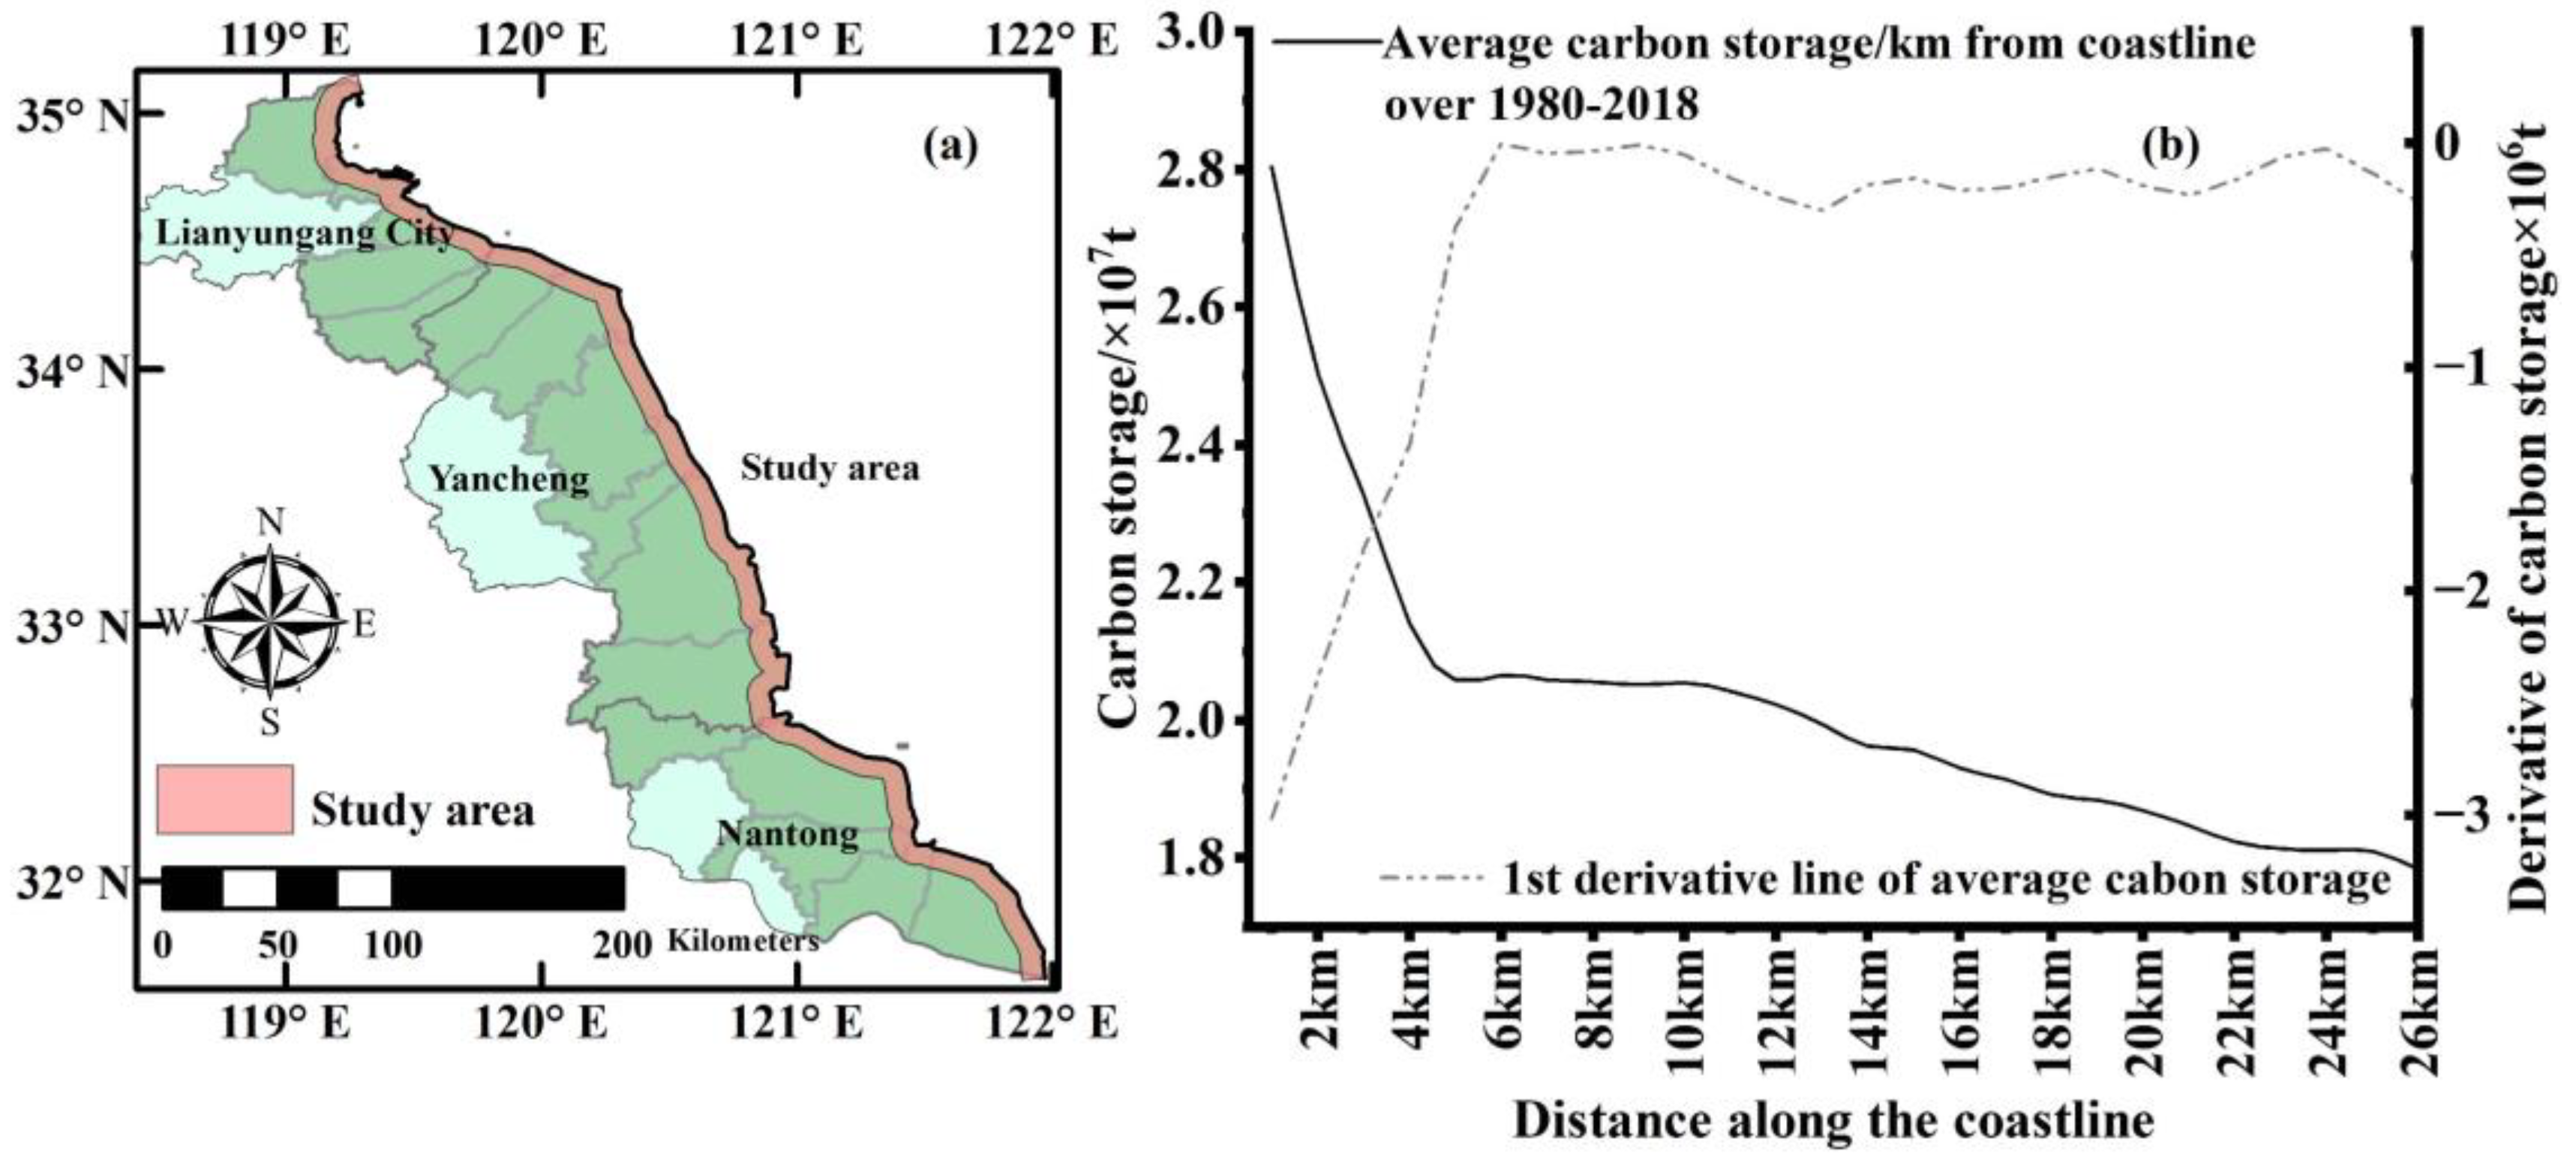
2.1. Study Area

The study area is located along the coast of Jiangsu coastal area in China (Figure 1), extending from the Xiuzhen River mouth in the north to the Yangtze River in the south, including Lianyungang, Yancheng, and Nantong three administrative units. The coastline contains 40.2 km of rocky coastline in the northern and 913.7 km of sandy or silty in the southern (i.e., nearly 90% of the study coastline). Notably, the tidal flat area reaches 6520.6 km2, accounting for 1/4 of the total tidal flat in China. Furthermore, the climate of the study area belongs to the monsoon climate both influenced by maritime and continental climates, with a mild temperature (8.9–15 °C), moderate rainfall (562–1100 mm), and a long frost-free period. Considering the specificity of the Jiangsu coast, we conducted a carbon storage extending inland along the coastline. From the average carbon storage generated from 1980–2018 LULC data by InVEST (see “Section 2.2”/“Section 2.3”), we found that the carbon storage extending inland along the coastline significantly changed within the range of 0–5 km, followed by relatively stable carbon storage in 5–10 km. While the carbon storage slowly decreased by more than 10 km, this is probably influenced by the low carbon storage of urban lands and other construction lands. This changing trend is consistent with the impact range of coastline on the inland side of China’s “Concise Regulations for the Comprehensive Survey of Coastal Zones and Tidal Resources”. Therefore, we selected the area of 10 km inside the coastline as the research area.

2.2. Datasets

The 1980, 1990, 2000, 2010, and 2018 LULC data are from the Resource and Environment Science and Data Center of the Chinese Academy of Sciences (http://www.resdc.cn, accessed on 2 July 2018), and the data resolution is 30 m. This LULC data in study areas includes 25 secondary types and six primary classifications, while the primary classification includes cultivated land, forest land, grassland, water area, construction land, and unused land. We were mainly focusing on paddy fields, dry lands, forest lands, spinney lands, other woodlands, high-covered grasslands, medium-covered grasslands, rivers, reservoir ponds, tidal flats, bottomlands, urban lands, rural Lands, other construction lands, bare lands. Considering the LULC change is mainly driven by environmental and socio-economic factors, we used annual average temperature, annual average precipitation, soil attribution data, and elevation for the environmental driver, and GDP, population, distance from railway, highway, national highway, province highway, and urban first-grade highway for socio-economic data (Table 1). To reduce the influence of data on the drive of LULC, we mainly used the data from the resource and environmental science and data center of the Chinese Academy of Sciences.

2.3. Methods

2.3.1. The Analysis Methods of LULC Change

We used the single land use dynamic degree to analyze the changes of LULC in the study area. The dynamic degree of each LULC type during the research period (i.e., the K value) reflected the drastic change of each LULC type. The specific formula is as follows:
K = U b U a U a × 1 T × 100 %
where K is the dynamic degree; U b and U a refer to the area of LULC in the end year and the start year of i LULC type; T is the length of time.
The land use conversion matrix is the prevailing method that can reflect the dynamic information of land use type conversion between the beginning and the ending period, which contains land use type composing and detailed information on land transfer during the study period [31]. The formula is as follows:
S 12 S 1 j S 1 n S i 1 S i j S i n S n 1 S n j S n n
where S is the area of one LULC type; S i j refers to the area of LULC type i transformed to j ; n is the number of LULC types.
The contribution rate of LULC transfer in/out reflects the characteristic and internal driving mechanism of spatial change patterns [32]. The calculation is as follows:
S i + = j = 1 n S j i S t × 100 %
S i = j = 1 n S j i S t × 100 %
where S i + represents the proportion of the area transferred to i from other LULC types except for i ; S i represents the proportion of the area transferred out i from other LULC types except for i ; S t is the total transferred LULC type area; S j i represents the area transferred from i LULC type to j ; n is the classification number of LULC.

2.3.2. Carbon Storage Analysis Method

We used the InVEST model carbon storage module to calculate carbon storage [33]. The module takes advantage of the relationship between LULC and the carbon storage in each carbon pool to estimate the net carbon storage. Further, the carbon pool includes aboveground biomass, underground biomass, soil, and death matter (Table 2), and the calculation principle utilized the density of aboveground carbon pools, underground carbon pools, soil carbon pools, and death carbon pools of different LULC types to obtain the carbon storage density. The sum of the product of carbon storage density and the area of each LULC type was the carbon storage of the study area. The calculation formula is as follows:
C t o t = i = 1 n S i × C i a b o v e + C i b e l o w + C i s o i l + C i d e a d
where i is a certain LULC type, C i a b o v e , C i b e l o w , C i s o i l , and C i d e a d represent the carbon density of aboveground, underground, soil, and death organic matter of a certain LULC type ( t / h m 2 ), C t o t is the total carbon storage of the study area, S i is the area of the i ( h m 2 ); n is the number of LULC types.

2.3.3. PLUS Model

We used the patch-generating land use simulation (PLUS) model to explore the LULC construction in 2036 and the driving factor contribution. For the expansion analysis, we used the land expansion analysis strategy (LEAS) in the PLUS model. The method was based on two LULC landscapes and driving factors (i.e., twelve driving factors in Table 1) to obtain the development probabilities of each LULC type in the future (Equation (6)) and the contribution of each driving factor. The LEAS combines the advantages of TAS and PAS to avoid the complex analysis, and the model also contains a certain period of land use change explanation, resulting in better interpretability.
For scenario simulation prediction, we used the Markov chain method based on the result of LEAS without plans to generate the future LULC [34]. The Markov chain method is based on the Markov process theory to predict the occurrence probabilities. Although the Markov chain model can effectively reflect LULC variation, it cannot present the spatial distribution. Coupling the PLUS model and Markov chain method could obtain a more accurate model and predict the spatial distribution of future LULC on the Jiangsu coast.
P i , k d x = n = 1 M I = h n x = d M
where d is 0 or 1, when d = 1 represents other LULC types transformed into K land use types, instead, represents the land use types transformed into other land use types except for K . x is a vector composed of driving factors. I represent the decision tree function. h n ( x ) indicate the prediction types of the n th decision tree of vector x . M is the total amount of the decision tree.

3. Results

3.1. LULC Dynamics in Jiangsu Coast from 1980 to 2018

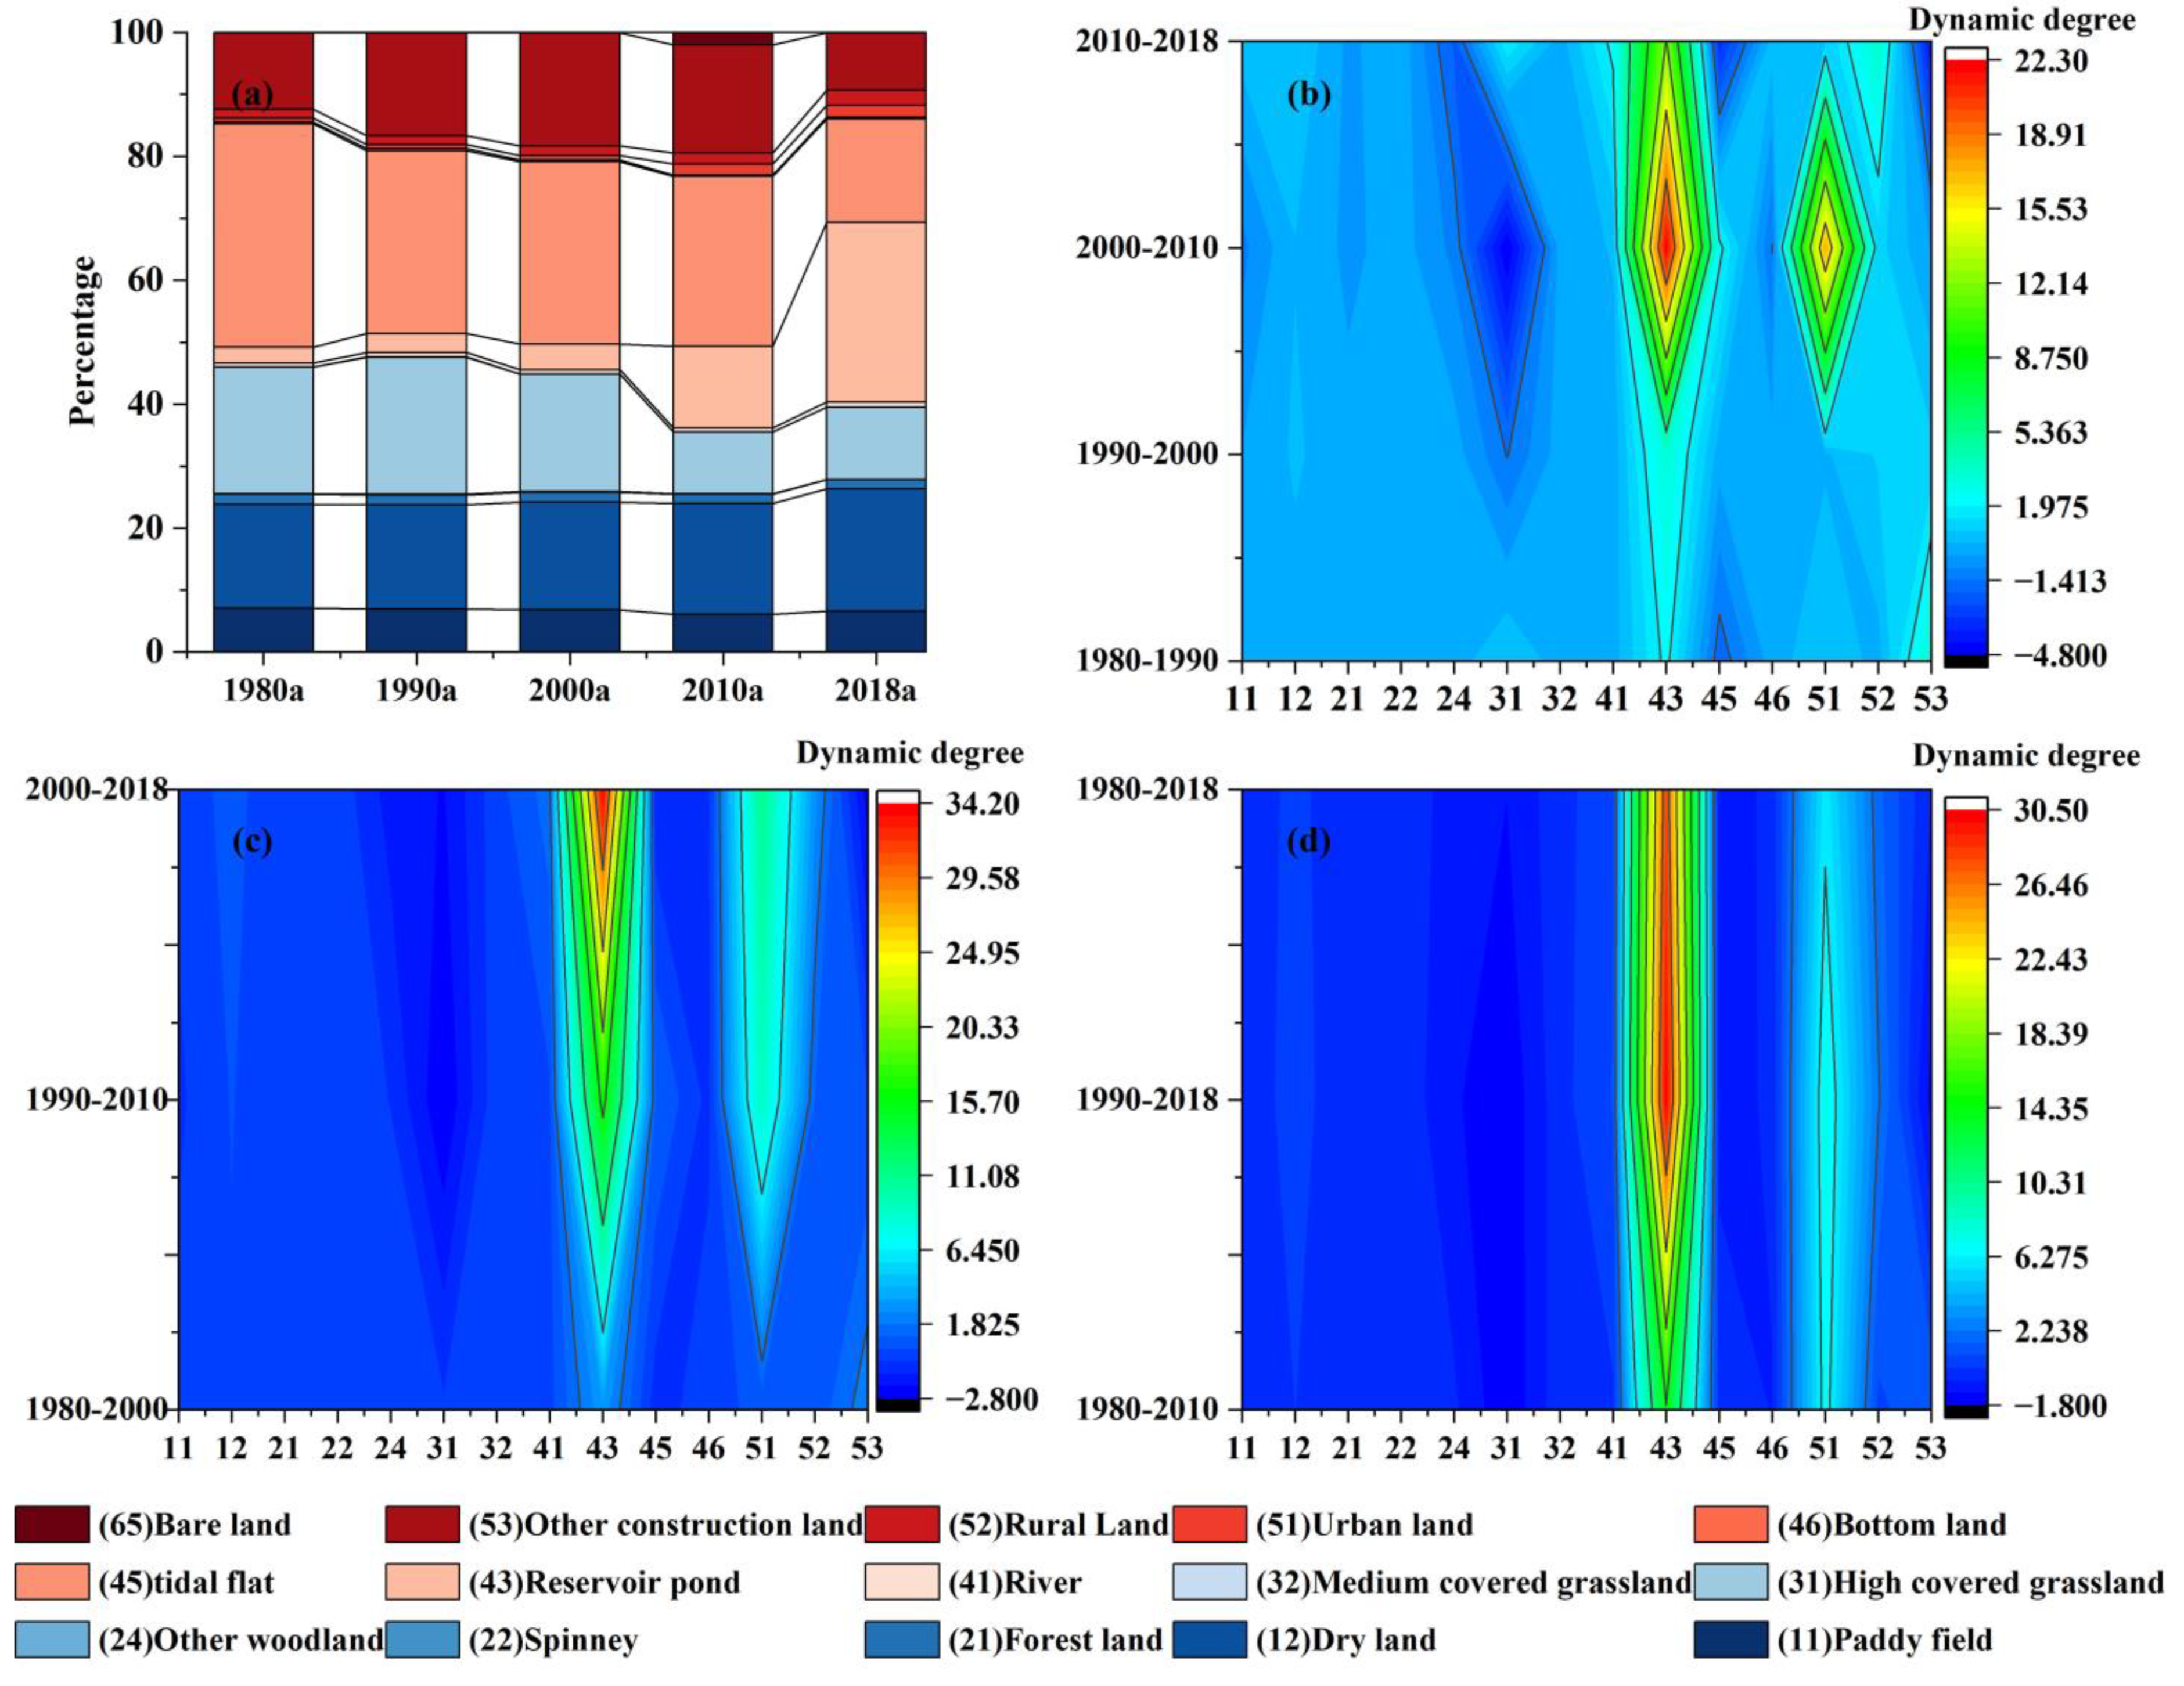
3.1.1. Multi-Temporal Changes of LULC during 1980–2018

There are four major LULC types, including dry land, highly covered grassland, tidal flats, and other construction land composed of the study areas (Figure 2). The spatiotemporal of most LULC types in the study area experienced a significant change during 1980–2018, especially the reservoir ponds and shoal. From the proportion perspective, the dry land and reservoir pond increased with varying degrees while the highly covered grassland and tidal flats sharply decreased from more than 22.13% to 11.64% and 36.03% to 16.66%. Interestingly, the percentage of other construction land increased from 12.37% to 18.31% during 1980–2010 and then decreased to 9.30% during 2010–2018, which may relate to the economic development strategy of Jiangsu in 2008 that paying more attention to the improvement in economic quality and the transformation mode of economic development.
At the dynamic degree of each LULC type level, K changes every ten years in the reservoir pond, and urban land sharply increased, especially during 2000–2010 (i.e., Kreservoir pond = 22.25 and Kurbanland = 17.55). On the contrary, the K of highly covered grassland significantly increased from 0.83 to −4.75 during 1980–2010, followed by a positive increase during 2010–2018 (Khighly covered grassland = 1.91). The K of paddy fields, forest land, other woodlands, tidal flats, and other construction lands discontinuously negatively decreased every ten years during 1980–2018. Notably, the dynamic degree of reservoir pond and urban land still exhibits an increased process every twenty years, every thirty years, or even more, while the K of highly covered grassland disappeared. Overall, the longer the dynamic degree of each LULC type change, the more it can cover up the change process of each LULC.

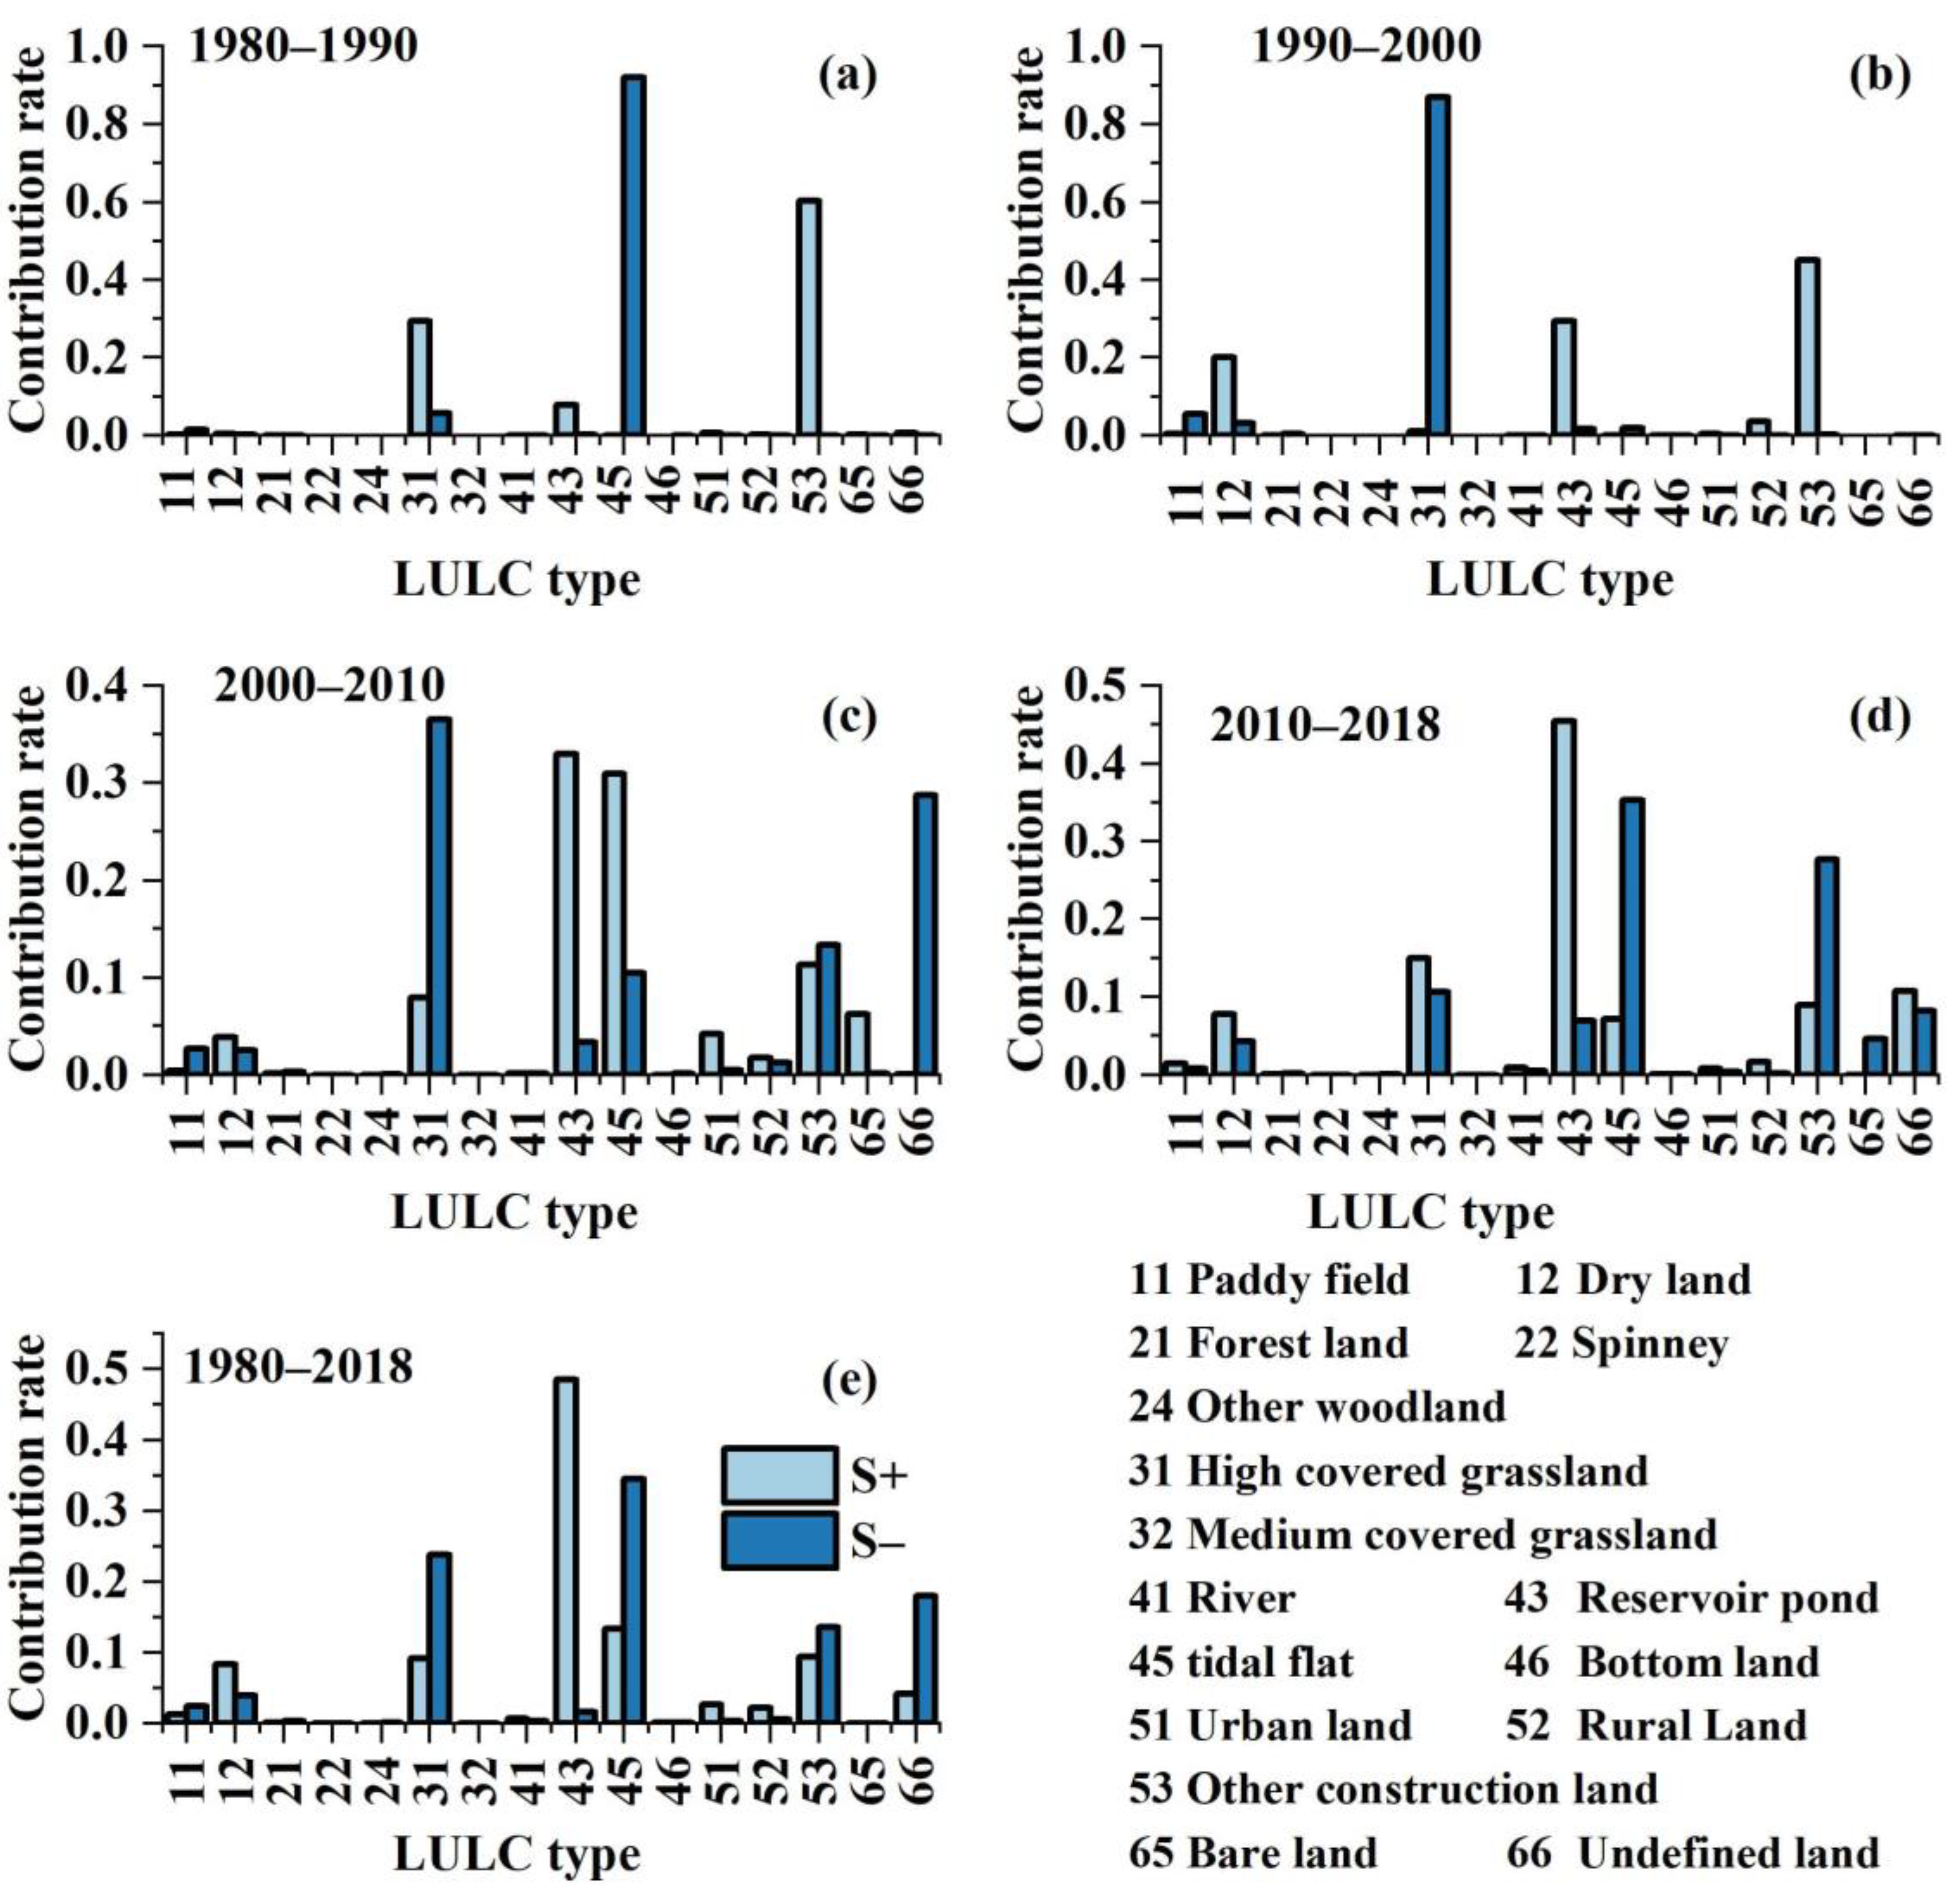
3.1.2. The Contribution Transfer in/out Rate of Each LULC

For the contribution rate of transfer in/out (S+/S−) in each LULC type, there were 423.23 km2 tidal flats transferred out from 1980 to 1990, composing the 92.11% transfer out contribution rate (Figure 3). Those areas mainly transferred into other construction lands (S+ = 60.72%) and highly covered grasslands (S+ = 29.52%). In comparison, highly-covered grassland S− was the largest during 1990–2000 (87.02%), followed by paddy fields and dry lands (5.45% and 3.29%). Simultaneously, the S+ of other construction lands, reservoir ponds, and dry land was 45.01%, 29.34%, and 20.24%, which composed the increased area of LULC types. After 2000, the contribution rate of LULC transfer in/out became more complicated. For example, the maximum transfer out contribution rate was still highly covered grassland (S− = 51.26%), while the relative contribution rate decreased. Further, the transfer-out contribution rate of other construction lands gradually increased during 2000–2010, while the mainly increased area LULC type was reservoir ponds, other construction lands, and highly covered grassland. Due to the low proportion in the study area, there were almost no transfer changes in the spinney, other woodlands, medium-covered grasslands, bottomlands, and bare lands.
Notably, with the continuous adjustment of urbanization and policies, the dominant contribution transferred in/out of LULC types varied from 1980 to 2018. Furthermore, due to the difference in remote sensing land classification data and natural reason (i.e., the erosion and formation of tidal flats or bottom land), the undefined areas gradually play a vital role in transforming into land with classification types. It transferred out 570.91 km2 (S− = 28.69%) during 2000–2010, of which 94.63% changed into tidal flats. Afterward, the transfer-out contribution was slightly lower than the transfer-in contribution rate (S− and S+ were 8.21% and 10.69%). These undefined lands were mainly transferred into tidal flats, other construction lands, and reservoir ponds, with S+ of 60.86%, 18.21%, and 15.24% during 2010–2018, respectively. Therefore, only studying the defined LULC types change during 1980–2018 will ignore the inter-decade changes and potential links. Also, the undefined land will become a critical part of longtime LULC transfer, especially in coastal areas.

3.2. Carbon Storage Dynamics in Jiangsu Coats from 1980 to 2018

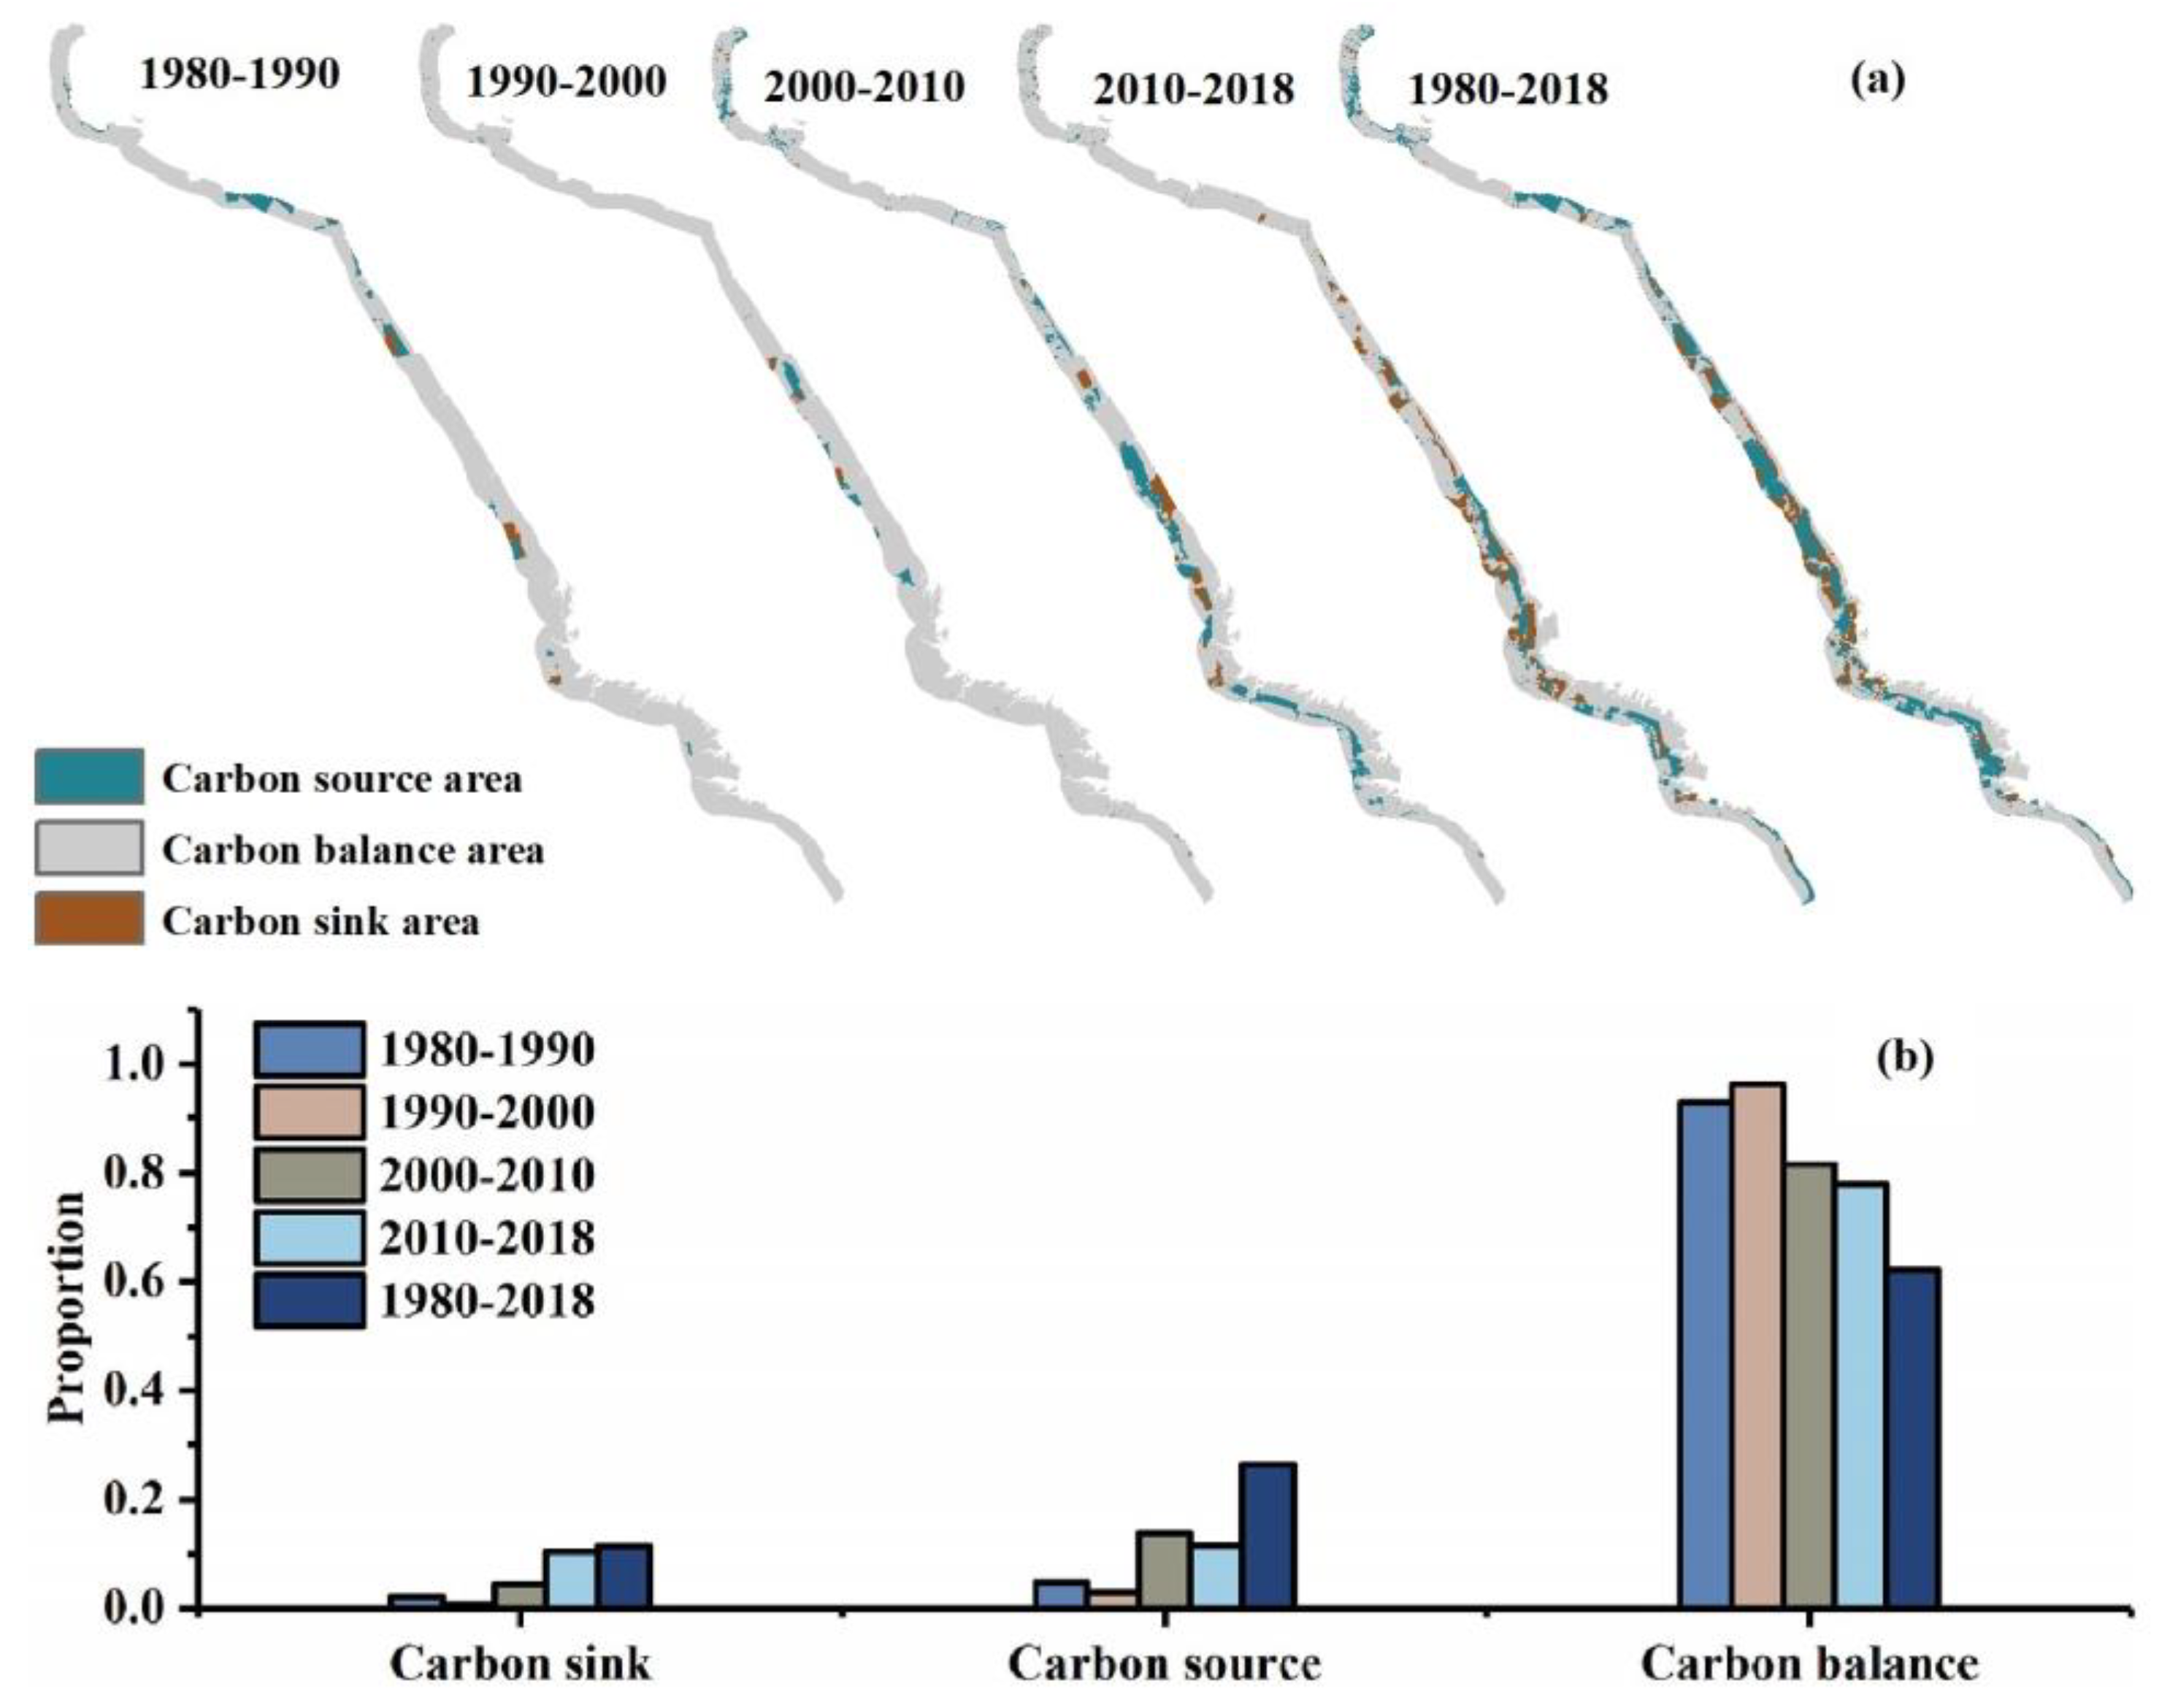
3.2.1. The Spatiotemporal Change of Carbon Storage from 1980 to 2018

The carbon storage of each grid in the study area was derived from the carbon density values of the four carbon pools of each LULC type in the InVEST carbon storage module (Figure 4). The results show that the carbon storage of ecosystems in the study area during 1980, 1990, 2000, 2010, and 2018 were 2.50 × 10⁸ t, 2.48 × 10⁸ t, 2.45 × 10⁸ t, 2.26 × 10⁸ t, and 2.31 × 10⁸ t. The carbon storage experienced a deceased trend, which decreased by 1.90 × 10⁷ t compared to 1980 (about 7.62% in 1980). From the perspective of spatial distribution, the land with high carbon density tends to reduce closer to the coastline, and the high carbon reserve land is mainly concentrated on the inland side of the coastline, especially in Lianyungang. Compared with the previous study, the total carbon storage in Jiangsu coastal in 2010 was 2.98 × 10⁸ t, and under optimal structure, the carbon storage in 2020 was 2.99 × 10⁸ t [7]. Though the changing trend of carbon storage during 2010–2020 was consistent with our study, the carbon storage magnitude in the previous study was higher than ours, mainly because the LULC classification in our study was more detailed than the former [7].
The changing trend of coastal cities (Lianyungang, Yancheng, and Nantong) showed a decreasing trend in carbon storage during 1980–2018. Rudong County and Qidong were the primary carbon storage in Nantong (contributing more than 80%), while the decrease was mainly due to Rudong County. Moreover, Lianyun District and GanyuQu were the primary carbon storage in Lianyungang (contributing more than 99%), and the decrease in carbon storage of GanyuQu was the main consequence of the decline during 1980–2010. However, the carbon storage of Yancheng City was mainly distributed in Sheyang, Dongtai, and Dafeng (contributing more than 80%). Simultaneously, the sharp increase in carbon storage in Yancheng City from 2010 to 2018 was also owing to those three county districts, especially Sheyang County.

3.2.2. The Carbon Storage during 1980–2018

Since different LULC type has a variety of carbon storage, the dynamic change of LULC in the study area regulated the regional carbon storage (Figure 5). Then we defined the higher carbon storage changed to lower was regarded as the carbon source area, whereas it was the carbon sink. Further, this carbon emission process was only below the burning of fossil fuels, threatening the ecosystem [35]. Therefore, we used ArcGIS 10.0 to analyze the spatial variation of carbon storage by dividing it into the carbon sink, carbon balance, and carbon source area in Figure 5. The results show that the carbon sink area was lower than the carbon source area during 1980–2018, while the changing trend of the carbon sink area was also slower than the carbon source area (slope carbon sink = 0.003, slope carbon source = 0.05). The carbon sink area significantly increased in 2010–2018, which was slightly lower than the carbon source area (10.46% vs. 11.52% of the total study area). As for carbon storage magnitude, Nantong City showed a continuous decrease trend during 1980–2018 (from 1.65 × 10³ t to −7.7 × 10⁵ t), while Lianyungang and Yancheng showed a slowdown decrease trend and an increased trend of carbon storage from 2010 to 2018, which changed from −3.95 × 10³ t to −3.91 × 10⁵ t and from −1.22 × 10⁴ t to 2.04 × 10⁷ t respectively. In general, results in 1980–2018 reflected that the carbon storage function of the ecosystem in the study area gradually decreased while its cumulative degradation effect also threatened the ecosystem.
At the county district level, the carbon storage of Rudong County decreased sharply (7.76 × 10⁵ t) during 2010–2018, composing the primary decrease in Nantong City. The sharp decline in carbon storage of Guanyun County mainly contributed to the decreased carbon storage of Lianyungang City in 2000–2010 (about 8.16 × 10⁵ t). The changing trend of carbon storage in Yancheng City was complex from 1980 to 2018. For example, the Dafeng District presented a maximum decrease in 2000–2010 (7.36 × 10⁵ t), while Sheyang County exhibited a maximum increase during 2010–2018 (1.06 × 10⁶ t). Notably, four counties and districts in Yancheng City displayed a significant carbon storage increase in 2018 compared with 1980, contributing to the rise of carbon storage in Yancheng City.

3.3. Quantitative Analysis of the Potential Driving of LULC and Carbon Storage Prediction

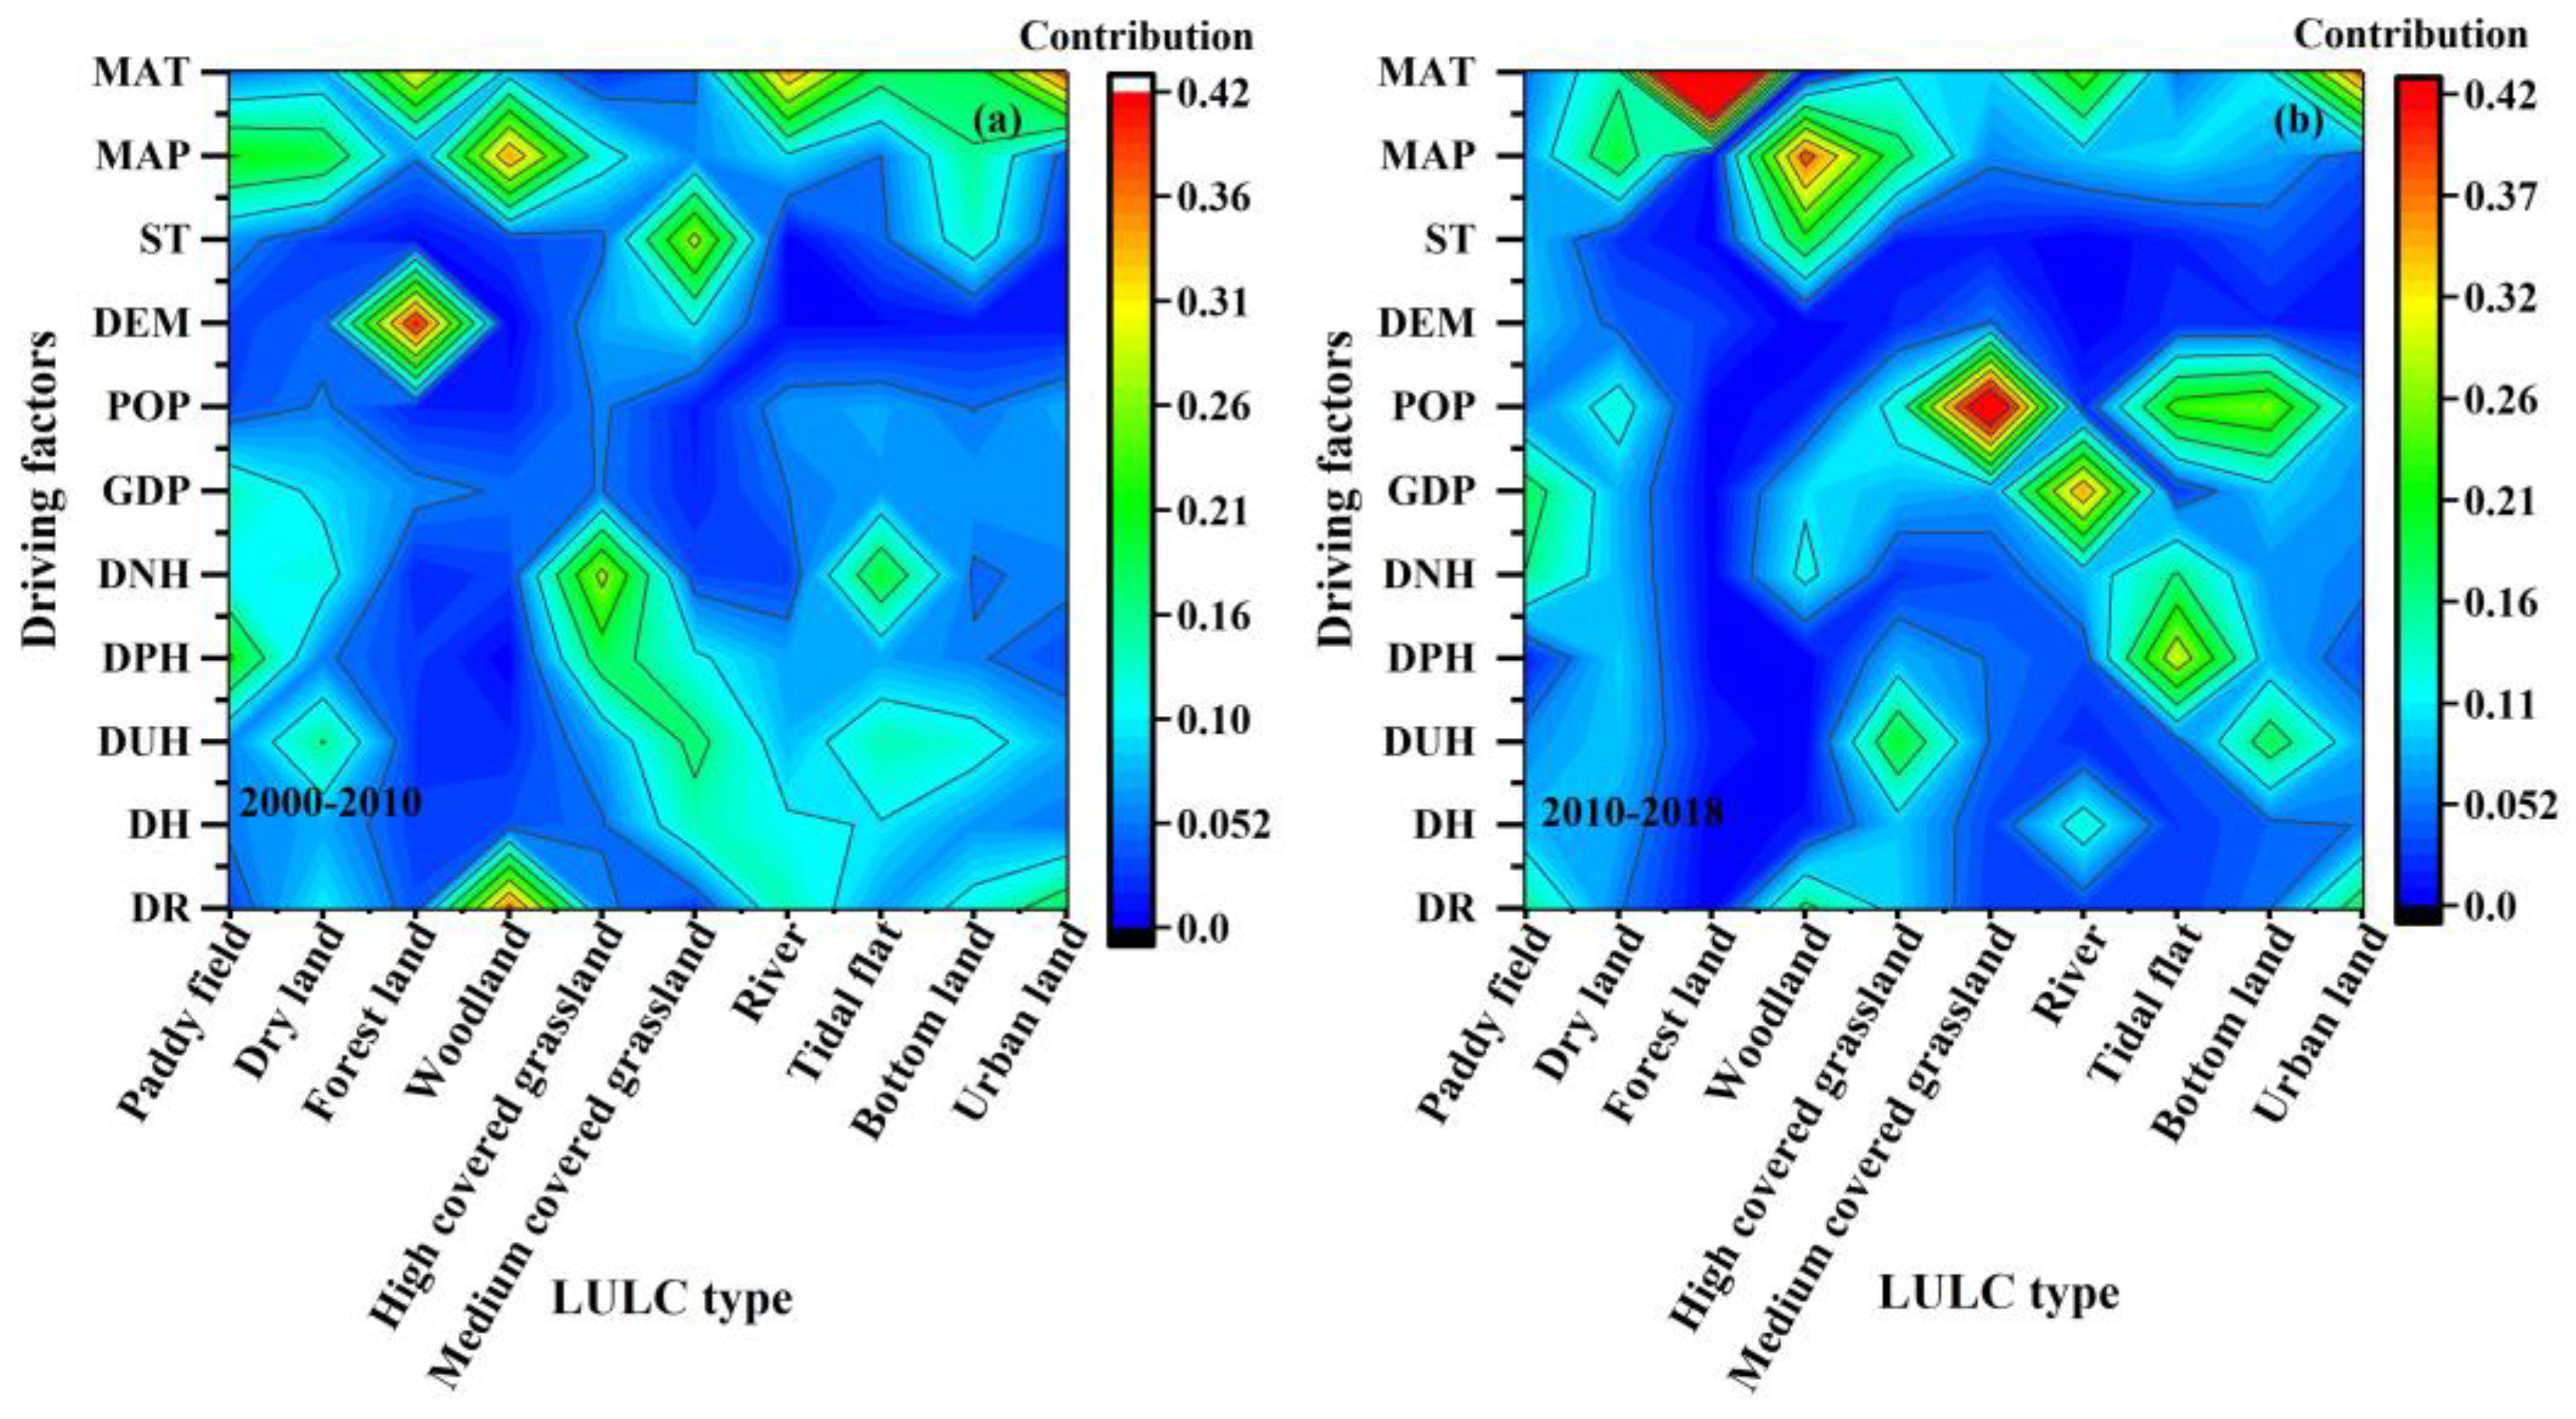
3.3.1. Analyzing the Drivers of LULC Changes Based on PLUS-LEAS

LULC change in a specific region is the interactional result of natural factors, socio-economic factors, policy planning factors, and others [11]. Based on the land expansion map and potential spatial variables, the Random Forest (RF) was used to explore various LULCs’ development probability on pixels and the contribution probability of different variables. The results show that paddy fields were mainly influenced by distance to a provincial highway (21.40%), followed by mean annual precipitation (20.94%) and gross domestic product (13.56%) during 2000–2010 (Figure 6). The main contribution changed to socio-economic factors during 2010–2018, for example, gross domestic product (18.04%), distance to national highway (15.55%), and the distance to railway (15.52%). In contrast, the major influence factor of the dry lands was the mean annual precipitation during 2000–2010 and 2010–2018, while the socio-economic factor contribution rate on LULC change increased. For the highly covered grassland and tidal flat, the most powerful influence was the distance to the highway (i.e., national highway/urban highway/provincial highway). Comparatively, environmental factors (i.e., digital elevation model and mean annual temperature) were the main driving factors of forest lands. In general, though the dominant driving factors of LULC were diverse in both 2000–2010 and 2010–2018, the latter average contribution rate of socio-economic was higher than the former.

3.3.2. The Prediction of LULC and Carbon Storage in 2036

Based on the Markov model, we derived the composition of LULC in 2036 (Figure 7). The proportion of the primary LULC constitution was paddy field (12.99%), dry land (29.75%), high covered grassland (8.79%), reservoir pond (27.65%), tidal flat (7.73%), other construction lands (4.87%). Compared with 2018, the estimated highly-covered grassland decreased by 206.50 km2, followed by tidal flats (179.31 km2). However, the cropland mainly increased in Yancheng, especially in dry land (189.68 km2), while urban and rural land mainly increased in Nantong (134.34 km2), about 43.21% of those areas in 2018. All of this was related to the development of national strategies and provincial plans that Yancheng has a relatively higher percentage of the primary industry, while Nantong emphasized secondary. Based on the InVEST model, the carbon storage in 2036 was about 2.39 × 10⁸ t. In September 2020, China proposed the goal of a carbon peak by 2030 and carbon neutralization by 2060 in the 75th United Nations General Assembly, making the predicted carbon storage lower than that of the observed value in 2036.

4. Discussion

From the composition structure of LULC from 1980–2018, we can see that the changing area in reservoir ponds, urban land, and highly covered grassland was higher than other LULC types (CV reservoir ponds > CV urban land > CV highly-covered grassland). The area of reservoir ponds and urban lands has significantly increased by about 10 and 2 times, while the highly-covered grassland area decreased by 51.58%. The possible reason is that rapid urbanization and population growth in the study area caused a sharp increase in urban land area and development of industries dominated by aquaculture, leading to a shift from the highly-covered grasslands (i.e., Spartina alterniflora, reed, and Suaeda salsa) to aquaculture and increasing the risk of degradation of biodiversity [36]. There was a significant turning point in the dynamic degree of each LULC type, for example, the decrease of approximately 468.47 km2 in highly-covered grassland areas during 1980–2010, a sharp increase of 483.01 km2 and 53.35 km2 in reservoir pond and urban land use (Figure 2). Interestingly, the land policies (i.e., National Main Functional Area Planning, National Marine Main Function Area Planning, and Jiangsu Coastal Development Planning) considering the interaction between environmental bearing capacity and socio-economic development formulated by the National Development and Reform Commission’s Institute of Land Development and Regional Economy accompany LULC change [37,38,39].
Based on the PLUS land expansion analysis strategy (LEAS) model, the contribution of driving factor for each LULC type area change from 2000 to 2010 and 2010 to 2018 shows a more diverse trend (StdevPA2010–2018 > StdevPA2000–2010). And with an expanding economy, the impact of human activities has significantly increased, especially in population. Interestingly, the average influence of roads decreased. These results were consistent with the studies of Shahfahad, et al. [40,41] that the impact of environmental factors declined on changes in the area of each LULC type compared with human activities. The driving of temperature on LULC increased, for example, the influence of temperature on forest tree species, leaf area, root characteristics, etc., which directly affects the spatial distribution of forests [42]. Further, the influence of human activity and environment on different LULC types varied with different study periods. For example, the highest contribution factor contains human activity factors during 2000–2010 and 2010–2018. The former was the distance to the national highways, while the latter was to the first-grade roads. The possible reason was that with the development of the economy, the resource utilization and environmental governance efficiency of high-grade highways in the eastern coastal area of China are gradually decreasing, prompting conservation and green economy development [43].
Carbon storage in the study area generally showed a steep decline from 1980 to 2010 while slowly increasing from 2010 to 2018. The carbon storage density decreased inland along the coastal loop, and the relatively higher carbon density was primarily distributed in Lianyungang and Nantong. The cause of the increased carbon storage was related to the translation of highly-covered grassland to dry lands and paddy lands in Dongtai County, Sheyang County, and Dafeng County of Yancheng City during 2010–2018. The carbon storage density of Lianyungang and Nantong was higher than that of Yancheng, mainly because the former has more paddy land and forest land than the latter, which has higher C s o i l and C a b o v e respectively [44]. Further, with the development of the economy, the carbon source zone was mainly distributed on the side near the inland from 1980–2010, while reversed to the side close to the seas during 2010–2018. These may be related to the dominant influence factor, which changed from urbanization expansion to aquaculture. Both of them may lead to a change in vegetation cover and soil quality, changing the carbon storage in the aboveground and soil [45]. Overall, only considering the comparative analysis of carbon storage in 1980 and 2018, the carbon storage changes are complex and have poor regularity, which cannot reflect the evolution process and change trend of ecosystem carbon storage [46].
The carbon storage obtained from the InVEST model lacks the consideration of carbon fixation photosynthetic rate and soil microorganisms, which may introduce uncertainty in carbon storage estimating. The LULC derived from remote sensing images in different data further increases uncertainty in carbon storage comparison [47]. Therefore, we used the LULC interpreted in July to reduce the impact of data sources on our analysis. For the LULC prediction, we used LULC in 2000 and 2018 data, which contained the influence of land use policies changing in 2010 of Jiangsu coastal. To a certain extent, the results of the InVEST model and the PLUS Markov model have uncertainty. Therefore, the results can still reflect and predict the change of LULC composition and carbon storage in the study area in 1980–2036 and quantify the relative contribution of human activities and climate change on carbon storage.

5. Conclusions

We fully utilize the single dynamic degree and the contribution rate of transfer in/out to analyze the changing trend and spatial pattern of LULC in the study area from 1980 to 2018 in the subperiod and general. Then, we explored the impact of LULC change on carbon storage and structure during 1980–2036 with the help of the InVEST model and the PLUS model. The results show that the LULC structure significantly changed in the study area from 1980 to 2018. LULC change of more than decades could cover some or all ecosystem evolution processes, so multi-temporal and decades interval LULC change is suitable for the coastal areas. As for the changing intensity, the highest transfer in and out contribution rate (S+ and S−) was tidal flat and reservoir ponds, and the S+ and S− were 59.35% and 39.08 from 1980–2018. Among them, the highest S− was 92.13%, 87.02%, 51.26%, and 34.14% for tidal flats, highly-covered grasslands, highly-covered grasslands, and other construction lands during 1980–1990, 1990–2000, 200–2010, and 2010–2018 respectively. In contrast, the highest S+ were 60.72%, 45.01%, 45.27%, and 54.49% for other construction lands, other construction lands, reservoir ponds, and reservoir pons. The driving factor of LULC during 2000–2010 and 2010–2018 has shifted from a single driving factor to a synergistic of multi-factors, and the contribution of human activity on LULC has increased by about 6.73%, especially the population (increased about twice). Furthermore, carbon storage sharply decreased in 1980–2010, followed by mediocre growth in 2010–2018, while the spatial distribution of carbon storage density decreased with extended inland along the coastline in 1980–2018. Moreover, the dry land and reservoir ponds (about 3757.46 km2) were still the main component of LULC in 2036, containing 2.39 × 10⁸ t carbon storage. Notably, the undefined land formed by nature and human activity in coastal areas of different temporal are critical components and dynamics in LULC changing and should pay more attention to it.

Author Contributions

Conceptualization, H.Y. and H.Z.; Data curation, H.Y.; Funding acquisition, H.Z.; Methodology, J.Z.; Resources, H.Y.; Software, Z.W.; Validation, Z.Q., X.W. and W.X.; Writing—original draft, H.Y. and H.Z. All authors have read and agreed to the published version of the manuscript.

Funding

This work was supported by the Innovative Team Project of Nanjing Institute of Environmental Sciences MEE: ZX2023QT022; 2021 Provincial Ecological Environment Research Project: 2021004; Central Public Welfare Scientific Institution Basal Research Fund, Ministry of Finance and Ministry of Ecology and Environment of China: GYZX210302.

Data Availability Statement

1980, 1990, 2000, 2010, and 2018 LULC data are publicly available at http://www.resdc.cn. The environmental, socio-economic factors MAT, MAP, ST, DEM, GDP, POP, and Distance from the railway, highway, national highway, province highway, and urban first-grade highway https://www.resdc.cn/DOI/DOI.aspx?DOIID=39, accessed on 20 July 2022.

Conflicts of Interest

The authors declare no conflict of interest.

References

  1. Crossland, C.J.; Baird, D.; Ducrotoy, J.-P.; Lindeboom, H.; Buddemeier, R.W.; Dennison, W.C.; Maxwell, B.A.; Smith, S.V.; Swaney, D.P. The Coastal Zone—A Domain of Global Interactions. In Coastal Fluxes in the Anthropocene: The Land-Ocean Interactions in the Coastal Zone Project of the International Geosphere-Biosphere Programme; Crossland, C.J., Kremer, H.H., Lindeboom, H.J., Marshall Crossland, J.I., Le Tissier, M.D.A., Eds.; Springer: Berlin/Heidelberg, Germany, 2005; pp. 1–37. [Google Scholar]
  2. Davis, R.A. Human Impact on Coasts. In Encyclopedia of Coastal Science; Finkl, C.W., Makowski, C., Eds.; Springer International Publishing: Cham, Switzerland, 2019; pp. 983–991. [Google Scholar]
  3. Xu, N.; Wang, Y.; Huang, C.; Jiang, S.; Jia, M.; Ma, Y. Monitoring coastal reclamation changes across Jiangsu Province during 1984–2019 using landsat data. Mar. Policy 2021, 136, 104887. [Google Scholar] [CrossRef]
  4. Besser, H.; Hamed, Y. Environmental impacts of land management on the sustainability of natural resources in Oriental Erg Tunisia, North Africa. Environ. Dev. Sustain. 2021, 23, 11677–11705. [Google Scholar] [CrossRef]
  5. Liu, Y.; Li, J. The patterns and driving mechanisms of reclaimed land use in China’s coastal areas in recent 30 years. Sci. Sin. Terrae 2020, 50, 761–774. (In Chinese) [Google Scholar]
  6. Tian, P.; Li, J.; Cao, L.; Pu, R.; Gong, H.; Liu, Y.; Zhang, H.; Chen, H. Impacts of reclamation derived land use changes on ecosystem services in a typical gulf of eastern China: A case study of Hangzhou bay. Ecol. Indic. 2021, 132, 108259. [Google Scholar] [CrossRef]
  7. Chuai, X.; Huang, X.; Wang, W.; Wu, C.; Zhao, R. Spatial Simulation of Land Use based on Terrestrial Ecosystem Carbon Storage in Coastal Jiangsu, China. Sci. Rep. 2014, 4, 5667. [Google Scholar] [CrossRef] [PubMed]
  8. Etemadi, H.; Smoak, J.M.; Karami, J. Land use change assessment in coastal mangrove forests of Iran utilizing satellite imagery and CA–Markov algorithms to monitor and predict future change. Environ. Earth Sci. 2018, 77, 208. [Google Scholar] [CrossRef]
  9. Pourebrahim, S.; Hadipour, M.; Bin Mokhtar, M. Impact assessment of rapid development on land use changes in coastal areas; case of Kuala Langat district, Malaysia. Environ. Dev. Sustain. 2014, 17, 1003–1016. [Google Scholar] [CrossRef]
  10. Rindfuss, R.; Walsh, S.; Turner, B.; Fox, J.; Mishra, V. Developing a science of land change: Challenges and methodological issues. Proc. Natl. Acad. Sci. USA 2004, 101, 13976–13981. [Google Scholar] [PubMed]
  11. Yang, R.; Chen, H.; Chen, S.; Ye, Y. Spatiotemporal evolution and prediction of land use/land cover changes and ecosystem service variation in the Yellow River Basin, China. Ecol. Indic. 2022, 145, 109579. [Google Scholar] [CrossRef]
  12. Stamp, L.D. The Land Utilisation Survey of Britain. Nature 1932, 129, 709–711. [Google Scholar] [CrossRef]
  13. Gaur, S.; Mittal, A.; Bandyopadhyay, A.; Holman, I.; Singh, R. Spatio-temporal analysis of land use and land cover change: A systematic model inter-comparison driven by integrated modelling techniques. Int. J. Remote Sens. 2020, 41, 9229–9255. [Google Scholar] [CrossRef]
  14. Pielke, R.A. Land Use and Climate Change. Science 2005, 310, 1625–1626. [Google Scholar] [CrossRef]
  15. Aitali, R.; Snoussi, M.; Kolker, A.S.; Oujidi, B.; Mhammdi, N. Effects of Land Use/Land Cover Changes on Carbon Storage in North African Coastal Wetlands. J. Mar. Sci. Eng. 2022, 10, 364. [Google Scholar] [CrossRef]
  16. Verburg, P.H.; Soepboer, W.; Veldkamp, A.; Limpiada, R.; Espaldon, V.; Mastura, S.S.A. Modeling the Spatial Dynamics of Regional Land Use: The CLUE-S Model. Environ. Manag. 2002, 30, 391–405. [Google Scholar] [CrossRef]
  17. Semadeni-Davies, A.; Jones-Todd, C.; Srinivasan, M.; Muirhead, R.; Elliott, A.; Shankar, U.; Tanner, C. CLUES model calibration and its implications for estimating contaminant attenuation. Agric. Water Manag. 2020, 228, 105853. [Google Scholar] [CrossRef]
  18. Ward, N.D.; Megonigal, J.P.; Bond-Lamberty, B.; Bailey, V.L.; Butman, D.; Canuel, E.A.; Diefenderfer, H.; Ganju, N.K.; Goñi, M.A.; Graham, E.B.; et al. Representing the function and sensitivity of coastal interfaces in Earth system models. Nat. Commun. 2020, 11, 2458. [Google Scholar] [CrossRef] [PubMed]
  19. Geng, B.; Zheng, X.; Fu, M. Scenario analysis of sustainable intensive land use based on SD model. Sustain. Cities Soc. 2017, 29, 193–202. [Google Scholar] [CrossRef]
  20. Guan, D.; Zhao, Z.; Tan, J. Dynamic simulation of land use change based on logistic-CA-Markov and WLC-CA-Markov models: A case study in three gorges reservoir area of Chongqing, China. Environ. Sci. Pollut. Res. 2019, 26, 20669–20688. [Google Scholar] [CrossRef]
  21. Şenik, B.; Kaya, H.S. Landscape sensitivity-based scenario analysis using flus model: A case of Asarsuyu watershed. Landsc. Ecol. Eng. 2022, 18, 139–156. [Google Scholar] [CrossRef]
  22. Liang, X.; Guan, Q.; Clarke, K.C.; Liu, S.; Wang, B.; Yao, Y. Understanding the drivers of sustainable land expansion using a patch-generating land use simulation (PLUS) model: A case study in Wuhan, China. Comput. Environ. Urban Syst. 2021, 85, 101569. [Google Scholar] [CrossRef]
  23. Li, C.; Wu, Y.; Gao, B.; Zheng, K.; Wu, Y.; Li, C. Multi-scenario simulation of ecosystem service value for optimization of land use in the Sichuan-Yunnan ecological barrier, China. Ecol. Indic. 2021, 132, 108328. [Google Scholar] [CrossRef]
  24. Zhang, X.; Zhou, Y.; Long, L.; Hu, P.; Huang, M.; Xie, W.; Chen, Y.; Chen, X. Simulation of land use trends and assessment of scale effects on ecosystem service values in the Huaihe River basin, China. Environ. Sci. Pollut. Res. 2023, 30, 58630–58653. [Google Scholar] [CrossRef]
  25. Fryer, J.; Williams, I.D. Regional carbon stock assessment and the potential effects of land cover change. Sci. Total. Environ. 2021, 775, 145815. [Google Scholar] [CrossRef]
  26. Woldesenbet, T.A.; Elagib, N.A.; Ribbe, L.; Heinrich, J. Catchment response to climate and land use changes in the Upper Blue Nile sub-basins, Ethiopia. Sci. Total. Environ. 2018, 644, 193–206. [Google Scholar] [CrossRef] [PubMed]
  27. Leal Filho, W.; Icaza, L.E.; Neht, A.; Klavins, M.; Morgan, E.A. Coping with the impacts of urban heat islands. A literature-based study on understanding urban heat vulnerability and the need for resilience in cities in a global climate change context. J. Clean. Prod. 2018, 171, 1140–1149. [Google Scholar] [CrossRef]
  28. Siikamäki, J.; Sanchirico, J.N.; Jardine, S.; McLaughlin, D.; Morris, D. Blue Carbon: Coastal Ecosystems, Their Carbon Storage, and Potential for Reducing Emissions. Environ. Sci. Policy Sustain. Dev. 2013, 55, 14–29. [Google Scholar] [CrossRef]
  29. Zhu, L.; Song, R.; Sun, S.; Li, Y.; Hu, K. Land use/land cover change and its impact on ecosystem carbon storage in coastal areas of China from 1980 to 2050. Ecol. Indic. 2022, 142, 109178. [Google Scholar] [CrossRef]
  30. El Mahrad, B.; Abalansa, S.; Newton, A.; Icely, J.D.; Snoussi, M.; Kacimi, I. Social-Environmental Analysis for the Management of Coastal Lagoons in North Africa. Front. Environ. Sci. 2020, 8, 37. [Google Scholar] [CrossRef]
  31. Khiavi, H.T.; Mostafazadeh, R. Land use change dynamics assessment in the Khiavchai region, the hillside of Sabalan mountainous area. Arab. J. Geosci. 2021, 14, 1–15. [Google Scholar] [CrossRef]
  32. Yang, W.; Jiang, X. Evaluating the influence of land use and land cover change on fine particulate matter. Sci. Rep. 2021, 11, 17612. [Google Scholar] [CrossRef] [PubMed]
  33. Chalazas, T.; Hasiotis, T.; Monioudi, I.; Andreadis, O.; Manoutsoglou, E.; Adonis, V. Evaluation of coastal vulnerability using the invest model—Case study: SE CHIOS Island. In Proceedings of the 3rd International Congress on Applied Ichthyology & Aquatic Environment, Volos, Greece, 8–11 November 2018. [Google Scholar]
  34. Gounaridis, D.; Chorianopoulos, I.; Symeonakis, E.; Koukoulas, S. A Random Forest-Cellular Automata modelling approach to explore future land use/cover change in Attica (Greece), under different socio-economic realities and scales. Sci. Total. Environ. 2018, 646, 320–335. [Google Scholar] [CrossRef]
  35. Hongli, S. Influence of Reclamation Activities on Ecosystem Type and Carbon Sink Function of the Coastal Wetland in the Yellow River Estuary. Ph.D. Thesis, Chinese Academy of Sciences (Northeast Institute of Geography and Agroecology), Beijing, China, 2015. [Google Scholar]
  36. Xiao, Y.; Zhang, L.; Zhang, L.Y.; Xiao, Y.; Zheng, H.; Ouyang, Z.Y. Spatial variation analysis of biodiversity in the Bohai region coastal wetland. Acta Ecol. Sin. 2018, 38, 909–916. [Google Scholar] [CrossRef]
  37. Peng, T.; Deng, H. Study on the division of main functional regions based on relative carrying capacity of resources: A case study of Guiyang, southwest China. Environ. Dev. Sustain. 2021, 23, 9493–9513. [Google Scholar] [CrossRef]
  38. Yeboah-Assiamah, E.; Muller, K.; Domfeh, K.A. ‘Complex crisis’ and the rise of collaborative natural resource governance: Institutional trajectory of a wildlife governance experience in Ghana. Environ. Dev. Sustain. 2017, 20, 2205–2224. [Google Scholar] [CrossRef]
  39. Spalding, A.K. Exploring the evolution of land tenure and land use change in Panama: Linking land policy with development outcomes. Land Use Policy 2017, 61, 543–552. [Google Scholar] [CrossRef]
  40. Shahfahad; Talukdar, S.; Rihan, M.; Hang, H.T.; Bhaskaran, S.; Rahman, A. Modelling urban heat island (UHI) and thermal field variation and their relationship with land use indices over Delhi and Mumbai metro cities. Environ. Dev. Sustain. 2022, 24, 3762–3790. [Google Scholar] [CrossRef]
  41. Hussain, S.; Lu, L.; Mubeen, M.; Nasim, W.; Karuppannan, S.; Fahad, S.; Tariq, A.; Mousa, B.G.; Mumtaz, F.; Aslam, M. Spatiotemporal Variation in Land Use Land Cover in the Response to Local Climate Change Using Multispectral Remote Sensing Data. Land 2022, 11, 595. [Google Scholar] [CrossRef]
  42. Hussain, S.; Qin, S.; Nasim, W.; Bukhari, M.A.; Mubeen, M.; Fahad, S.; Raza, A.; Abdo, H.G.; Tariq, A.; Mousa, B.G.; et al. Monitoring the Dynamic Changes in Vegetation Cover Using Spatio-Temporal Remote Sensing Data from 1984 to 2020. Atmosphere 2022, 13, 1609. [Google Scholar] [CrossRef]
  43. Wan, G.; Wang, X.; Zhang, R.; Zhang, X. The impact of road infrastructure on economic circulation: Market expansion and input cost saving. Econ. Model. 2022, 112, 105854. [Google Scholar] [CrossRef]
  44. Xiong, Y.; Liao, B.; Proffitt, E.; Guan, W.; Sun, Y.; Wang, F.; Liu, X. Soil carbon storage in mangroves is primarily controlled by soil properties: A study at Dongzhai Bay, China. Sci. Total. Environ. 2018, 619, 1226–1235. [Google Scholar] [CrossRef]
  45. Sun, T.; Ma, Z.; Huang, Z.; Wang, Z.; Chen, S.; Xiao, Y.; Xie, C.; Yue, C.; Jia, F.; Zhang, Q. Coastal Ecosystem Restoration Strategy Based on Carbon Storage Change: A Case Study of the Southeast Coastal Zone of Hainan Island. Trop. Geogr. 2023, 43, 443–458. [Google Scholar] [CrossRef]
  46. Wang, Y.-g.; Luo, G.-p.; Feng, Y.-x.; Han, Q.-f.; Fan, B.-b.; Chen, Y.-l. Effects of Land Use/Land Cover Change on Carbon Storage in Manas River Watershed over the Past 50 Years. J. Nat. Resour. 2013, 28, 994–1006. [Google Scholar] [CrossRef]
  47. Liu, Y.; Zhang, J.; Zhou, D.; Ma, J.; Dang, R.; Ma, J.; Zhu, X. Temporal and spatial variation of carbon storage in the Shule River Basin based on InVEST model. Acta Ecol. Sin. 2021, 41, 4052–4065. [Google Scholar]
Figure 1. Geographical location of the study area and carbon storage extends along with the distance inland coastline. (a) Study area distribution; (b) The carbon storage changes along the inland coastline.
Land 12 01943 g001
Figure 2. LULC and single land use dynamic degree changes during 1980–2018. (a) The percentage of LULC in each year. (bd) Represent the 10-year, 20-year, and 30-year dynamic degree of LULC, respectively.
Land 12 01943 g002
Figure 3. The LULC transfer in/out contribution rate during 1980–2018. (ae) represents the LULC transfer in/out contribution rate in 1980–1990, 1990–2000, 2000–2010, 2010–2018, and 1980–2018 respectively.
Land 12 01943 g003
Figure 4. Distribution and chart of carbon storage from 1980–2018. (a) The distribution of the carbon storage in 1980, 1990, 2000, 2010, and 2018. (b) The carbon storage of three administrative units and study area from 1980–2018. (c) The carbon storage at the county level during 1980–2018.
Land 12 01943 g004
Figure 5. Distribution and analysis of carbon sink, carbon balance, and carbon source. (a) The distribution of carbon stage during 1980–1990, 1990–2000, 2000–2010, 2010–2018, and 1980–2018. (b) The histogram of carbon stage during 1980–1990, 1990–2000, 2000–2010, 2010–2018, and 1980–2018.
Land 12 01943 g005
Figure 6. Contribution rates of spatial variables on LULC changes during 2000–2010 and 2010–2018. DR, DH, DUH, and DPH represent the distance to the railway, highway, urban first-grade highway, provincial highway, and national highway. (a) Contribution rates in 2000–2010. (b) Contribution rates in 2010–2018.
Land 12 01943 g006
Figure 7. The composition of land use type in 2036.
Land 12 01943 g007
Table 1. Datasets used for LULC changes and carbon storage analysis.
DataData AttributeAbbreviationYearFormat and Resolution
Land use typeLand use/land coverLULC1980, 1990, 2000, 2010, 2018.Raster, 30 m
Environmental factorThe mean annual temperatureMAT2000, 2010, 2018.Raster, 1 km
The mean annual precipitationMAP2000, 2010, 2018.Raster, 1 km
Soil typeST2010Raster, 1 km
Digital elevation modelDEM2010Raster, 30 m
Socio-economic factorsGross domestic productGDP2000, 2010, 2018.Raster, 1 km
PopulationPOP2000, 2010, 2018.Raster, 1 km
RailwayDR2010Shapefile, -
HighwayDH2010Shapefile, -
National highwayDNH2010Shapefile, -
Province highwayDPH2010Shapefile, -
Urban first-grade highwayDUH2010Shapefile, -
Table 2. The information of four types of carbon pools in the study area.
LULC C a b o v e /Mg·hm−2 C b e l o w /Mg·hm−2 C s o i l /Mg·hm−2 C d e a d /Mg·hm−2
Paddy field521500
Dry land311100
Forest land20013013065
Spinney88253
Other woodland103901
High covered grassland66200
Medium covered grassland4.24.2200
River0000
Reservoir pond0000
tidal flat1.50.5100
Bottom land11100
Urban land0000
Rural Land00500
Other construction land0000
Bare land105200
Disclaimer/Publisher’s Note: The statements, opinions and data contained in all publications are solely those of the individual author(s) and contributor(s) and not of MDPI and/or the editor(s). MDPI and/or the editor(s) disclaim responsibility for any injury to people or property resulting from any ideas, methods, instructions or products referred to in the content.

