
Climate Warming Dominates Vegetation Productivity in the Hanjiang River Basin, China

Abstract
:1. Introduction
2. Materials and Methods
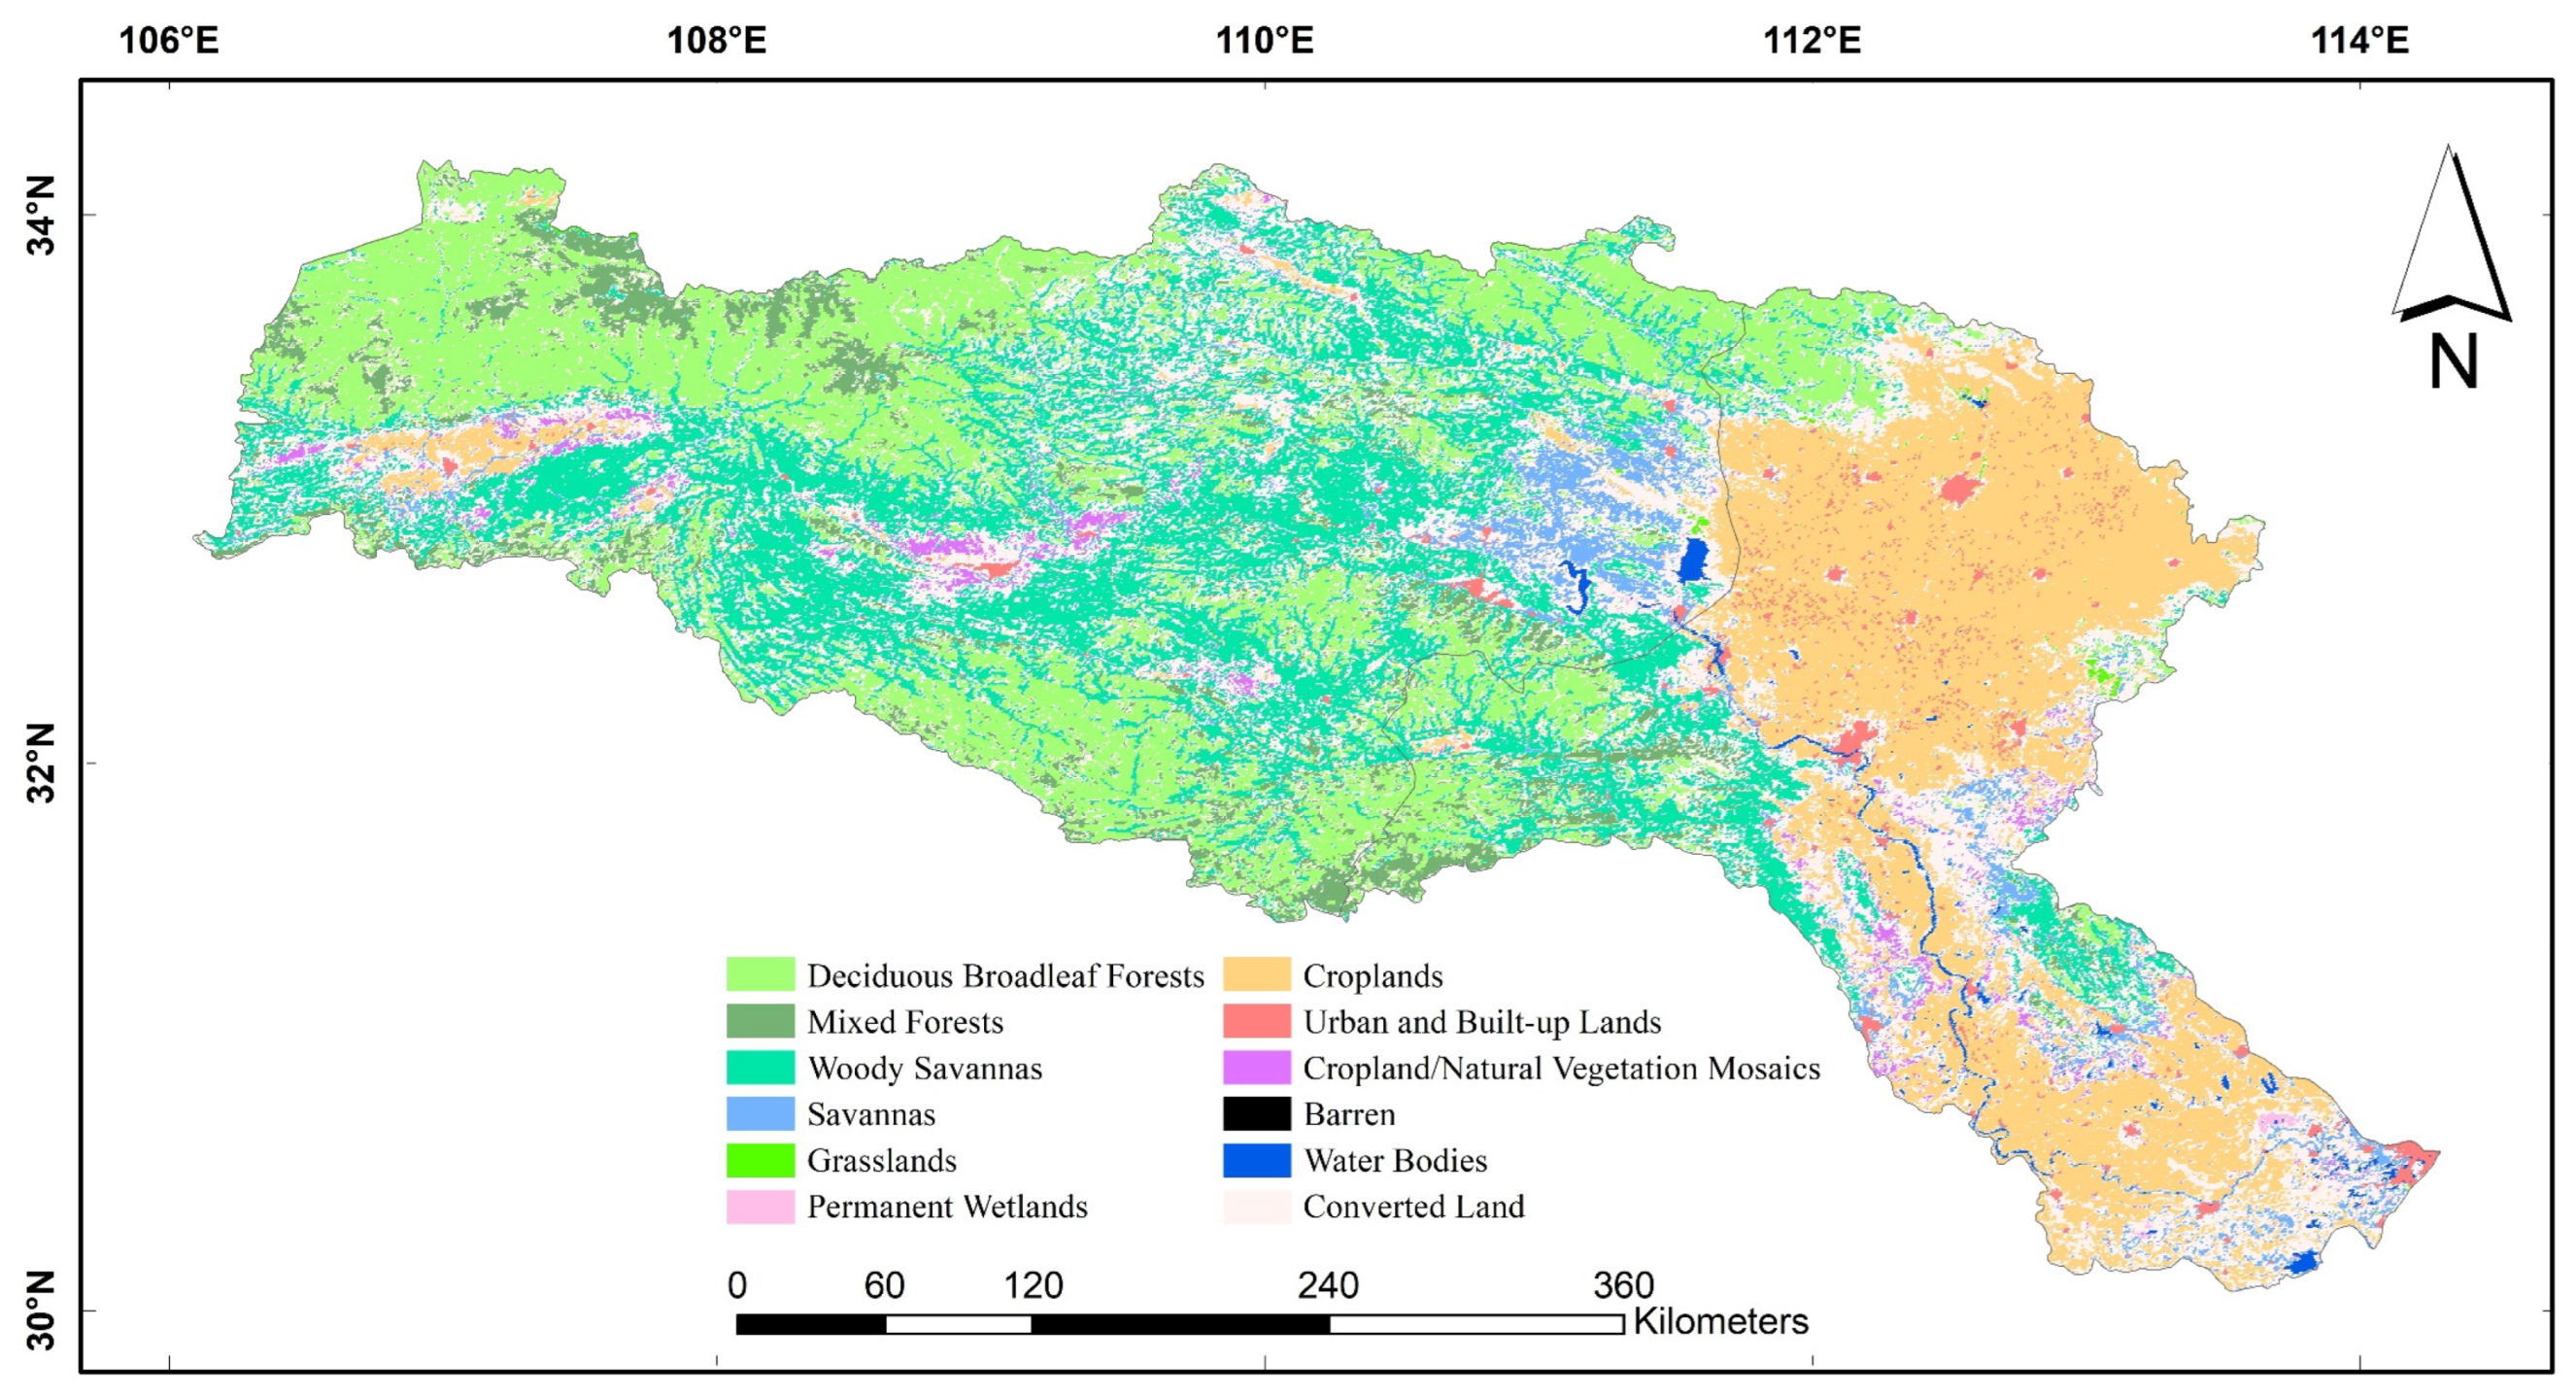
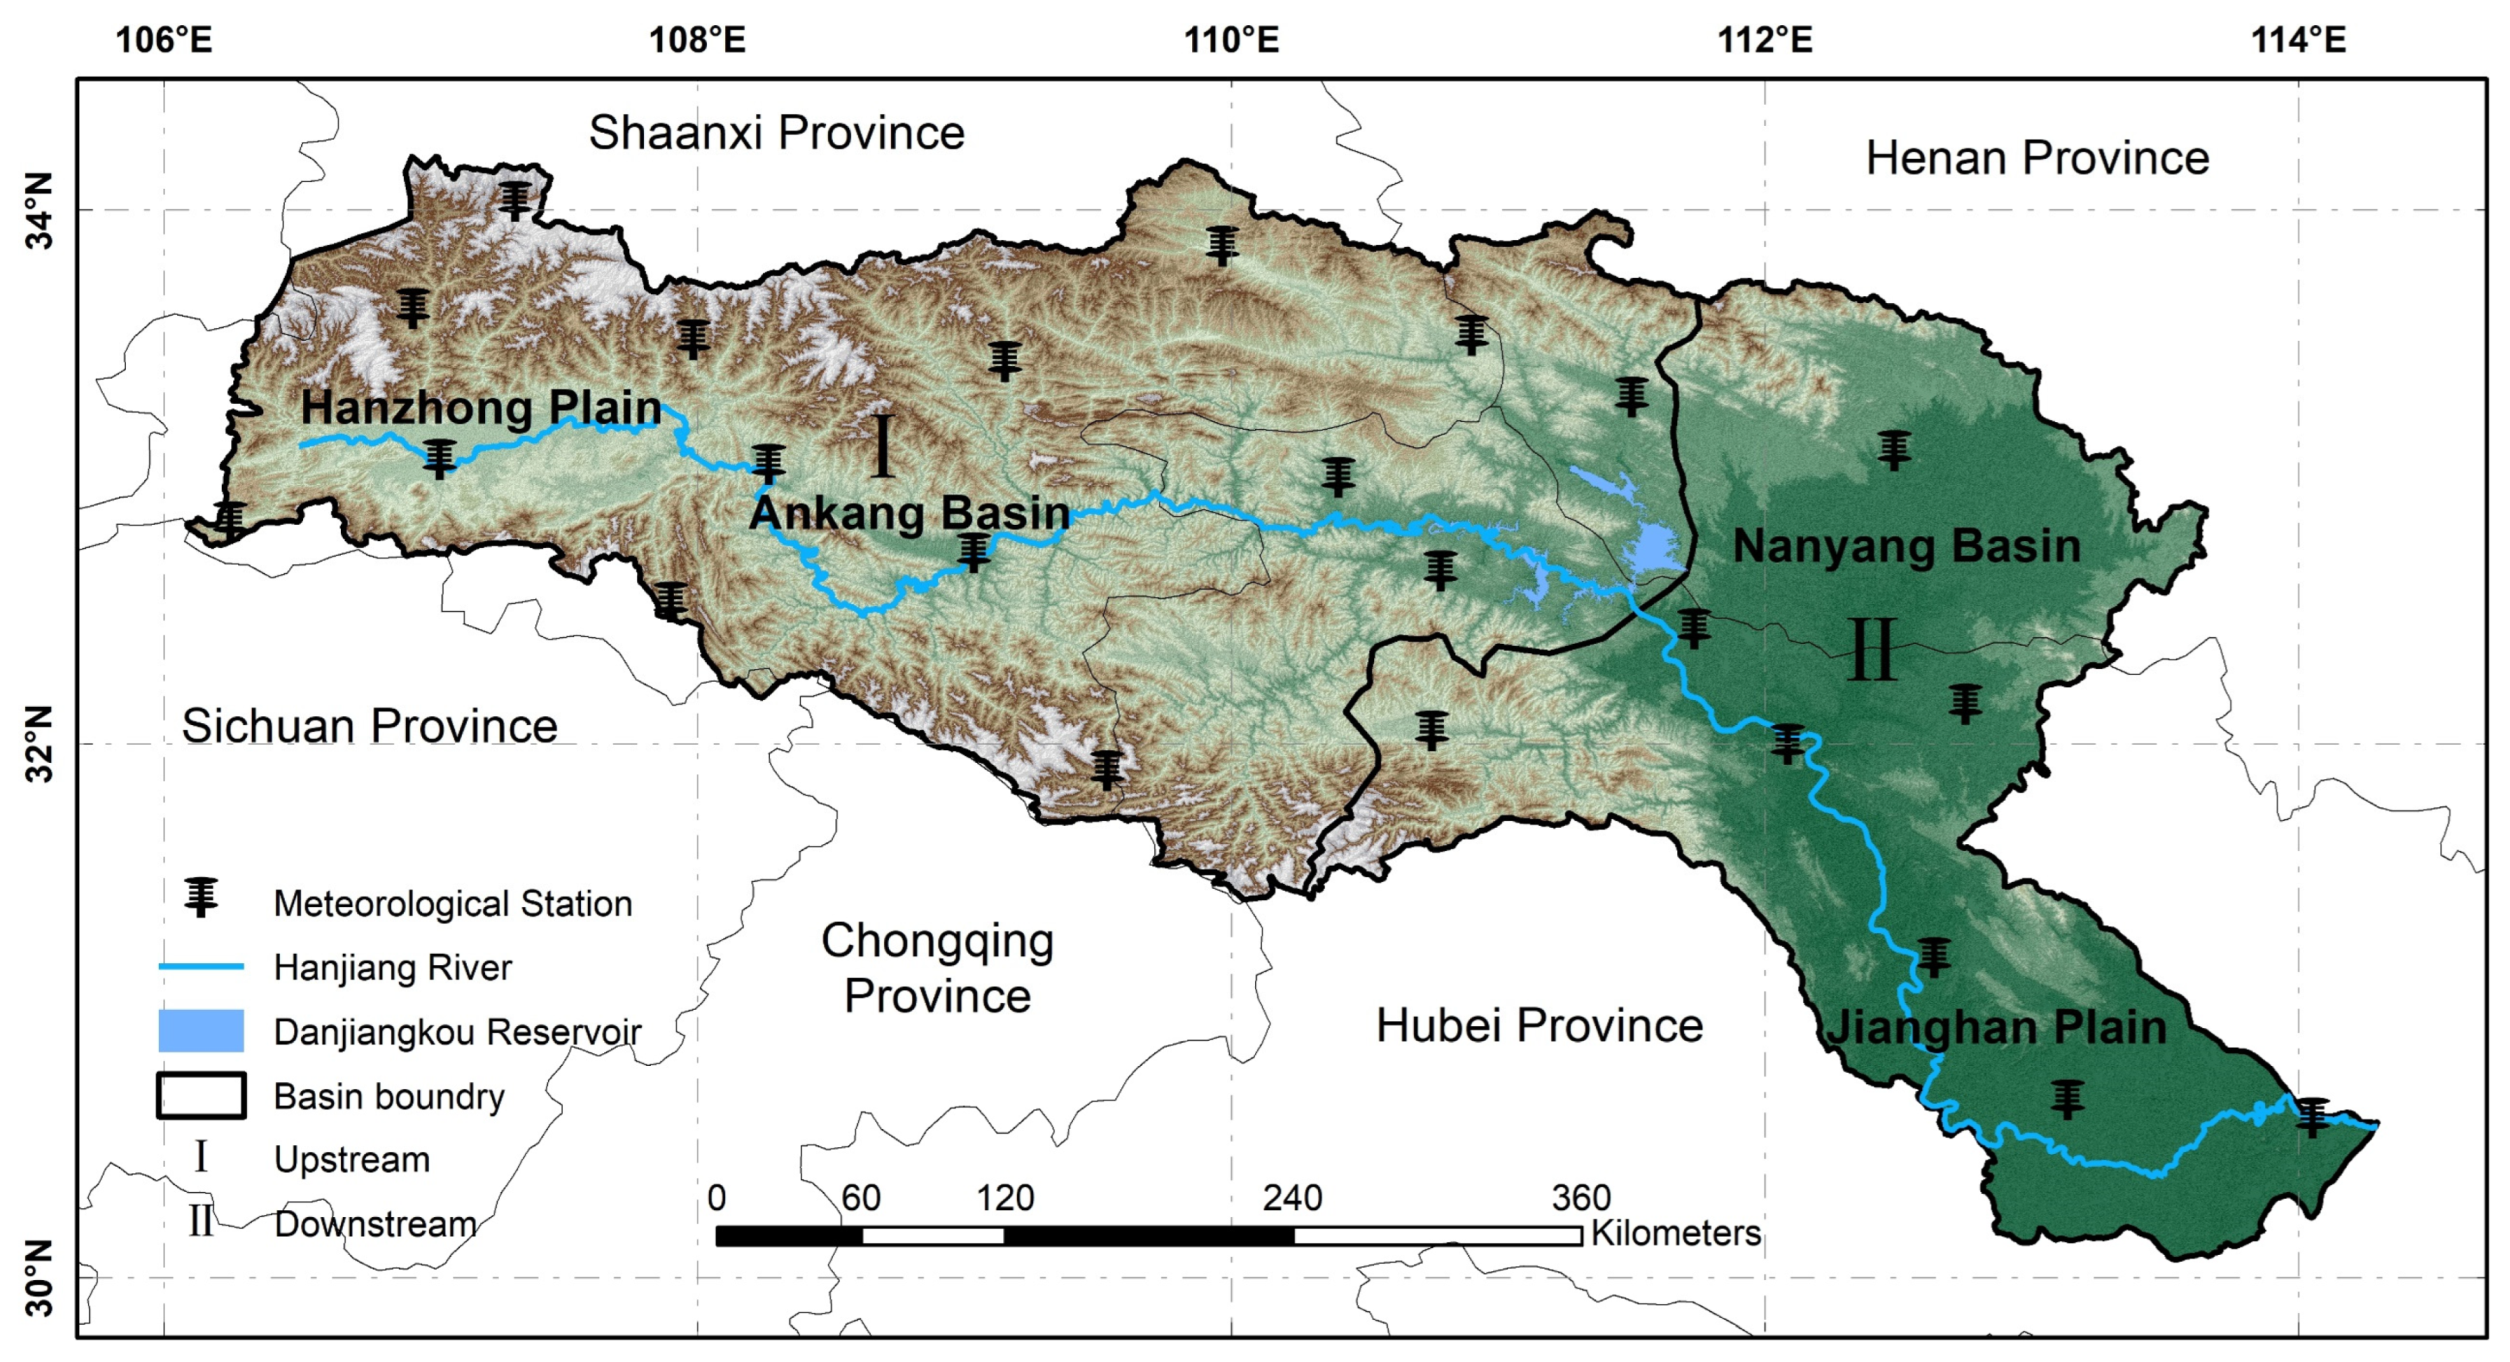
2.1. Study Area
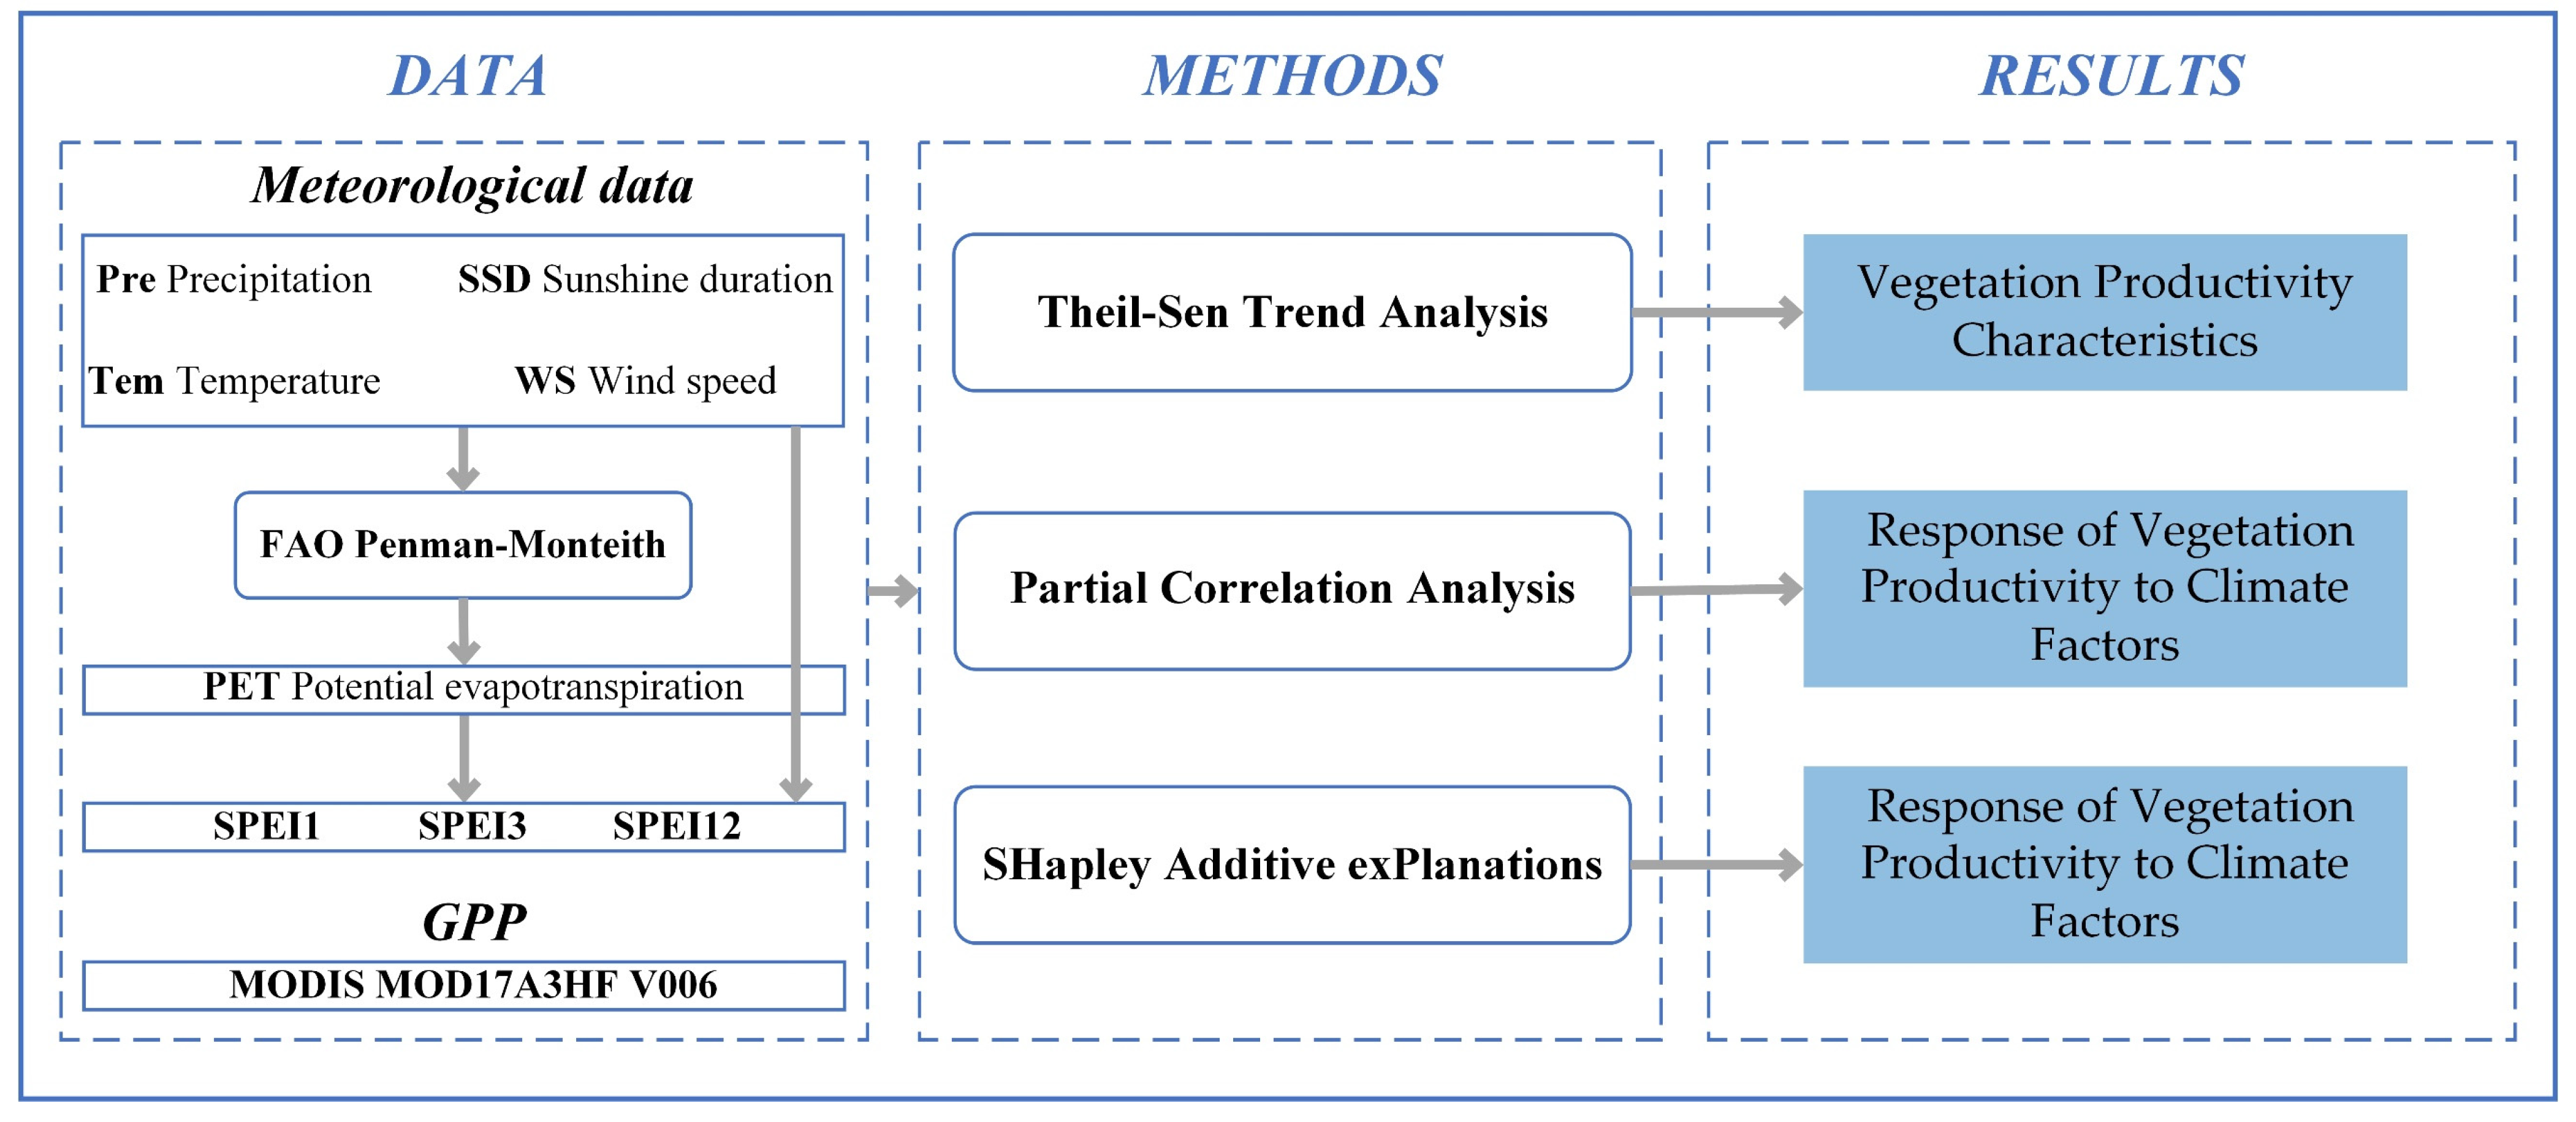
2.2. Data Sources
2.2.1. GPP
2.2.2. Meteorological Data
2.2.3. Land Use and Land Cover (LULC)
2.3. Methods
2.3.1. Theil-Sen Trend Analysis
2.3.2. Partial Correlation Analysis
2.3.3. Relative Contribution Identification
3. Results
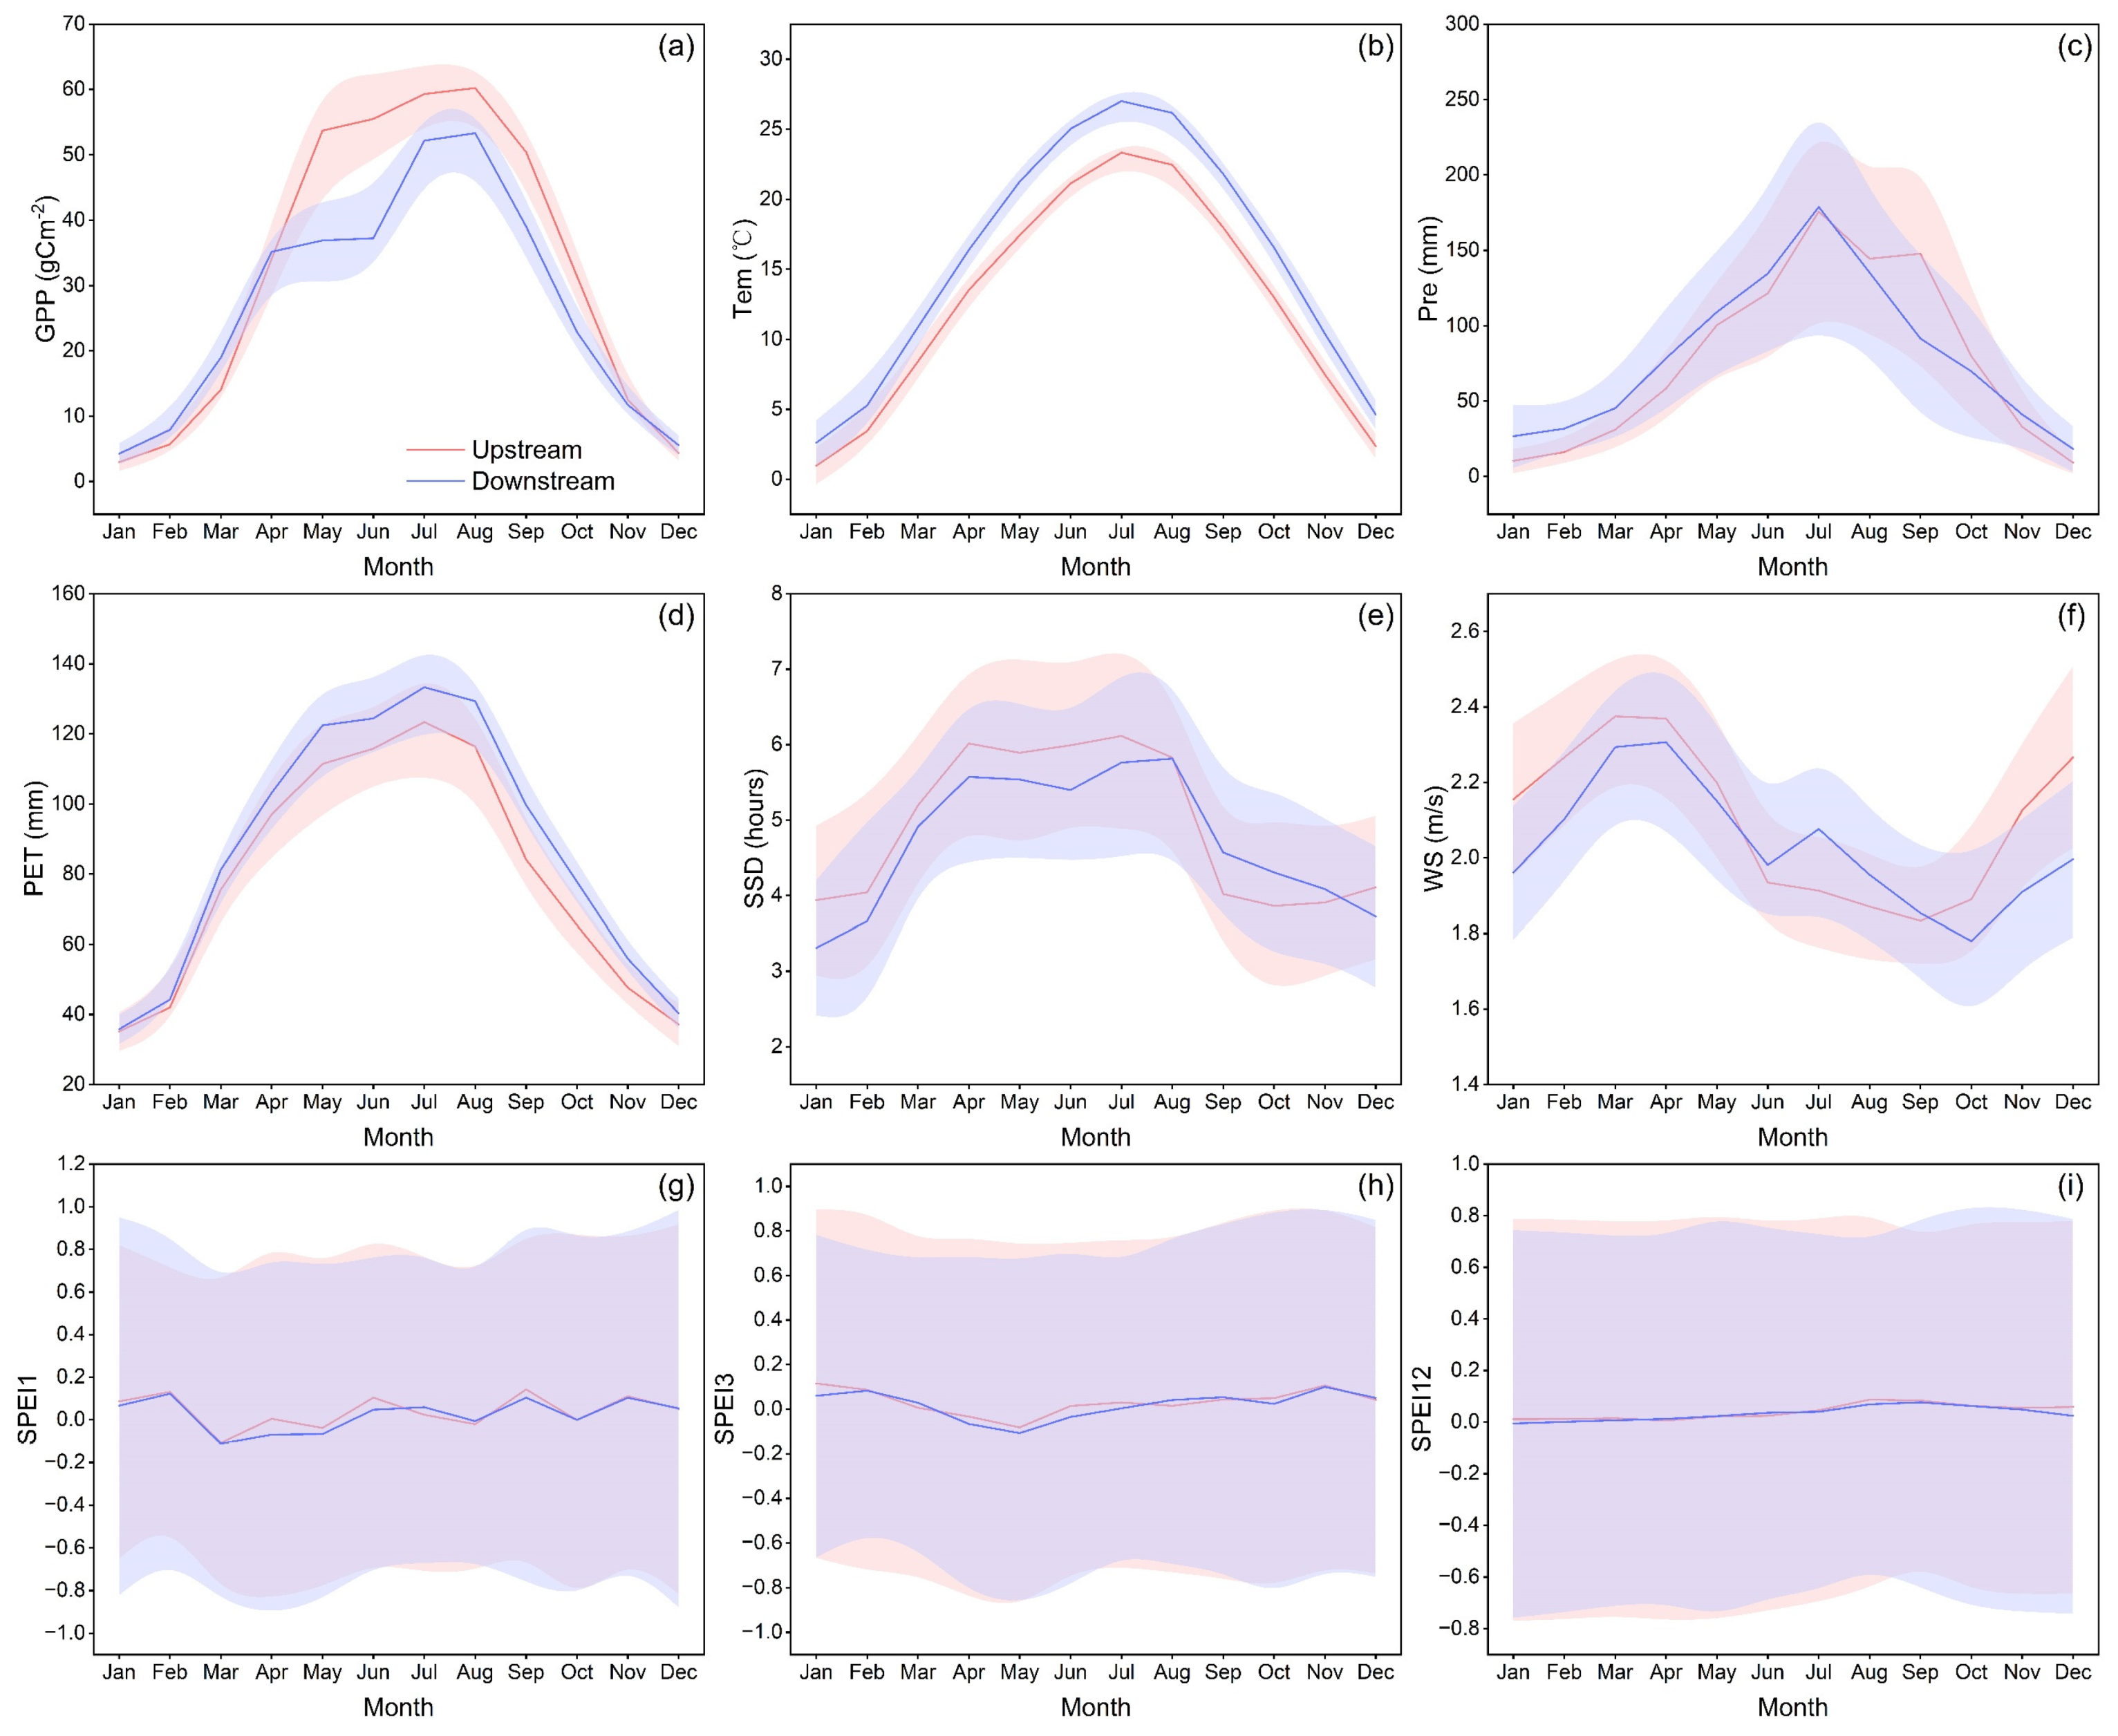
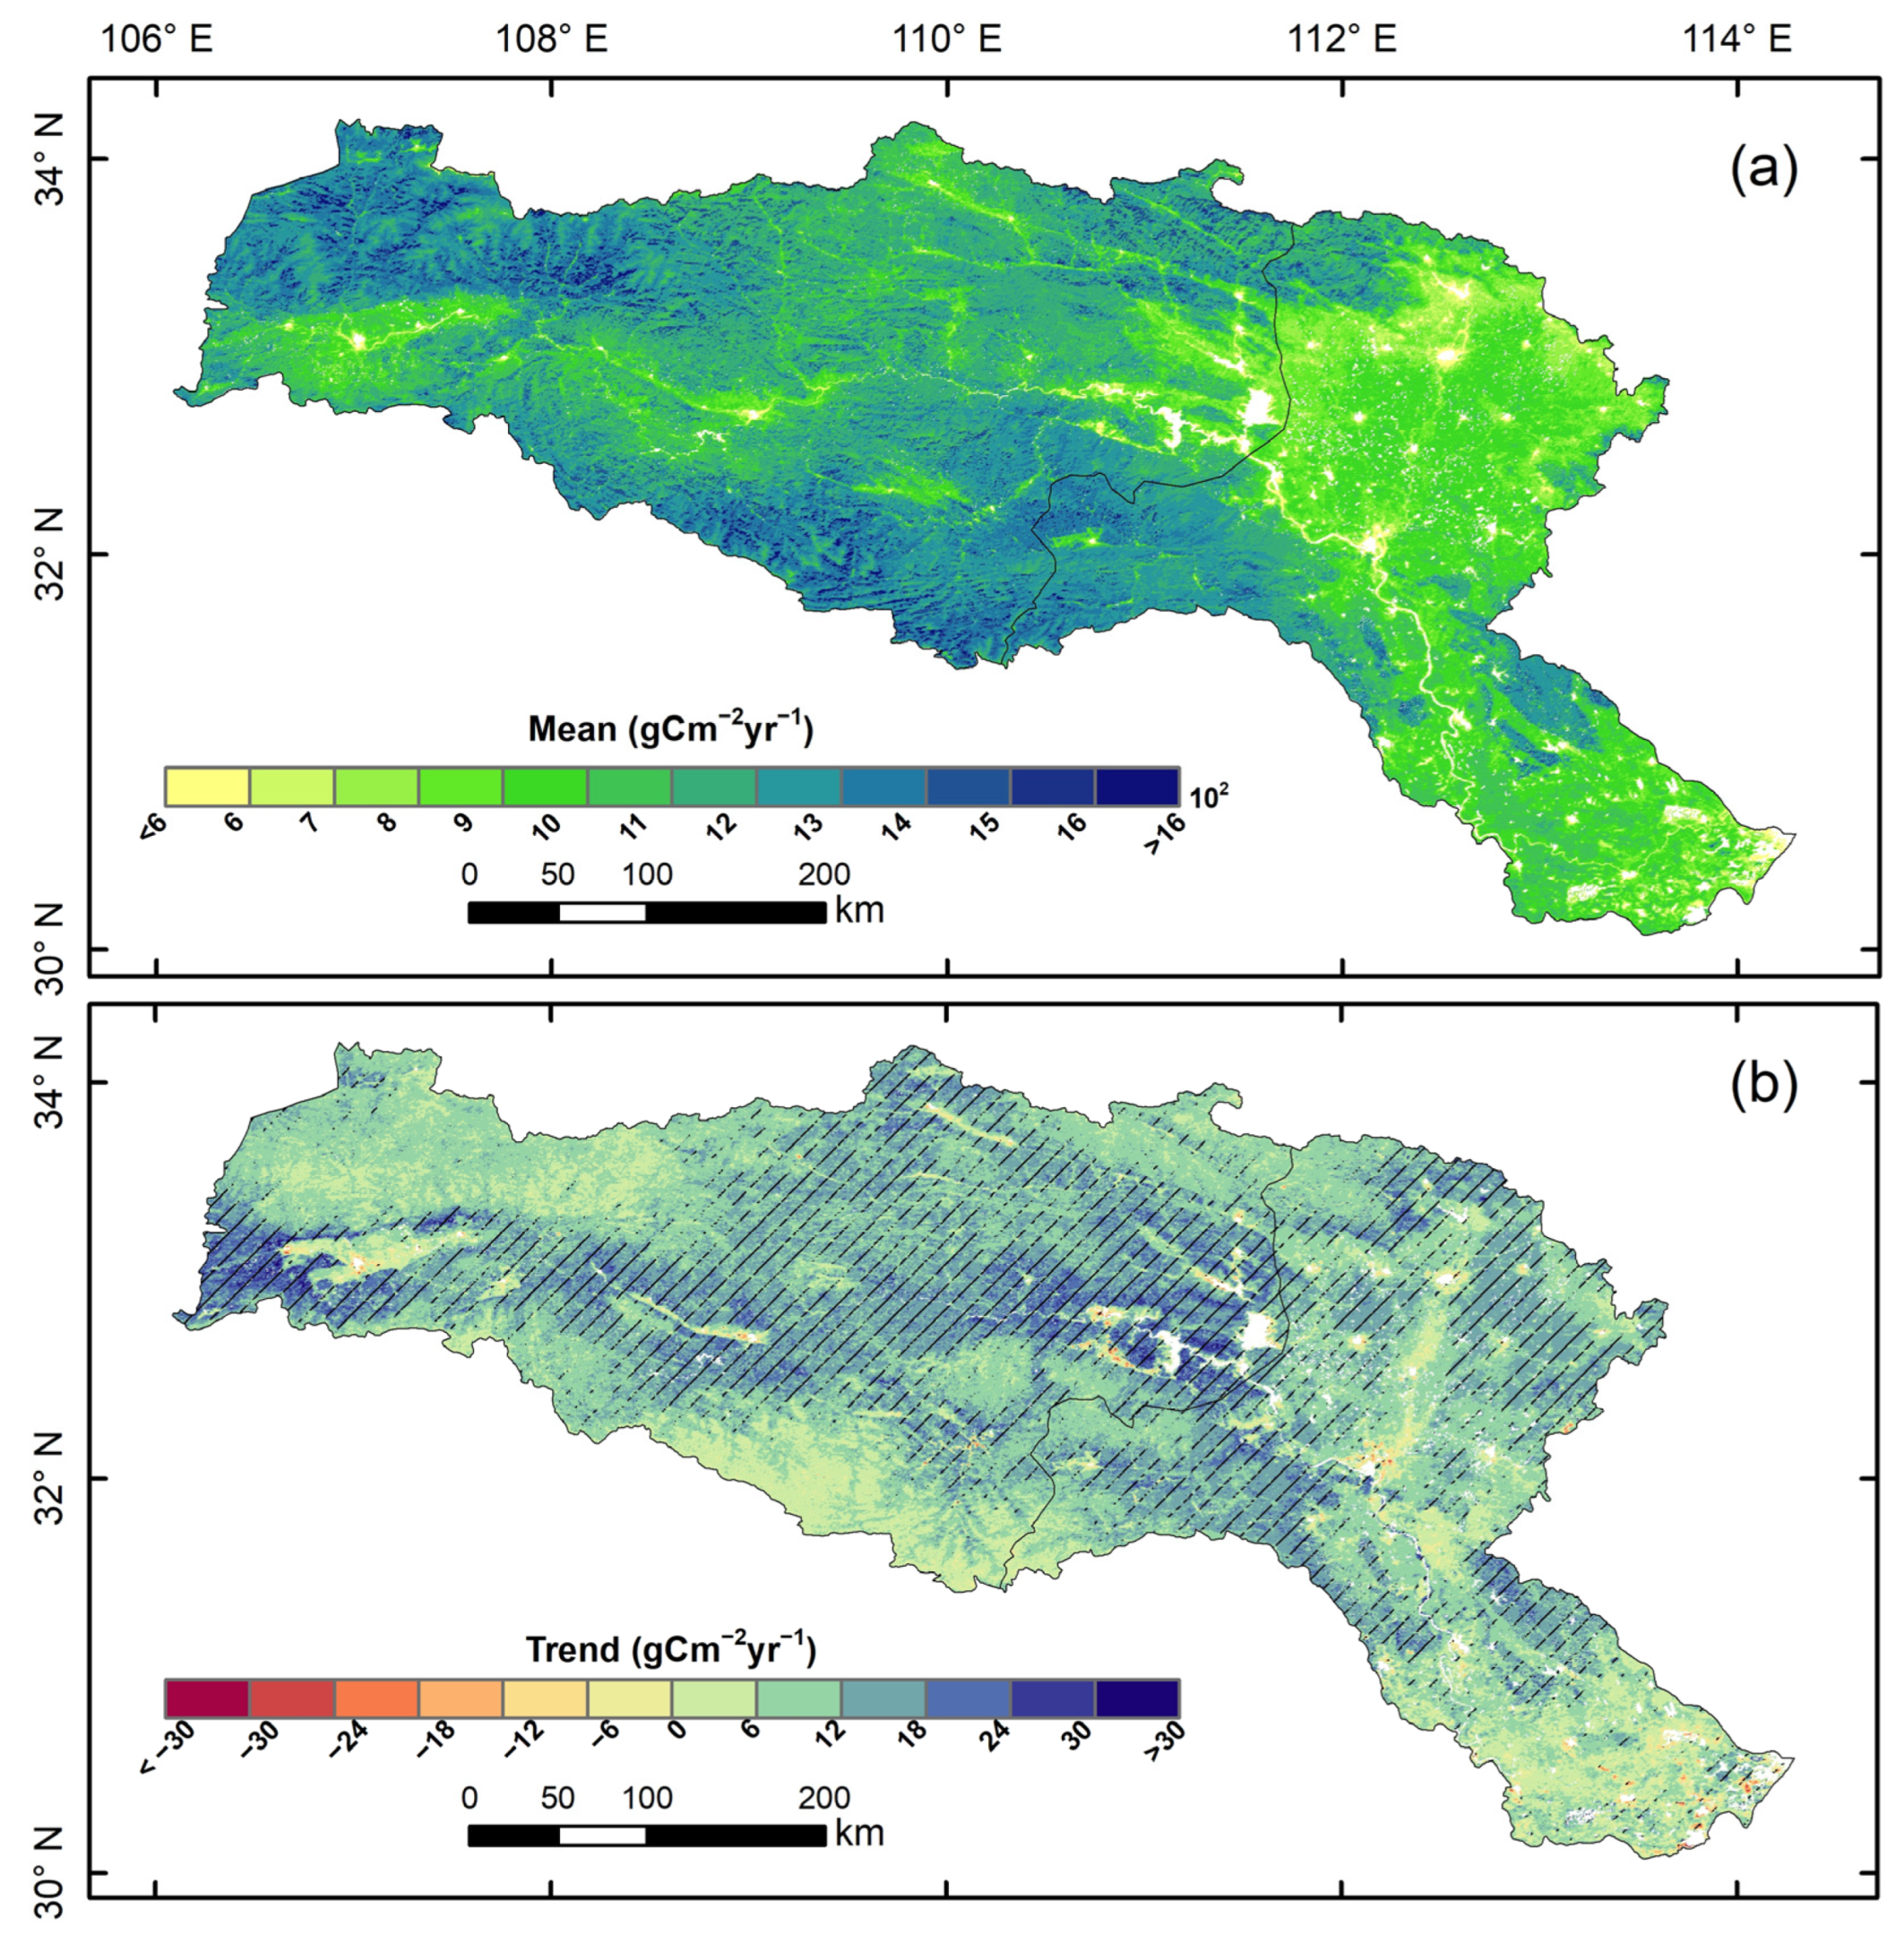
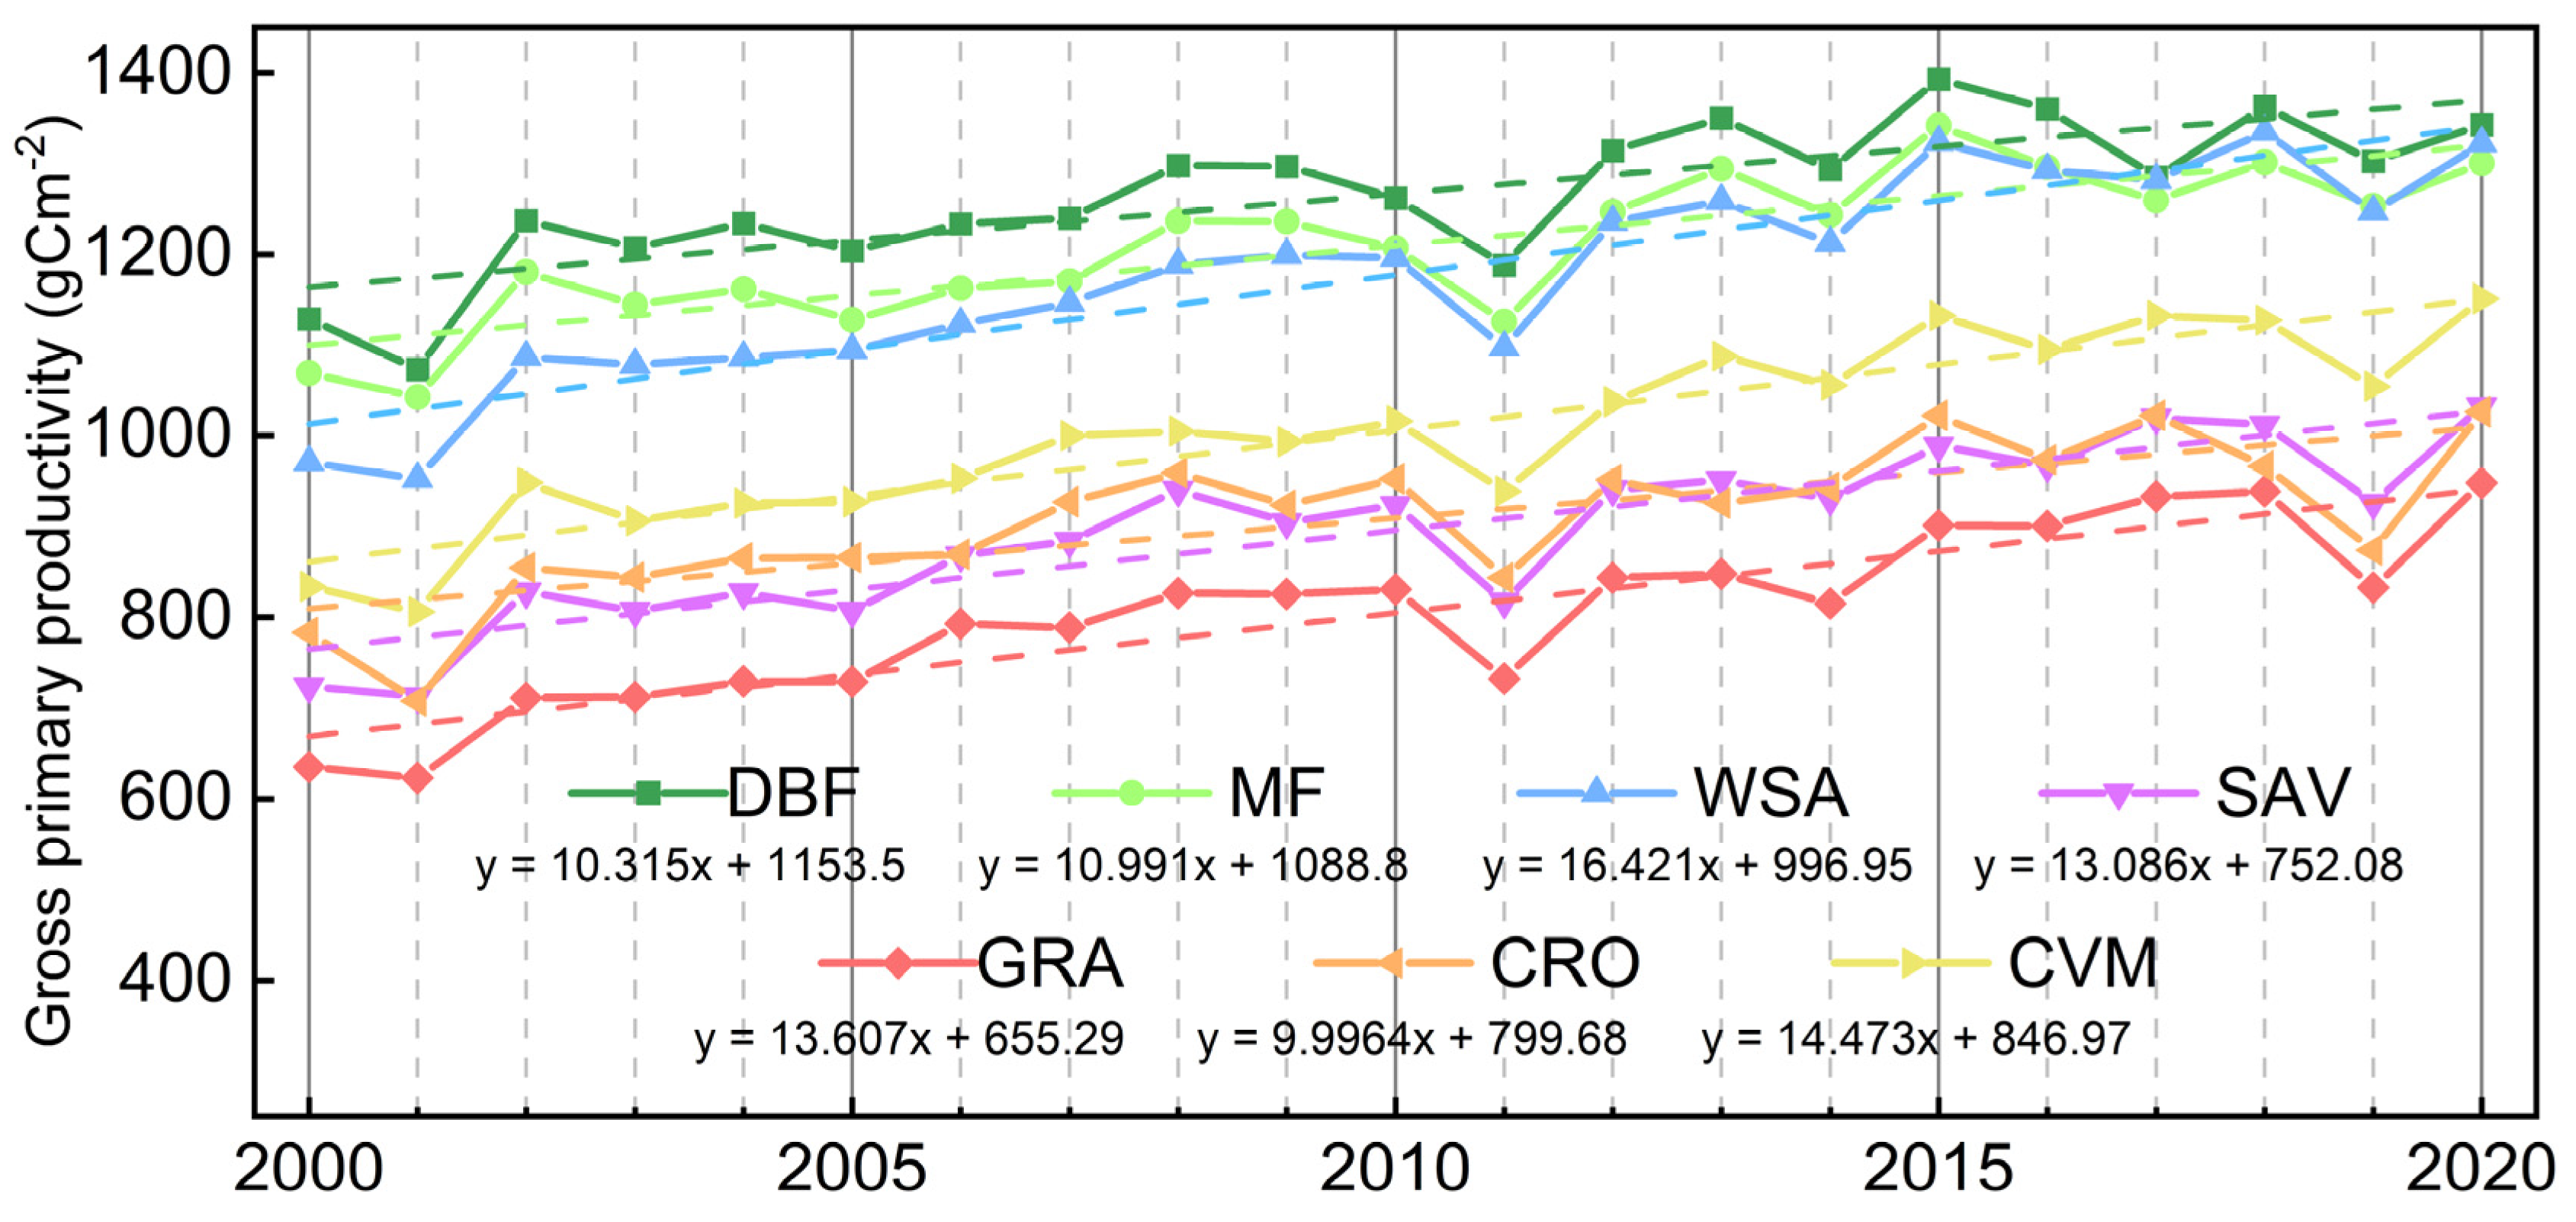
3.1. Vegetation Productivity Characteristics in the HJRB from 2000 to 2020
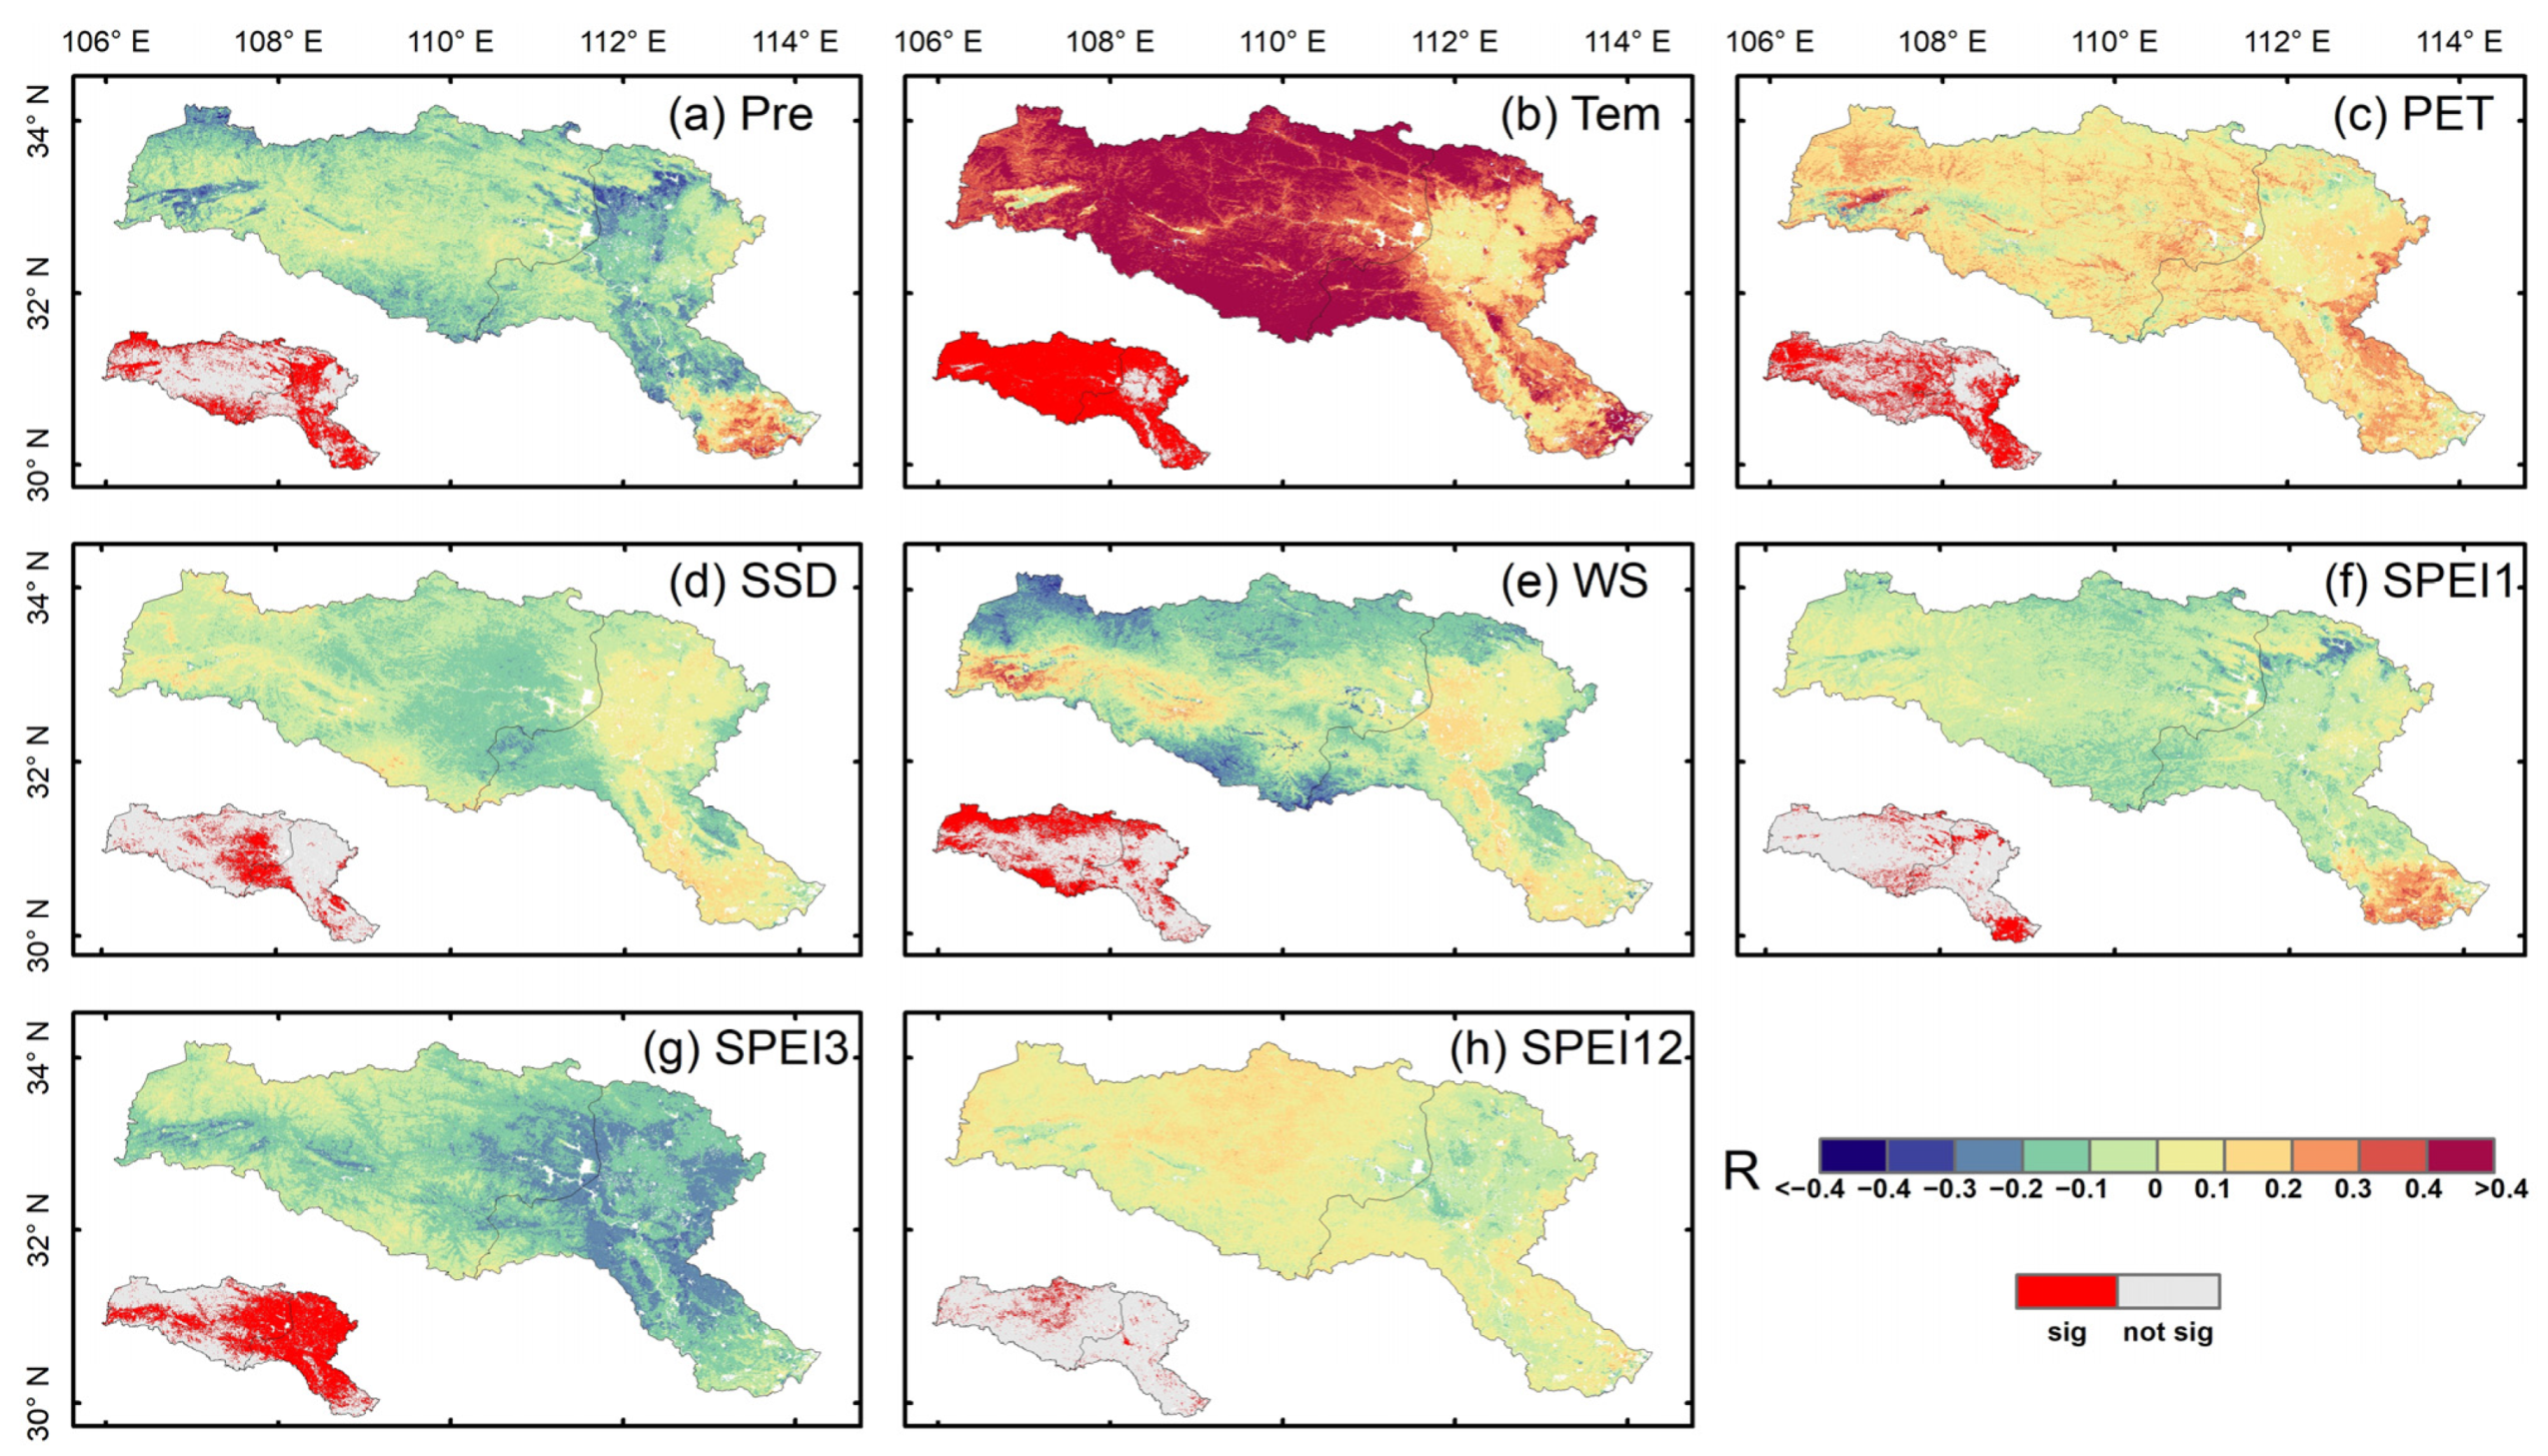
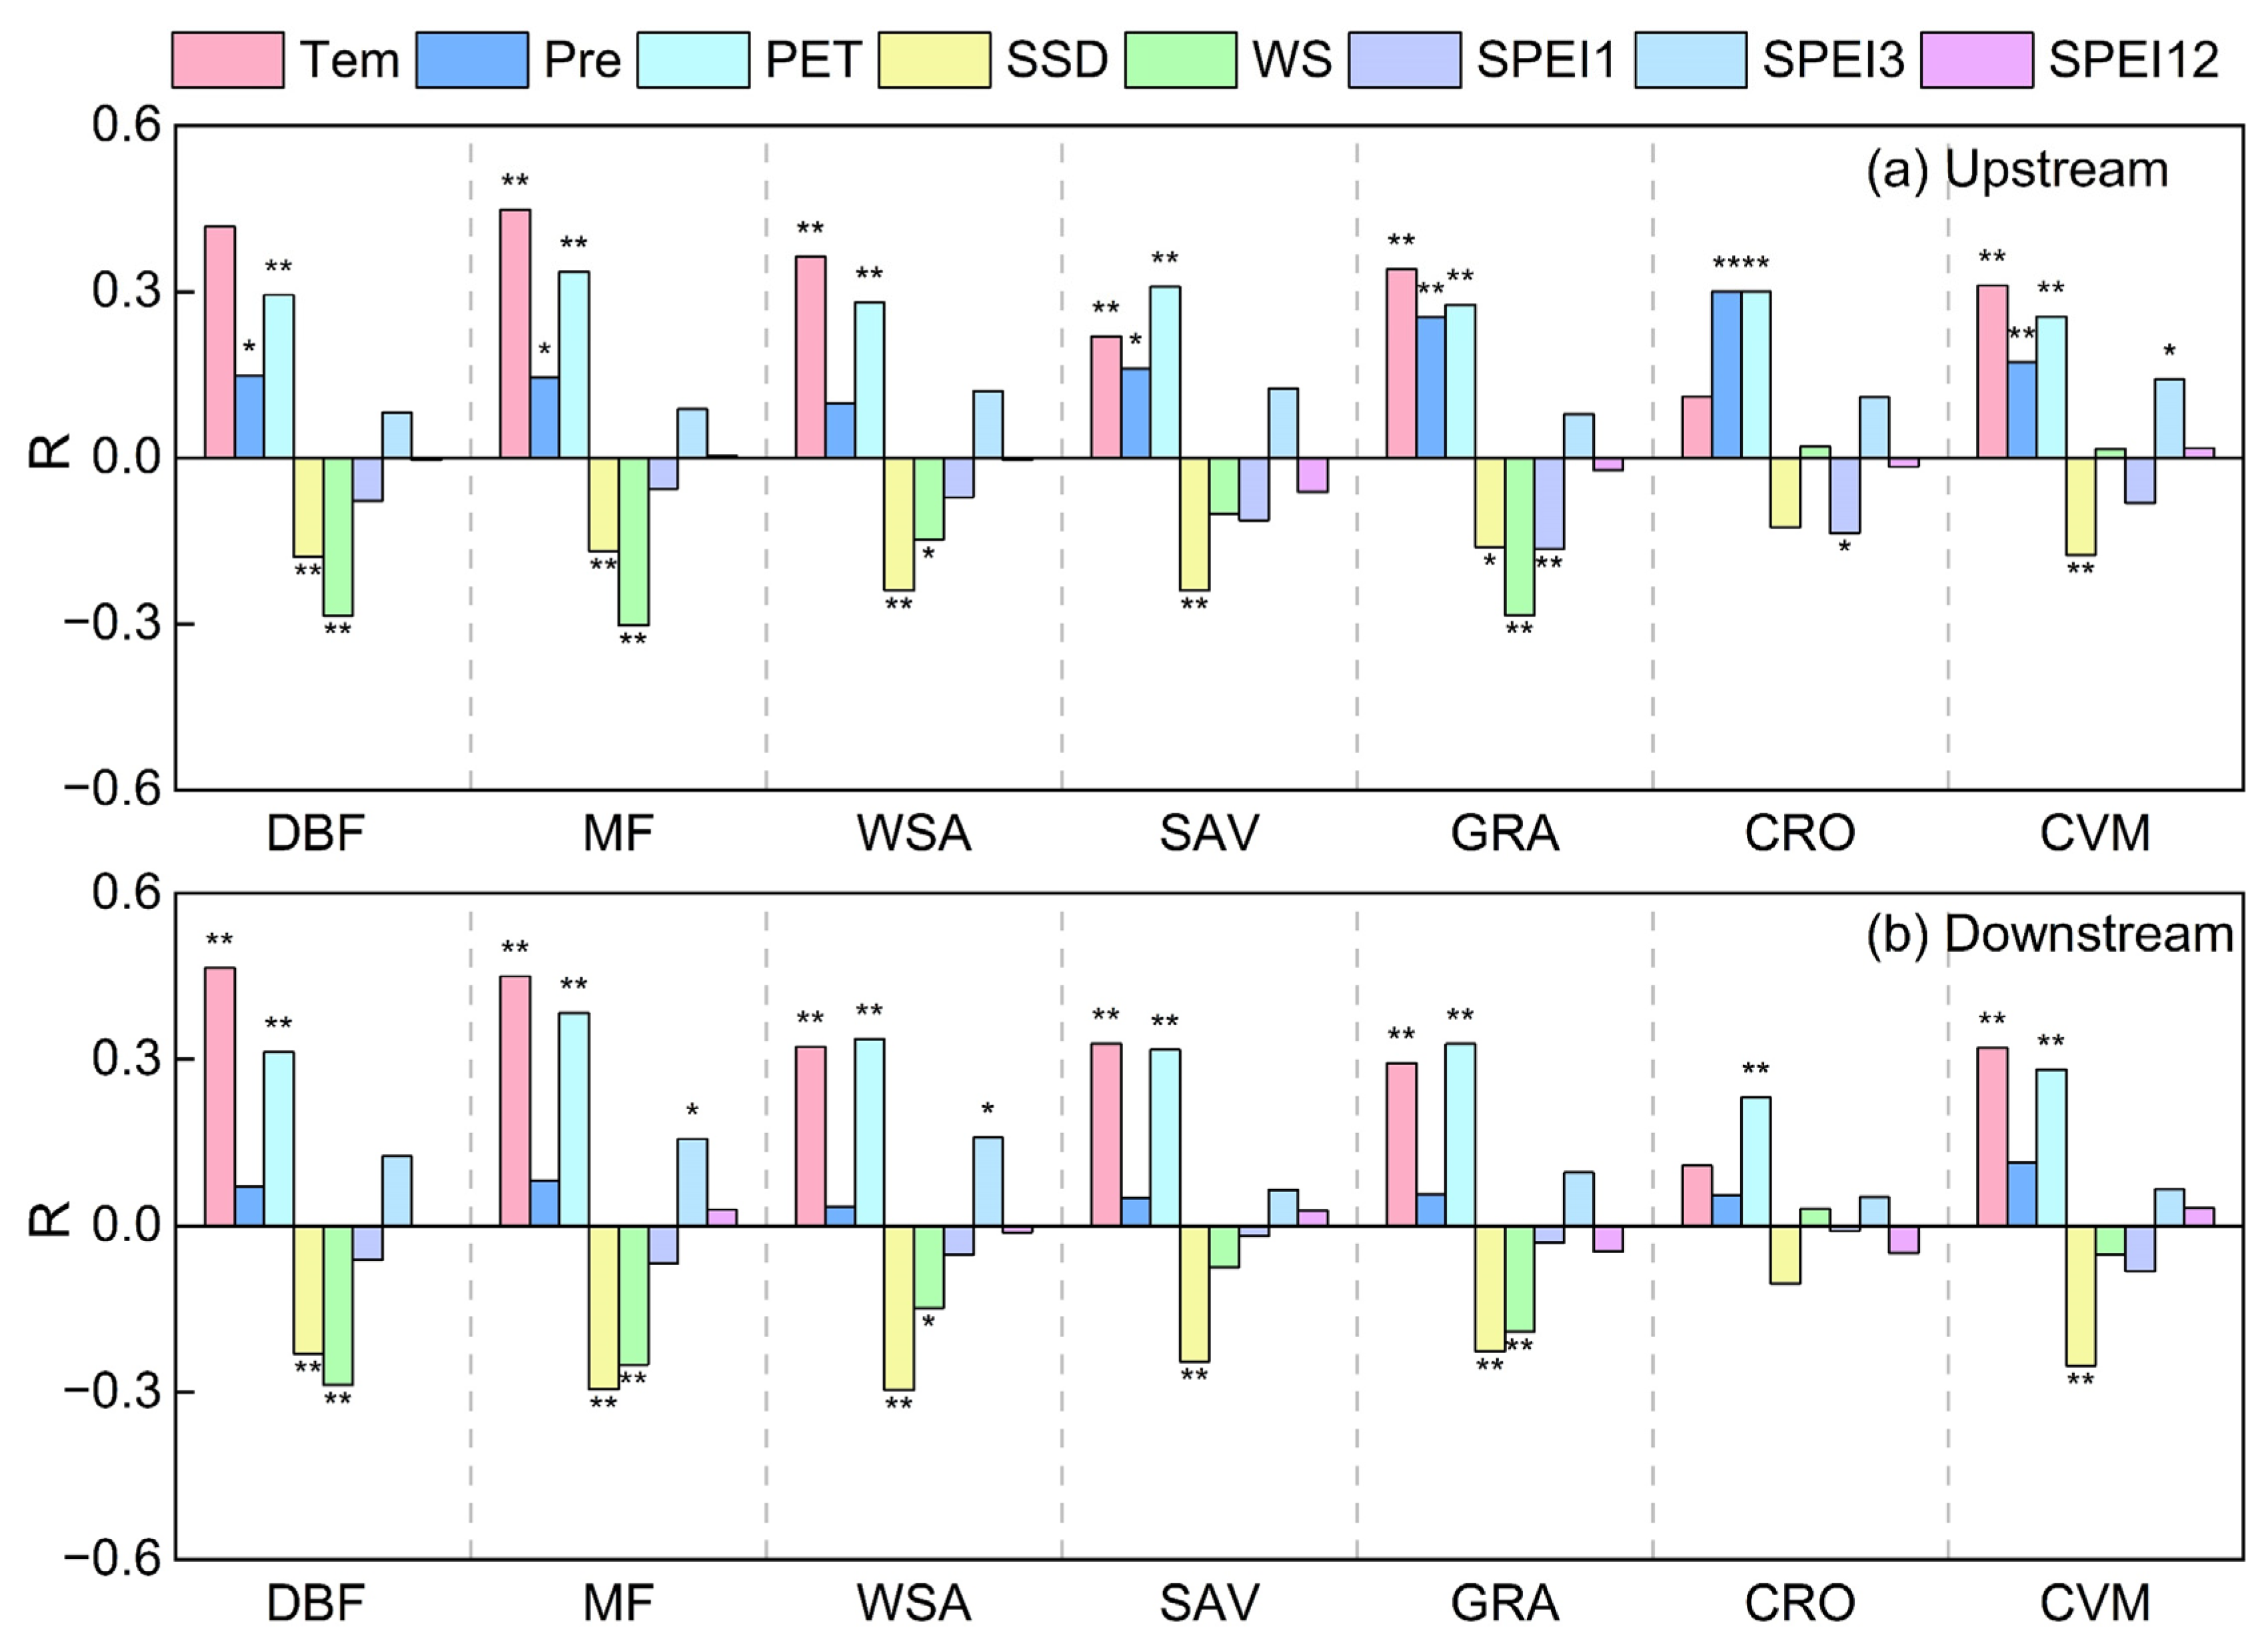
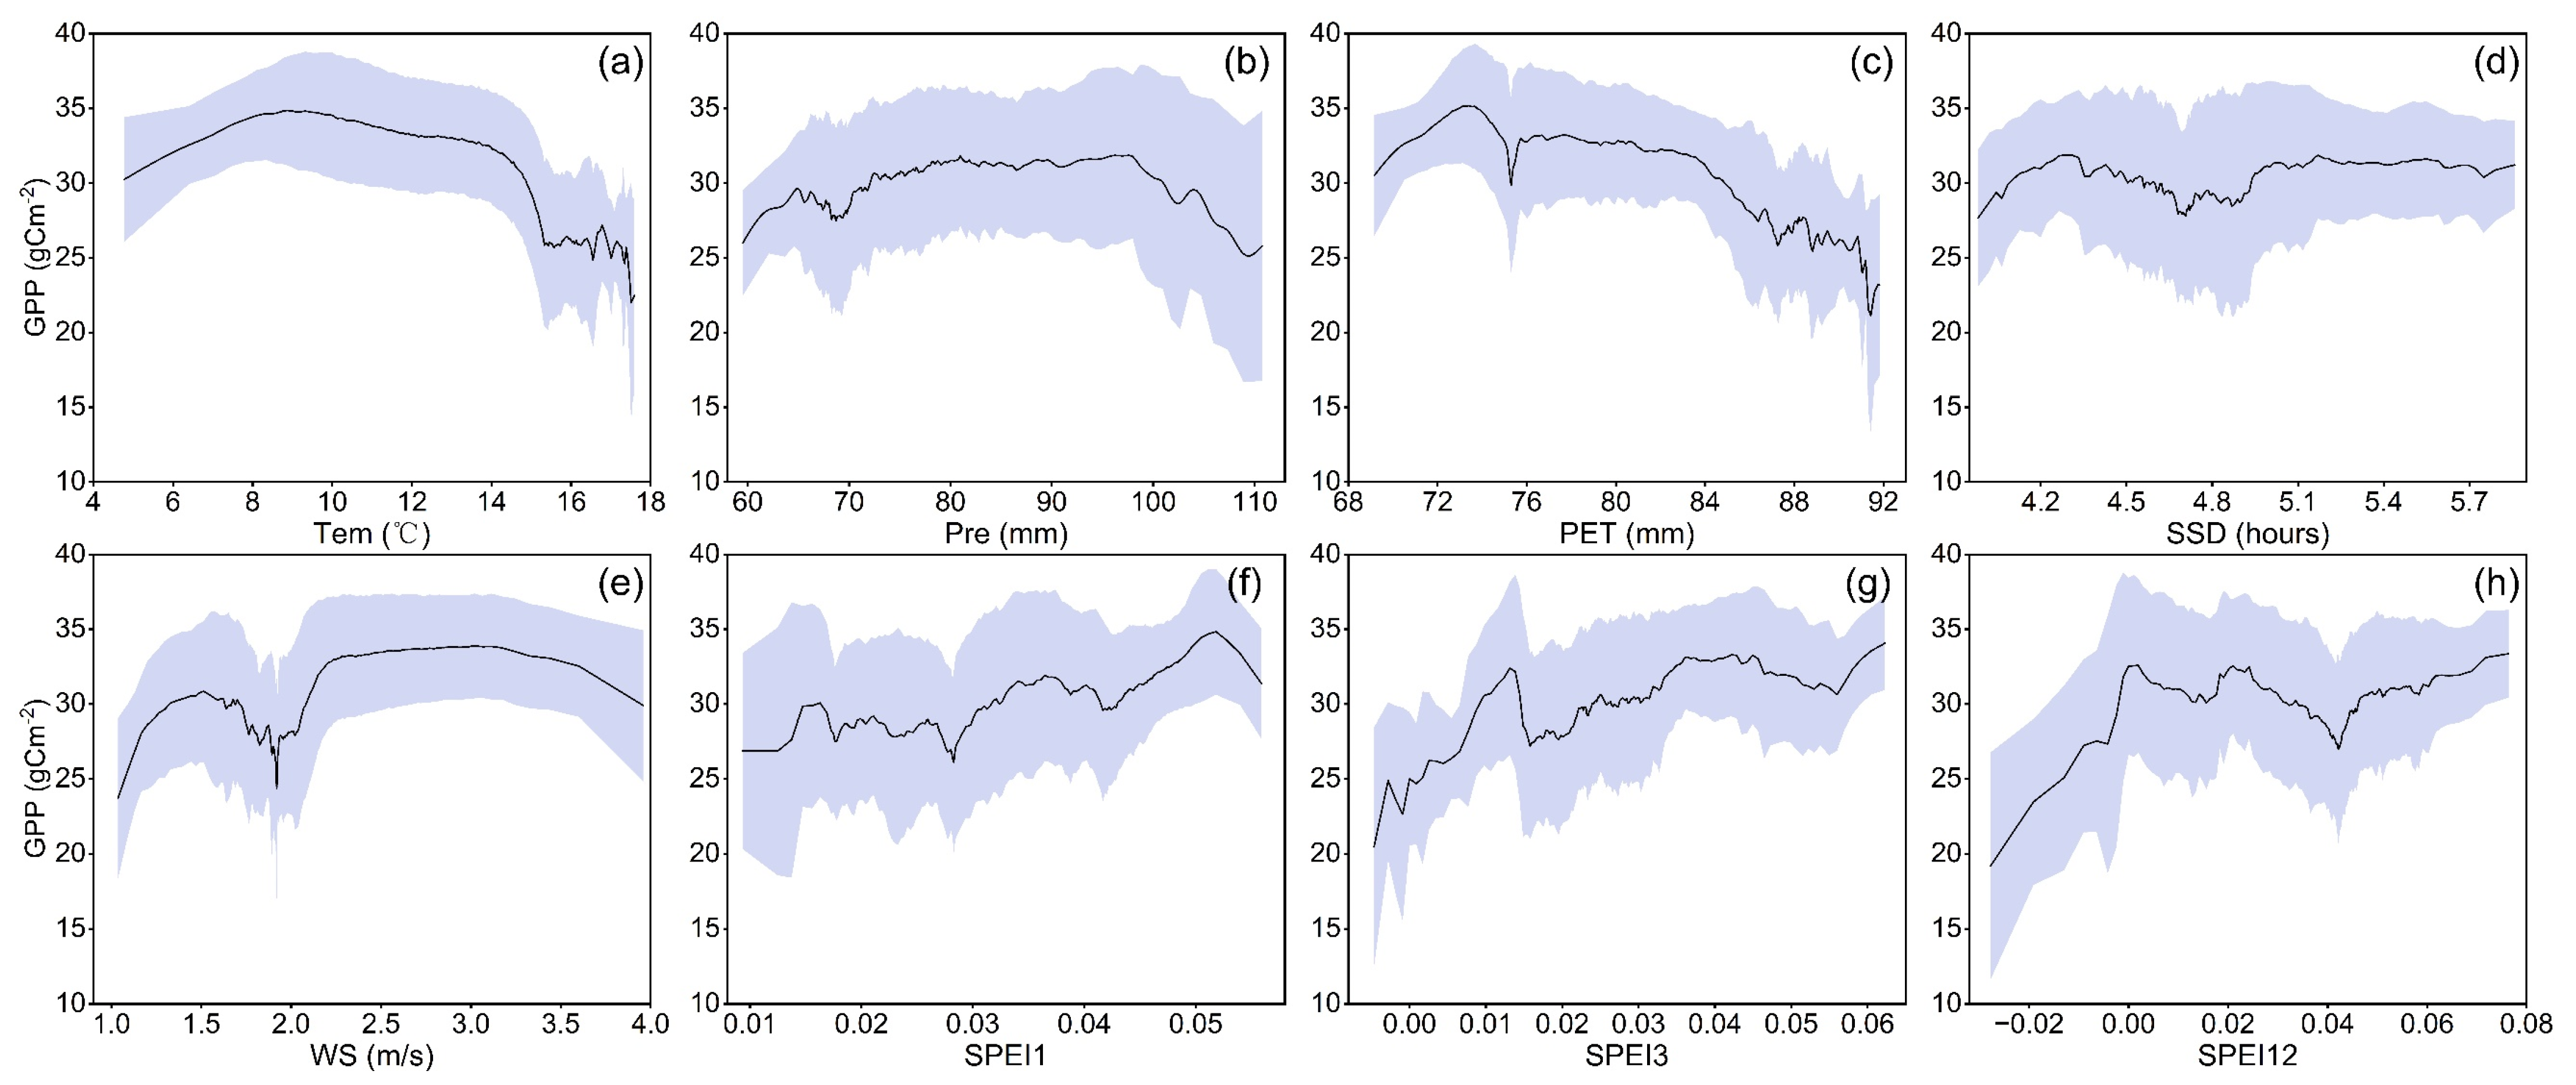
3.2. Response of Vegetation Productivity to Climate Factors
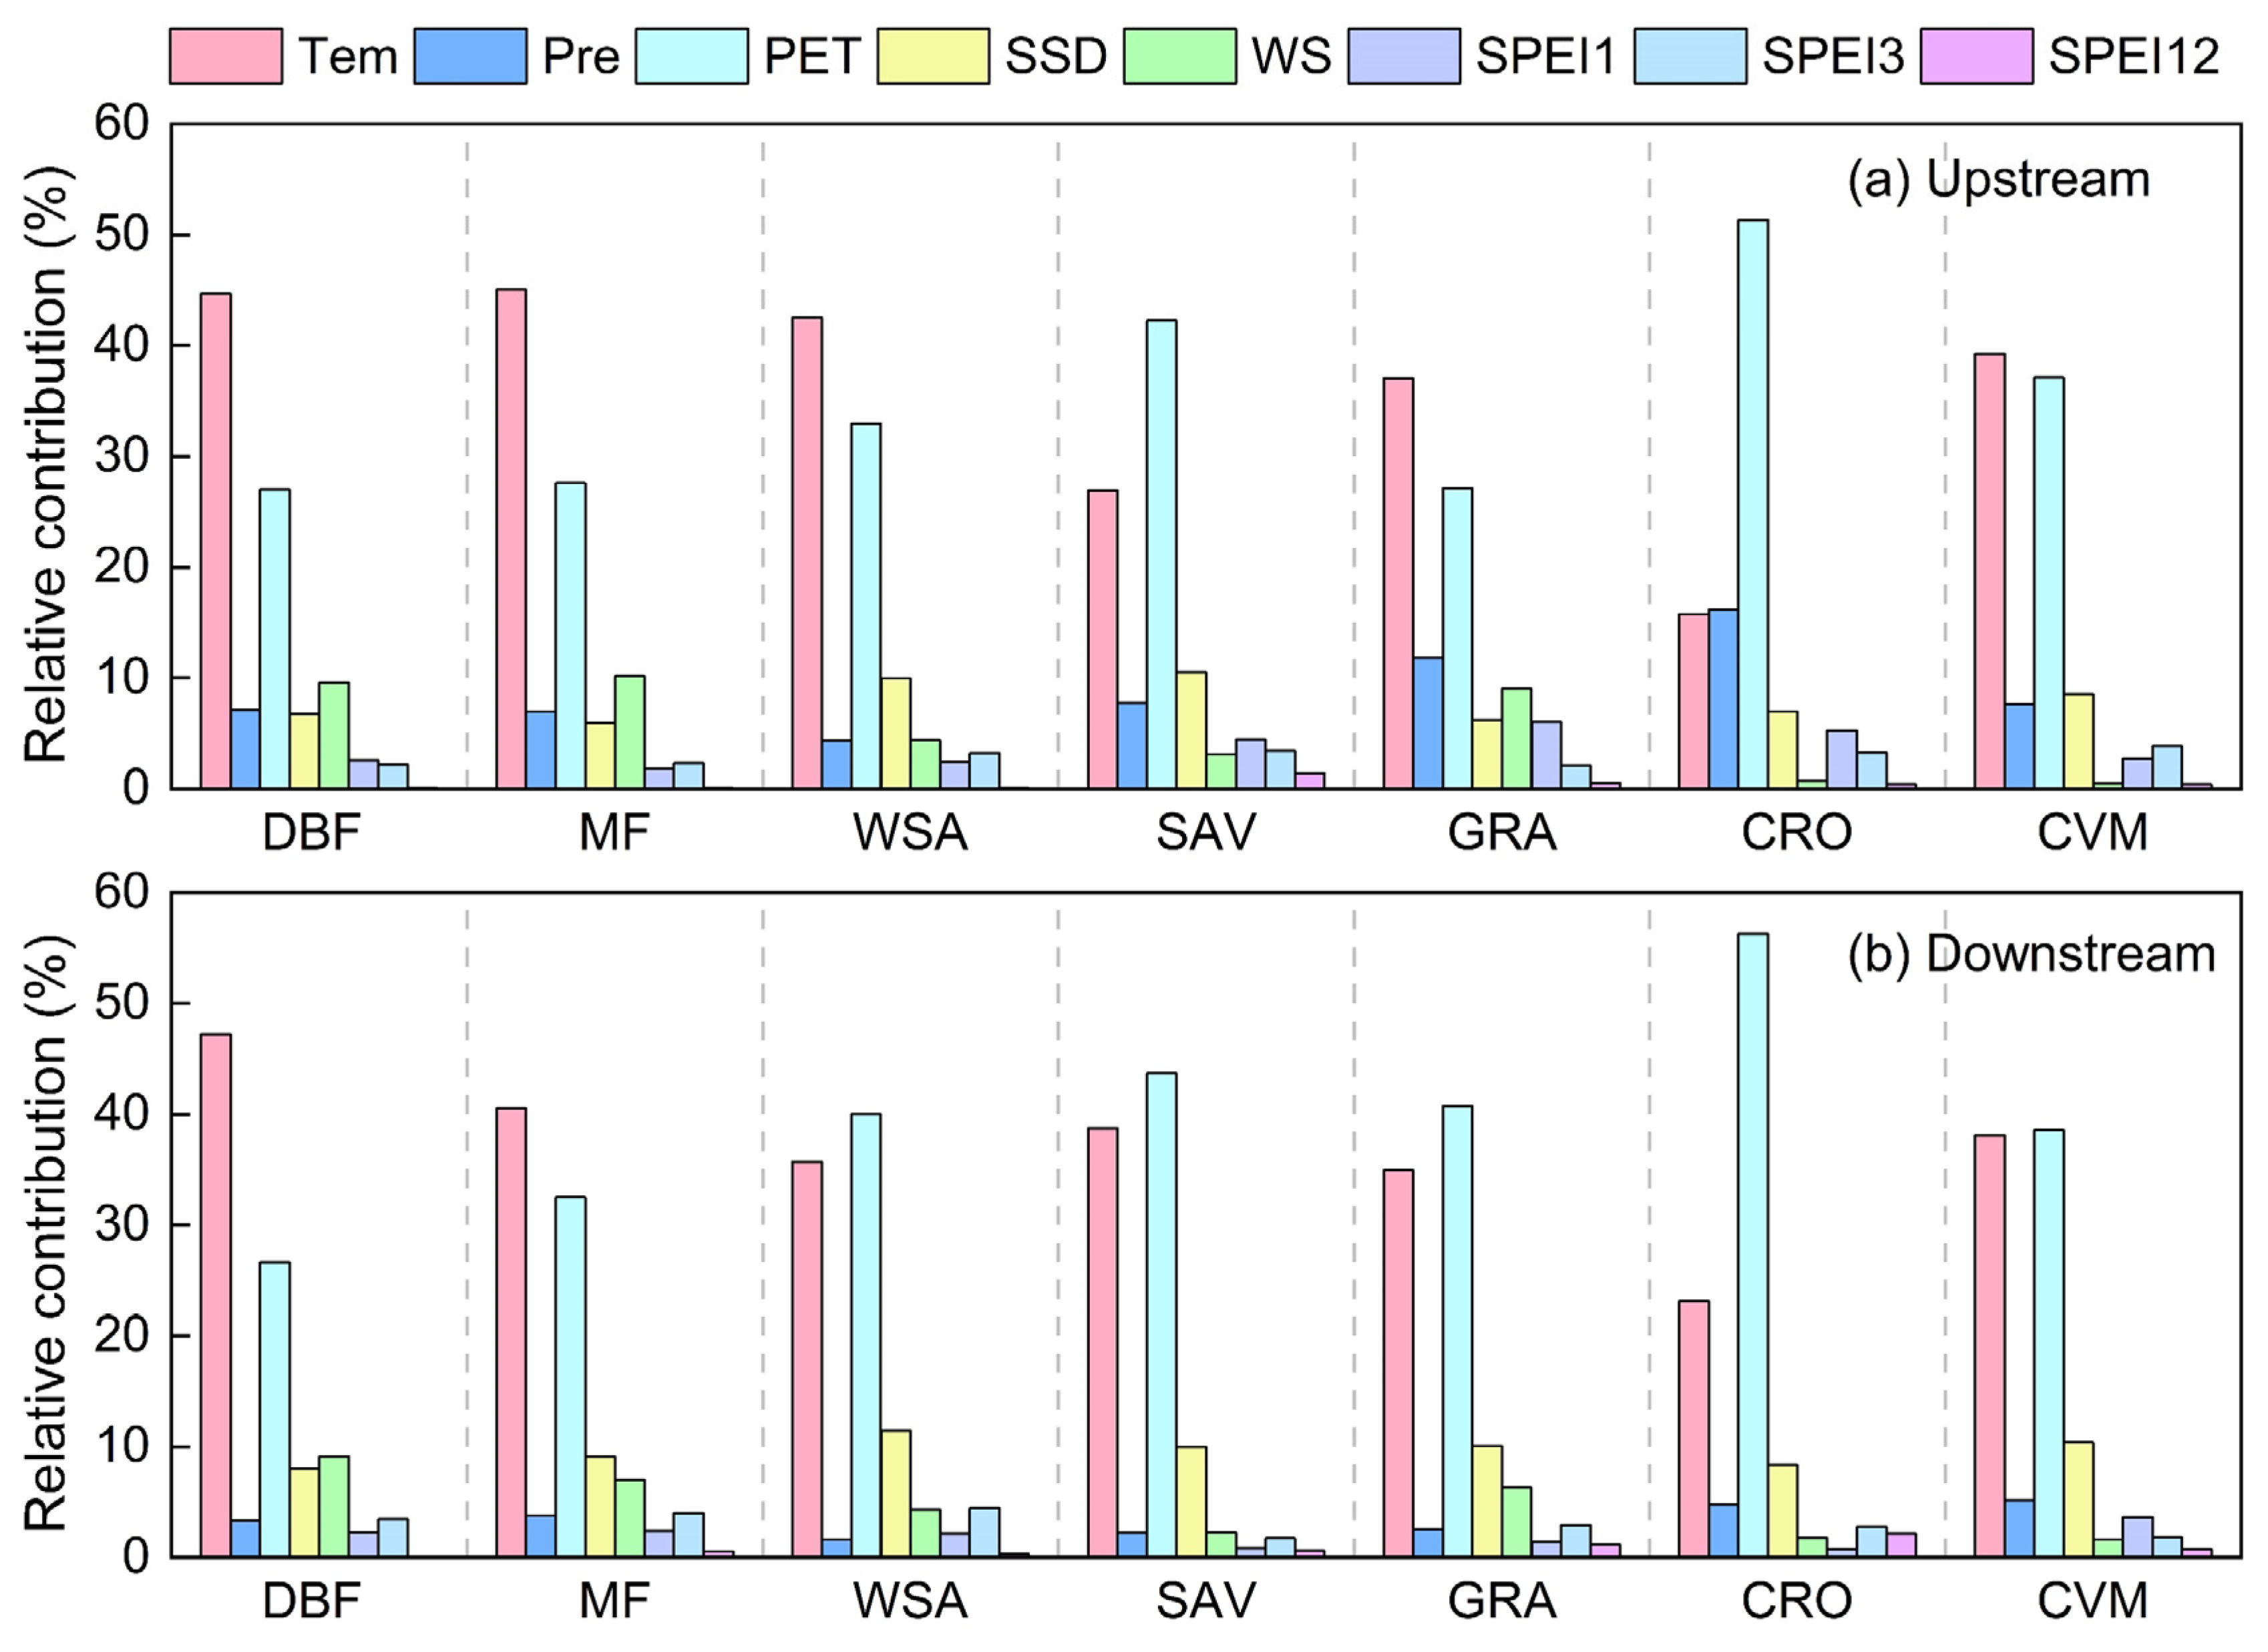
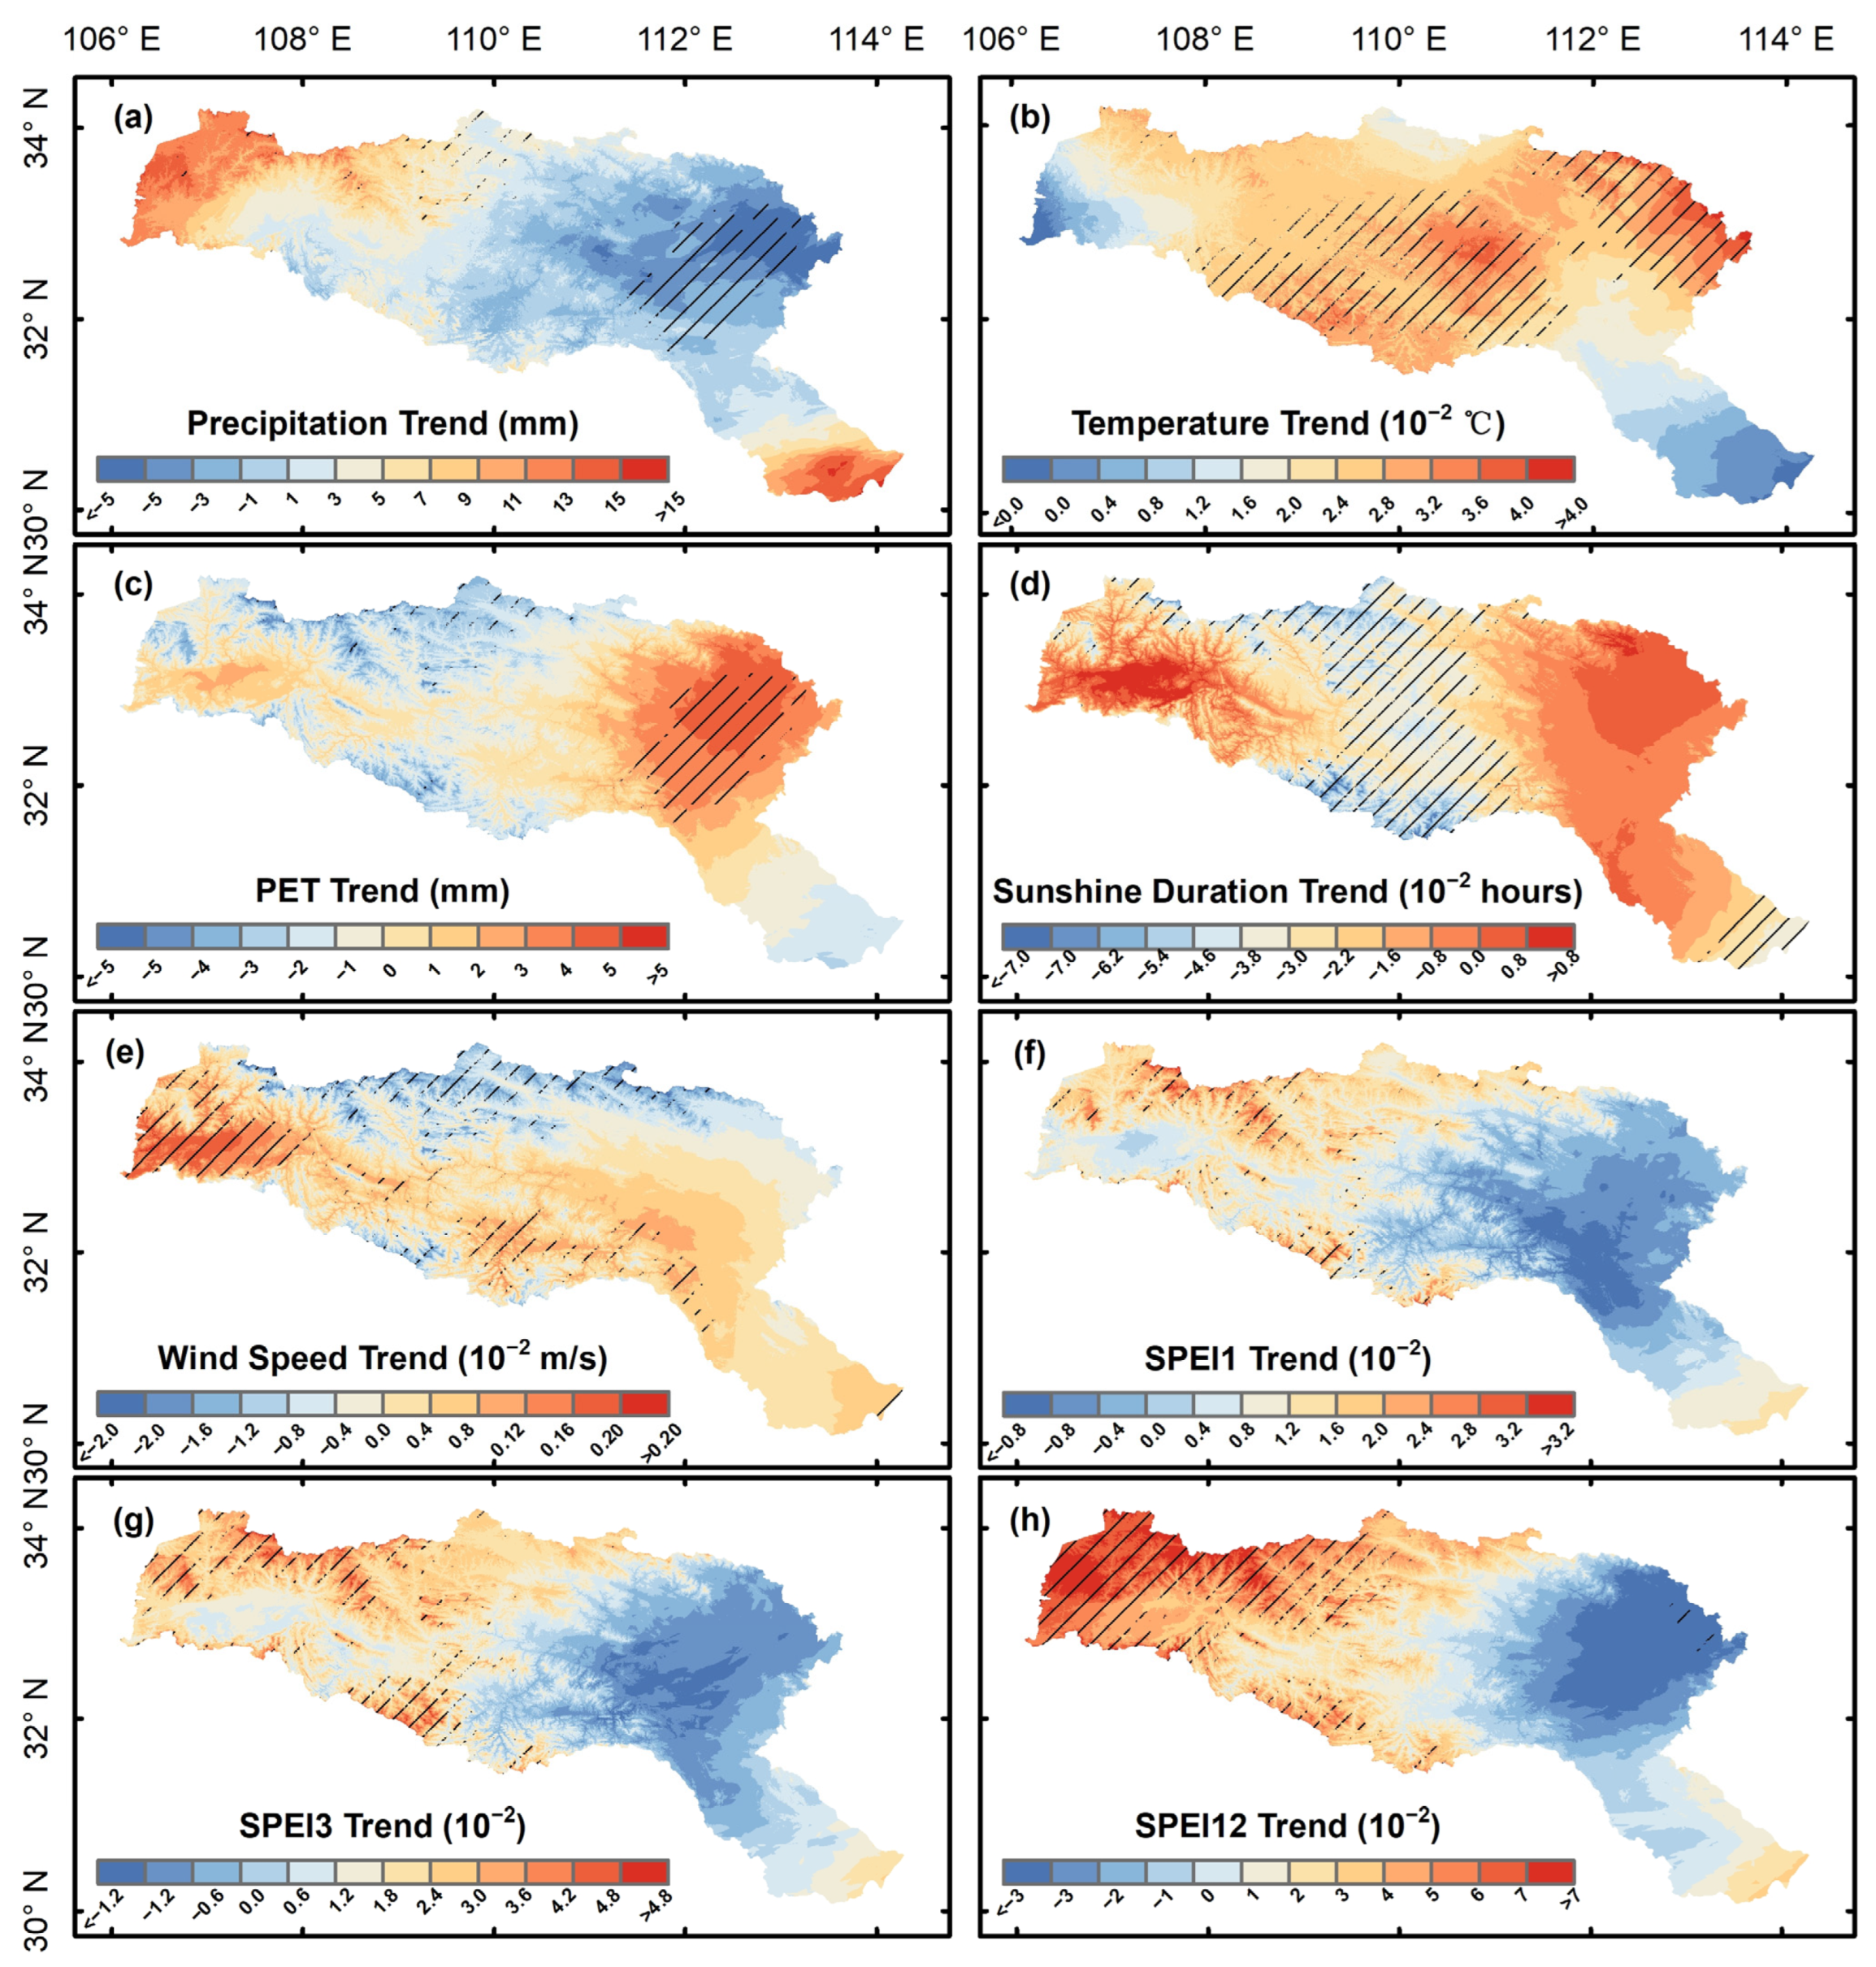
3.3. Contribution of Climate Factors to Vegetation Productivity
4. Discussion
4.1. Seasonal Pattern of Vegetation Productivity in the HJRB
4.2. Response Mechanisms of Vegetation Productivity to Climate Change in the HJRB
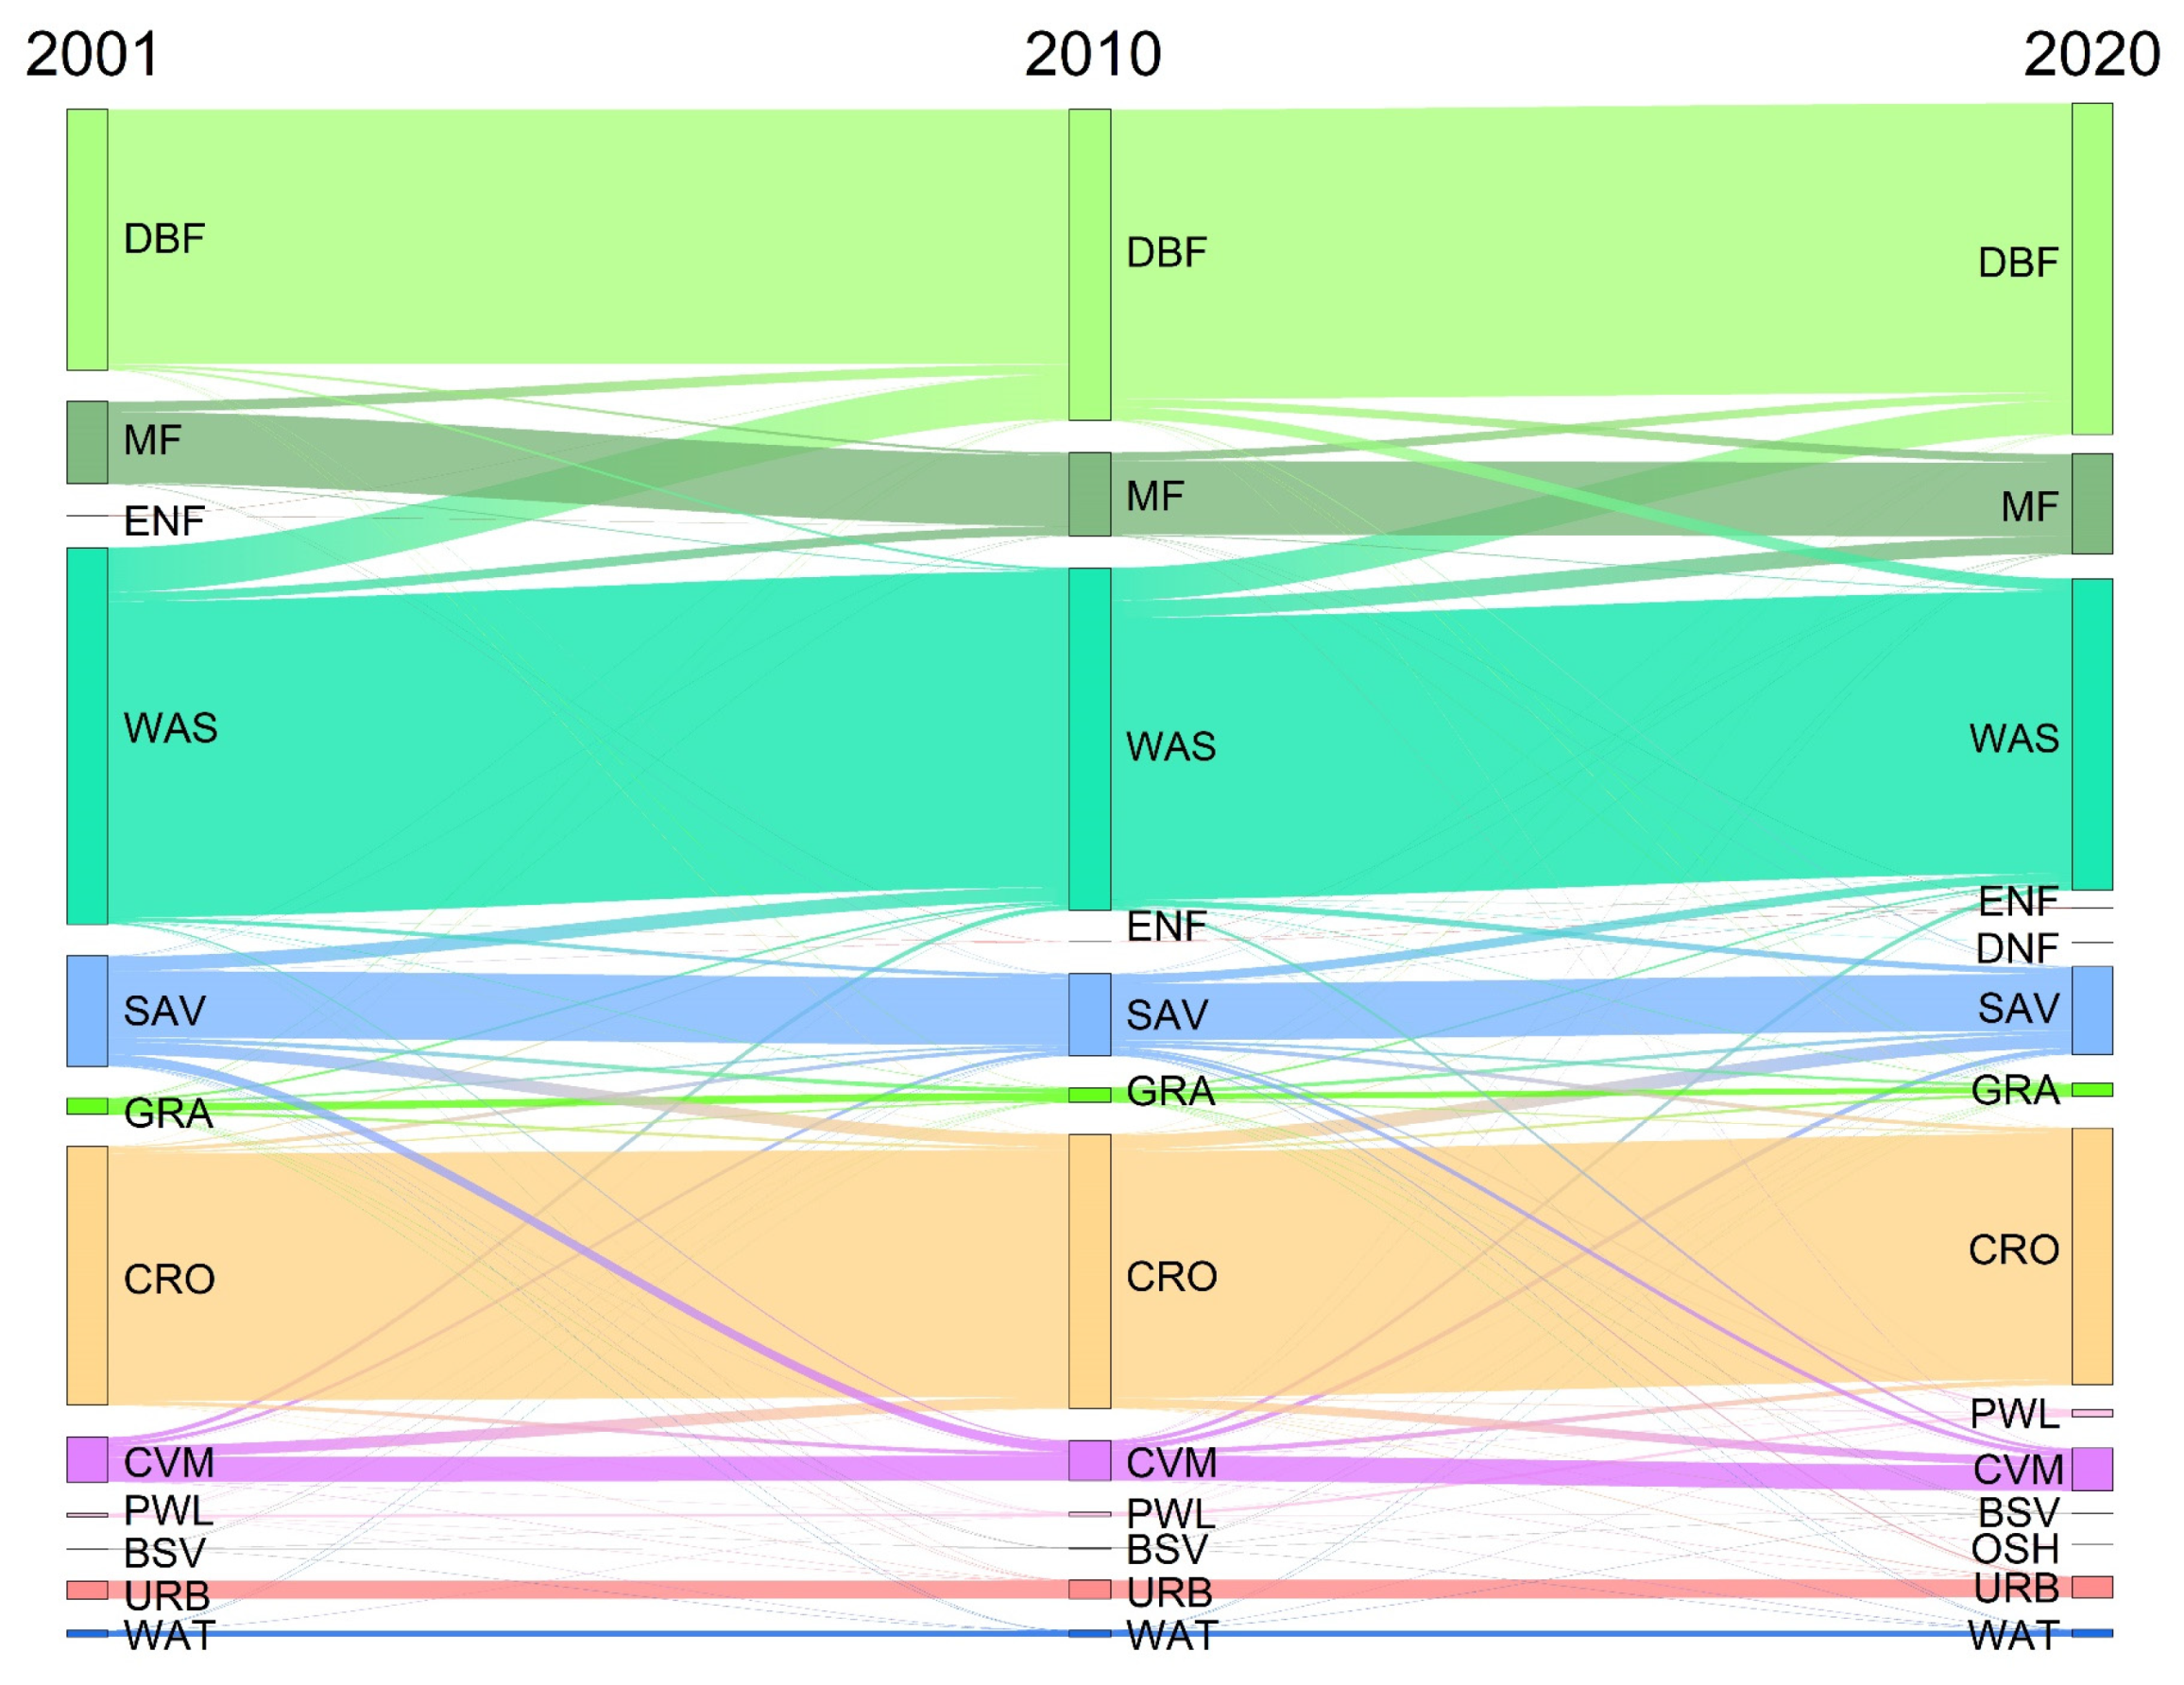
4.3. Land Use Change Patterns in the HJRB
4.4. Limitations
5. Conclusions
Author Contributions
Funding
Data Availability Statement
Conflicts of Interest
References
- Simonich, S.L.; Hites, R.A. Importance of Vegetation in Removing Polycyclic Aromatic Hydrocarbons from the Atmosphere. Nature 1994, 370, 49–51. [Google Scholar] [CrossRef]
- Zhou, P.; Luukkanen, O.; Tokola, T.; Nieminen, J. Effect of Vegetation Cover on Soil Erosion in a Mountainous Watershed. Catena 2008, 75, 319–325. [Google Scholar] [CrossRef]
- Thom, D.; Rammer, W.; Seidl, R. The Impact of Future Forest Dynamics on Climate: Interactive Effects of Changing Vegetation and Disturbance Regimes. Ecol. Monogr. 2017, 87, 665–684. [Google Scholar] [CrossRef]
- Konings, A.G.; Saatchi, S.S.; Frankenberg, C.; Keller, M.; Leshyk, V.; Anderegg, W.R.L.; Humphrey, V.; Matheny, A.M.; Trugman, A.; Sack, L.; et al. Detecting Forest Response to Droughts with Global Observations of Vegetation Water Content. Glob. Change Biol. 2021, 27, 6005–6024. [Google Scholar] [CrossRef]
- Jiao, W.; Wang, L.; Smith, W.K.; Chang, Q.; Wang, H.; D’Odorico, P. Observed Increasing Water Constraint on Vegetation Growth over the Last Three Decades. Nat. Commun. 2021, 12, 3777. [Google Scholar] [CrossRef] [PubMed]
- Ding, Y.; Li, Z.; Peng, S. Global Analysis of Time-Lag and -Accumulation Effects of Climate on Vegetation Growth. Int. J. Appl. Earth Obs. Geoinf. 2020, 92, 102179. [Google Scholar] [CrossRef]
- Wei, Y.; Lu, H.; Wang, J.; Wang, X.; Sun, J. Dual Influence of Climate Change and Anthropogenic Activities on the Spatiotemporal Vegetation Dynamics Over the Qinghai-Tibetan Plateau From 1981 to 2015. Earth’s Future 2022, 10, e2021EF002566. [Google Scholar] [CrossRef]
- Wellmann, T.; Schug, F.; Haase, D.; Pflugmacher, D.; Van Der Linden, S. Green Growth? On the Relation between Population Density, Land Use and Vegetation Cover Fractions in a City Using a 30-Years Landsat Time Series. Landsc. Urban Plan. 2020, 202, 103857. [Google Scholar] [CrossRef]
- Diener, A.; Mudu, P. How Can Vegetation Protect Us from Air Pollution? A Critical Review on Green Spaces’ Mitigation Abilities for Air-Borne Particles from a Public Health Perspective—with Implications for Urban Planning. Sci. Total Environ. 2021, 796, 148605. [Google Scholar] [CrossRef]
- Verrall, B.; Pickering, C.M. Alpine Vegetation in the Context of Climate Change: A Global Review of Past Research and Future Directions. Sci. Total Environ. 2020, 748, 141344. [Google Scholar] [CrossRef]
- Zhongming, Z.; Linong, L.; Xiaona, Y.; Wangqiang, Z.; Wei, L. AR6 Synthesis Report: Climate Change 2022; The Intergovernmental Panel on Climate Change (IPCC): Geneva, Switzerland, 2022. [Google Scholar]
- Collins, M.; An, S.-I.; Cai, W.; Ganachaud, A.; Guilyardi, E.; Jin, F.-F.; Jochum, M.; Lengaigne, M.; Power, S.; Timmermann, A.; et al. The Impact of Global Warming on the Tropical Pacific Ocean and El Niño. Nat. Geosci. 2010, 3, 391–397. [Google Scholar] [CrossRef]
- Geng, T.; Jia, F.; Cai, W.; Wu, L.; Gan, B.; Jing, Z.; Li, S.; McPhaden, M.J. Increased Occurrences of Consecutive La Niña Events under Global Warming. Nature 2023, 619, 774–781. [Google Scholar] [CrossRef] [PubMed]
- Bannari, A.; Morin, D.; Bonn, F.; Huete, A.R. A Review of Vegetation Indices. Remote Sens. Rev. 1995, 13, 95–120. [Google Scholar] [CrossRef]
- Anav, A.; Friedlingstein, P.; Beer, C.; Ciais, P.; Harper, A.; Jones, C.; Murray-Tortarolo, G.; Papale, D.; Parazoo, N.C.; Peylin, P.; et al. Spatiotemporal Patterns of Terrestrial Gross Primary Production: A Review: GPP Spatiotemporal Patterns. Rev. Geophys. 2015, 53, 785–818. [Google Scholar] [CrossRef]
- Roy, J.; Mooney, H.A.; Saugier, B. Terrestrial Global Productivity; Elsevier: Amsterdam, The Netherlands, 2001; ISBN 0-08-051872-9. [Google Scholar]
- Bai, Y.; Li, S.; Liu, M.; Guo, Q. Assessment of Vegetation Change on the Mongolian Plateau over Three Decades Using Different Remote Sensing Products. J. Environ. Manag. 2022, 317, 115509. [Google Scholar] [CrossRef] [PubMed]
- Feng, X.; Fu, B.; Zhang, Y.; Pan, N.; Zeng, Z.; Tian, H.; Lyu, Y.; Chen, Y.; Ciais, P.; Wang, Y.; et al. Recent Leveling off of Vegetation Greenness and Primary Production Reveals the Increasing Soil Water Limitations on the Greening Earth. Sci. Bull. 2021, 66, 1462–1471. [Google Scholar] [CrossRef]
- Zhang, Z.; Ju, W.; Zhou, Y.; Li, X. Revisiting the Cumulative Effects of Drought on Global Gross Primary Productivity Based on New Long-term Series Data (1982–2018). Glob. Change Biol. 2022, 28, 3620–3635. [Google Scholar] [CrossRef]
- Zhang, Y.; Ding, J.; Wang, Y.; Zhang, Y.; Liu, Y.; Zhang, L.; Ariken, M.; Wulan, T.; Huang, W.; Li, Y.; et al. Reconstruction of Human-Induced Forest Loss in China during 1900–2000. Remote Sens. 2023, 15, 3831. [Google Scholar] [CrossRef]
- Sand-Jensen, K.; Pedersen, N.L.; Thorsgaard, I.; Moeslund, B.; Borum, J.; Brodersen, K.P. 100 Years of Vegetation Decline and Recovery in Lake Fure, Denmark. J. Ecol. 2008, 96, 260–271. [Google Scholar] [CrossRef]
- Motzkin, G.; Foster, D.; Allen, A.; Harrod, J.; Boone, R. Controlling Site to Evaluate History: Vegetation Patterns of a New England Sand Plain. Ecol. Monogr. 1996, 66, 345–365. [Google Scholar] [CrossRef]
- Chen, Y.; Feng, X.; Tian, H.; Wu, X.; Gao, Z.; Feng, Y.; Piao, S.; Lv, N.; Pan, N.; Fu, B. Accelerated Increase in Vegetation Carbon Sequestration in China after 2010: A Turning Point Resulting from Climate and Human Interaction. Glob Change Biol 2021, 27, 5848–5864. [Google Scholar] [CrossRef]
- Li, S.; Liang, W.; Fu, B.; Lü, Y.; Fu, S.; Wang, S.; Su, H. Vegetation Changes in Recent Large-Scale Ecological Restoration Projects and Subsequent Impact on Water Resources in China’s Loess Plateau. Sci. Total Environ. 2016, 569–570, 1032–1039. [Google Scholar] [CrossRef]
- González, E.; Sher, A.A.; Tabacchi, E.; Masip, A.; Poulin, M. Restoration of Riparian Vegetation: A Global Review of Implementation and Evaluation Approaches in the International, Peer-Reviewed Literature. J. Environ. Manag. 2015, 158, 85–94. [Google Scholar] [CrossRef]
- Chen, C.; Park, T.; Wang, X.; Piao, S.; Xu, B.; Chaturvedi, R.K.; Fuchs, R.; Brovkin, V.; Ciais, P.; Fensholt, R.; et al. China and India Lead in Greening of the World through Land-Use Management. Nat. Sustain. 2019, 2, 122–129. [Google Scholar] [CrossRef]
- Song, W.; Feng, Y.; Wang, Z. Ecological Restoration Programs Dominate Vegetation Greening in China. Sci. Total Environ. 2022, 848, 157729. [Google Scholar] [CrossRef]
- Piao, S.; Wang, X.; Park, T.; Chen, C.; Lian, X.; He, Y.; Bjerke, J.W.; Chen, A.; Ciais, P.; Tømmervik, H.; et al. Characteristics, Drivers and Feedbacks of Global Greening. Nat. Rev. Earth Environ. 2019, 1, 14–27. [Google Scholar] [CrossRef]
- Gao, W.; Zheng, C.; Liu, X.; Lu, Y.; Chen, Y.; Wei, Y.; Ma, Y. NDVI-Based Vegetation Dynamics and Their Responses to Climate Change and Human Activities from 1982 to 2020: A Case Study in the Mu Us Sandy Land, China. Ecol. Indic. 2022, 137, 108745. [Google Scholar] [CrossRef]
- Gu, Z.; Duan, X.; Shi, Y.; Li, Y.; Pan, X. Spatiotemporal Variation in Vegetation Coverage and Its Response to Climatic Factors in the Red River Basin, China. Ecol. Indic. 2018, 93, 54–64. [Google Scholar] [CrossRef]
- Yang, L.; Guan, Q.; Lin, J.; Tian, J.; Tan, Z.; Li, H. Evolution of NDVI Secular Trends and Responses to Climate Change: A Perspective from Nonlinearity and Nonstationarity Characteristics. Remote Sens. Environ. 2021, 254, 112247. [Google Scholar] [CrossRef]
- Piao, S.; Liu, Q.; Chen, A.; Janssens, I.A.; Fu, Y.; Dai, J.; Liu, L.; Lian, X.; Shen, M.; Zhu, X. Plant Phenology and Global Climate Change: Current Progresses and Challenges. Glob. Change Biol. 2019, 25, 1922–1940. [Google Scholar] [CrossRef]
- Li, P.; Wang, J.; Liu, M.; Xue, Z.; Bagherzadeh, A.; Liu, M. Spatio-Temporal Variation Characteristics of NDVI and Its Response to Climate on the Loess Plateau from 1985 to 2015. Catena 2021, 203, 105331. [Google Scholar] [CrossRef]
- Li, Y.; Zheng, Z.; Qin, Y.; Rong, P. Relative Contributions of Natural and Man-Made Factors to Vegetation Cover Change of Environmentally Sensitive and Vulnerable Areas of China. J. Clean. Prod. 2021, 321, 128917. [Google Scholar] [CrossRef]
- Fahad, S.; Hasanuzzaman, M.; Alam, M.; Ullah, H.; Saeed, M.; Khan, I.A.; Adnan, M. Environment, Climate, Plant and Vegetation Growth; Springer: Berlin/Heidelberg, Germany, 2020; ISBN 3-030-49732-1. [Google Scholar]
- Liu, K.; Li, X.; Wang, S.; Zhang, X. Unrevealing Past and Future Vegetation Restoration on the Loess Plateau and Its Impact on Terrestrial Water Storage. J. Hydrol. 2023, 617, 129021. [Google Scholar] [CrossRef]
- Hoek van Dijke, A.J.; Herold, M.; Mallick, K.; Benedict, I.; Machwitz, M.; Schlerf, M.; Pranindita, A.; Theeuwen, J.J.E.; Bastin, J.-F.; Teuling, A.J. Shifts in Regional Water Availability Due to Global Tree Restoration. Nat. Geosci. 2022, 15, 363–368. [Google Scholar] [CrossRef]
- Zhang, J.; Zhang, Y.; Sun, G.; Song, C.; Dannenberg, M.P.; Li, J.; Liu, N.; Zhang, K.; Zhang, Q.; Hao, L. Vegetation Greening Weakened the Capacity of Water Supply to China’s South-to-North Water Diversion Project. Hydrol. Earth Syst. Sci. 2021, 25, 5623–5640. [Google Scholar] [CrossRef]
- Yang, S.; Liu, J.; Wang, C.; Zhang, T.; Dong, X.; Liu, Y. Vegetation Dynamics Influenced by Climate Change and Human Activities in the Hanjiang River Basin, Central China. Ecol. Indic. 2022, 145, 109586. [Google Scholar] [CrossRef]
- Liu, H.; Zheng, L.; Yin, S. Multi-Perspective Analysis of Vegetation Cover Changes and Driving Factors of Long Time Series Based on Climate and Terrain Data in Hanjiang River Basin, China. Arab. J. Geosci. 2018, 11, 509. [Google Scholar] [CrossRef]
- Chen, T.; Xia, J.; Zou, L.; Hong, S. Quantifying the Influences of Natural Factors and Human Activities on NDVI Changes in the Hanjiang River Basin, China. Remote Sens. 2020, 12, 3780. [Google Scholar] [CrossRef]
- Ebrahimi Khusfi, Z.; Khosroshahi, M.; Roustaei, F.; Mirakbari, M. Spatial and Seasonal Variations of Sand-Dust Events and Their Relation to Atmospheric Conditions and Vegetation Cover in Semi-Arid Regions of Central Iran. Geoderma 2020, 365, 114225. [Google Scholar] [CrossRef]
- Li, C.; Jia, X.; Zhu, R.; Mei, X.; Wang, D.; Zhang, X. Seasonal Spatiotemporal Changes in the NDVI and Its Driving Forces in Wuliangsu Lake Basin, Northern China from 1990 to 2020. Remote Sens. 2023, 15, 2965. [Google Scholar] [CrossRef]
- Wang, F.; Ma, Y.; Darvishzadeh, R.; Han, C. Annual and Seasonal Trends of Vegetation Responses and Feedback to Temperature on the Tibetan Plateau since the 1980s. Remote Sens. 2023, 15, 2475. [Google Scholar] [CrossRef]
- Wang, S.; Zhang, Y.; Ju, W.; Porcar-Castell, A.; Ye, S.; Zhang, Z.; Brümmer, C.; Urbaniak, M.; Mammarella, I.; Juszczak, R.; et al. Warmer Spring Alleviated the Impacts of 2018 European Summer Heatwave and Drought on Vegetation Photosynthesis. Agric. For. Meteorol. 2020, 295, 108195. [Google Scholar] [CrossRef]
- Ma, M.; Wang, Q.; Liu, R.; Zhao, Y.; Zhang, D. Effects of Climate Change and Human Activities on Vegetation Coverage Change in Northern China Considering Extreme Climate and Time-Lag and -Accumulation Effects. Sci. Total Environ. 2023, 860, 160527. [Google Scholar] [CrossRef] [PubMed]
- Wu, D.; Zhao, X.; Liang, S.; Zhou, T.; Huang, K.; Tang, B.; Zhao, W. Time-Lag Effects of Global Vegetation Responses to Climate Change. Glob. Change Biol. 2015, 21, 3520–3531. [Google Scholar] [CrossRef] [PubMed]
- Allen, R. An Update for the Calculation of Reference Evapotranspiration. IcID Bull. 1994, 43, 35–92. [Google Scholar]
- Vicente-Serrano, S.M.; Beguería, S.; López-Moreno, J.I. A Multiscalar Drought Index Sensitive to Global Warming: The Standardized Precipitation Evapotranspiration Index. J. Clim. 2010, 23, 1696–1718. [Google Scholar] [CrossRef]
- Hutchinson, M.F.; Xu, T. Anusplin Version 4.2 User Guide; Centre for Resource and Environmental Studies, The Australian National University: Canberra, Australia, 2004; p. 54. [Google Scholar]
- Sen, P.K. Estimates of the Regression Coefficient Based on Kendall’s Tau. J. Am. Stat. Assoc. 1968, 63, 1379–1389. [Google Scholar] [CrossRef]
- Fernandes, R.; Leblanc, S.G. Parametric (Modified Least Squares) and Non-Parametric (Theil–Sen) Linear Regressions for Predicting Biophysical Parameters in the Presence of Measurement Errors. Remote Sens. Environ. 2005, 95, 303–316. [Google Scholar] [CrossRef]
- Chen, J.; Shao, Z.; Huang, X.; Zhuang, Q.; Dang, C.; Cai, B.; Zheng, X.; Ding, Q. Assessing the Impact of Drought-Land Cover Change on Global Vegetation Greenness and Productivity. Sci. Total Environ. 2022, 852, 158499. [Google Scholar] [CrossRef]
- Kendall, M. Rank Correlation Methods; Griffin: London, UK, 1975; Available online: https://scholar.google.com/scholar_lookup?title=Rank+Correlation+Methods&author=Kendall,+M.&publication_year=1975 (accessed on 12 October 2022).
- Xu, J. Mathematical Methods in Contemporary Geography; China Higher Education Press: Beijing, China, 2002; p. 224230. [Google Scholar]
- Lundberg, S.; Lee, S.-I. A Unified Approach to Interpreting Model Predictions. Adv. Neural Inf. Process. Syst. 2017, 30, 4768–4777. [Google Scholar] [CrossRef]
- Wang, D.; Thunéll, S.; Lindberg, U.; Jiang, L.; Trygg, J.; Tysklind, M. Towards Better Process Management in Wastewater Treatment Plants: Process Analytics Based on SHAP Values for Tree-Based Machine Learning Methods. J. Environ. Manag. 2022, 301, 113941. [Google Scholar] [CrossRef] [PubMed]
- Guo, X.; Gui, X.; Xiong, H.; Hu, X.; Li, Y.; Cui, H.; Qiu, Y.; Ma, C. Critical Role of Climate Factors for Groundwater Potential Mapping in Arid Regions: Insights from Random Forest, XGBoost, and LightGBM Algorithms. J. Hydrol. 2023, 621, 129599. [Google Scholar] [CrossRef]
- Jiang, W.; Wang, L.; Zhang, M.; Yao, R.; Chen, X.; Gui, X.; Sun, J.; Cao, Q. Analysis of Drought Events and Their Impacts on Vegetation Productivity Based on the Integrated Surface Drought Index in the Hanjiang River Basin, China. Atmos. Res. 2021, 254, 105536. [Google Scholar] [CrossRef]
- Zhang, T.; Xu, X.; Jiang, H.; Qiao, S.; Guan, M.; Huang, Y.; Gong, R. Widespread Decline in Winds Promoted the Growth of Vegetation. Sci. Total Environ. 2022, 825, 153682. [Google Scholar] [CrossRef]
- Park, H.; Jeong, S.; Peñuelas, J. Accelerated Rate of Vegetation Green-up Related to Warming at Northern High Latitudes. Glob. Change Biol. 2020, 26, 6190–6202. [Google Scholar] [CrossRef]
- Islam, A.R.M.T.; Islam, H.M.T.; Shahid, S.; Khatun, M.K.; Ali, M.M.; Rahman, M.S.; Ibrahim, S.M.; Almoajel, A.M. Spatiotemporal Nexus between Vegetation Change and Extreme Climatic Indices and Their Possible Causes of Change. J. Environ. Manag. 2021, 289, 112505. [Google Scholar] [CrossRef]
- Gan, G.; Liu, Y.; Sun, G. Understanding Interactions among Climate, Water, and Vegetation with the Budyko Framework. Earth-Sci. Rev. 2021, 212, 103451. [Google Scholar] [CrossRef]
- Xu, X.; Zhang, D.; Zhang, Y.; Yao, S.; Zhang, J. Evaluating the Vegetation Restoration Potential Achievement of Ecological Projects: A Case Study of Yan’an, China. Land Use Policy 2020, 90, 104293. [Google Scholar] [CrossRef]
- Zhao, A.; Yu, Q.; Feng, L.; Zhang, A.; Pei, T. Evaluating the Cumulative and Time-Lag Effects of Drought on Grassland Vegetation: A Case Study in the Chinese Loess Plateau. J. Environ. Manag. 2020, 261, 110214. [Google Scholar] [CrossRef]
- Zhou, L.; Zhang, X.; Zhang, Y.; Song, Q.; Myo, S.T.Z.; Zhou, R.; Lin, Y.; Liu, Y.; Bai, K.; Gnanamoorthy, P.; et al. The Cumulative Drought Exert Disruptive Effects on Tropical Rainforests in the Northern Edge of Asia—Based on Decadal Dendrometric Measurements and Eddy Covariance Method. Agric. For. Meteorol. 2022, 316, 108858. [Google Scholar] [CrossRef]


| Name | ID | Name | ID |
|---|---|---|---|
| Deciduous Needleleaf Forests | DNF | Grasslands | GRA |
| Deciduous Broadleaf Forests | DBF | Permanent Wetlands | PWL |
| Evergreen Broadleaf Forests | ENF | Croplands | CRO |
| Mixed Forests | MF | Urban and Built-up Lands | URB |
| Open Shrublands | OSH | Cropland/Natural Vegetation Mosaics | CVM |
| Woody savannas | WSA | Barren Sparse Vegetation | BSV |
| Savannas | SAV | Water Bodies | WAT |
Disclaimer/Publisher’s Note: The statements, opinions and data contained in all publications are solely those of the individual author(s) and contributor(s) and not of MDPI and/or the editor(s). MDPI and/or the editor(s) disclaim responsibility for any injury to people or property resulting from any ideas, methods, instructions or products referred to in the content. |
© 2023 by the authors. Licensee MDPI, Basel, Switzerland. This article is an open access article distributed under the terms and conditions of the Creative Commons Attribution (CC BY) license (https://creativecommons.org/licenses/by/4.0/).
Share and Cite
Bao, Y.; Zheng, L.; Zhu, K.; Liu, H. Climate Warming Dominates Vegetation Productivity in the Hanjiang River Basin, China. Land 2023, 12, 1891. https://doi.org/10.3390/land12101891
Bao Y, Zheng L, Zhu K, Liu H. Climate Warming Dominates Vegetation Productivity in the Hanjiang River Basin, China. Land. 2023; 12(10):1891. https://doi.org/10.3390/land12101891
Chicago/Turabian StyleBao, Yuhui, Liang Zheng, Kai Zhu, and Hai Liu. 2023. "Climate Warming Dominates Vegetation Productivity in the Hanjiang River Basin, China" Land 12, no. 10: 1891. https://doi.org/10.3390/land12101891
APA StyleBao, Y., Zheng, L., Zhu, K., & Liu, H. (2023). Climate Warming Dominates Vegetation Productivity in the Hanjiang River Basin, China. Land, 12(10), 1891. https://doi.org/10.3390/land12101891