
Quantification of Amu River Riverbank Erosion in Balkh Province of Afghanistan during 2004–2020

 ,
,  , , , ,
  and
and
Abstract
:1. Introduction
2. Materials and Methods
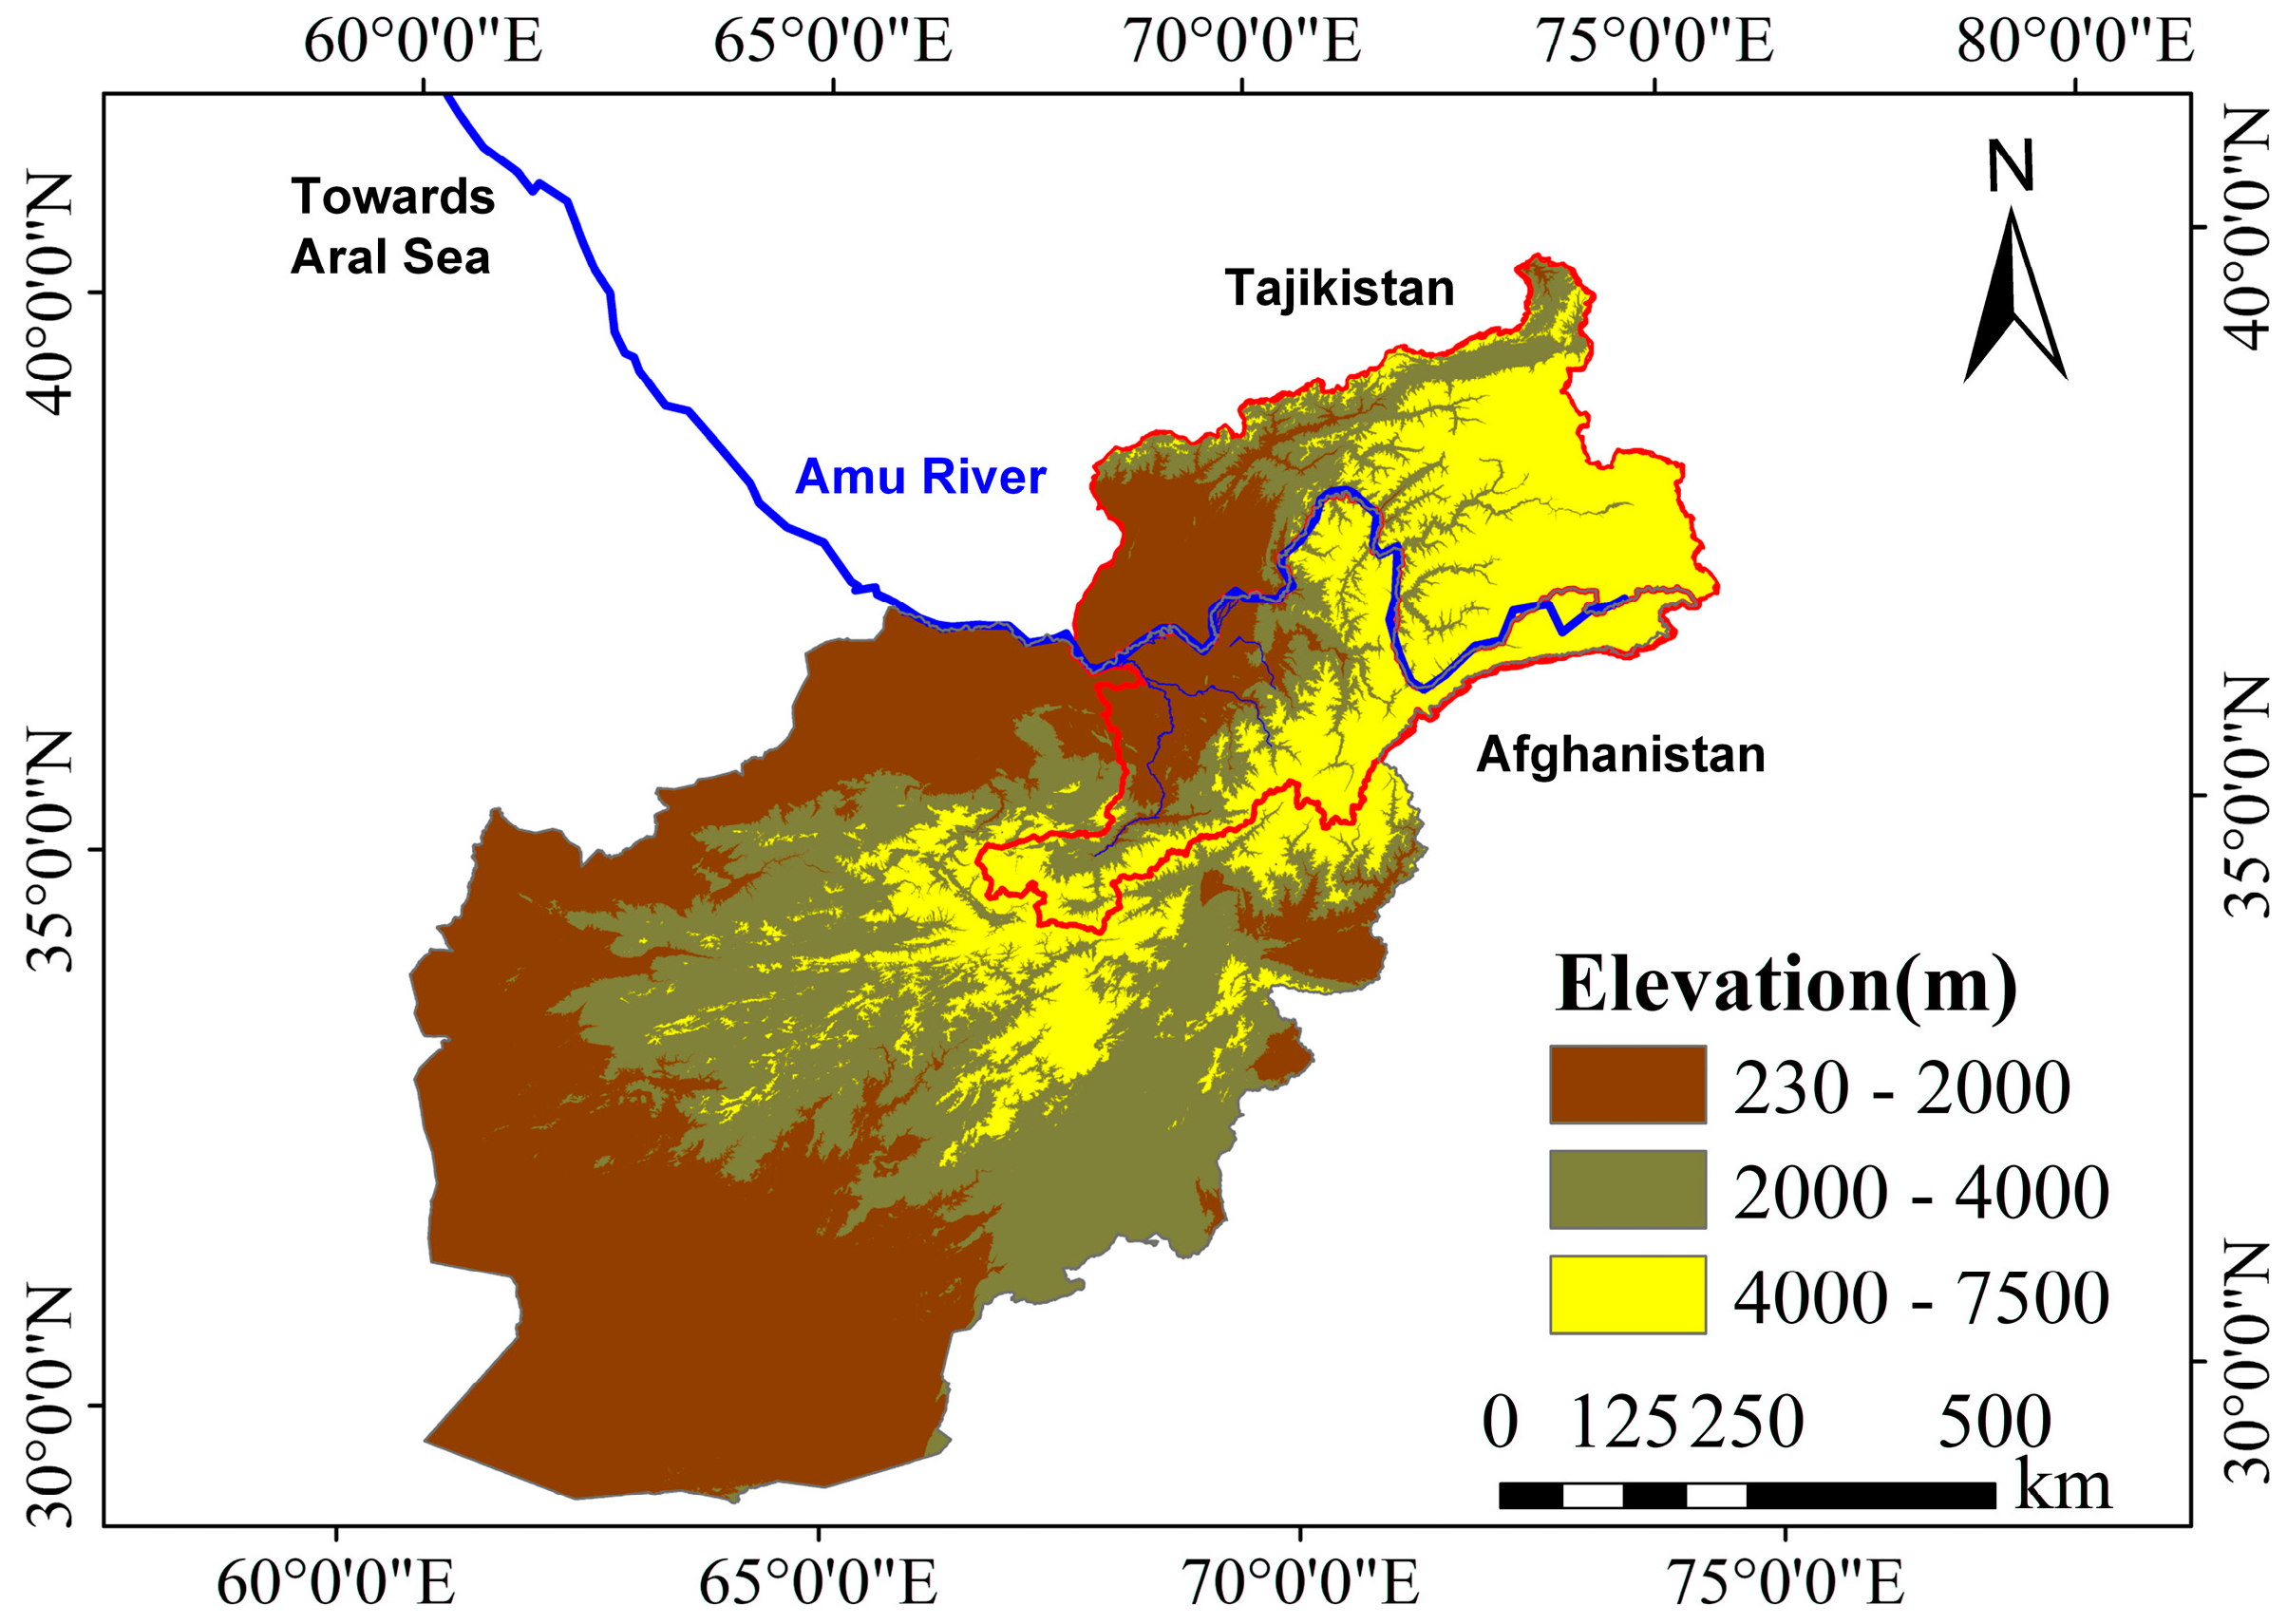
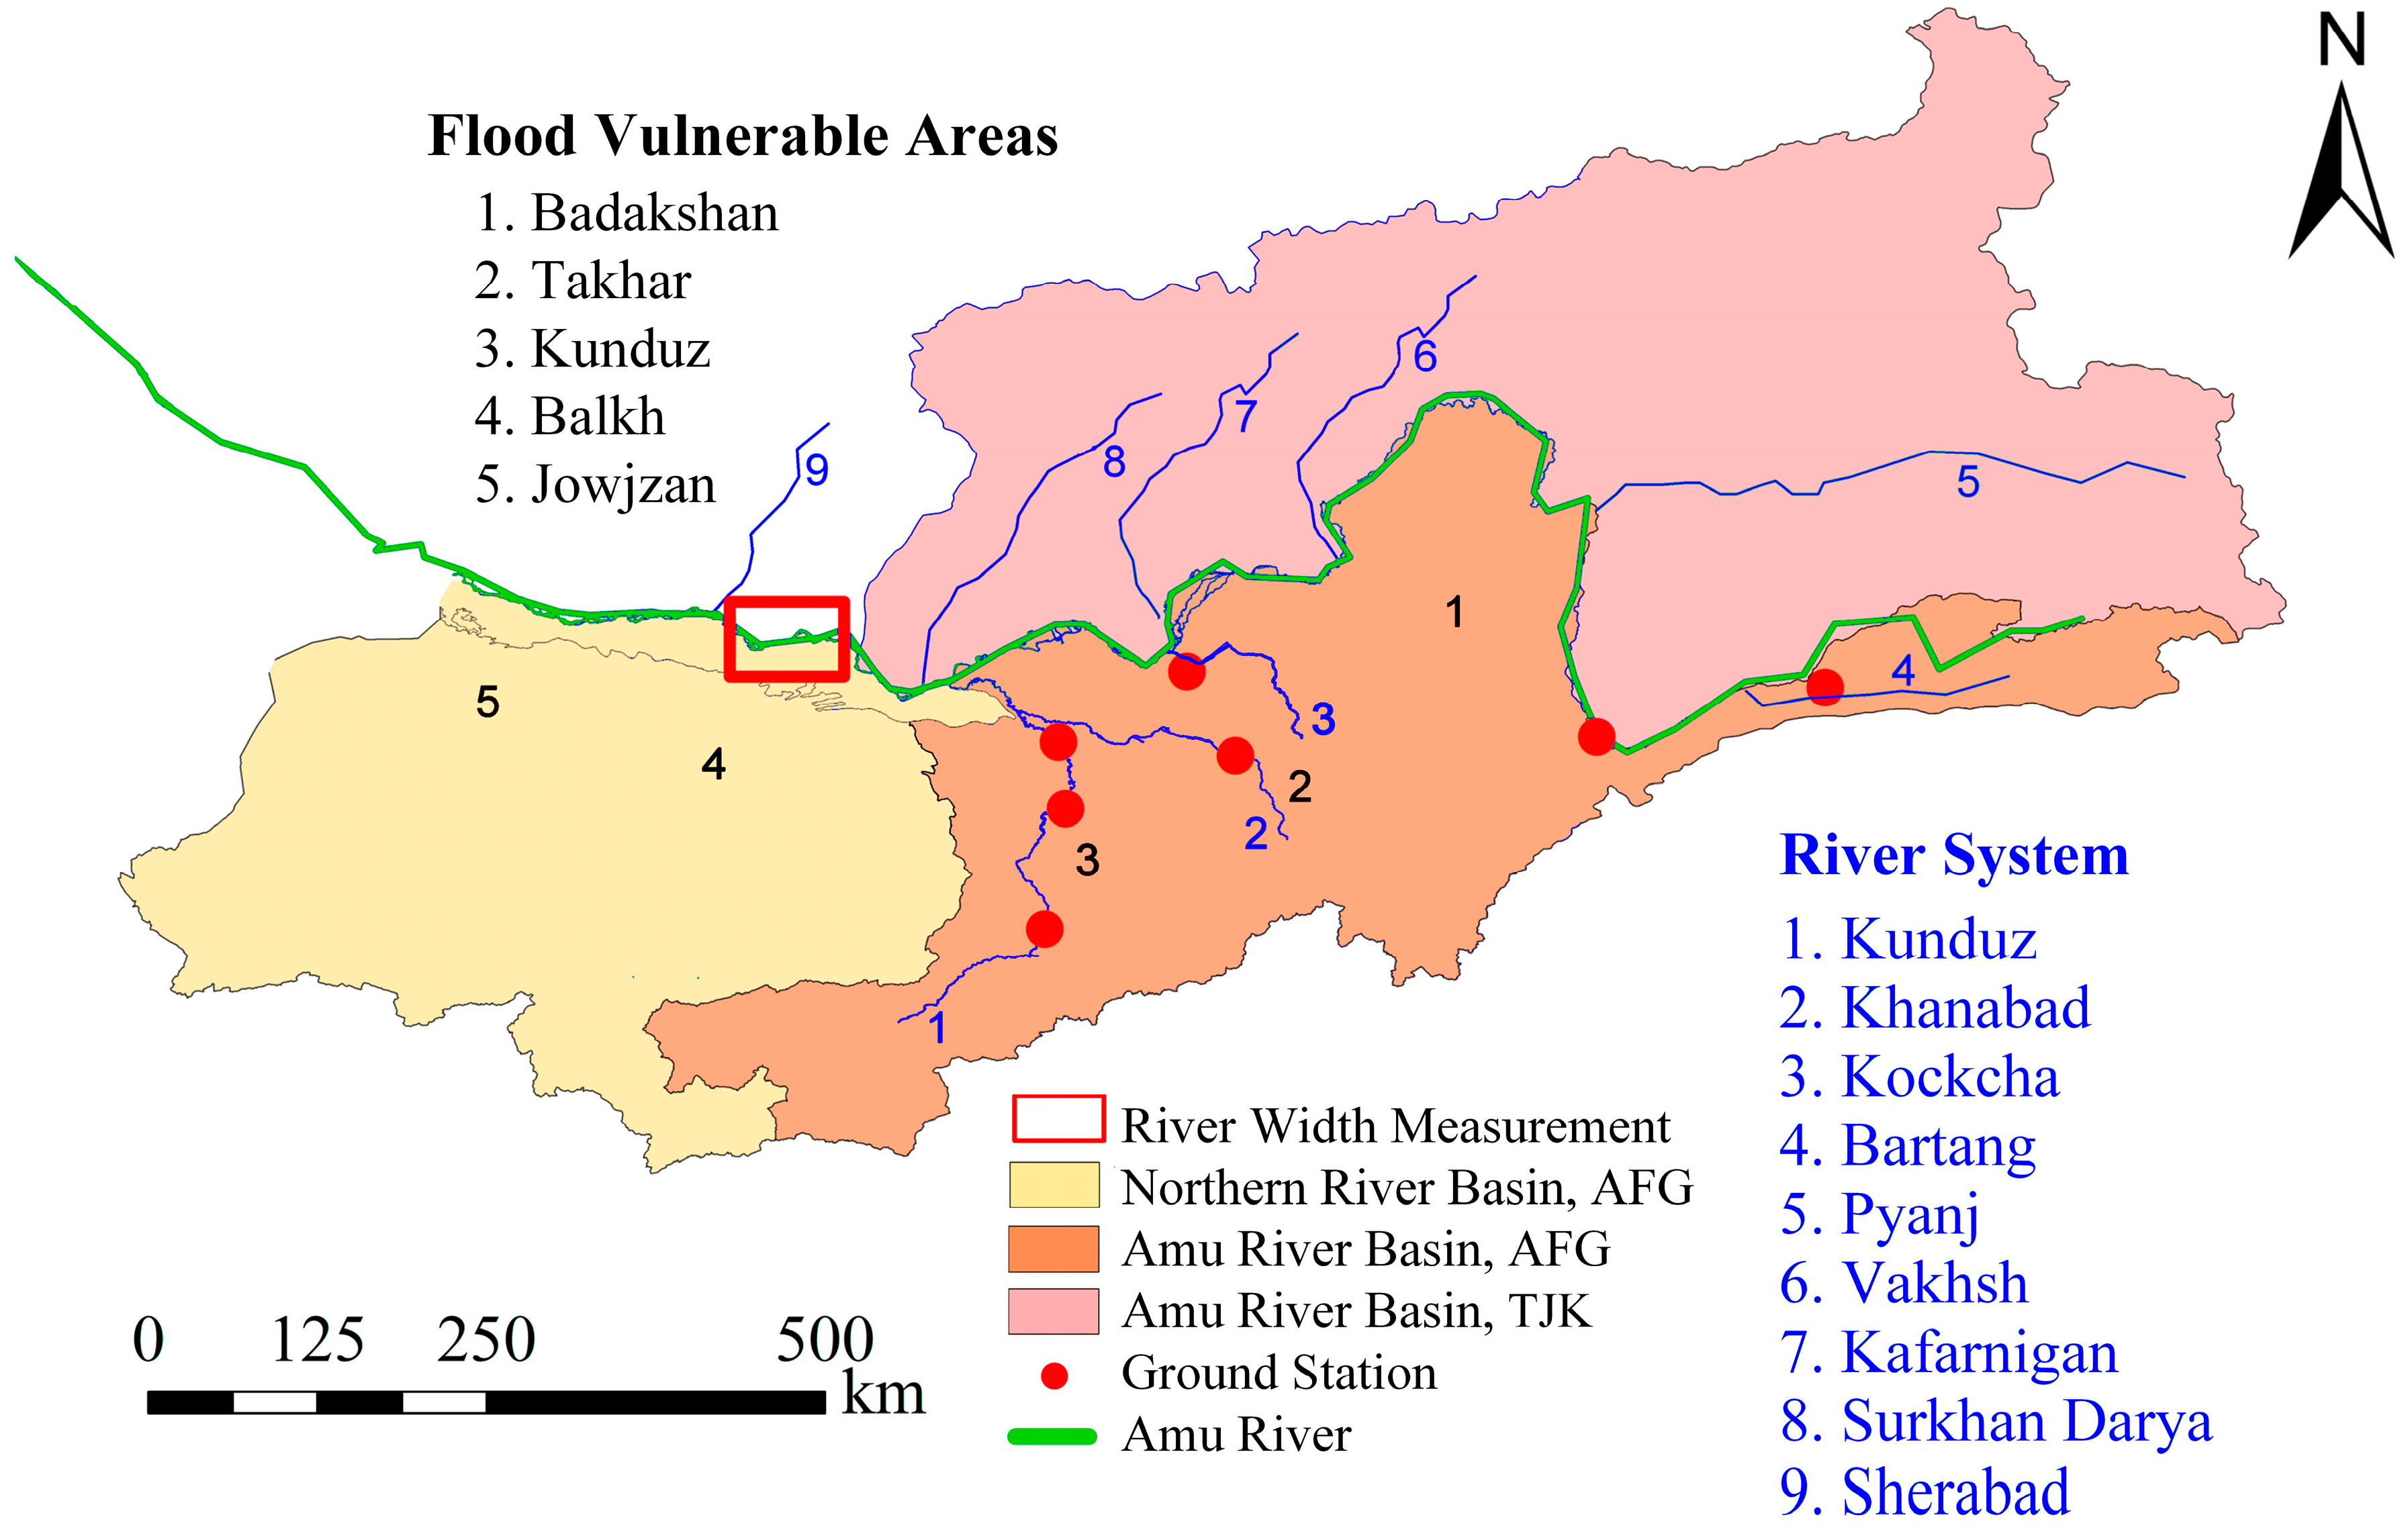
2.1. Study Area
2.2. Test Datasets
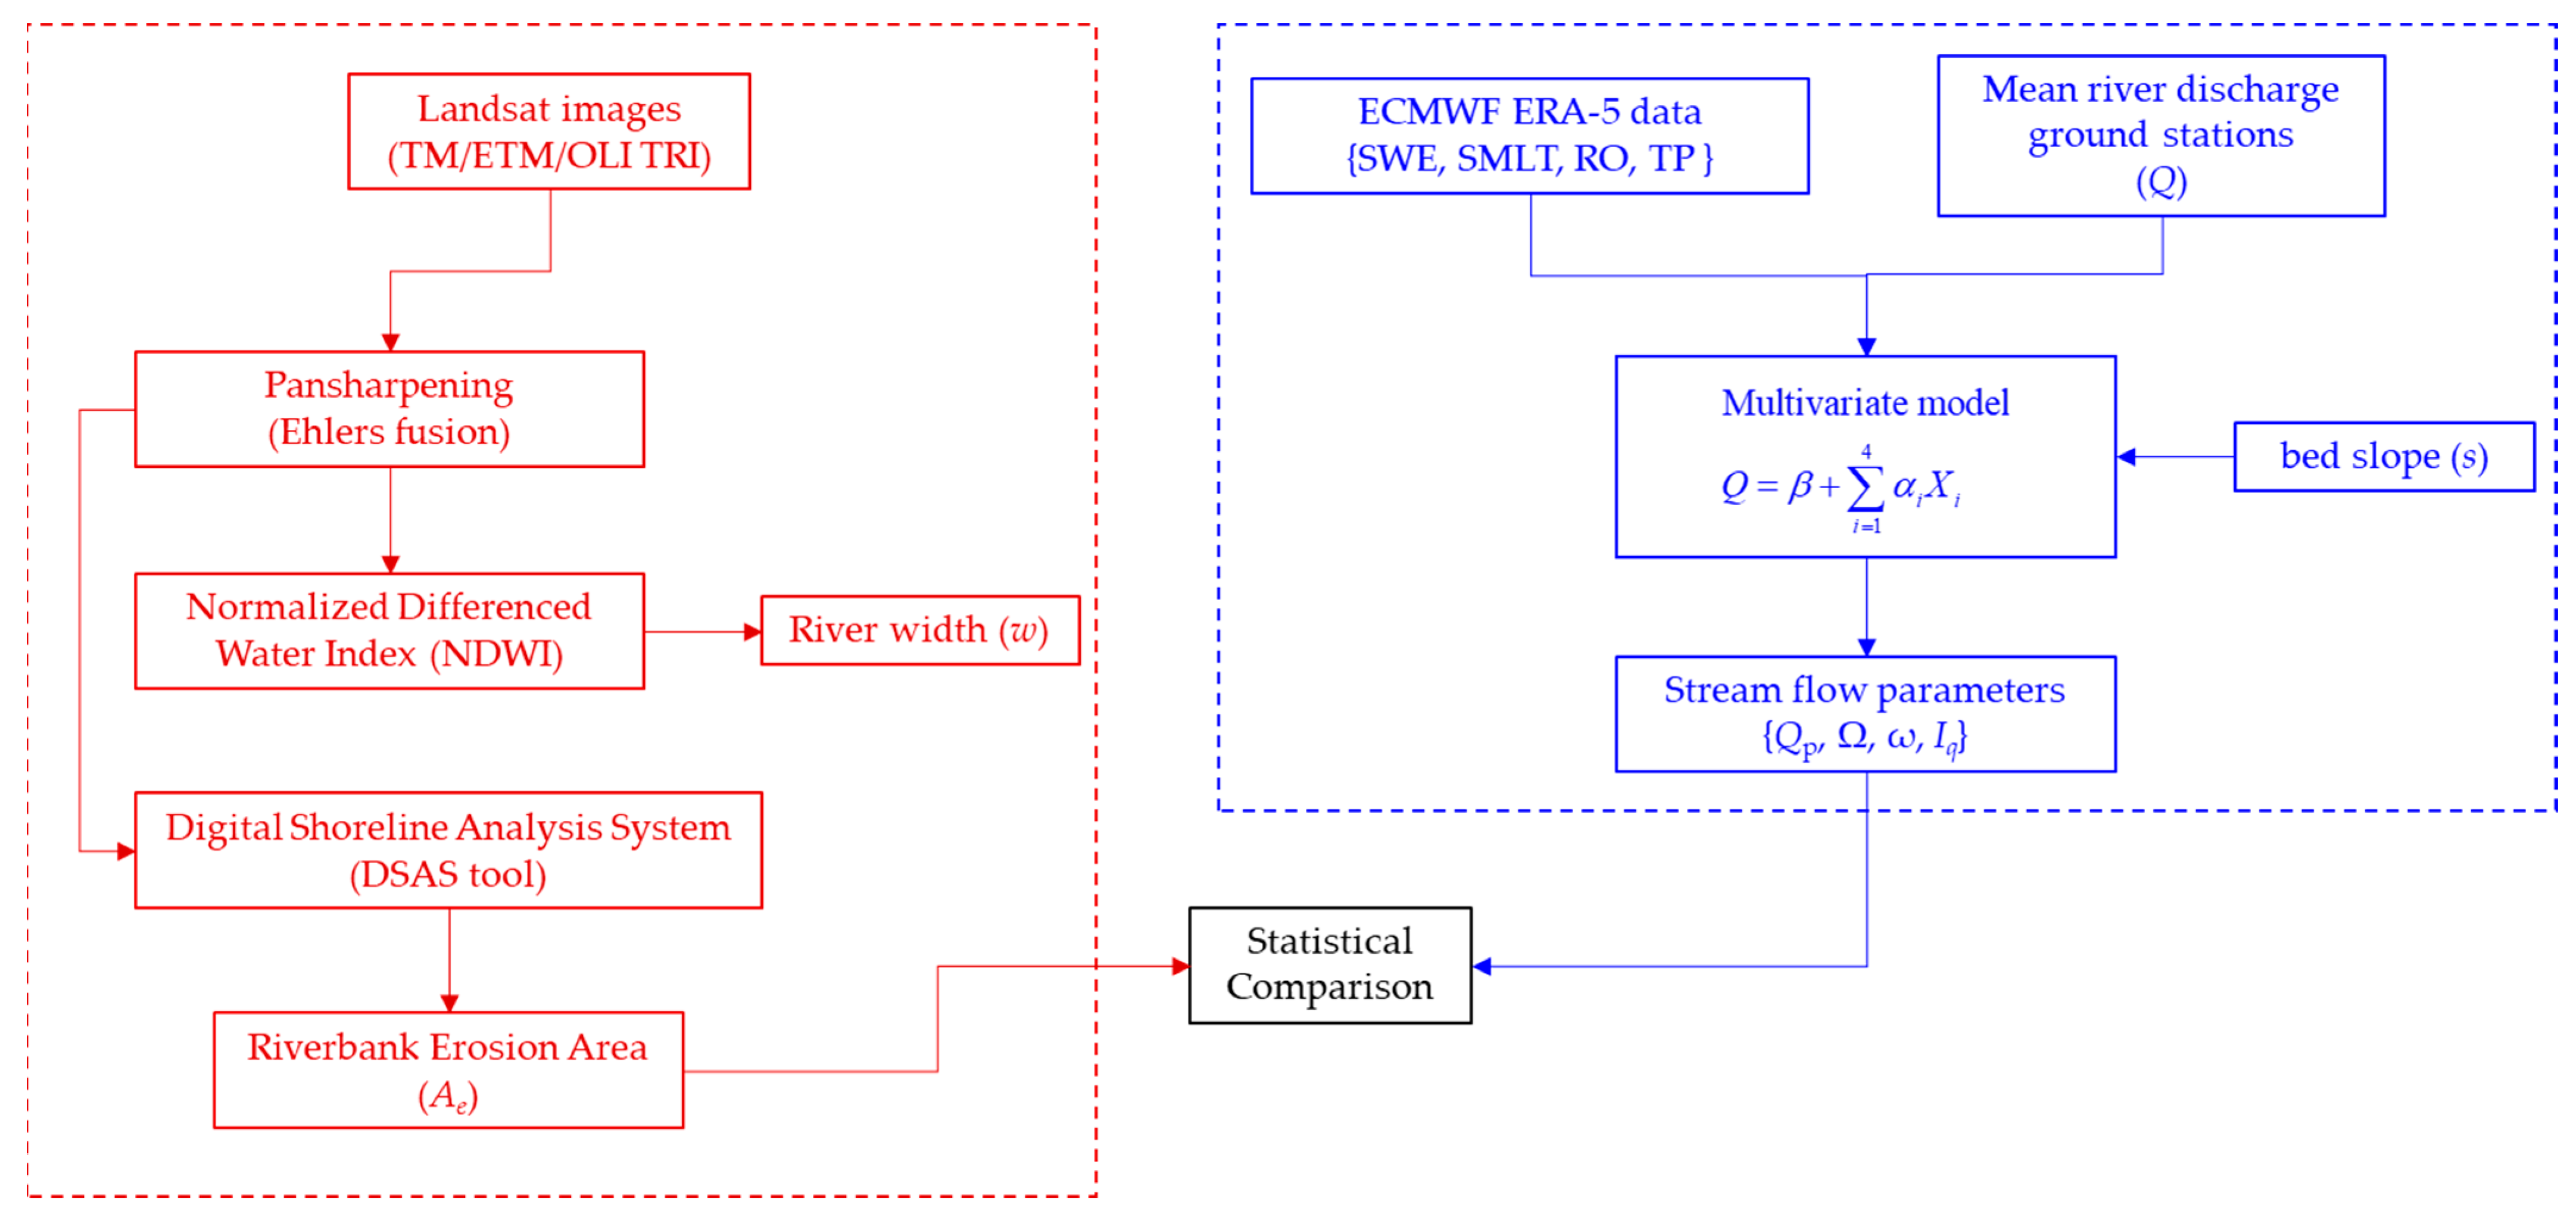
2.3. Methods
3. Results and Discussion
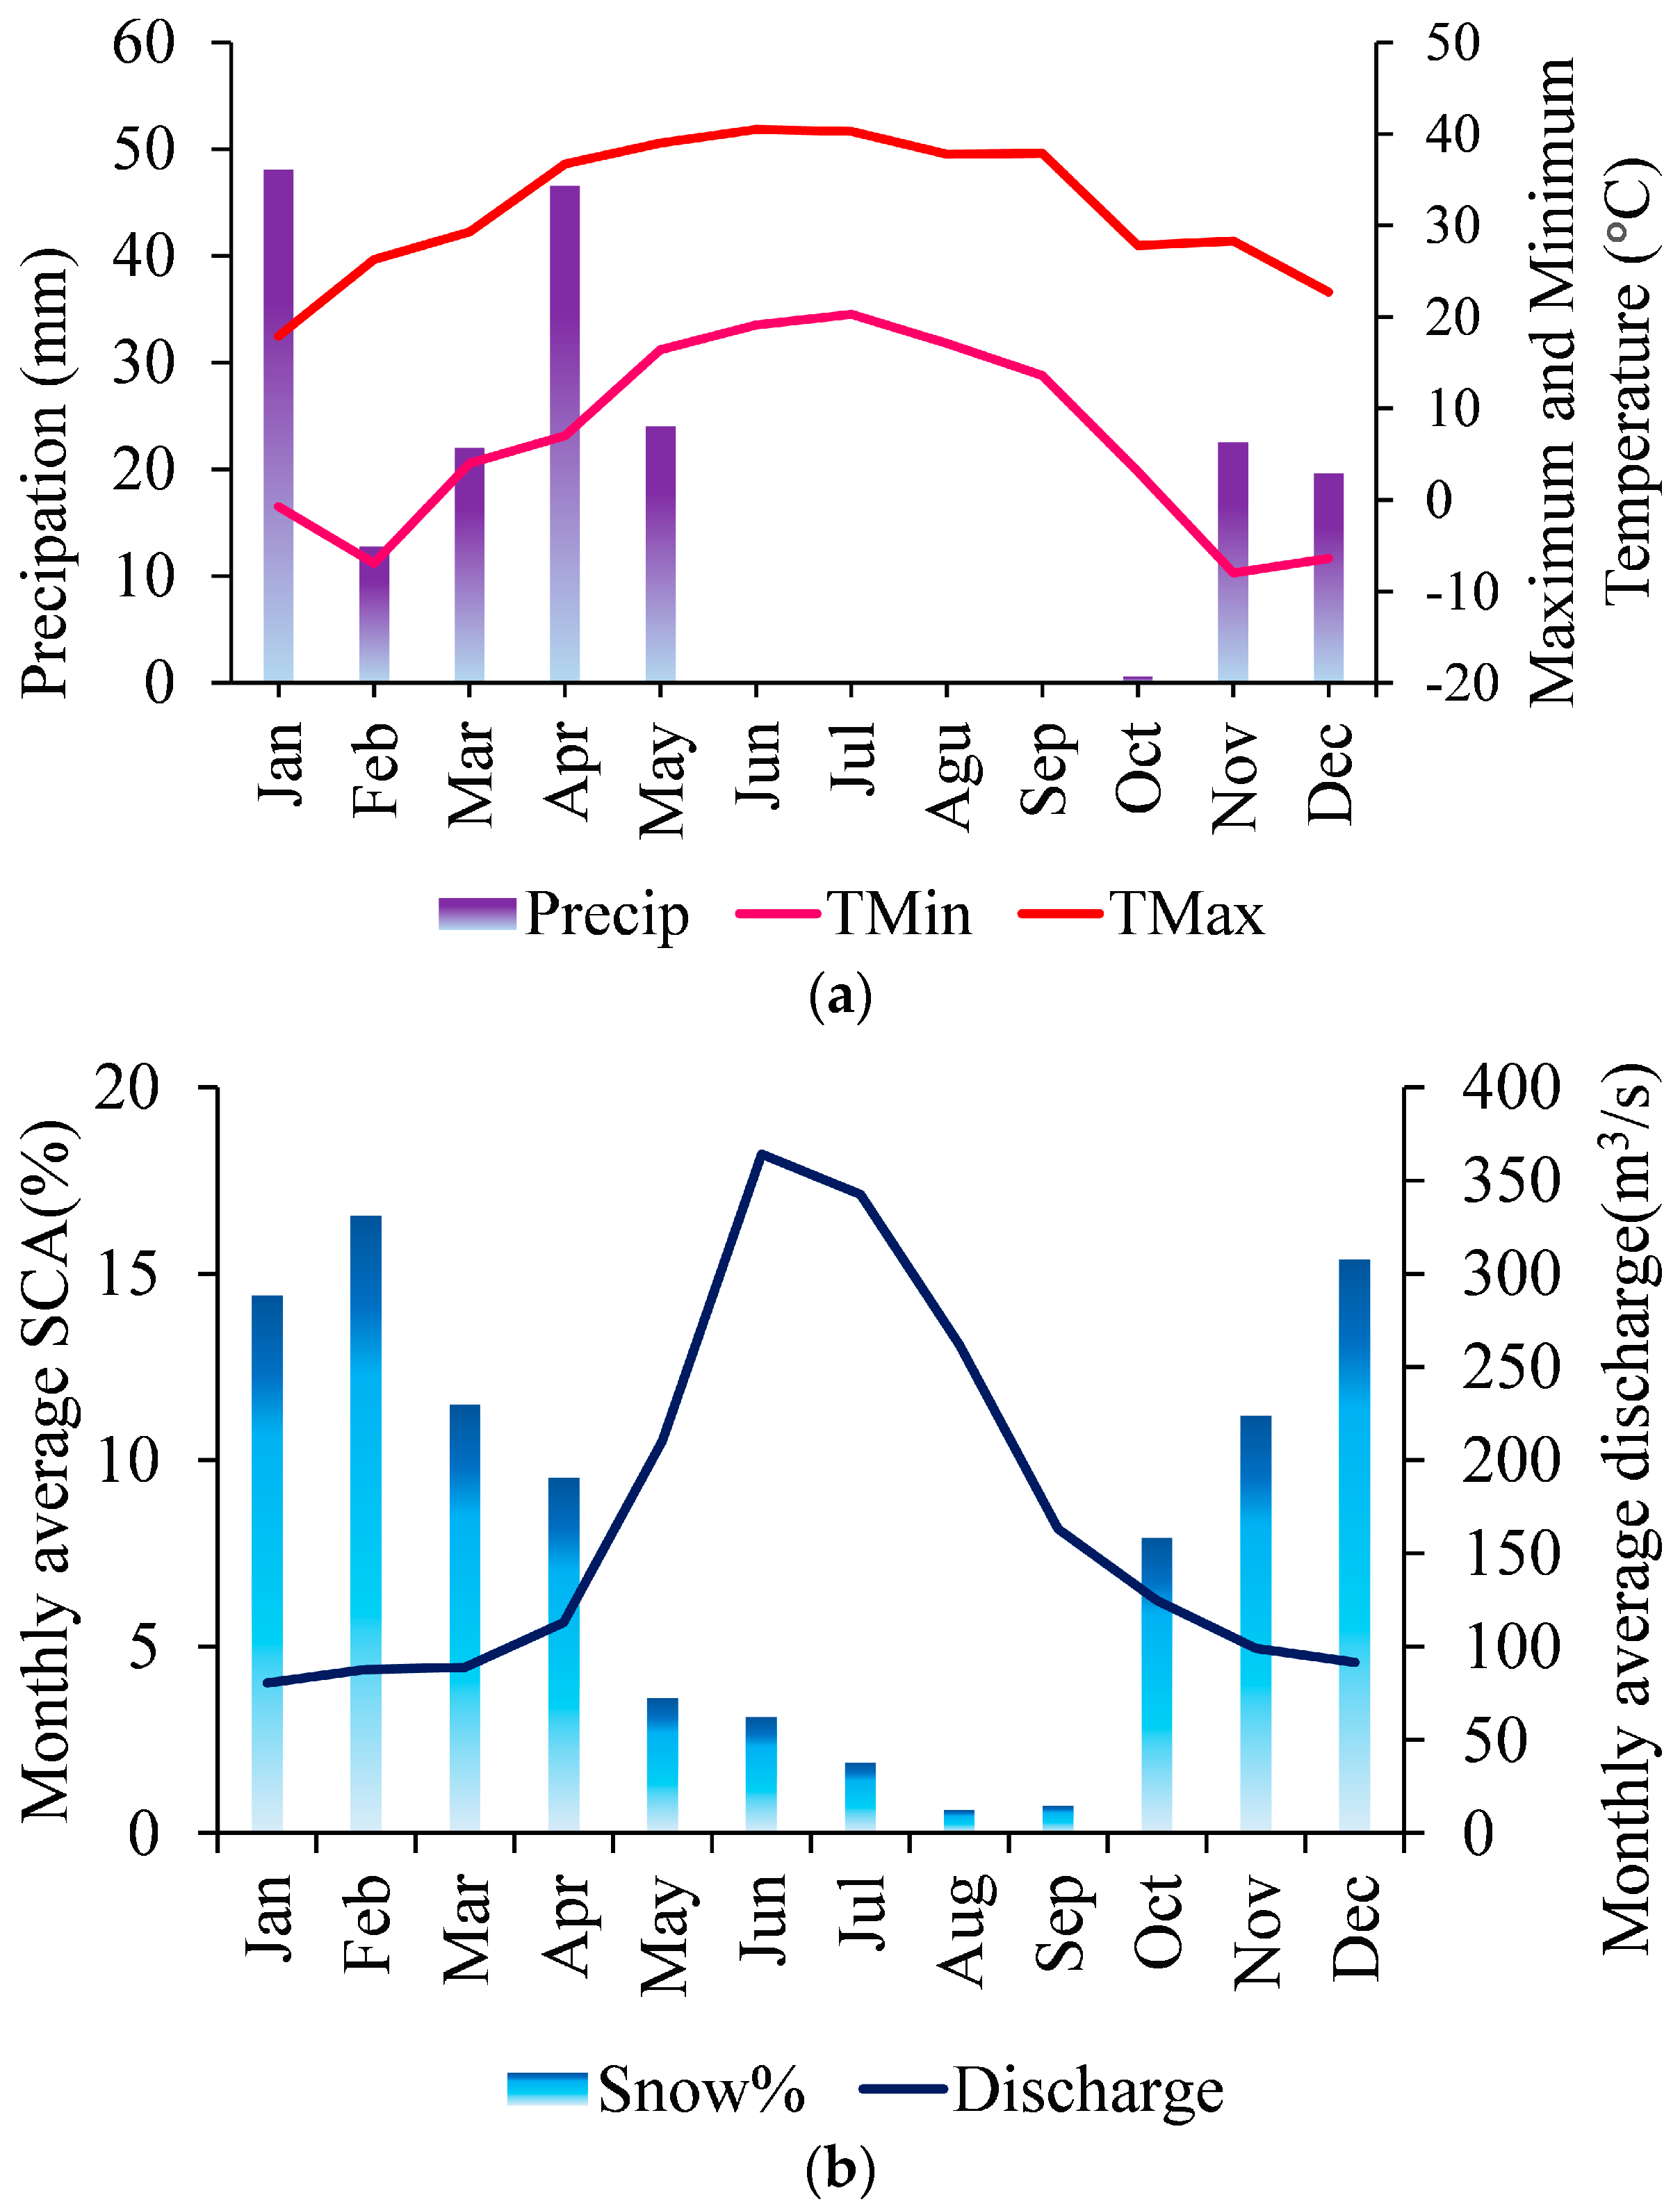
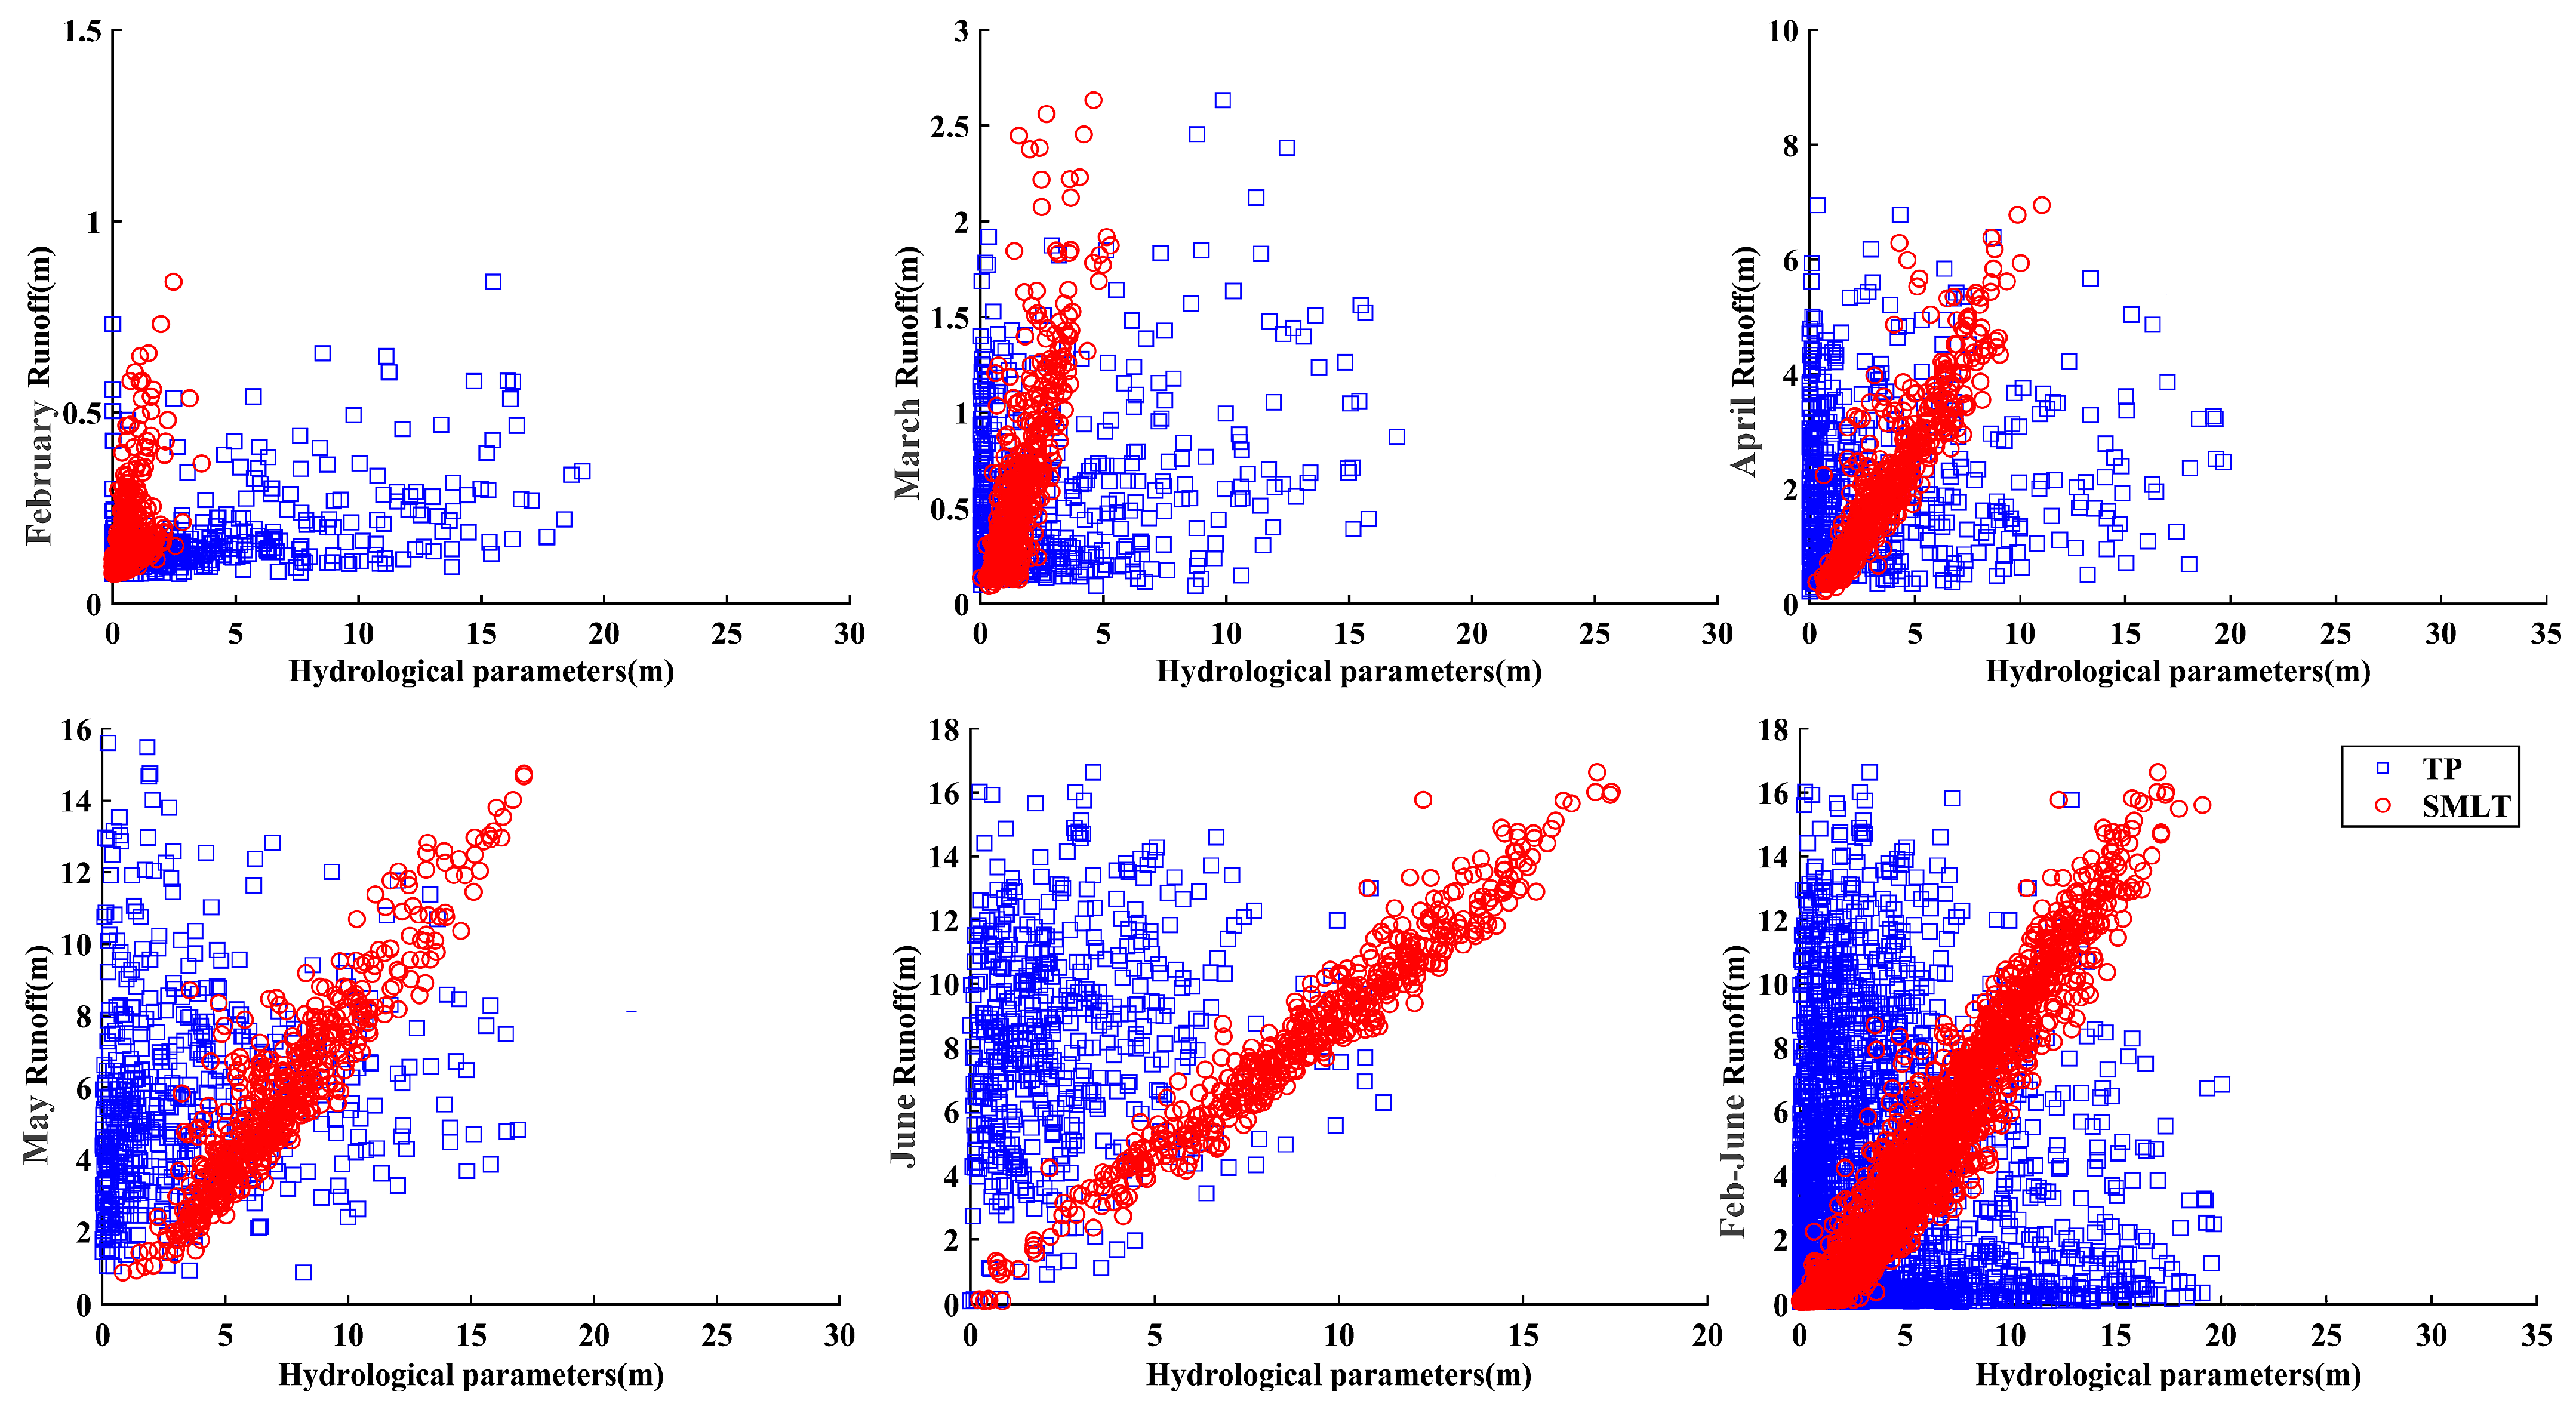
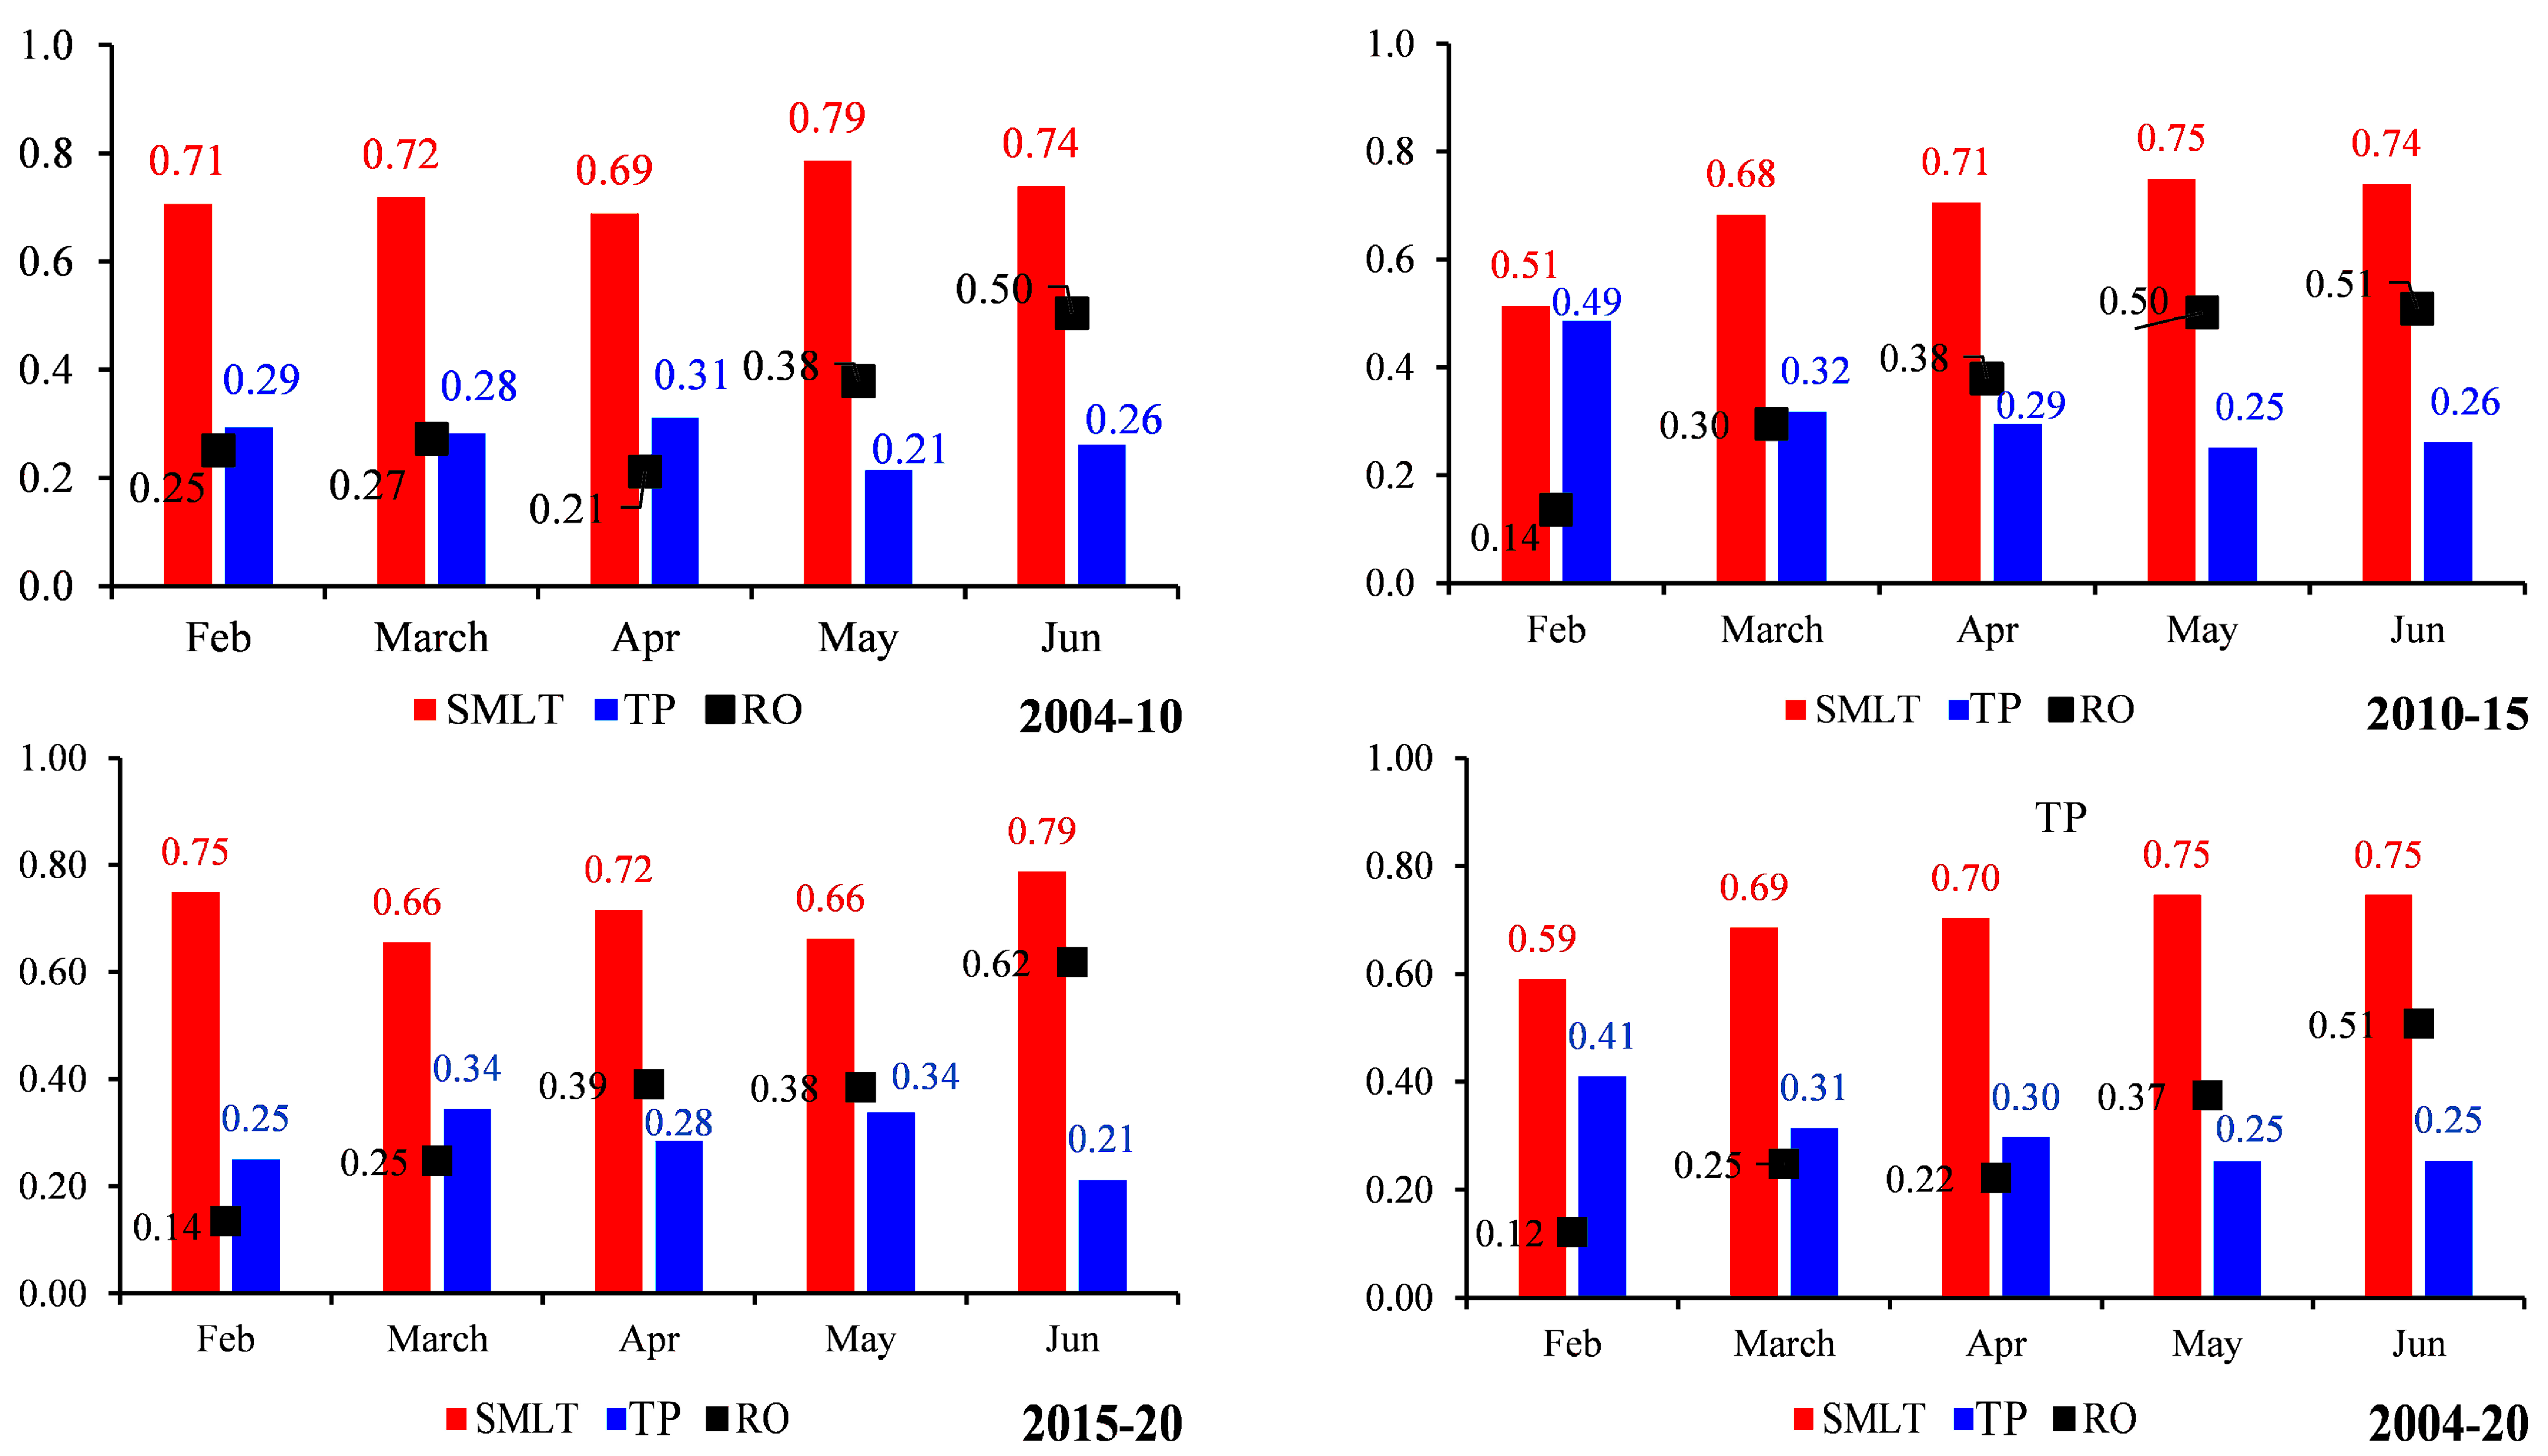
3.1. Snowmelt or Precipitation Dominance on Amu River Discharge
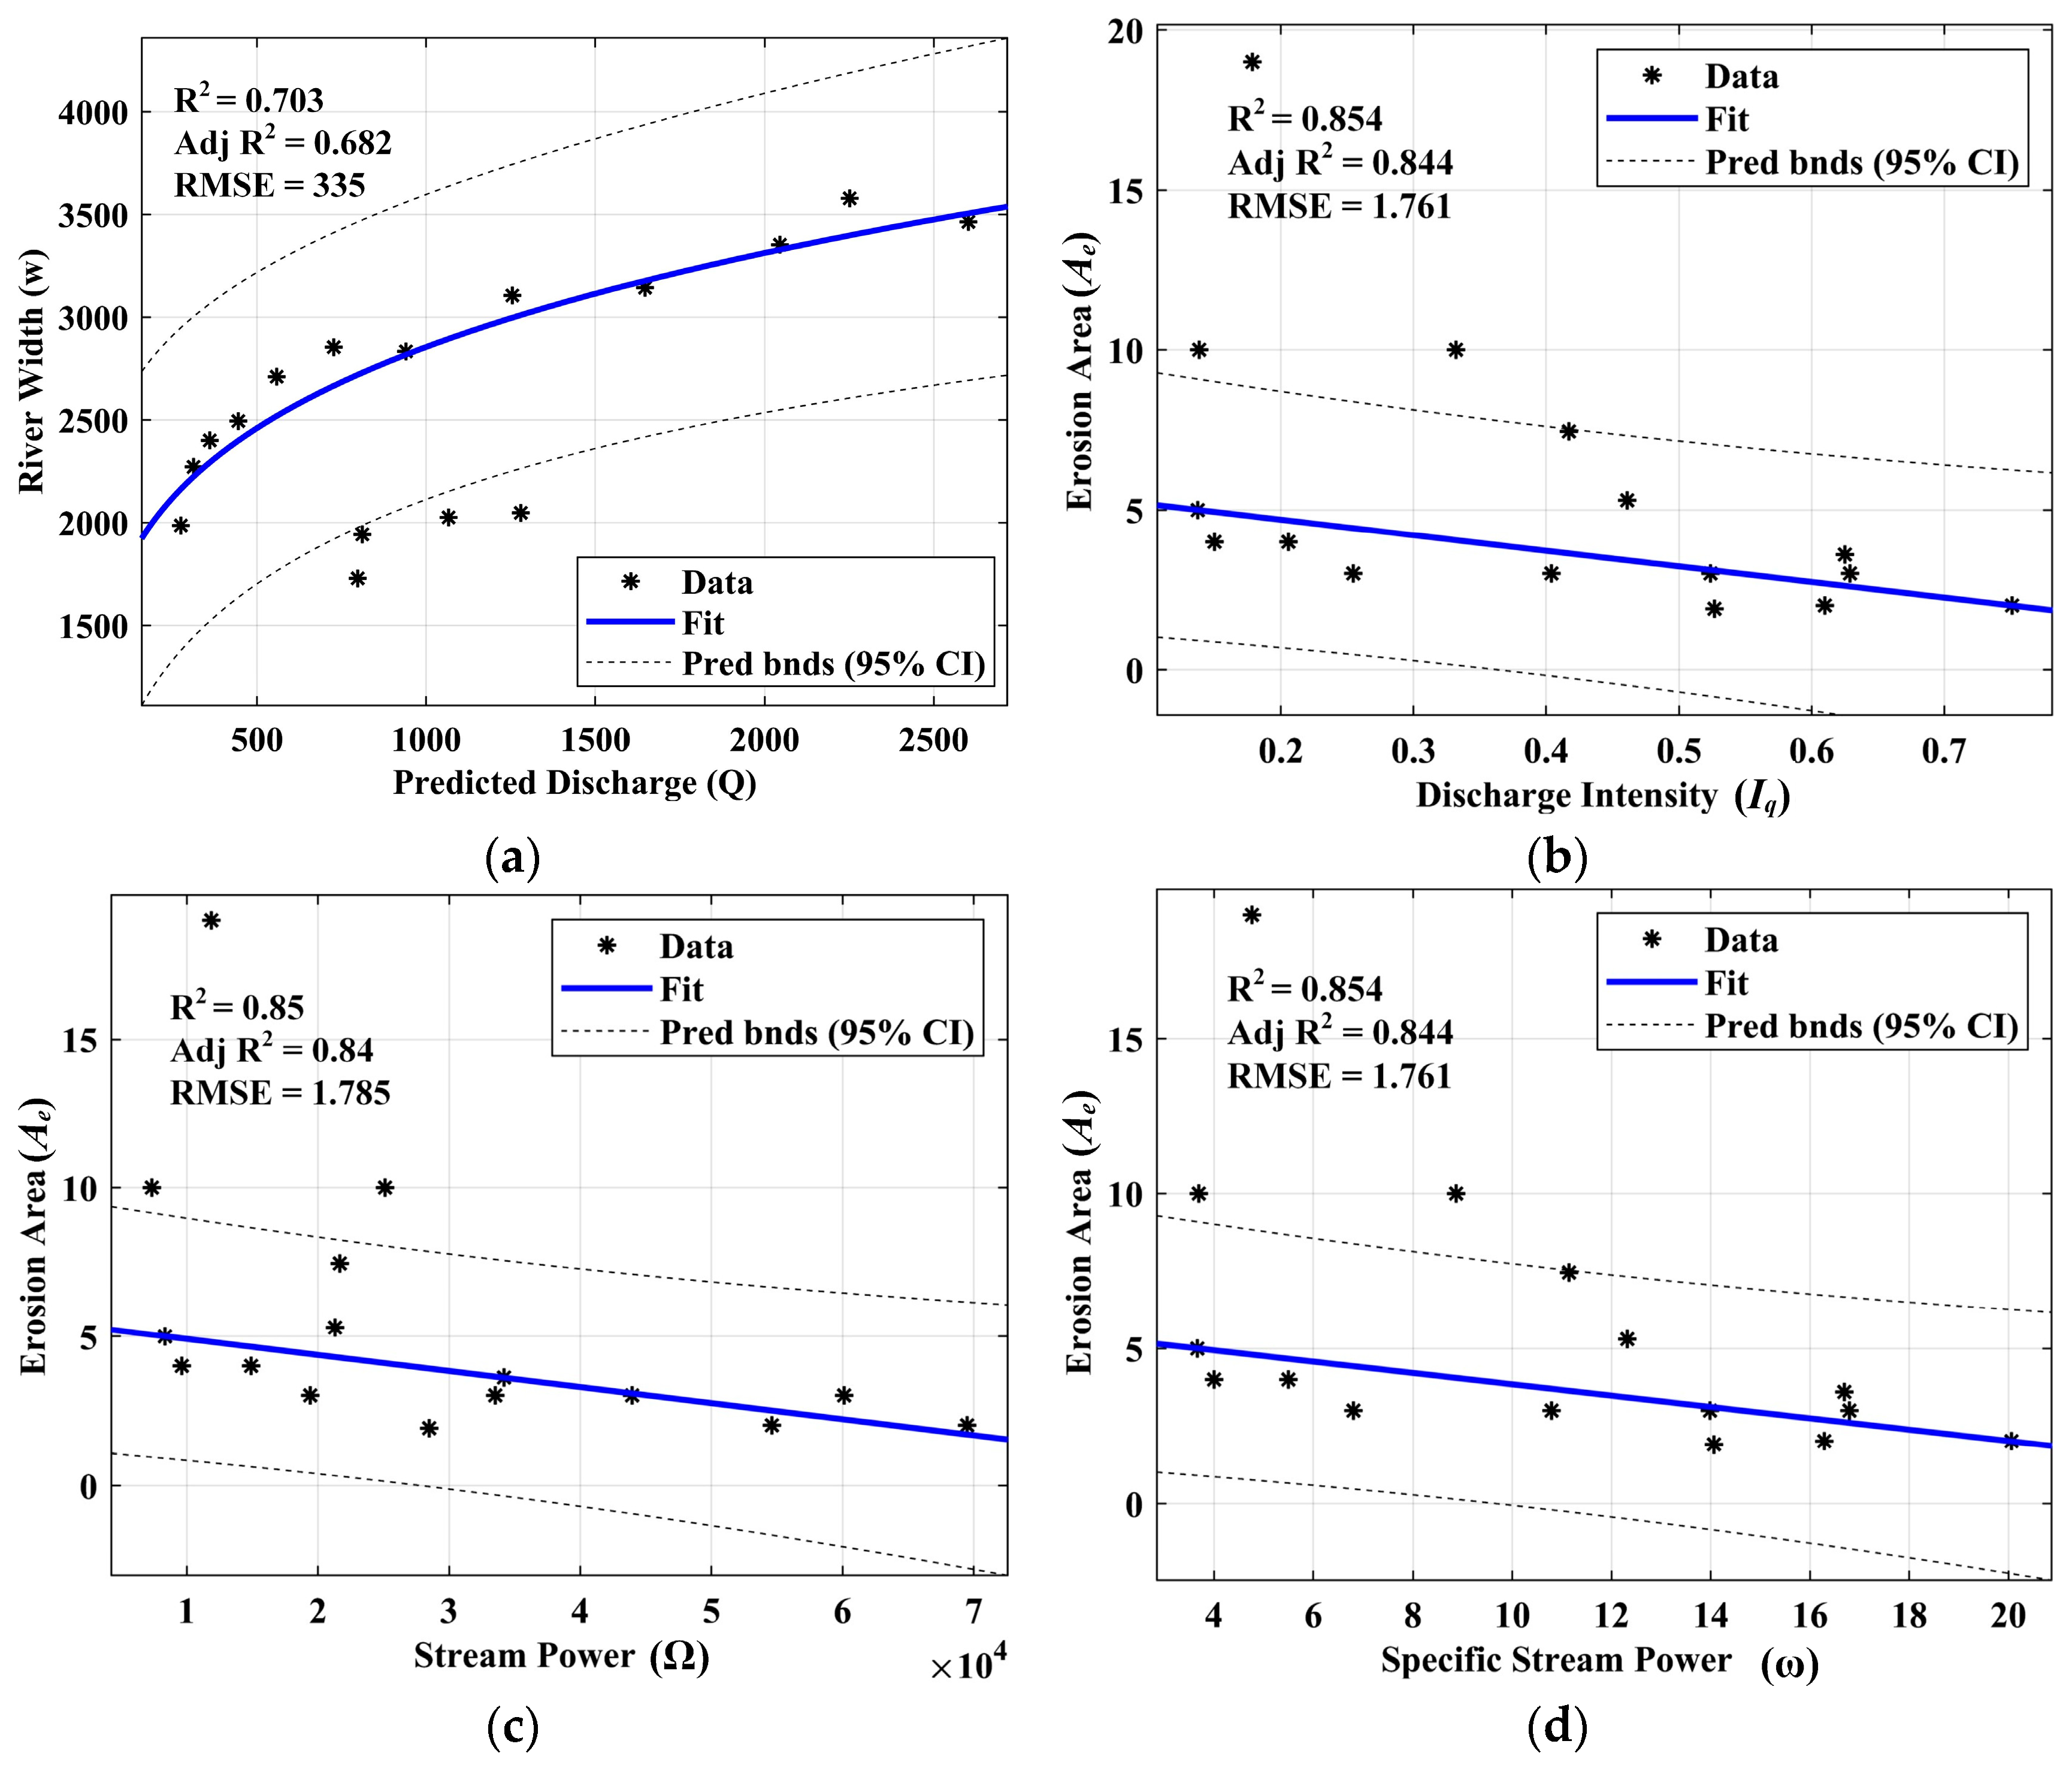
3.2. Linkage between the Flow Parameters and the Amu River Riverbank Erosion
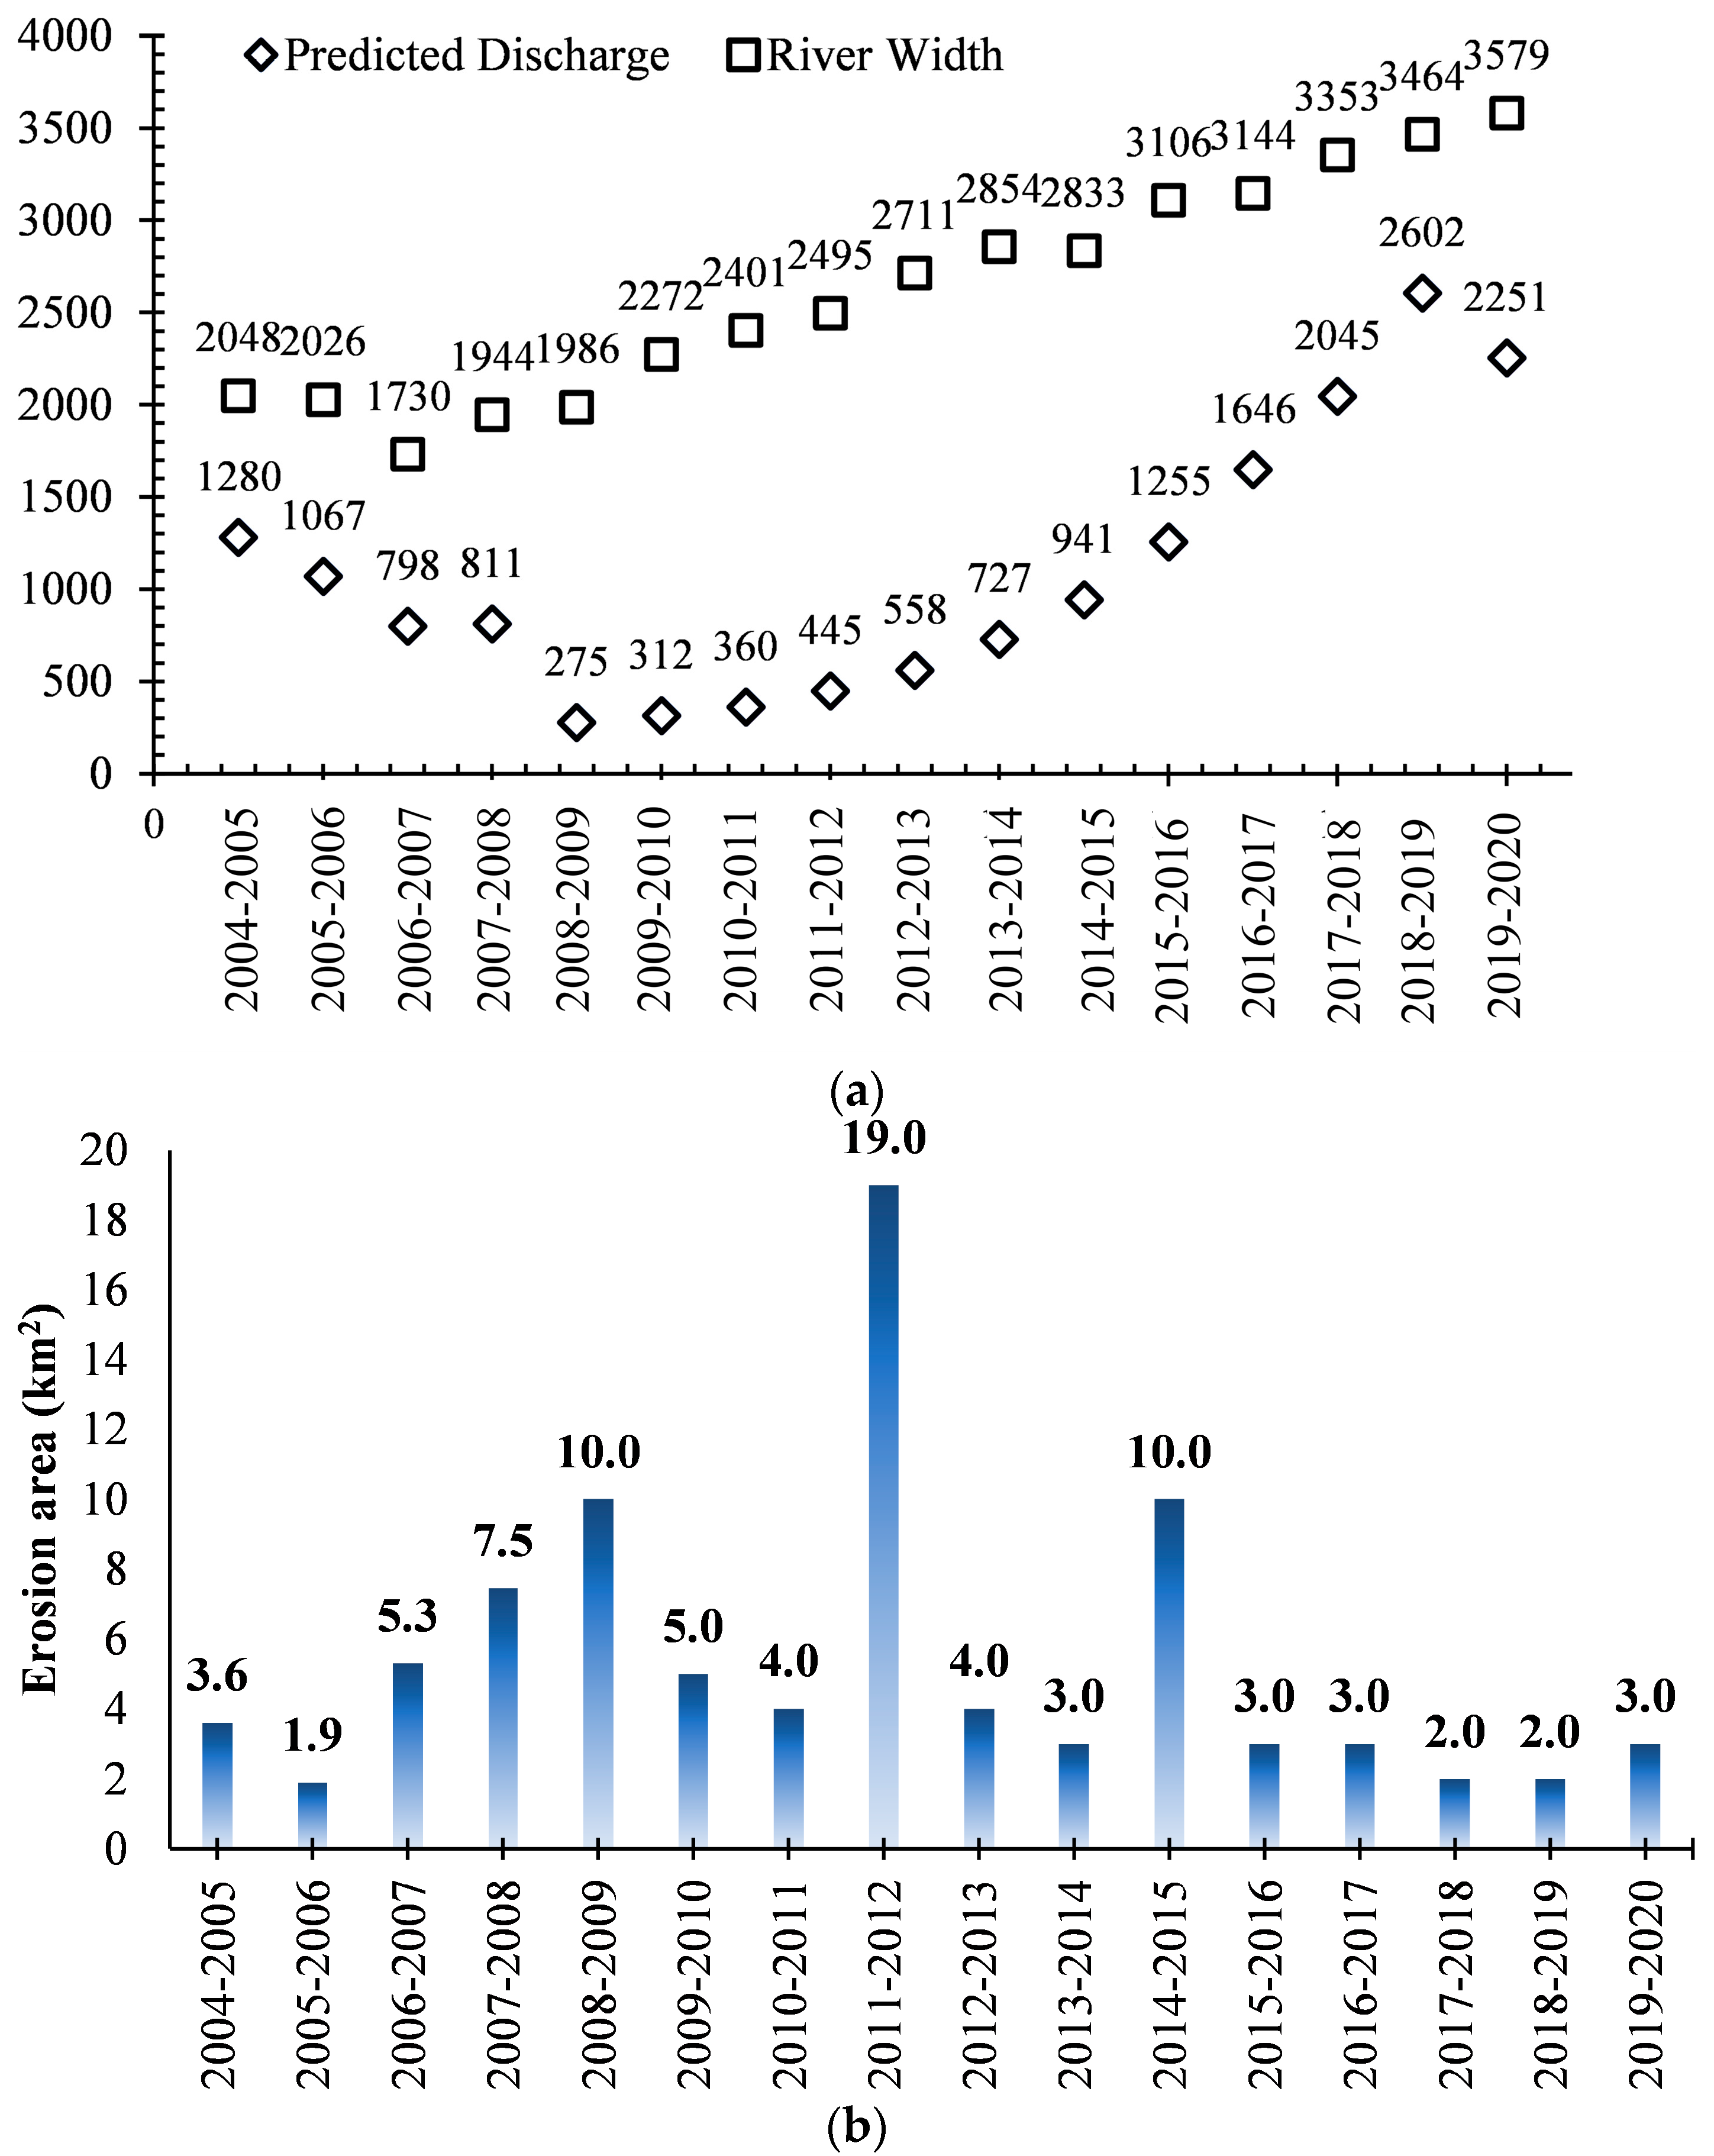
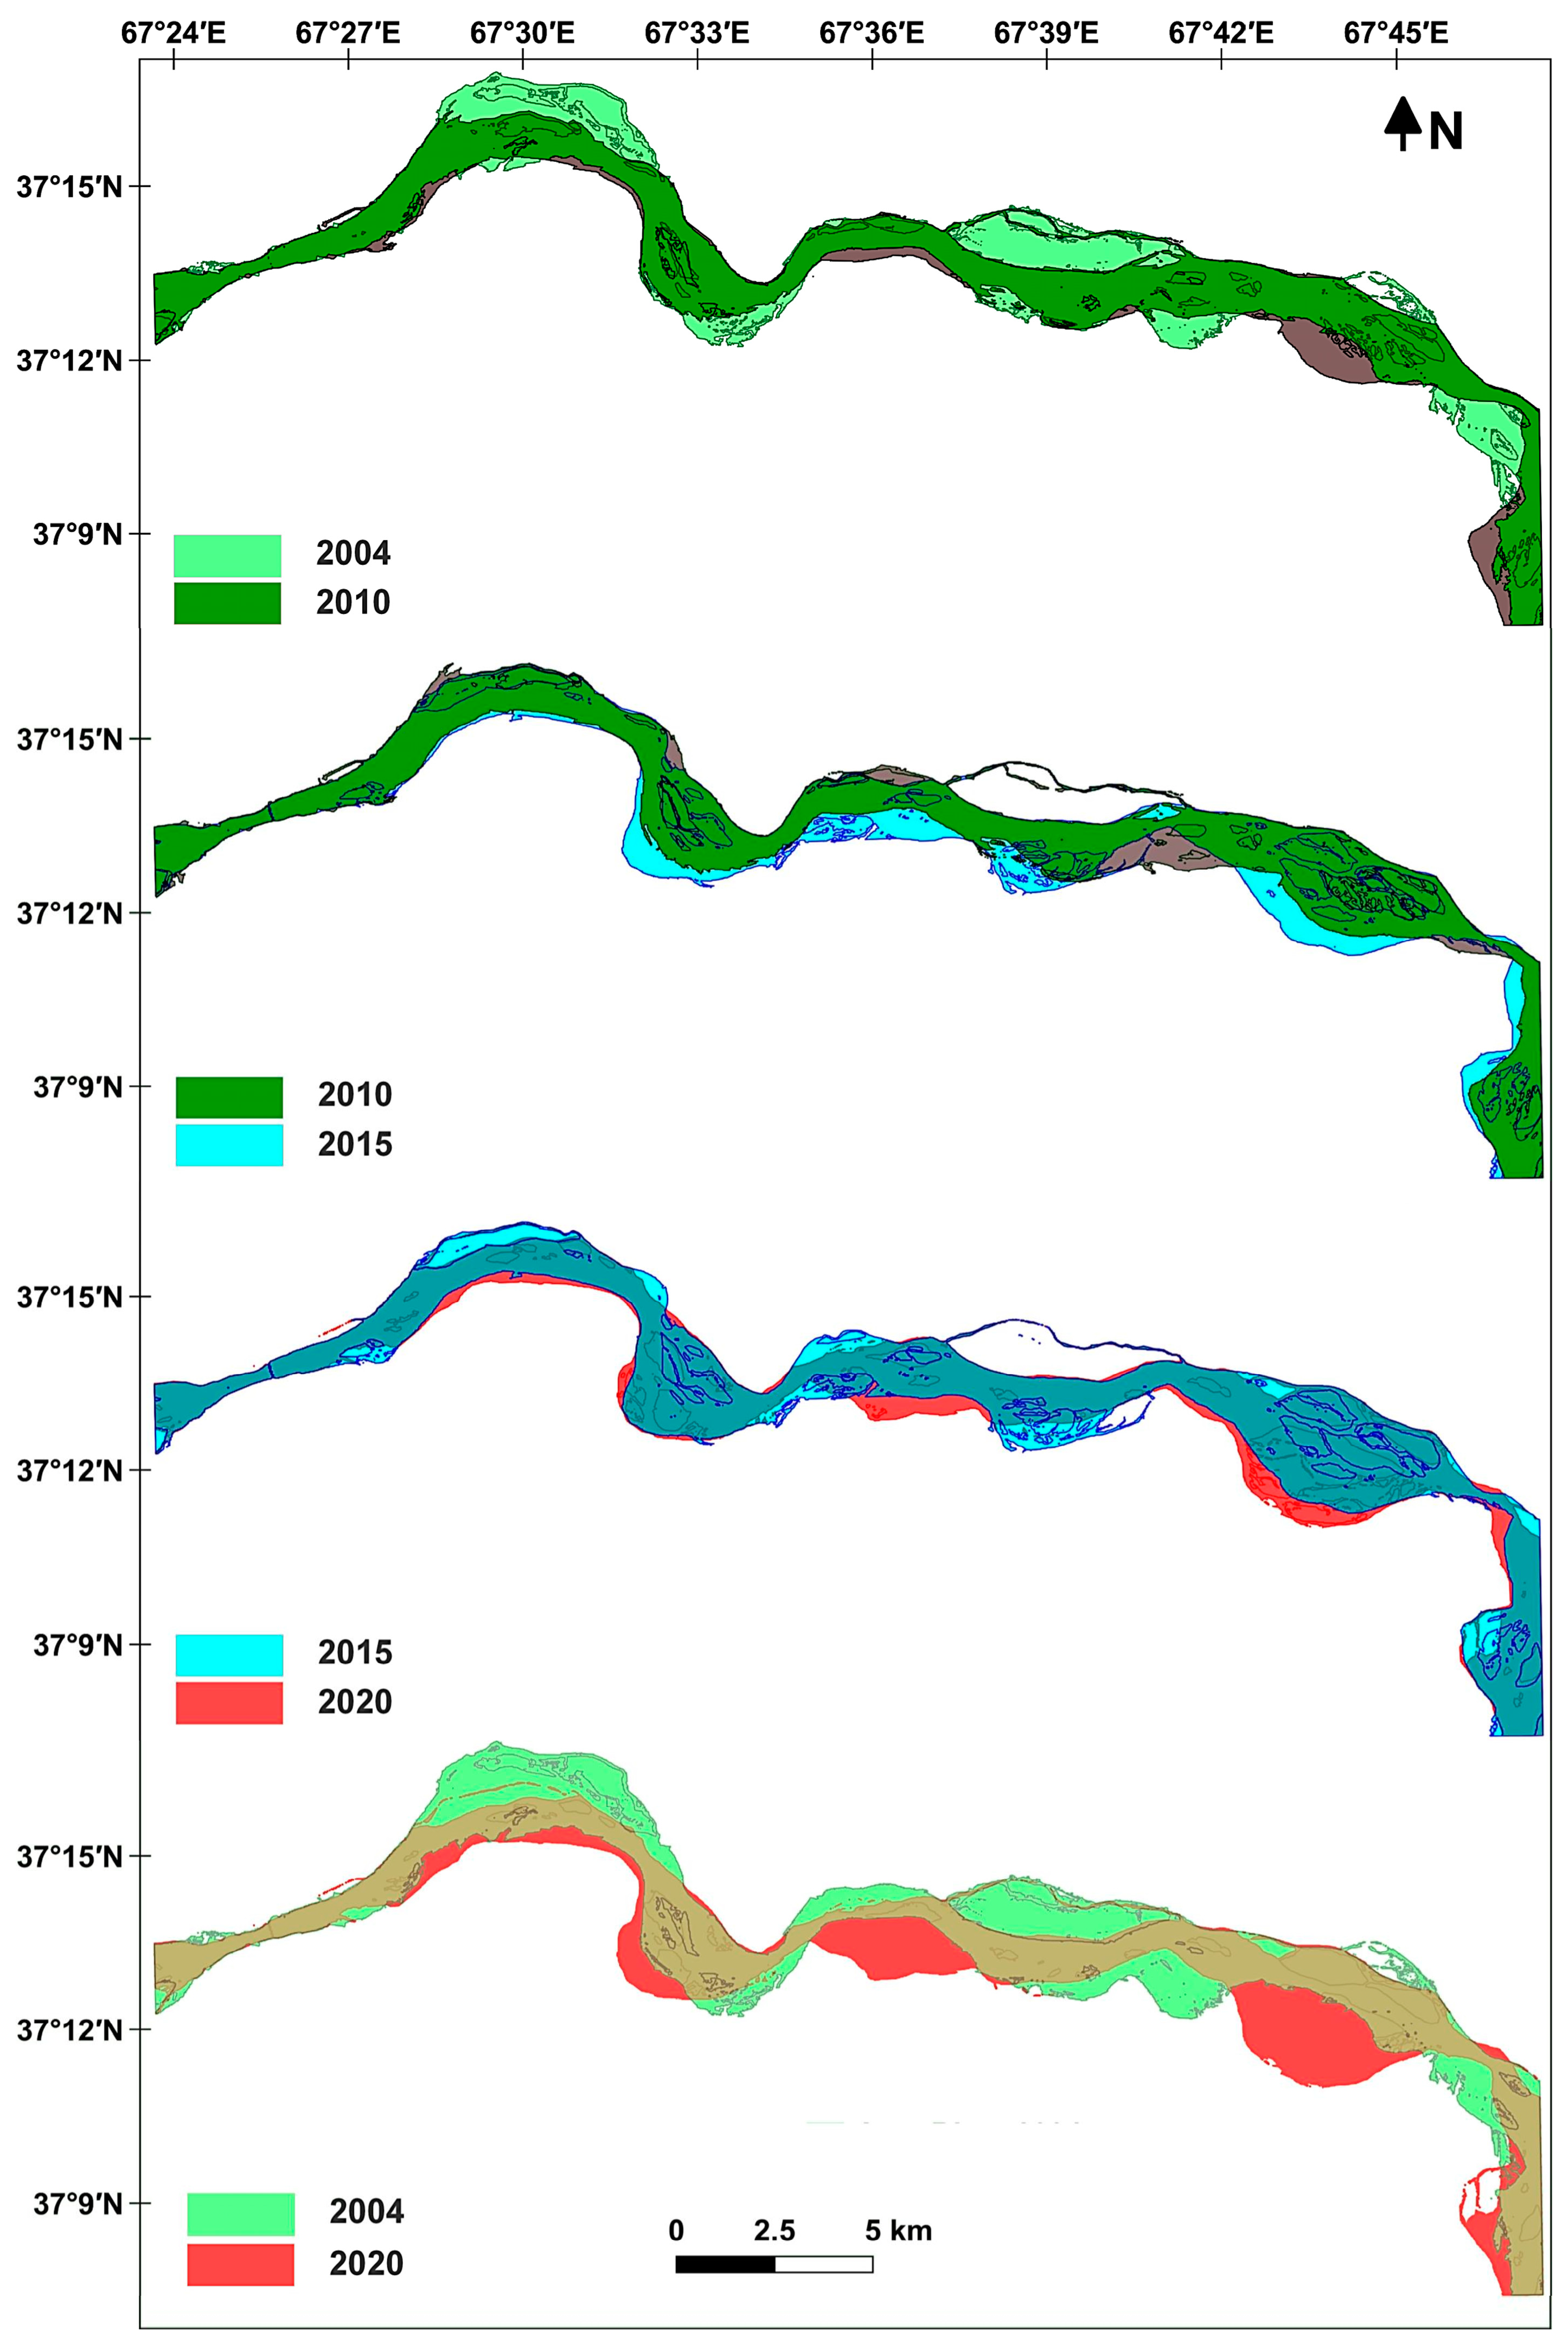
3.3. Periodical Land Loss Due to Amu River Riverbank Erosion
4. Conclusions
Author Contributions
Funding
Data Availability Statement
Acknowledgments
Conflicts of Interest
References
- Langat, P.K.; Kumar, L.; Koech, R. Monitoring river channel dynamics using remote sensing and GIS techniques. Geomorphology 2019, 325, 92–102. [Google Scholar] [CrossRef]
- Paul, B.K.; Rahman, M.K.; Crawford, T.; Curtis, S.; Miah, M.G.; Islam, M.R.; Islam, M.S. Explaining mobility using the Community Capital Framework and Place Attachment concepts: A case study of riverbank erosion in the Lower Meghna Estuary, Bangladesh. Appl. Geogr. 2020, 125, 102199. [Google Scholar] [CrossRef]
- Kumer, R.D.; Goswami, S.; Ahmed, T.; Kumar, S.M.; Hasan, E.M.; Abdur, R.M. SocioEconomic Impacts of River Bank Erosion on Durgapasha Union in Bakerganj Upazila, Bangladesh. Barisal Univ. J. Part 1 2017, 4, 165–183. [Google Scholar]
- Mukhopadhyay, A.; Ghosh, P.; Chanda, A.; Ghosh, A.; Ghosh, S.; Das, S.; Ghosh, T.; Hazra, S. Threats to coastal communities of Mahanadi delta due to imminent consequences of erosion—Present and near future. Sci. Total Environ. 2018, 637–638, 717–729. [Google Scholar] [CrossRef]
- Mahantesh, K.K.; Prashanth, P.; Chandrashekhar, R.; Saidaih, P.; Siddappa; Umesh, B.C. Evaluation of different African marigold (Tagetes species Linn.) genotypes for vegetative, floral and yield attributes under Southern Telangana condition. Int. J. Chem. Stud. 2018, 6, 3311–3315. [Google Scholar]
- Rahman, M.; Popke, J.; Crawford, T.W. Resident perceptions of riverbank erosion and shoreline protection: A mixed-methods case study from Bangladesh. Nat. Hazards 2022, 114, 2767–2786. [Google Scholar] [CrossRef]
- Debnath, J.; Sahariah, D.; Lahon, D.; Nath, N.; Chand, K.; Meraj, G.; Kumar, P.; Singh, S.K.; Kanga, S.; Farooq, M. Assessing the impacts of current and future changes of the planforms of river Brahmaputra on its land use-land cover. Geosci. Front. 2023, 14, 101557. [Google Scholar] [CrossRef]
- Das, T.K.; Haldar, S.K.; Das Gupta, I.; Sen, S. River Bank Erosion Induced Human Displacement and Its Consequences. Living Rev. Landsc. Res. 2014, 8, 3. [Google Scholar] [CrossRef]
- Sarif, M.N.; Siddiqui, L.; Siddiqui, M.A.; Parveen, N.; Islam, M.S.; Khan, S.; Khanam, N.; Mohibul, S.; Shariq, M.; Nasrin, T. Household-Based Approach to Assess the Impact of River Bank Erosion on the Socio-economic Condition of People: A Case Study of Lower Ganga Plain. In Challenges of Disasters in Asia; Sajjad, H., Siddiqui, L., Rahman, A., Tahir, M., Siddiqui, M.A., Eds.; Springer: Singapore, 2022; pp. 73–101. ISBN 978-981-19-3567-1. [Google Scholar]
- Baki, A.B.M.; Gan, T.Y. Riverbank migration and island dynamics of the braided Jamuna River of the Ganges–Brahmaputra basin using multi-temporal Landsat images. Quat. Int. 2012, 263, 148–161. [Google Scholar] [CrossRef]
- Anh, H.H.; Thuy, N.N. Socio-economic assessment of riverbank erosion from heavy boat traffic: A case study at the Cho Gao Canal, Tien Giang, Vietnam. IOP Conf. Ser. Earth Environ. Sci. 2022, 967, 12005. [Google Scholar] [CrossRef]
- Mahmoodzada, A.B.; Shimada, S.; Azizi, M.; Hqbin, M.; Mahmoodzada, A.S. Monitoring of Riverbank Erosion and Shoreline Movement at Amu River Using Remote Sensing and GIS: A Case Study in Jowzjan, Afghanistan. Int. J. Environ. Rural. Dev. 2019, 10, 140–145. [Google Scholar] [CrossRef]
- Baymanov, K.I.; Uzakov, T.J.; Baimanov, R.K.; Tajibaev, S. Riverbed processes in the lower reaches of the Amu Darya river in conditions of anthropogenic impact on the river flow. IOP Conf. Ser. Earth Environ. Sci. 2022, 1045, 12002. [Google Scholar] [CrossRef]
- Wright, J.M. Floodplain Management Principles and Current Practices; University of Tennessee: Knocksville, TN, USA, 2007. [Google Scholar]
- Longoni, L.; Papini, M.; Brambilla, D.; Barazzetti, L.; Roncoroni, F.; Scaioni, M.; Ivanov, V.I. Monitoring Riverbank Erosion in Mountain Catchments Using Terrestrial Laser Scanning. Remote Sens. 2016, 8, 241. [Google Scholar] [CrossRef]
- Torres, R.; Snoeij, P.; Geudtner, D.; Bibby, D.; Davidson, M.; Attema, E.; Potin, P.; Rommen, B.; Floury, N.; Brown, M.; et al. GMES Sentinel-1 mission. Remote Sens. Environ. 2012, 120, 9–24. [Google Scholar] [CrossRef]
- Awasthi, S.; Varade, D. Recent advances in the remote sensing of alpine snow: A review. GIScience Remote Sens. 2021, 58, 852–888. [Google Scholar] [CrossRef]
- Rahman, M.A.T.; Islam, S.; Rahman, S.H. Coping with flood and riverbank erosion caused by climate change using livelihood resources: A case study of Bangladesh. Clim. Dev. 2014, 7, 185–191. [Google Scholar] [CrossRef]
- Welty, J.; Zeng, X. Characteristics and Causes of Extreme Snowmelt over the Conterminous United States. Bull. Am. Meteorol. Soc. 2021, 102, E1526–E1542. [Google Scholar] [CrossRef]
- Singh, H.; Varade, D.; van Vries, M.W.d.; Adhikari, K.; Rawat, M.; Awasthi, S.; Rawat, D. Assessment of potential present and future glacial lake outburst flood hazard in the Hunza valley: A case study of Shisper and Mochowar glacier. Sci. Total Environ. 2023, 868, 161717. [Google Scholar] [CrossRef]
- Singh, H.; Varade, D.; Mishra, P.K. Cloudburst Events in the Indian Himalayas: A Historical Geospatial Perspective. In International Handbook of Disaster Research; Singh, A., Ed.; Springer: Singapore, 2022; pp. 1–21. ISBN 978-981-16-8800-3. [Google Scholar]
- Lam-Dao, N.; Viet, P.-B.; Minh, N.-T.; Mai-Thy, P.-T.; Phung, H.-P. Change Detection of Land Use and Riverbank in Mekong Delta, Vietnam Using Time Series Remotely Sensed Data. J. Resour. Ecol. 2011, 2, 370. [Google Scholar] [CrossRef]
- Sun, C.; Hou, H.; Chen, W. Effects of vegetation cover and slope on soil erosion in the Eastern Chinese Loess Plateau under different rainfall regimes. PeerJ 2021, 9, e11226. [Google Scholar] [CrossRef]
- Zhao, J.; Feng, X.; Deng, L.; Yang, Y.; Zhao, Z.; Zhao, P.; Peng, C.; Fu, B. Quantifying the Effects of Vegetation Restorations on the Soil Erosion Export and Nutrient Loss on the Loess Plateau. Front. Plant Sci. 2020, 11, 573126. [Google Scholar] [CrossRef] [PubMed]
- Frotan, M.S.; Nakaza, E.; Schaab, C.; Motoyashiki, R. Surface water resources of Afghanistan’s northern River basin and effects of climate change. J. JSCE 2020, 8, 118–126. [Google Scholar] [CrossRef] [PubMed]
- OCHA Services. Afghanistan: Overview of Natural Disasters. 2021. Available online: https://response.reliefweb.int/afghanistan/natural-disasters-dashboard (accessed on 10 September 2023).
- Henshaw, A.J.; Thorne, C.R.; Clifford, N.J. Identifying causes and controls of river bank erosion in a British upland catchment. CATENA 2013, 100, 107–119. [Google Scholar] [CrossRef]
- Ahmad, M.; Wasiq, M. Water Resource Development in Northern Afghanistan and Its Implications for Amu Darya Basin; World Bank: Washington, DC, USA, 2004; ISBN 0-8213-5890-1. [Google Scholar]
- Tarek, M.; Brissette, F.P.; Arsenault, R. Evaluation of the ERA5 reanalysis as a potential reference dataset for hydrological modelling over North America. Hydrol. Earth Syst. Sci. 2020, 24, 2527–2544. [Google Scholar] [CrossRef]
- Muñoz-Sabater, J.; Dutra, E.; Agustí-Panareda, A.; Albergel, C.; Arduini, G.; Balsamo, G.; Boussetta, S.; Choulga, M.; Harrigan, S.; Hersbach, H.; et al. ERA5-Land: A state-of-the-art global reanalysis dataset for land applications. Earth Syst. Sci. Data 2021, 13, 4349–4383. [Google Scholar] [CrossRef]
- Dembélé, M.; Ceperley, N.; Zwart, S.J.; Salvadore, E.; Mariethoz, G.; Schaefli, B. Potential of satellite and reanalysis evaporation datasets for hydrological modelling under various model calibration strategies. Adv. Water Resour. 2020, 143, 103667. [Google Scholar] [CrossRef]
- Mahto, S.S.; Mishra, V. Does ERA-5 Outperform Other Reanalysis Products for Hydrologic Applications in India? J. Geophys. Res. Atmos. 2019, 124, 9423–9441. [Google Scholar] [CrossRef]
- Mahmoodzada, A.B.; Varade, D.; Shimada, S.; Okazawa, H.; Vinay, C. Average Quantifying the Snowmelt Dominant River Erosion in Afghanistan between 2004–2020. In Proceedings of the EGU21-10888, EGU General Assembly, Online, 19–30 April 2021. [Google Scholar]
- Hagg, W.; Hoelzle, M.; Wagner, S.; Mayr, E.; Klose, Z. Glacier and runoff changes in the Rukhk catchment, upper Amu-Darya basin until 2050. Glob. Planet. Chang. 2013, 110, 62–73. [Google Scholar] [CrossRef]
- Agal’tseva, N.A.; Bolgov, M.V.; Spektorman, T.Y.; Trubetskova, M.D.; Chub, V.E. Estimating hydrological characteristics in the Amu Darya River basin under climate change conditions. Russ. Meteorol. Hydrol. 2011, 36, 681–689. [Google Scholar] [CrossRef]
- Mahmoodzada, A.B.; Varade, D.; Shimada, S. Estimation of Snow Depth in the Hindu Kush Himalayas of Afghanistan during Peak Winter and Early Melt Season. Remote Sens. 2020, 12, 2788. [Google Scholar] [CrossRef]
- Mahmoodzada, A.B.; Varade, D.; Shimada, S.; Rezazada, F.A.; Mahmoodzada, A.S.; Jawher, A.N.; Toghyan, M. Capability assessment of Sentinel-1 data for estimation of snow hydrological potential in the Khanabad watershed in the Hindu Kush Himalayas of Afghanistan. Remote Sens. Appl. Soc. Environ. 2022, 26, 100758. [Google Scholar] [CrossRef]
- Matveeva, T.; Sidorchuk, A. Modelling of Surface Runoff on the Yamal Peninsula, Russia, Using ERA5 Reanalysis. Water 2020, 12, 2099. [Google Scholar] [CrossRef]
- Tha, T.; Piman, T.; Bhatpuria, D.; Ruangrassamee, P. Assessment of Riverbank Erosion Hotspots along the Mekong River in Cambodia Using Remote Sensing and Hazard Exposure Mapping. Water 2022, 14, 1981. [Google Scholar] [CrossRef]
- Bhatpuria, D.; Matheswaran, K.; Piman, T.; Tha, T.; Towashiraporn, P. Assessment of Large-Scale Seasonal River Morphological Changes in Ayeyarwady River Using Optical Remote Sensing Data. Remote Sens. 2022, 14, 3393. [Google Scholar] [CrossRef]
- Mu, X.; Qiu, J.; Cao, B.; Cai, S.; Niu, K.; Yang, X. Mapping Soil Erosion Dynamics (1990–2020) in the Pearl River Basin. Remote Sens. 2022, 14, 5949. [Google Scholar] [CrossRef]
- Sil, B.S.; Ashwini, K.; Annayat, W.; Debnath, J.; Farooq, M.; Meraj, G. Observing Spatiotemporal Inconsistency of Erosion and Accretion in the Barak River Using Remote Sensing and GIS Techniques. Conservation 2023, 3, 14–31. [Google Scholar] [CrossRef]
- Wilson, Z.A.; Song, J.; Taylor, B.; Yang, C. The final split: The regulation of anther dehiscence. J. Exp. Bot. 2011, 62, 1633–1649. [Google Scholar] [CrossRef]
- Chen, Y.; Sun, K.; Li, D.; Bai, T.; Huang, C. Radiometric Cross-Calibration of GF-4 PMS Sensor Based on Assimilation of Landsat-8 OLI Images. Remote Sens. 2017, 9, 811. [Google Scholar] [CrossRef]
- De Rosa, P.; Fredduzzi, A.; Cencetti, C. Stream Power Determination in GIS: An Index to Evaluate the Most ’Sensitive’Points of a River. Water 2019, 11, 1145. [Google Scholar] [CrossRef]
- World Bank Group. Afghanistan-Irrigation Restoration and Development (IRD) Project. Report No: 58454-AF. Available online: https://documents1.worldbank.org/curated/en/598691468198013735/pdf/584540PJPR0P121OFFICIAL0USE0ONLY191.pdf (accessed on 10 September 2023).
- Xu, S.; Ehlers, M. Hyperspectral Image Sharpening Based on Ehlers Fusion. Int. Arch. Photogramm. Remote Sens. Spat. Inf. Sci. 2017, 42, 941–947. [Google Scholar] [CrossRef]
- Ehlers, M.; Klonus, S.; Åstrand, P.J.; Rosso, P. Multi-sensor image fusion for pansharpening in remote sensing. Int. J. Image Data Fusion 2010, 1, 25–45. [Google Scholar] [CrossRef]
- Chachondhia, P.; Shakya, A.; Kumar, G. Performance evaluation of machine learning algorithms using optical and microwave data for LULC classification. Remote Sens. Appl. Soc. Environ. 2021, 23, 100599. [Google Scholar] [CrossRef]
- Yin, G.; Mariethoz, G.; McCabe, M. Gap-Filling of Landsat 7 Imagery Using the Direct Sampling Method. Remote Sens. 2017, 9, 12. [Google Scholar] [CrossRef]
- Himmelstoss, E.A.; Henderson, R.E.; Kratzmann, M.G.; Farris, A.S. Digital Shoreline Analysis System (DSAS) Version 5.0 User Guide; Report 2018-1179; USGS: Reston, VA, USA, 2018. Available online: http://pubs.er.usgs.gov/publication/ofr20181179 (accessed on 10 September 2023).
- Akbary, S.M. A Glance to Vulnerable Areas in Panj River in Takhar Province: Internal Report; Directorate of the Taliqan River Basin, Ministry of Water Resource Management: Kabul, Afghanistan, 2020. [Google Scholar]
- Hersbach, H.; Bell, B.; Berrisford, P.; Hirahara, S.; Horányi, A.; Muñoz-Sabater, J.; Nicolas, J.; Peubey, C.; Radu, R.; Schepers, D.; et al. The ERA5 global reanalysis. Q. J. R. Meteorol. Soc. 2020, 146, 1999–2049. [Google Scholar] [CrossRef]
- Kraatz, S.; Khanbilvardi, R.; Romanov, P. A Comparison of MODIS/VIIRS Cloud Masks over Ice-Bearing River: On Achieving Consistent Cloud Masking and Improved River Ice Mapping. Remote Sens. 2017, 9, 229. [Google Scholar] [CrossRef]
- Nain, S.; Beniwal, B.S.; Dalal, R.P.S.; Sheoran, S. Effect of pinching and spacing on growth, flowering and yield of African marigold (Tagetes erecta L.) under semi-arid conditions of Haryana. J. Appl. Nat. Sci. 2017, 9, 2073–2078. [Google Scholar] [CrossRef]
- CRED. Emergency Events Database. Centre for Research on Epidemology of Disasters (CRED), UC Louvain. Available online: https://cred.be/projects/EM-DAT (accessed on 22 January 2021).
- Lucianetti, G.; Penna, D.; Mastrorillo, L.; Mazza, R. The Role of Snowmelt on the Spatio-Temporal Variability of Spring Recharge in a Dolomitic Mountain Group, Italian Alps. Water 2020, 12, 2256. [Google Scholar] [CrossRef]
- López-Moreno, J.I.; García-Ruiz, J.M. Influence of snow accumulation and snowmelt on streamflow in the central Spanish Pyrenees/Influence de l’accumulation et de la fonte de la neige sur les écoulements dans les Pyrénées centrales espagnoles. Hydrol. Sci. J. 2009, 49, 478. [Google Scholar] [CrossRef]
- Fassnacht, S.R.; Records, R.M. Large snowmelt versus rainfall events in the mountains. J. Geophys. Res. Atmos. 2015, 120, 2375–2381. [Google Scholar] [CrossRef]
- Humdata-UNOCHA. The Humanitarian Data Exchange. Available online: https://data.humdata.org/ (accessed on 22 January 2021).
- Akhundzadah, N.A.; Soltani, S.; Aich, V. Impacts of Climate Change on the Water Resources of the Kunduz River Basin, Afghanistan. Climate 2020, 8, 102. [Google Scholar] [CrossRef]


| S. No | ERA 5 Reanalysis Variable Names | Units | Description | Correlation Coefficient |
|---|---|---|---|---|
| 1 | rsn | kg m−3 | Snow density | 0.99 |
| 2 | sd | m of water equivalent | Snow Water Equivalent | 0.99 |
| 3 | sde | m | Snow depth | 0.99 |
| 4 | sf | m of water equivalent | Snowfall | 0.69 |
| 5 | smlt | m of water equivalent | Snowmelt | 0.92 |
| 6 | ssro | m | Sub-surface runoff | 0.90 |
| 7 | sro | m | Surface runoff | 0.83 |
| 8 | ro | m | Runoff | 0.84 |
| 9 | tp | m | Total precipitation | 0.81 |
| Comparison | Correlation Coefficient (R) | Coefficient of Determination (R2) | Coefficient of Determination (Adj R2) | Root Mean Square Error (RMSE) |
|---|---|---|---|---|
| w vs. Qp | 0.8385 | 0.7031 | 0.6819 | 335.4 |
| Ae vs. Iq | 0.9241 | 0.8539 | 0.8435 | 1.761 |
| Ae vs. Ω | 0.9241 | 0.8539 | 0.8435 | 44.6 |
| Ae vs. ω | 0.9241 | 0.8539 | 0.8435 | 1.761 |
Disclaimer/Publisher’s Note: The statements, opinions and data contained in all publications are solely those of the individual author(s) and contributor(s) and not of MDPI and/or the editor(s). MDPI and/or the editor(s) disclaim responsibility for any injury to people or property resulting from any ideas, methods, instructions or products referred to in the content. |
© 2023 by the authors. Licensee MDPI, Basel, Switzerland. This article is an open access article distributed under the terms and conditions of the Creative Commons Attribution (CC BY) license (https://creativecommons.org/licenses/by/4.0/).
Share and Cite
Mahmoodzada, A.B.; Varade, D.; Shimada, S.; Okazawa, H.; Aryan, S.; Gulab, G.; Mustafa, A.E.-Z.M.A.; Rizwana, H.; Ahlawat, Y.K.; Elansary, H.O. Quantification of Amu River Riverbank Erosion in Balkh Province of Afghanistan during 2004–2020. Land 2023, 12, 1890. https://doi.org/10.3390/land12101890
Mahmoodzada AB, Varade D, Shimada S, Okazawa H, Aryan S, Gulab G, Mustafa AE-ZMA, Rizwana H, Ahlawat YK, Elansary HO. Quantification of Amu River Riverbank Erosion in Balkh Province of Afghanistan during 2004–2020. Land. 2023; 12(10):1890. https://doi.org/10.3390/land12101890
Chicago/Turabian StyleMahmoodzada, Abdul Basir, Divyesh Varade, Sawahiko Shimada, Hiromu Okazawa, Shafiqullah Aryan, Gulbuddin Gulab, Abd El-Zaher M. A. Mustafa, Humaira Rizwana, Yogesh K. Ahlawat, and Hosam O. Elansary. 2023. "Quantification of Amu River Riverbank Erosion in Balkh Province of Afghanistan during 2004–2020" Land 12, no. 10: 1890. https://doi.org/10.3390/land12101890
APA StyleMahmoodzada, A. B., Varade, D., Shimada, S., Okazawa, H., Aryan, S., Gulab, G., Mustafa, A. E.-Z. M. A., Rizwana, H., Ahlawat, Y. K., & Elansary, H. O. (2023). Quantification of Amu River Riverbank Erosion in Balkh Province of Afghanistan during 2004–2020. Land, 12(10), 1890. https://doi.org/10.3390/land12101890