Article

Spatiotemporal Patterns and the Development Path of Land-Use Carbon Emissions from a Low-Carbon Perspective: A Case Study of Guizhou Province

1
School of Humanities and Law, Jiangsu Ocean University, Lianyungang 222005, China
2
School of Geography and Ocean Science, Nanjing University, Nanjing 210023, China
*
Author to whom correspondence should be addressed.
Land 2023, 12(10), 1875; https://doi.org/10.3390/land12101875
Submission received: 30 August 2023 / Revised: 30 September 2023 / Accepted: 2 October 2023 / Published: 5 October 2023
(This article belongs to the Special Issue Land Use Sustainability from the Viewpoint of Carbon Emission)

Abstract

:
Land-use change and regional carbon emissions are closely related. In-depth research on the mechanism of land-use carbon emissions is conducive for clarifying the direction and focus of future low-carbon construction work. Carbon emissions calculation models were used to calculate total carbon emissions in Guizhou Province and reveal their spatiotemporal distribution characteristics. The results were as follows. (1) The land-use structure of Guizhou Province underwent a significant change from 2009 to 2019, in particular with regard to cultivated and construction land. (2) Land-use carbon emissions in Guizhou Province were increasing annually, and this was related to urbanization, population density, and energy consumption. (3) There were spatial differences in the regional distribution of carbon emissions, their intensity, and carbon emissions per capita in Guizhou Province. Additionally, there were spatial clusters of cities with high or low emissions intensity. Therefore, there is scope for constructive proposals concerning sustainable land use and development, such as controlling the total amount and intensity of construction land, optimizing the structure of land use, managing the rational distribution of the population, constantly advancing the optimization of industrial structure, and improving the relevant policies.

1. Introduction

The phenomenon of global climate change has attracted sustained attention since the beginning of the 21st century. The Working Group I Report of the Sixth Assessment Report of the Intergovernmental Panel on Climate Change (IPCC) highlighted that the average global surface temperature reached 1.09 °C above the 1850–1900 average in 2011–2020 [1]. It is projected that global warming may surpass 1.5 °C within the next two decades. In contemporary times, climate change has emerged as a crucial area of academic inquiry [2,3]. One of the primary drivers of climate warming is the persistent escalation of carbon dioxide emissions [4]. The fundamental role of land in supporting human production and life is underscored by the fact that one-third of carbon emissions are attributable to land use [5]. Research has demonstrated that human activities, including the utilization of nonrenewable land resources and the generation of energy emissions, have contributed to an ecological imbalance, irregular weather patterns, and an escalation in climate extremes that have profound implications for human production and livelihoods [6,7]. The mechanism underlying greenhouse gas emissions is intricate and multifaceted [8]. Land-use activities increase the uncertainty in the emissions process, and this uncertainty has gradually become the focus and challenge of many scholars around the world for research on global warming. Since the 21st century, with the rapid advancement of industrialization, China has become a manufacturing center. The per capita GDP and the output value of the three industrial structures have grown rapidly, and urbanization has also developed rapidly. By the end of 2019, the urbanization rate in China had exceeded 60%. The development of urbanization is accompanied by the consumption of land, energy, and other resources and the deterioration of the environment. Resource development is becoming more and more important [9]. As a consequence, if climate change is allowed to progress in an uncontrolled way, it will have a long-lasting effect and trigger a vicious cycle involving climate change and ecosystems [10,11].
At the current technological level of development, human beings must use energy and land resources rationally in order to alleviate the adverse effects of climate change in an energy-efficient way and achieve a sustainable and balanced development of human beings and ecosystems [12]. Globally, nations are turning their attention to more than just economic growth [13]. As of January 2021, the European Union and 27 countries have committed to meeting “zero carbon” or “carbon neutral” goals by mid-21st century. Construction for the urbanization of China entered a new phase of comprehensive reform with the proposals of the 13th Five-Year Plan [14]. The idea of a low-carbon economy has not only provided new meaning to sound and rapid economic growth but has also paved the way for the responsible use of land. The future of humanity is associated with low-carbon development. As the greatest energy consumer and carbon emitter worldwide, it is important that China places a high priority on the development of low-carbon energy sources. According to the China Emission Accounts and Datasets (CEADs), Chinese carbon emissions have been rising rapidly since the 21st century, reaching 5.9 billion tons in 2007, surpassing those of the United States for the first time to become the first in the world in terms of carbon emissions [15]. After 2014, with the change in energy consumption pattern, the growth rate of carbon emissions slowed down and maintained a fluctuating rise. Achieving high-quality socioeconomic growth is a prerequisite, according to the 14th Five-Year Plan, and to achieve this, it is necessary to encourage green circular development and accelerate the acquisition of low-carbon skills [16,17]. The goal of the “dual carbon” strategy is to reduce emissions on the one hand and use technology to absorb carbon emissions on the other. It encompasses a number of business types, including energy, industry, transportation, and urban–rural construction, in order to satisfy the needs of the “1 + N” policy framework [18]. The “dual carbon” strategy is both an opportunity and a challenge to Chinese industrialization. This will increase the cost of environmental protection for manufacturing, construction, and other energy-intensive industrial enterprises. At the same time, it can speed up the process of replacing fossil energy with electricity, promote the upgrading of industrial structure, and adjust the proportion of heavy industry and light industry.
Various regions have achieved different levels of economic development. Guizhou Province has excellent economic potential and a wealth of resources [19]. Optimization of land-use structure and carbon emissions in the region is made possible by research on land-use carbon emissions in the context of urbanization [20,21,22]. Research findings can also enhance regional economic benefits, thereby improving the quality of life of local residents and ultimately achieving the goal of ecological environmental protection. In this paper, the general goal is to analyze the spatiotemporal evolution characteristics of land-use carbon emissions in Guizhou Province from 2009 to 2019, and to put forward thoughts and suggestions for low-carbon development in Guizhou Province and other regions of China. The specific goals of this paper are as follows: (1) to analyze the characteristics of changes in land-use structure; (2) to explore changes in land-use carbon emissions and their influencing factors; and (3) to characterize the spatial evolution characteristics of land-use carbon emissions. The research results provide rigorous and scientific data to support the ministry of natural resources and government departments in their work in relation to land planning and formulating regional carbon emissions reduction policies. It also provides a reference for land-use research methods from a low-carbon perspective.

2. Overview of the Study Area and Data Sources

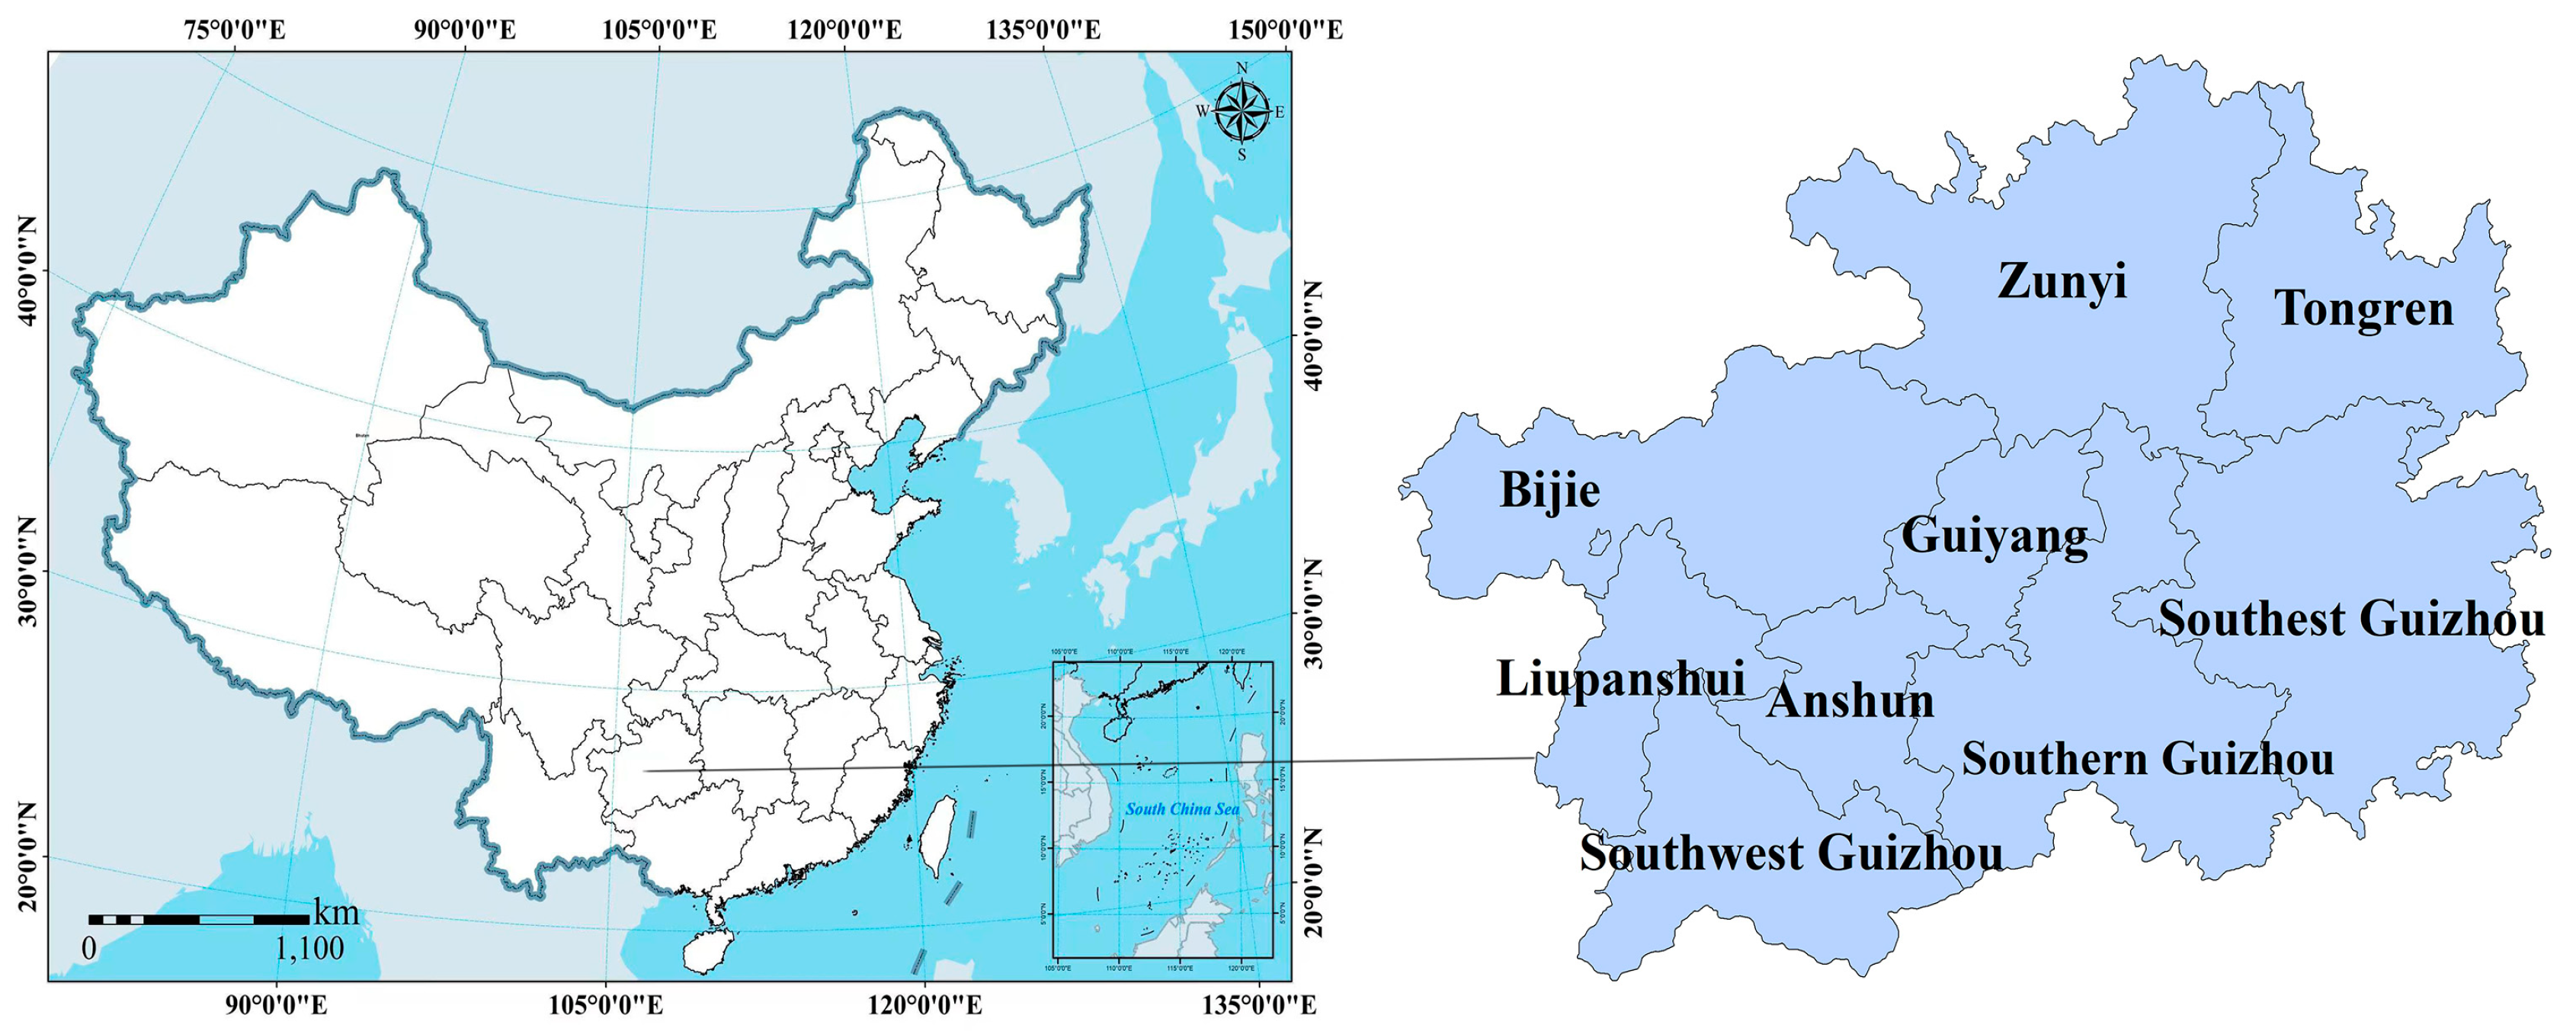
2.1. Overview of the Study Area

Guizhou Province is located in Southwest China (103°36′–109°35′ E, 24°37′–29°13′ N), adjacent to Chongqing, Sichuan, Hunan, Yunnan, and Guangxi. Guizhou Province is in charge of three autonomous prefectures as well as six prefecture-level cities. It serves as the transportation hub for the southwest region and an important part of the Yangtze River Economic Belt [23]. Its total area is 176,200 km2, of which more than 50% is covered by forest, and the majority of the terrain is plateaus and mountains. With rapid changes in patterns of land use and close regional economic ties, Guizhou Province is undergoing a period of rapid urbanization and industrialization. The average regional GDP experienced strong growth from 2009 to 2019, growing annually to CNY 1676.93 billion. The scope and geographical location of the research area are shown in Figure 1.

2.2. Data Sources

Data on carbon and coal emissions standards were obtained from the China Energy Statistical Yearbook and the Guidelines for Provincial Greenhouse Gas Inventories from 1986 to 2019. The land-use data used in this paper were mainly obtained from Geographic Data Sharing infrastructure, Resource and Environment Science and Data Center (http://www.resdc.cn, accessed on 12 September 2023), which were processed and validated. And the land-use classification system was established according to the first-level classification of the Land Use Cover Classification System of the Chinese Academy of Sciences. The land-use classification system has six categories: cultivated land, forest land, grassland, water area, construction land, and unused land. The data resolution was 30 m. The socioeconomic data were obtained from the Statistical Yearbook of Guizhou Province from 2009 to 2019.

3. Research Methods

3.1. Dynamic Model of Land Use

The land-use change rate is mainly reflected by single land-use dynamic degree and comprehensive land-use dynamic degree. The single land-use type dynamic degree represents the change in the quantity of a certain land-use type in a research area within a certain time frame. Its formula is as follows:
K = U b U a U a × 1 T × 100 % ,
where K represents the dynamic degree of single land use within the research period; U a represents the quantity of a certain land-use type at the beginning of the period; U b represents the quantity of a certain land-use type at the end of the period; and T represents the research period.
The dynamic degree of comprehensive land use reflects the overall change in land use in the research area within a certain period, and its formula is as follows:
L C = i = 1 n L U i j 2 i = 1 n L U i × 1 T × 100 % ,
where L C represents the dynamic degree of comprehensive land use within the research period; L U i represents the initial area of a certain land type; L U i j represents the area of other land types except for class i land type at the end of the period; i represents the research period; and the value of L C represents the overall change rate of land use in the research area.

3.2. Land-Use Carbon Emissions Calculation Model

Land-use carbon emissions can be divided into direct and indirect carbon emissions. The former mainly refers to carbon emissions from different types of land use, and the latter represents all carbon emissions generated by anthropogenic fossil energy. The direct carbon emissions coefficient method was used to calculate the carbon emissions from cultivated land, forest land, grassland, water area, and unused land [24,25]. The carbon emissions coefficient was based on previous research results and combined with the actual situation of the research area in Guizhou. The carbon emissions coefficients are shown in Table 1. The formula for calculating direct carbon emissions is as follows:
E k = e i = T i · δ i ,
where E K represents the total direct carbon emissions; e i represents the carbon emissions of a certain land-use type; T i represents the area of a certain land-use type; and δ i represents the carbon emissions coefficient of a certain land-use type.
The carbon emissions for construction land mainly relate to energy production and consumption, which can be calculated using the indirect estimation method. Because of data limitations, the energy sources selected in this study were raw coal, coal, coke, cleaned coal, crude oil, gasoline, kerosene, diesel, liquefied petroleum gas, fuel oil, natural gas, and electric power [26]. All energy consumption types were converted to standard coal in the calculation. The energy coefficients were selected with reference to previous studies, as shown in Table 2. The calculation formula is as follows:
E c = e c i = E n i · θ i · f i ,
where E c represents the carbon emissions of construction land; e c i represents the carbon emissions of various energy sources; E n i represents the consumption relating to various energy sources in normal daily life; θ i represents the coefficient for the conversion of the various energy types to standard coal; and f i represents the carbon emissions coefficient of the various energy sources.
To summarize, the formula for calculating total land-use carbon emissions is as follows:
E = E k + E c ,
where E represents the total land-use carbon emissions; E K represents the total direct carbon emissions, namely, carbon emissions of cultivated land, forest land, grassland, water area, and unused land; and E C represents the total indirect carbon emissions, namely, carbon emissions of construction land.
Carbon emissions intensity refers to the carbon emissions per unit of GDP, reflecting the level of low-carbon economic development in the region. The calculation formula is as follows:
C I i = C E i G D P i , i = 1 , 2 , 3 9 ,
where C I represents energy consumption carbon emissions intensity; C E represents the total carbon emissions; and G D P represents the gross domestic product of the study region.
Carbon emission per capita refers to the ratio of total carbon emissions to the total population. To a certain extent, it reflects the level of carbon emissions of different people in the field of life. The calculation formula is as follows:
E p i = C E i R P i , i = 1 , 2 , 3 9 ,
where E p i represents carbon emissions per capita; C E i represents the total carbon emissions; and R P i represents the number of permanent residents.

4. Results

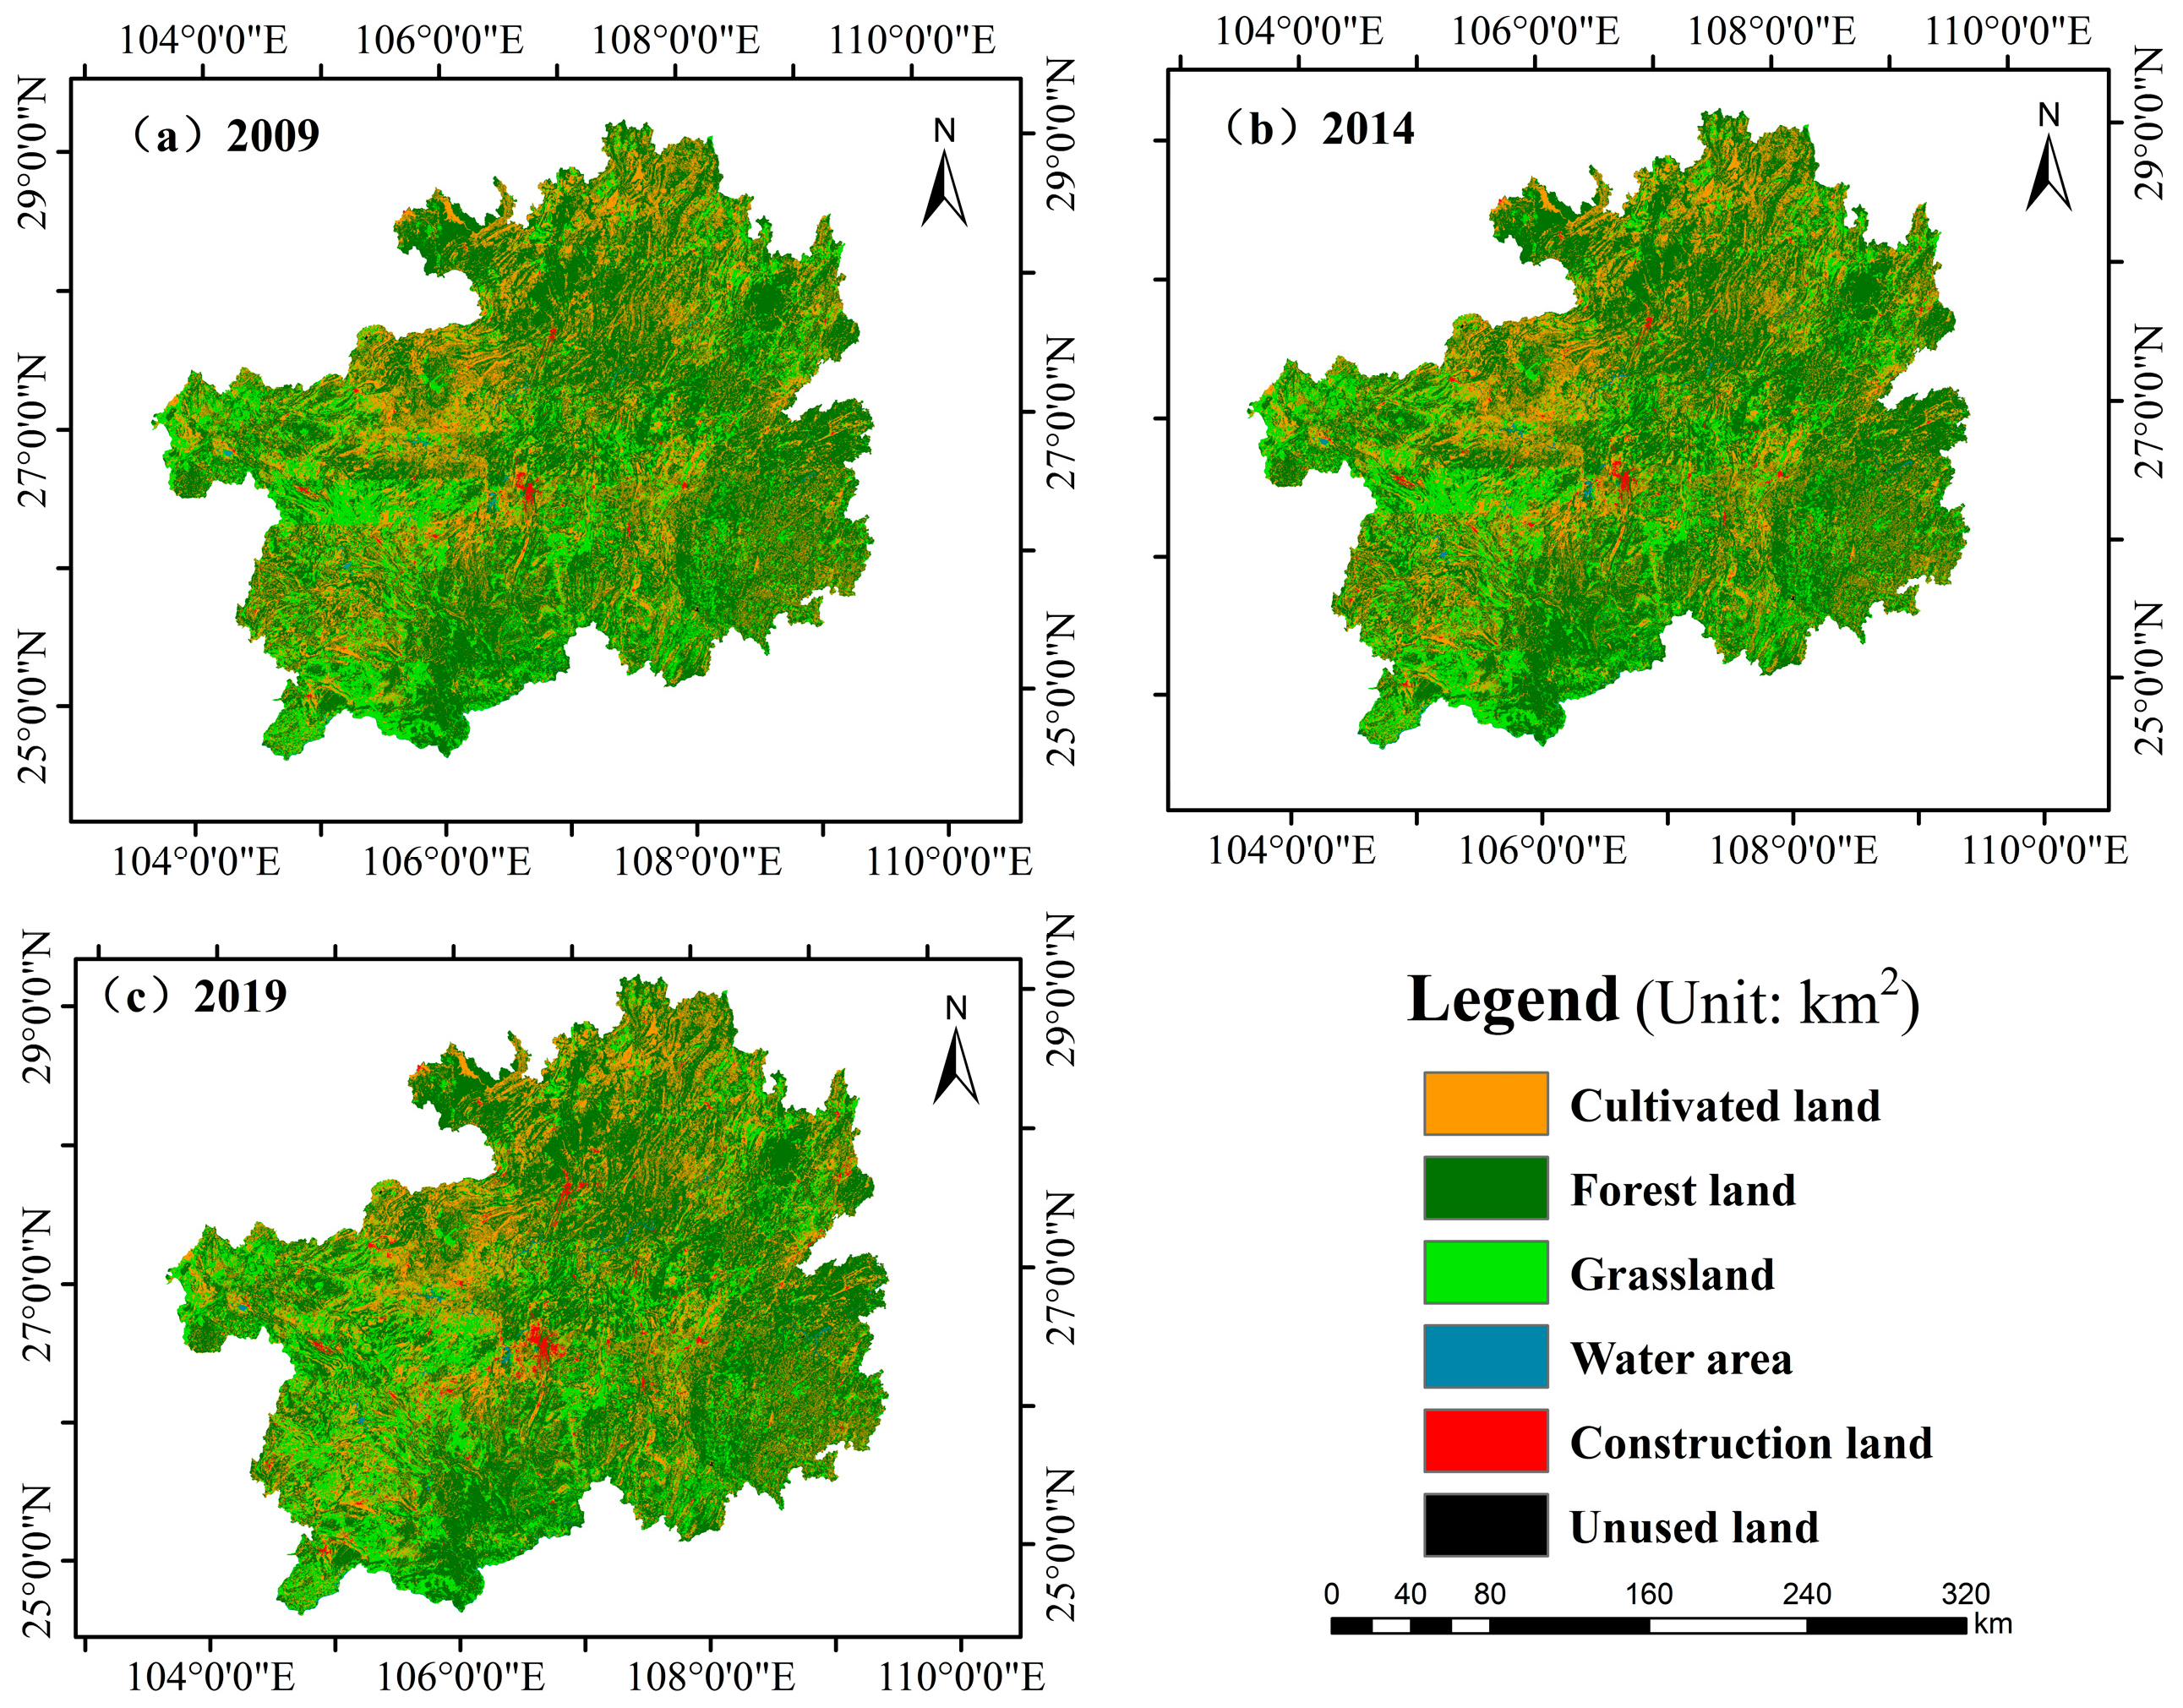
4.1. Spatiotemporal Evolution of Land Use

Land-use classification maps for three time periods were created: 2009, 2014, and 2019 (Figure 2). The statistical function was utilized to determine the areas of the various regions in these three years. Finally, the areas and proportions of the different regions were obtained (Table 3).
Based on the findings presented in Table 3 and Figure 2, it can be inferred that forest land is the most extensive land type in Guizhou Province, encompassing over 50% of the total land area. This can be attributed to the predominantly mountainous and hilly terrain of the region, which is characteristic of the geological mountainous area in the karst region [27,28]. In the past decade, both forest land and grassland exhibited a declining trend, with forest land experiencing a significant reduction of 2413.43 km2. As the second largest land type, the proportion of cultivated land in the land area showed a decreasing trend year-over-year. This was because the rapid rise in industrialization caused cultivable land to be increasingly taken over by construction land. Additionally, there has been a positive trend in recent years in the reversal of farms to grassland. According to the data, there was a general growth in the grassland area of Guizhou Province, which increased from 29,586.7 km2 in 2009 to 31,327.96 km2 in 2019. Significant change was seen in construction land, with an area change rate of 146.90% and a total increase of 1284.71 km2. Despite the tiny amount of construction land, the intensity of the land use was considerable. The population was constantly growing against a societal backdrop of improving living conditions. As more rural residents relocated to cities, there was an increase in demand for development land. Although the proportion was very small and had little impact on the overall land-use structure, there was an increase in both the water area and unused land area.
The single land-use dynamic degree and the comprehensive land-use dynamic degree for the three time periods of 2009 to 2014, 2014 to 2019, and 2009 to 2019 were estimated using the dynamic degree land-use model (Table 4).
Table 4 shows that the shift in land use in Guizhou Province exhibited different features at various stages. Cultivated land, forest land, and grassland all experienced a decline from 2009 to 2014; however, water area, construction land, and unused land all increased. With a land-use dynamic degree of 10.24%, construction land experienced the fastest growth, followed by unused land at 2.04%. There was an obvious decrease in cultivated land, and the dynamic degree of land use was −0.13%. Construction land continued to experience the greatest change in the area from 2014 to 2019, followed by water area with a land-use dynamic degree of 9.97%. In contrast to the previous period, grassland increased and unused land decreased. Cultivated land and forest land decreased significantly, and the dynamic degree of comprehensive land use increased by 0.60%. This indicates that the rural population gradually started to migrate to the city, that the pace of change in construction land accelerated, and that the area belonging to other land types which then converted to construction land increased significantly. On the whole, the comprehensive land-use change in Guizhou Province from 2009 to 2019 was obvious, and the comprehensive dynamic degree reached 0.64%. Because of the impact of economic development, construction land continued to expand, with a dynamic degree of land-use change of 29.38%. Cultivated land and forest land continued to decrease, with land-use dynamics of −0.40% and −0.51%, respectively, whereas grassland and unused land showed an overall increasing trend.

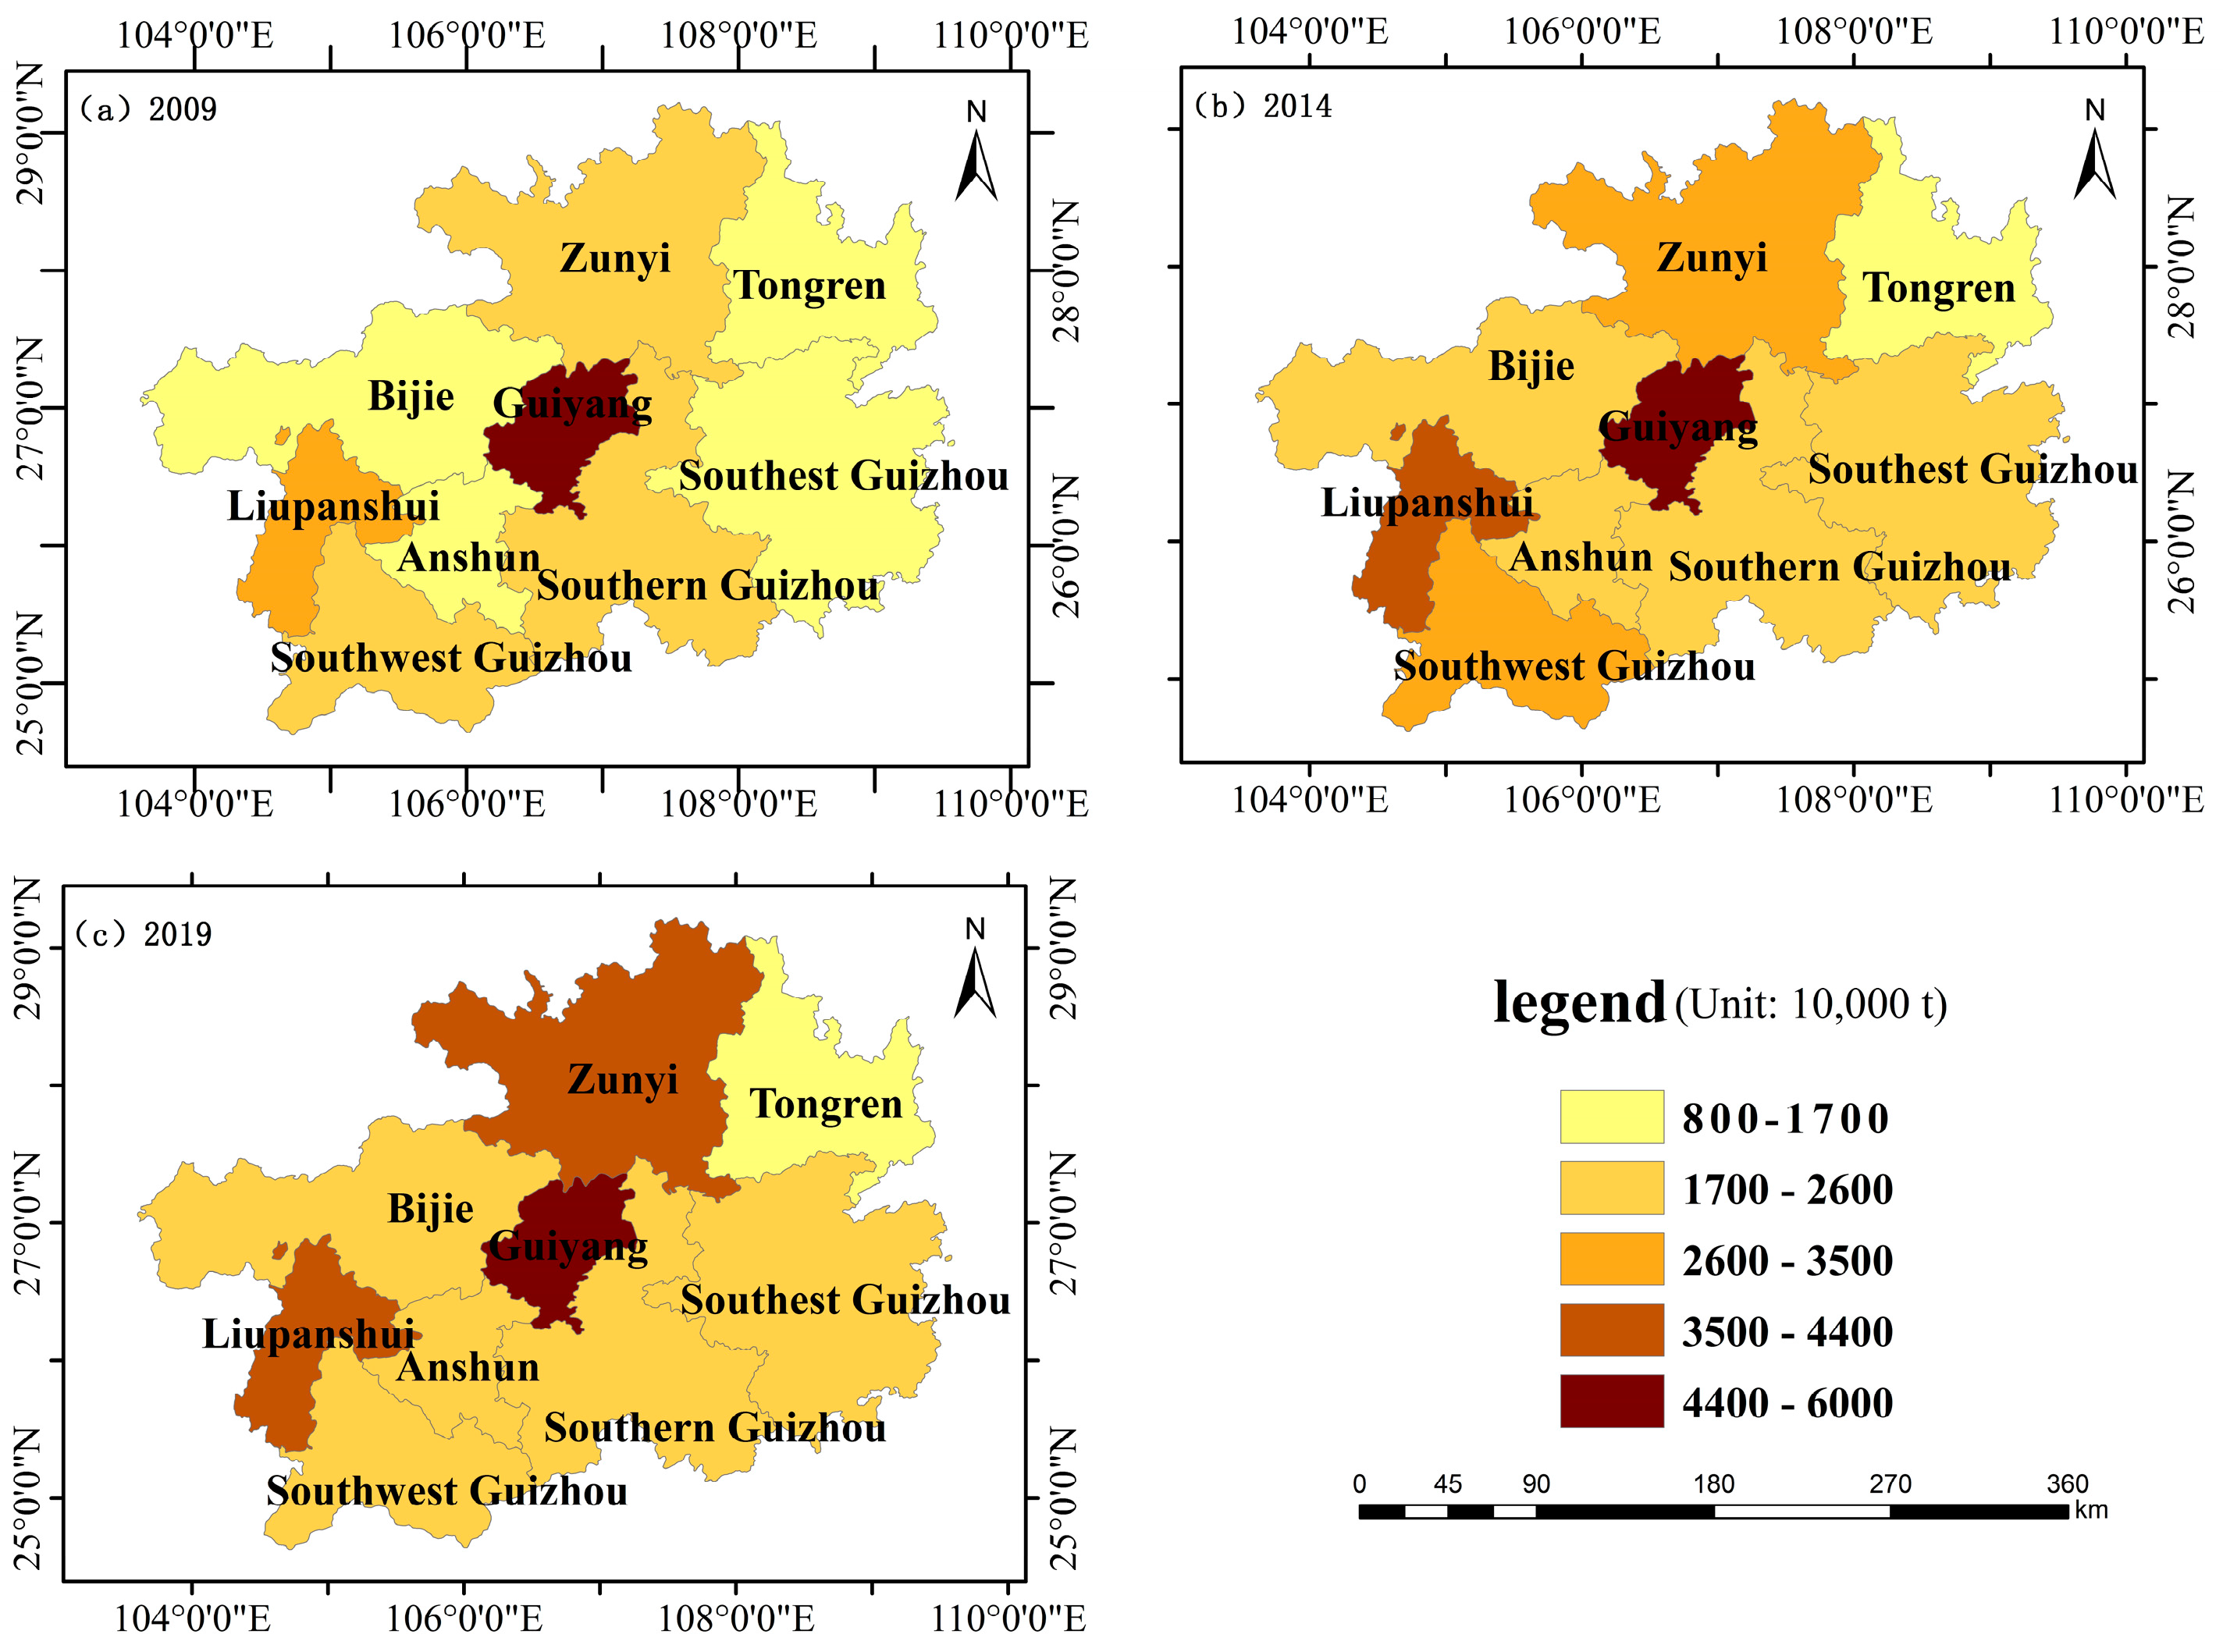
4.2. Spatiotemporal Pattern Analysis of Land-Use Carbon Emissions

The total carbon emissions, total carbon absorption, and net carbon emissions for Guizhou Province were computed in accordance with the land-use carbon emissions calculation model (Table 5, Figure 3).
As can be seen from Table 5, there was an increase in the net carbon emissions of Guizhou Province from 2009 to 2019 with an average annual growth rate of 4.64%, from 55.923 million tons to 84.177 million tons. The overall amount of carbon absorbed barely changed, and the increase in total carbon emissions was mainly responsible for the rise in net carbon emissions. Guizhou Province is in the stage of urbanization development, and industry accounts for a large proportion of economic activity, leading to a rapid growth in energy consumption. In addition, carbon emissions from construction land accounted for more than 96% of the total carbon emissions and maintained a trend of continuous growth year-by-year. In contrast, carbon emissions from cultivated land decreased over time, falling from 3.39% to 2.28% of the total carbon emissions from 2009 to 2019. The reason for this phenomenon was not only the increase in construction land area but also the response of Guizhou Province to relevant national policies. This included reducing reliance on chemical fertilizers and pesticides, promoting green circular agriculture, and reducing carbon emissions from agricultural land. The carbon absorption of forest land accounted for 98% of the total carbon absorption in Guizhou Province. From 2014 to 2019, the carbon absorption of forest land decreased slightly, while that of grassland and water areas increased significantly.
The carbon emissions of the cities in Guizhou Province exhibited an upward tendency, as seen in Figure 3. The city of Guiyang had the largest carbon emissions overall, exceeding 50 million tons. This was because of its high population density and level of urbanization as the provincial capital. In addition, energy consumption in Guiyang was much higher than that in other cities. The second largest carbon emitting city was Liupanshui. As a resource-based city, Liupanshui witnessed the rapid and steady development of both the coal industry and related supporting industries, with carbon emissions reaching 34.68 million tons in 2009. According to the data, Liupanshui experienced the smallest increase in carbon emissions from 2009 to 2019, with an increase of only 1.46 million tons. Liupanshui has pursued reform via transformation and upgradation of the its economy in the context of the new era. It has started on a path of transformation and development into a growth-oriented metropolis, moving from a high level of pollution and energy consumption to a more intelligent and intensive mode. From 2009 to 2014, the carbon emissions in Liupanshui reduced by 1.09 million tons. Zunyi was the region with the fastest growth in carbon emissions, from 27.13 million tons in 2009 to 38.32 million tons in 2019, exceeding Liupanshui. In comparison with Liupanshui, Zunyi had approximately eight times the growth in carbon emissions. In terms of overall economic output, Zunyi is the second largest city in Guizhou Province. The commissioning of the “Yugui” railway represents another crucial rapid link to the coast in the west, connecting with the “Belt and Road”. It has accelerated growth of the tourism sector, ecological agriculture, and the liquor business. Additionally, carbon emissions have increased to varying degrees in other regions.
Significant variations in land-use carbon emissions result from the complexity and diversity of landform types in Guizhou Province as well as the different rates of economic development in the various cities. The spatial pattern of land-use carbon emissions was classified into five levels, with level 1 being the lowest and level 5 the greatest. The outcomes are displayed in Figure 4.
As can be seen, there was little spatial variance in the carbon emissions between the various cities in Guizhou Province from 2009 to 2014. Four low-emission zones existed in 2009; by 2014, there were just two low-emission zones remaining. In the two moderate-emission zones and one heavy-emission zone, there was no quantitative change. From the center of Guizhou Province to the outlying areas, the geographical disparity in carbon emissions gradually diminished. Zunyi and Liupanshui moved up one level from the moderate zones, and Guiyang remained the only area with heavy emissions. Bijie, Anshun, Qianxinan Prefecture, Qiandongnan Prefecture, and Qiannan Prefecture were moderate-emission zones in 2019.
Overall, a huge increase in carbon emissions from 2009 to 2019 was observed in Guizhou Province. Guiyang has always been a heavy-emissions zone, whereas Tongren has always been a low-emissions zone. In recent years, the total energy consumption has been increasing, leading to higher carbon emissions. In Tongren, there are more forests and hilly areas than other areas of Guizhou Province. As a result, Tongren’s ecology is generally stable and has a high ability to absorb carbon.

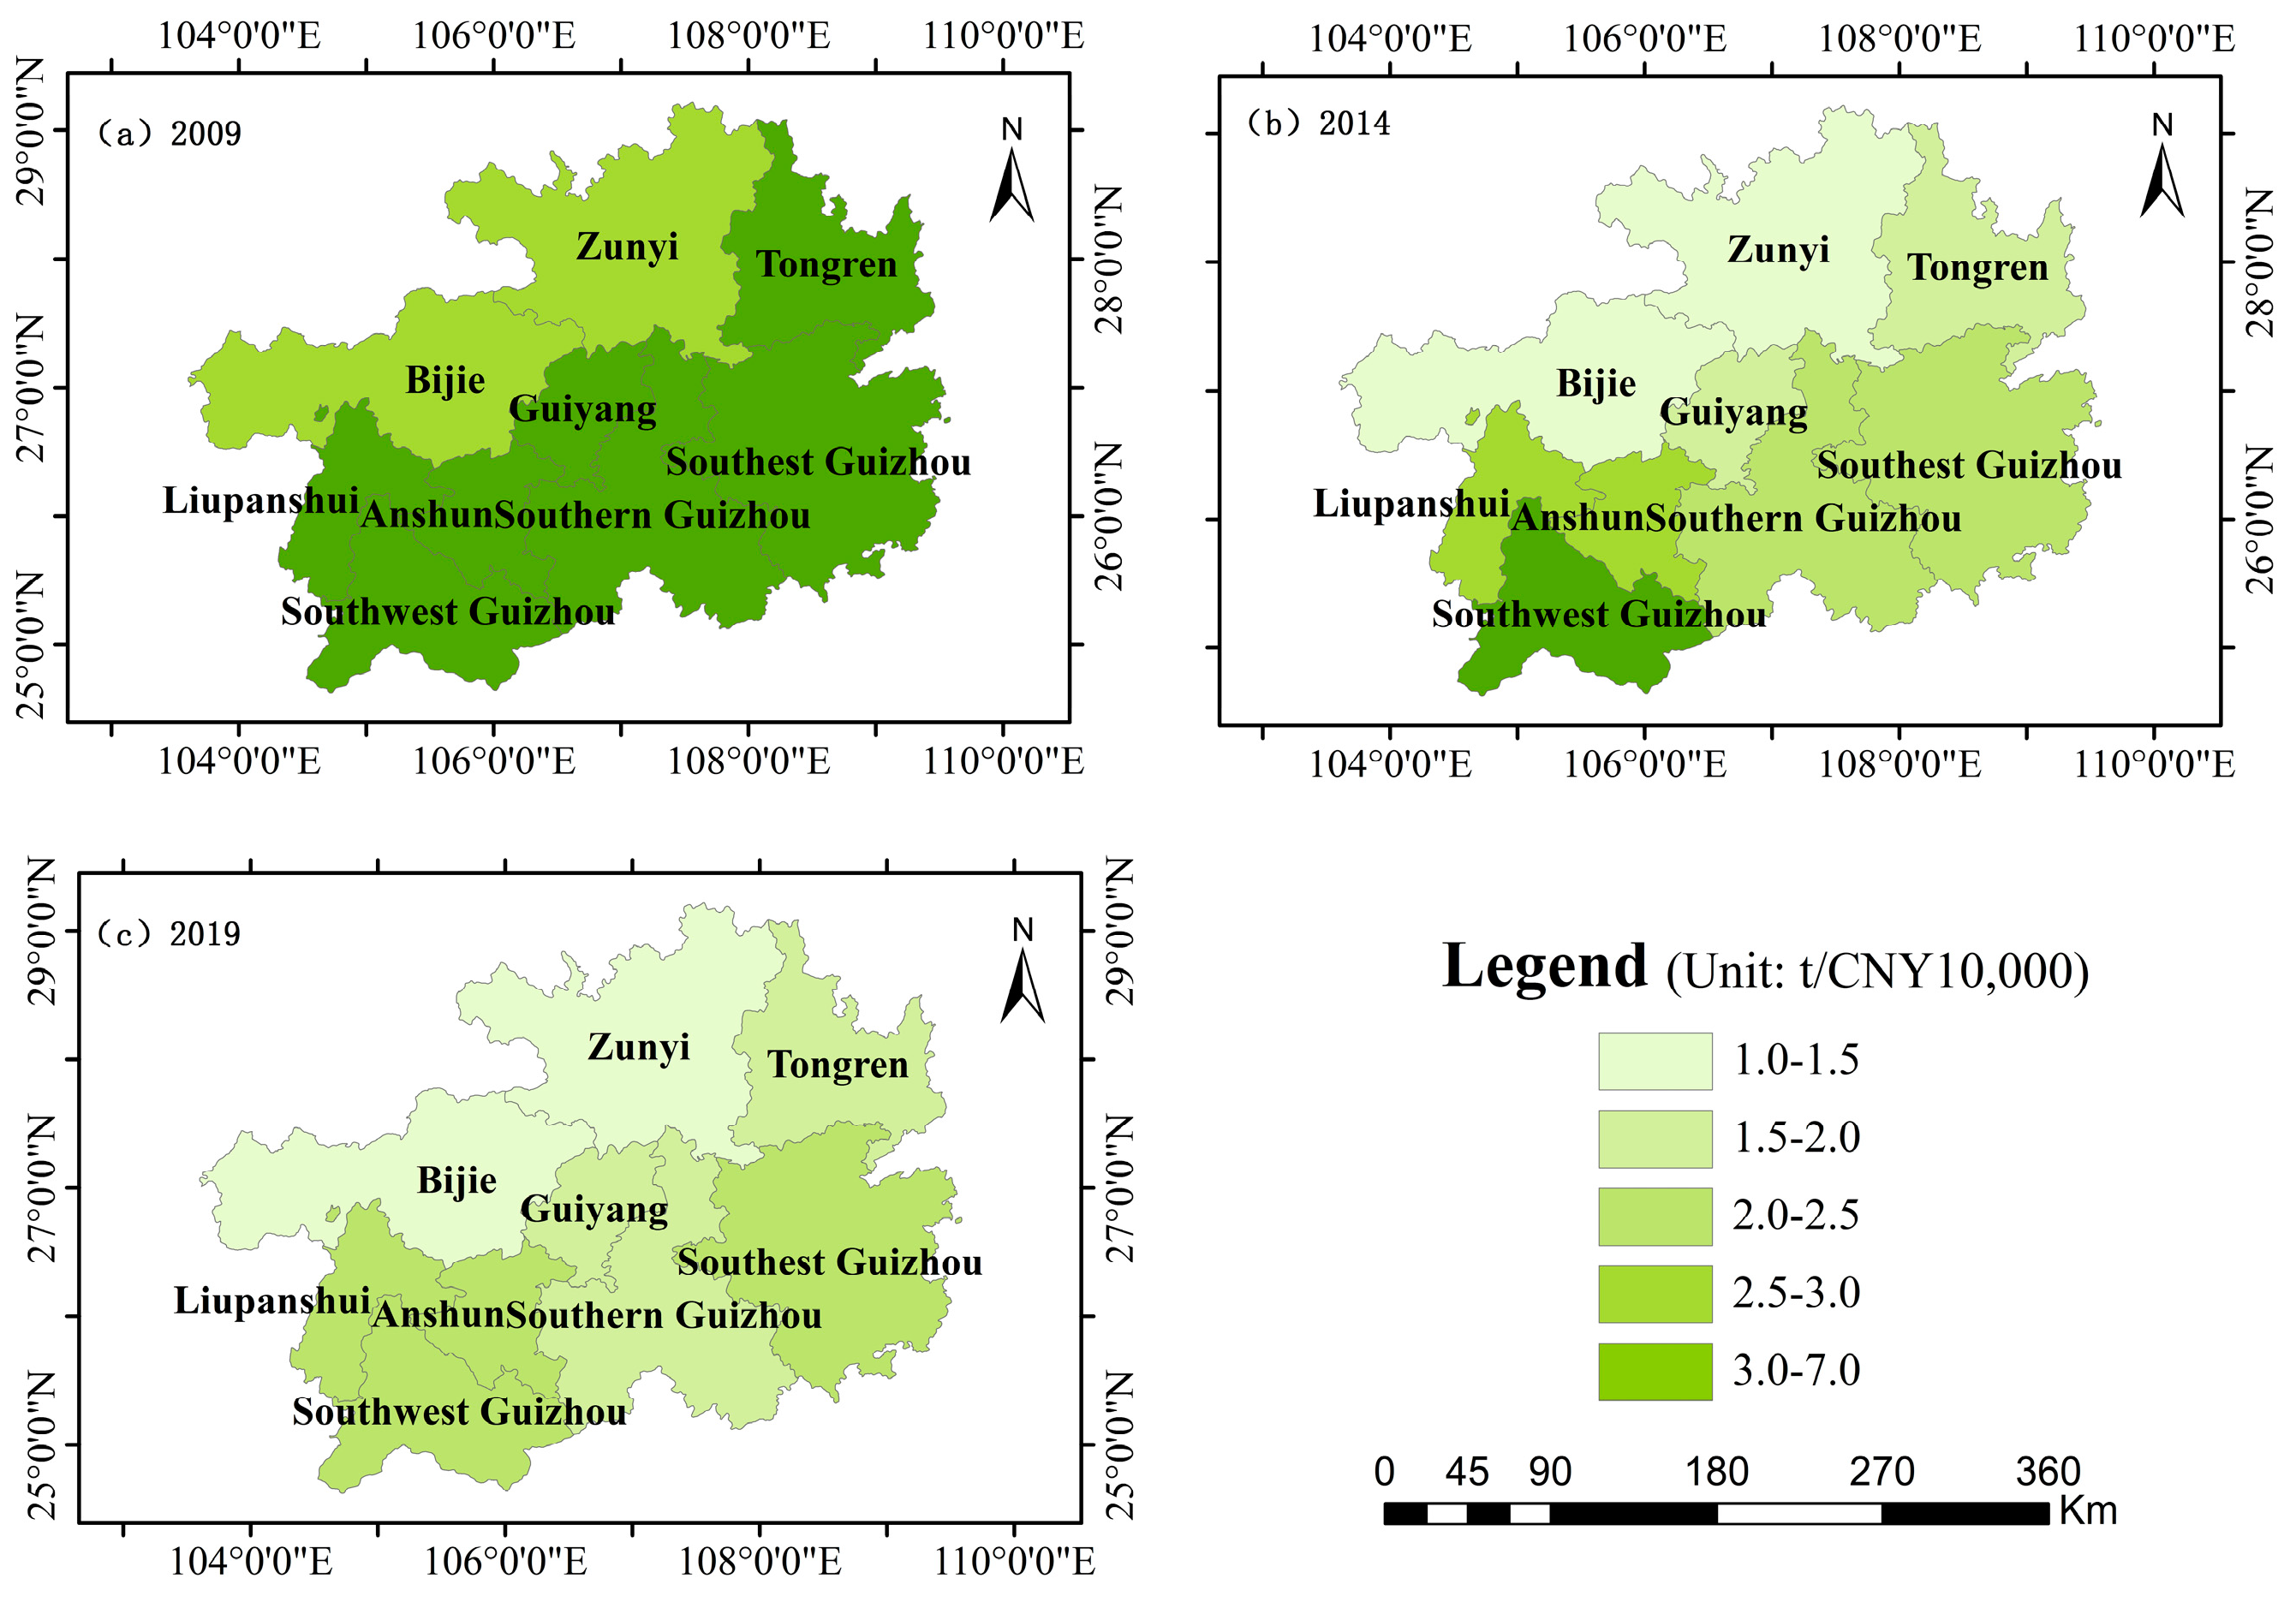
4.3. Spatiotemporal Pattern Analysis of Land-Use Carbon Emissions Intensity

Based on the carbon emissions intensity calculation model, the carbon emissions intensity of the various cities in Guizhou Province was calculated, and the results are shown in Table 6. The emissions intensity was classified and spatially mapped according to the economic development status of the cities. The results are shown in Figure 5.
It can be inferred from Table 6 that the carbon emissions intensity of the cities in Guizhou Province generally decreased year-over-year. The largest change was evident in Liupanshui, where the emissions intensity fell by 66% from 6.93 tons per 10,000 CNY in 2009 to 2.37 tons per 10,000 CNY in 2019. In that period, the GDP of Liupanshui increased by more than CNY 100 billion. Liupanshui achieved a significant reduction in carbon emissions intensity while ensuring economic growth. This indicates that the low-carbon development model adopted by Liupanshui is feasible and effective. The carbon emissions intensity decreased in Bijie and Zunyi by less than 20 tons per 10,000 CNY, which were the smallest decreases. This is because there is limited interspace for reduction and low carbon emission intensity in the two locations. After Guiyang, Zunyi and Bijie had the highest GDP in 2009 because of the advantages of their geographic locations and natural resources. Other regions with significant reductions in carbon emissions intensity included Anshun and three autonomous prefectures in the south of Guizhou Province. The carbon emissions intensity of these regions exceeded 5 tons per 10,000 CNY in 2009, of which 6.35 tons per 10,000 CNY was recorded in the Qianxinan Autonomous Prefecture. This phenomenon was attributable to the fact that rapid industrialization requires a lot of energy support during the development phase. However, in 2009, there were issues such as a lack of technological progress, an unsuitable energy structure, and an economic imbalance in urban development. As a result, with the increase in carbon emissions, carbon intensity was particularly high in 2009. During the 13th Five-Year Plan period, three autonomous prefectures in Guizhou Province implemented the “two mountains” concept to promote rural revitalization. As areas with high forest coverage and beautiful ecological environment, the three autonomous prefectures in Guizhou Province have been making effective use of the natural environment of water and mountains to develop the forest economy and rural tourism, and to conserve ecological beauty while achieving prosperity for the local population.
As shown in Figure 5, the Province of Guizhou exhibits a spatial pattern with high carbon emissions intensity in the south and low carbon emissions intensity in the north. The northern parts of Guizhou Province, including Bijie, Zunyi, Tongren, and Guiyang, generally had lower carbon emissions intensity from 2009 to 2019. Zunyi and Guiyang were two locations that were designated national low-carbon pilot cities. Guiyang determined that industry, energy, and construction were the main focus areas to control greenhouse gas emissions, and it established a low-carbon industrial system characterized by low-carbon and green initiatives, environmental protection, and recycling [29]. Zunyi implemented a low-carbon development strategy encompassing “new industrialization, green urbanization, and agricultural modernization”, promoting the early realization of “carbon peaking” through measures such as the optimization of industrial structures, the development of renewable energy, energy-saving and improving energy efficiency, and an increase in carbon sinks. High carbon emissions intensities are mainly concentrated in the south, in Liupanshui, Anshun, and Qianxinan Autonomous Prefecture, which are all relatively weak in low-carbon economic development. The spatial distribution of carbon emissions intensity is not random or discrete. Certain spatial aggregations exist between the regions with higher and lower carbon emissions intensities. The carbon emissions intensity of Guiyang decreased significantly to a level which was closer to that of the northern region. The carbon emissions intensity of Liupanshui, Anshun, and Qianxinan Autonomous Prefecture tended to be consistent. Overall, the carbon emissions intensity in Guizhou Province gradually decreased with spatial differences.

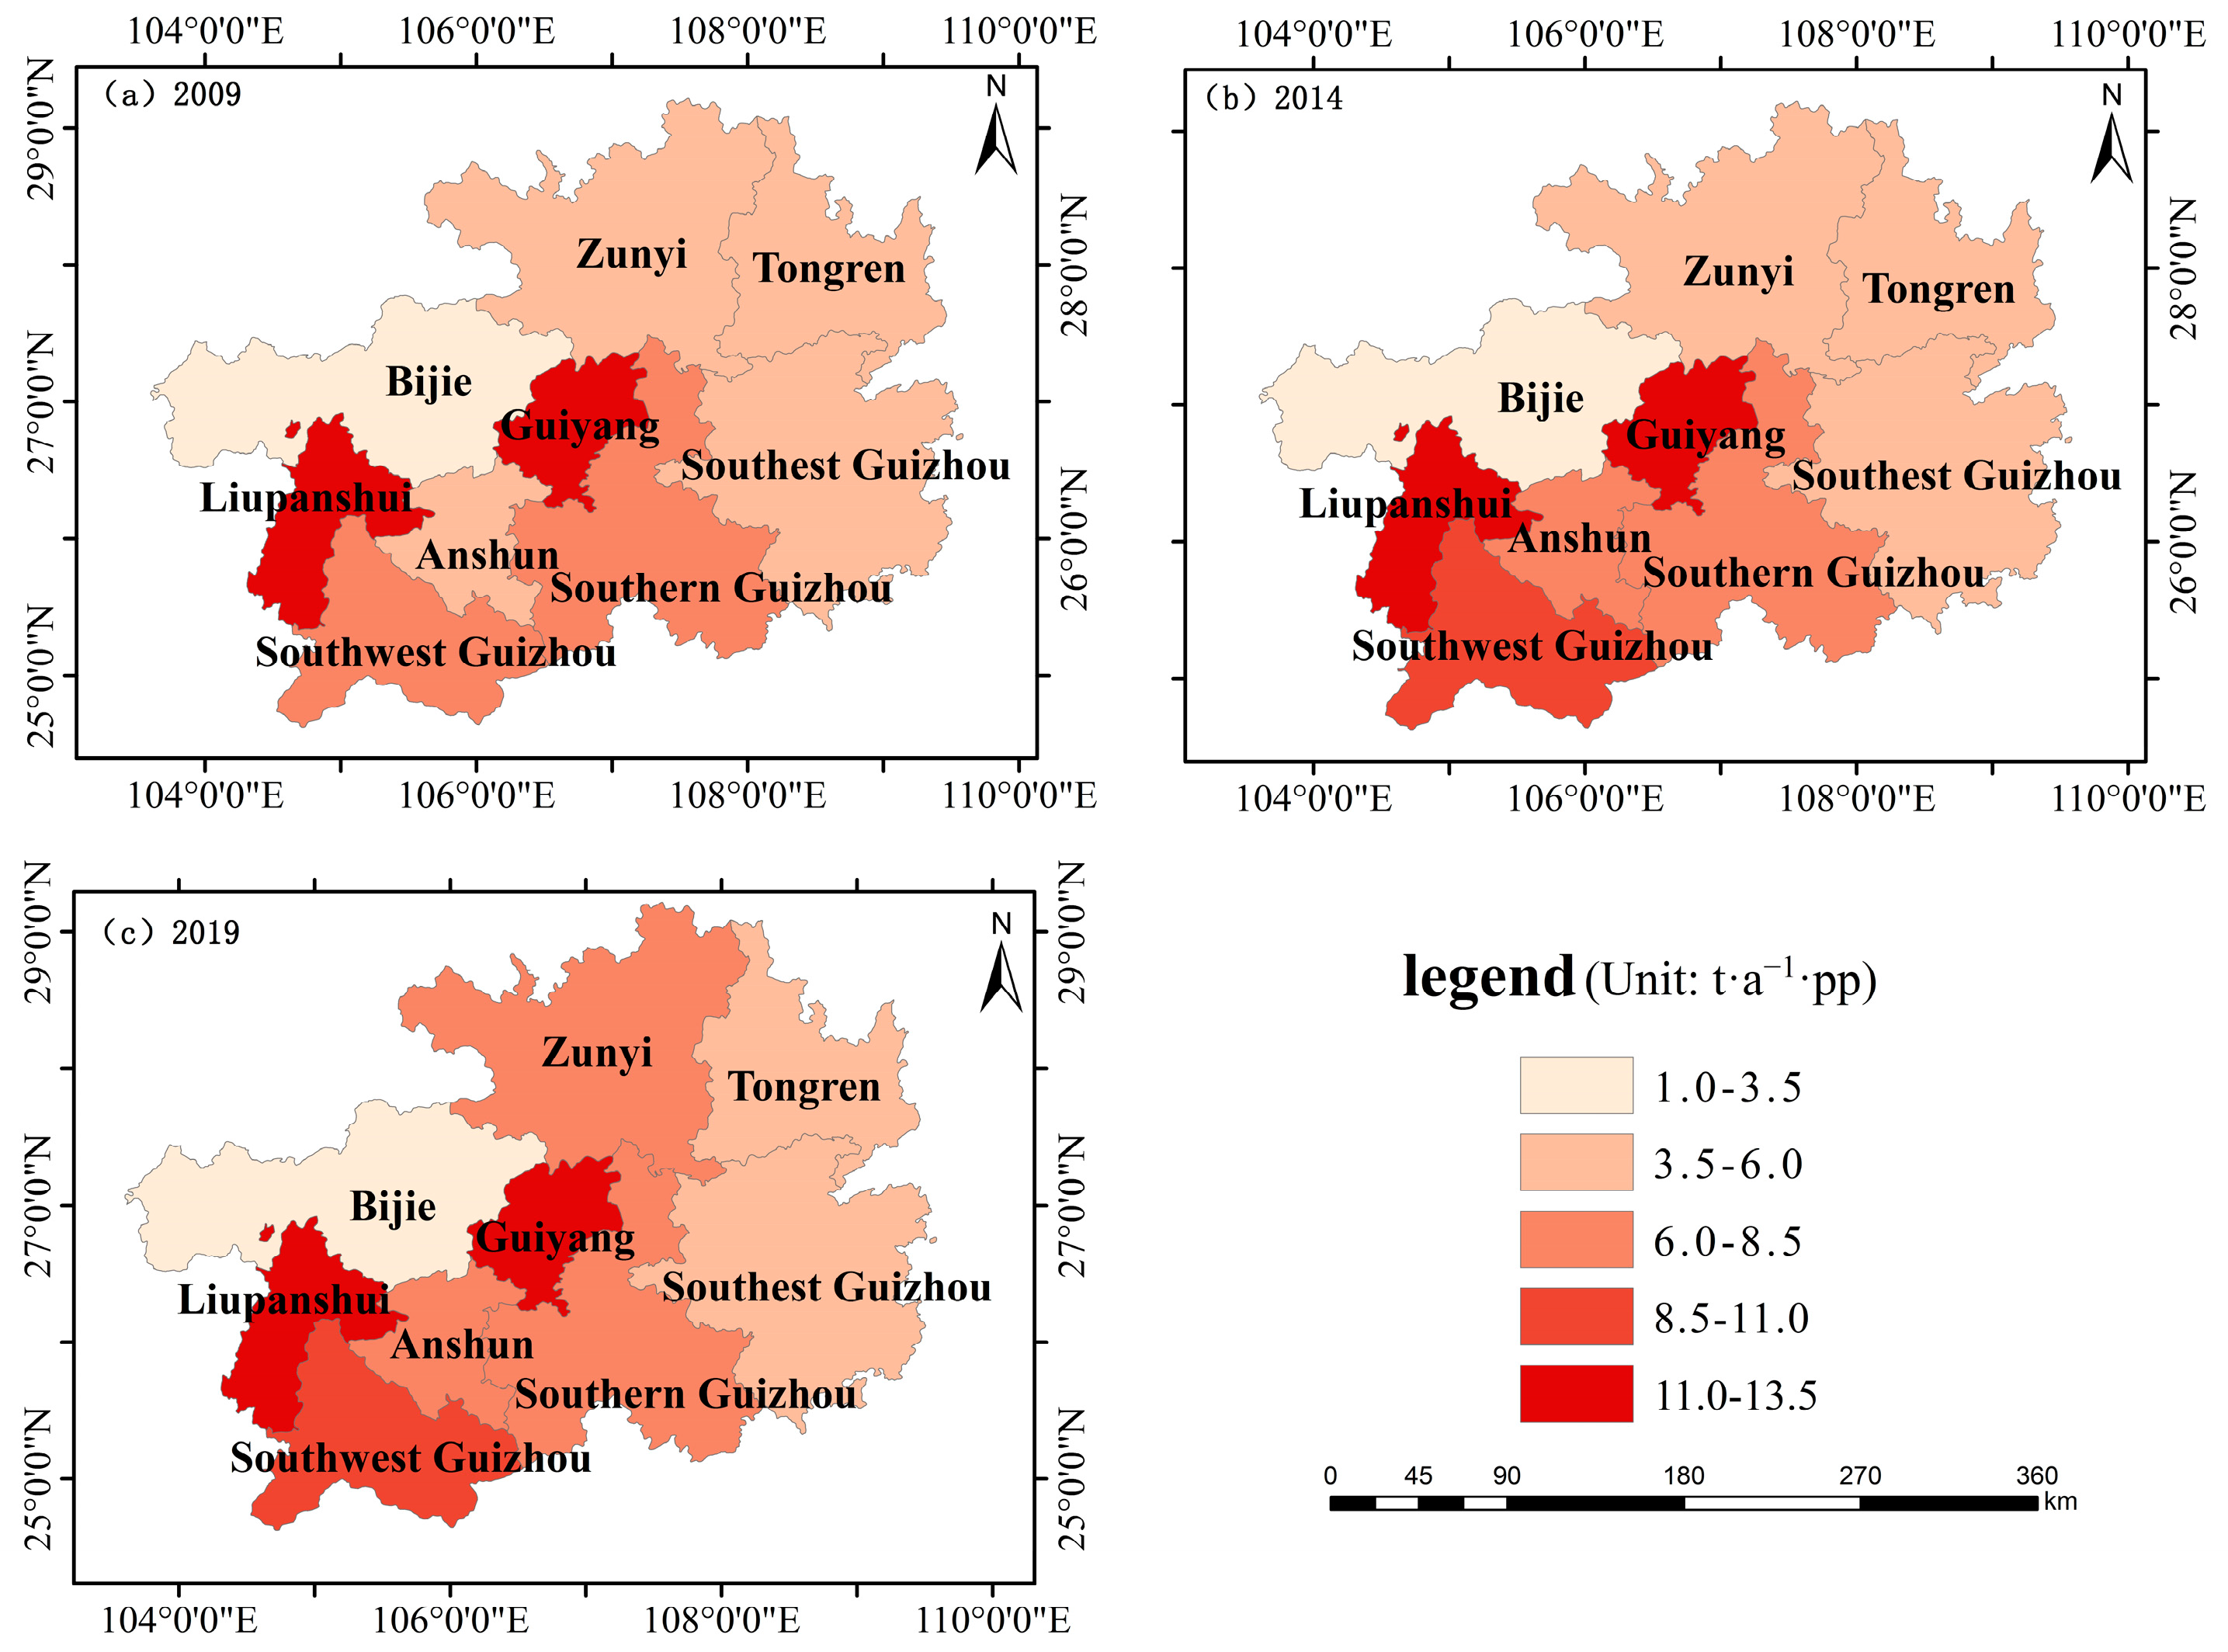
4.4. Analysis of Carbon Emissions per Capita

Based on the population data of the Guizhou Statistical Yearbook (2009–2019), the carbon emissions per capita in the cities of Guizhou Province were calculated (Table 7). The spatial distribution of carbon emissions per capita was created using the computed results (Figure 6).
As can be seen from Table 7, the total population and carbon emissions per capita rose in all cities during this period. The two regions with the largest total populations were Zunyi and Bijie, each of which had a population of over 6 million, with noticeable population expansion and low carbon emissions per capita. In Bijie, carbon emissions per capita increased from 2.33 tons per person in 2009 to 3.18 tons per person in 2019. Anshun, Qianxinan Autonomous Prefecture, and Liupanshui had the lowest total populations yet the highest carbon emissions per capita. Liupanshui had the highest carbon emissions per capita in Guizhou Province. The carbon emissions per capita were 12.15 tons in 2009, more than five times that of Bijie. Guiyang experienced the fastest population growth, with an increase of 552,600 people in just ten years. In Guiyang, both the total population and the carbon emissions per capita were comparatively high. The carbon emissions per capita increased from 11.61 tons per person in 2009 to 12.18 tons per person. This indicates that population size contributes to carbon emissions. Generally, there was a yearly increase in carbon emissions per capita because the growth rate of carbon emissions was greater than the growth rate of the permanent population in all the cities. The fact that carbon emissions have a significant negative effect on human existence is one of the reasons they have become such a heated topic in society today, demonstrating the interconnection of population and carbon emissions.
Figure 6 illustrates the obvious spatial differences in carbon emissions per capita. In the central area of Guizhou Province, Guiyang and Liupanshui had persistently high carbon emissions per capita. Over the ten-year period, there were very slight increases and decreases in carbon emissions per capita. The largest increases in carbon emissions per capita were seen in Anshun and Qianxinan Autonomous Prefecture in the southern part of Guizhou. Bijie, Tongren, and Zunyi, located in the northern region of Guizhou Province, were the cities with the lowest carbon emissions per capita. The differences in carbon emissions per capita in Guizhou Province are related to the unbalanced distribution of the population. In Guizhou Province, the Han nationality is mainly concentrated in the northwest, whereas the ethnic minorities are mainly distributed in Anshun and the three autonomous prefectures in the south. Ethnic minority areas are relatively underdeveloped in terms of culture, society, and economy. Because of a lack of educational provision and the basic conditions, the labor force as a whole is less skilled than in other areas. The education and skills of the population are a key determinant of high-quality economic development in the comprehensive development of an affluent society.

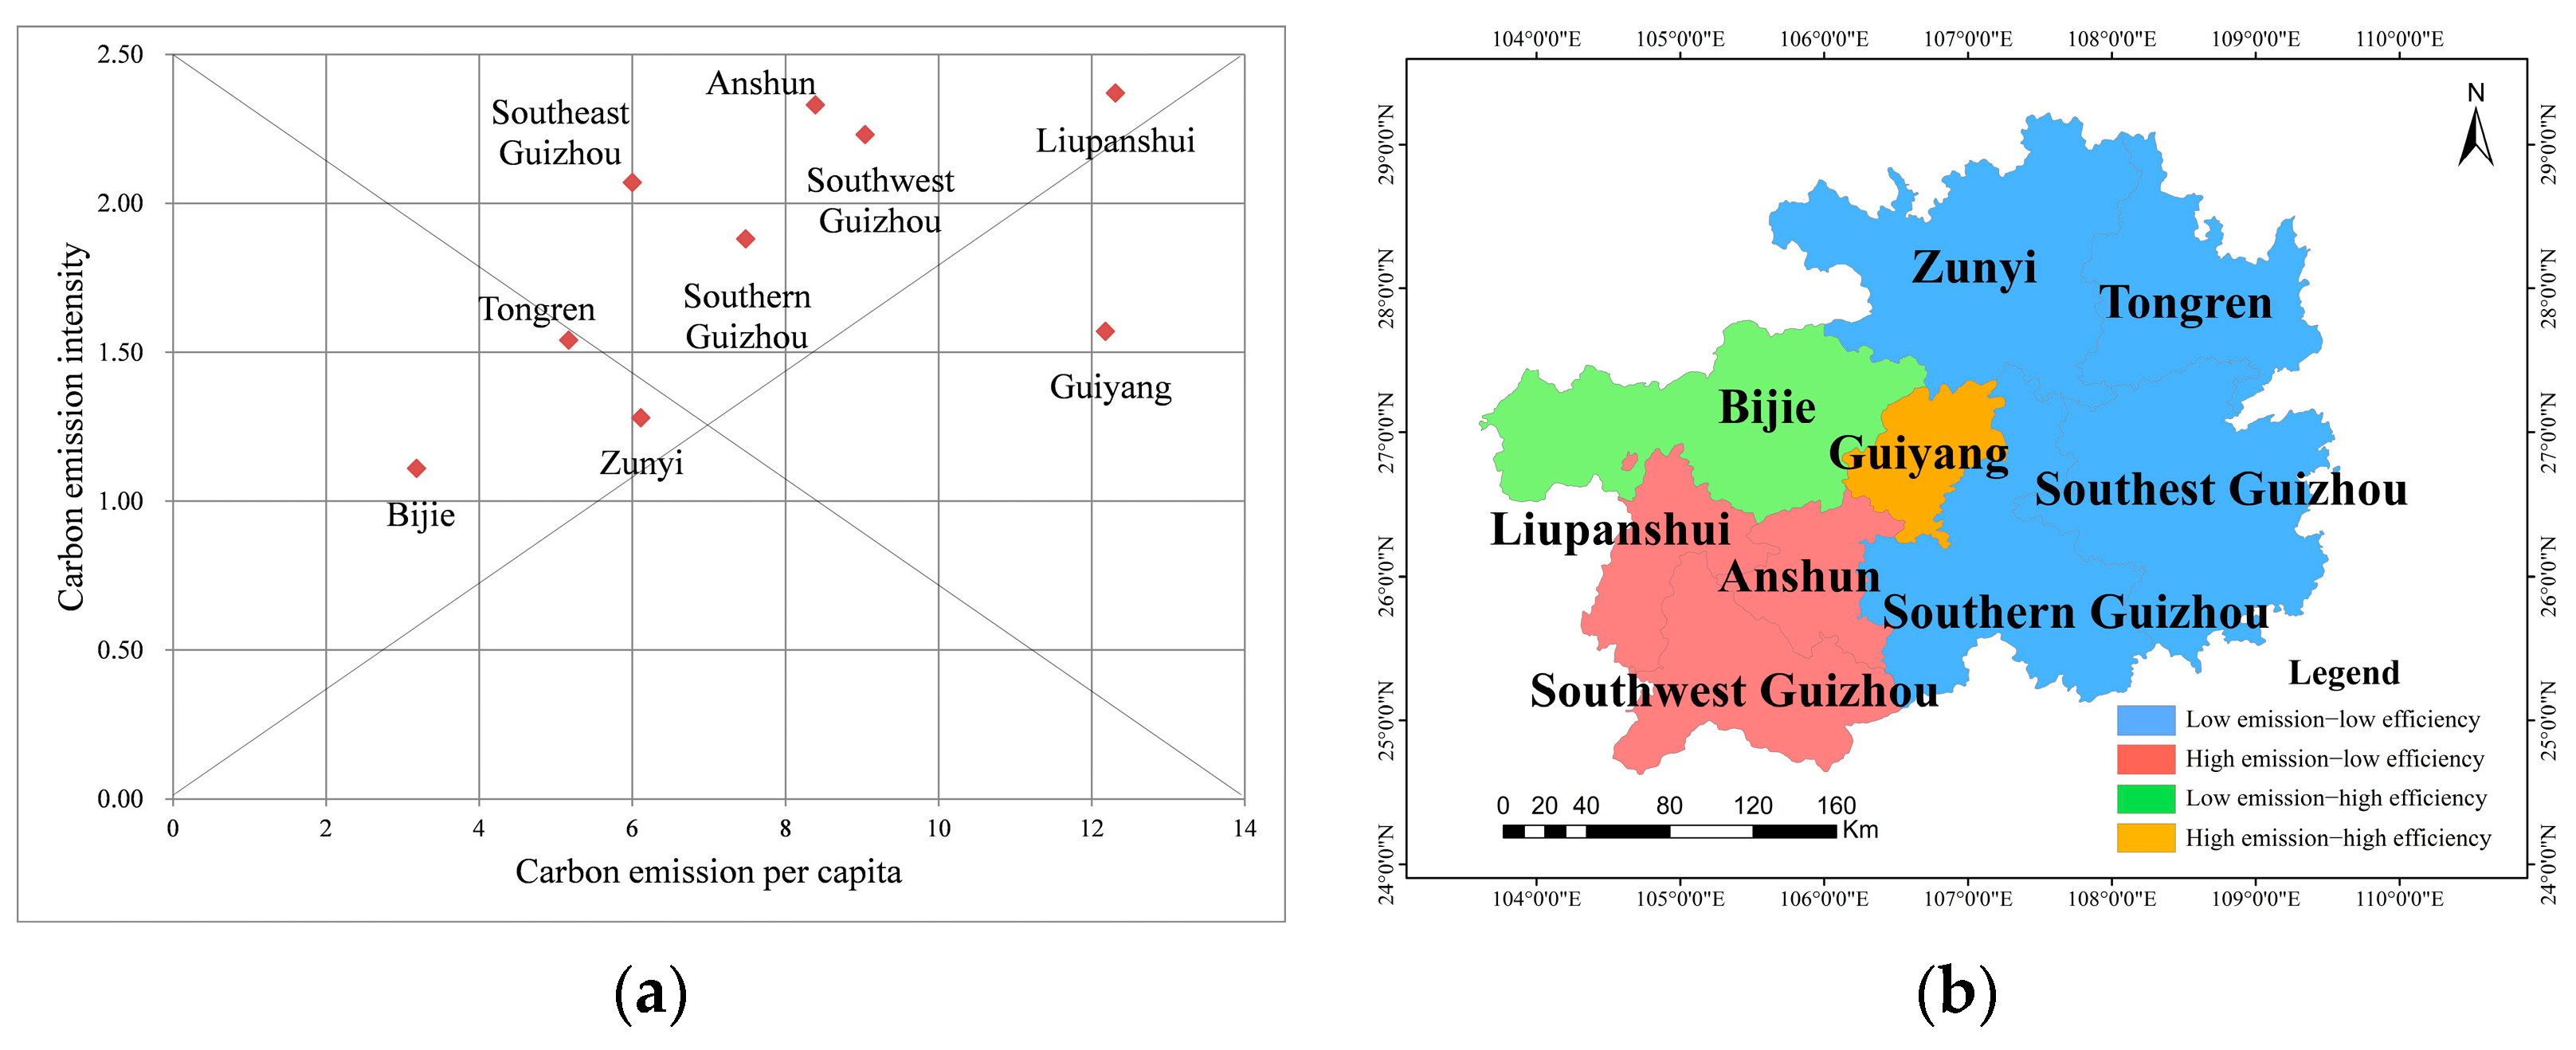
4.5. Analysis of Combined Spatial Difference between Emissions and Efficiency

Spatial difference clustering analysis was conducted with reference to the two indicators of carbon emissions per capita and carbon emissions intensity for the cities in Guizhou Province in 2019. Relative emission was taken as carbon emissions per capita, and relative emissions efficiency was taken as carbon emissions intensity. The emissions–efficiency scatter diagram is shown in Figure 7.
The emissions efficiency of Guizhou Province was divided into four categories via a cluster analysis based on the distribution characteristics of the scatter diagram using ArcGIS10.3 software: high emissions–high efficiency, high emissions–low efficiency, low emissions–high efficiency, and low emissions–low efficiency. Guiyang was the only city with high emissions–high efficiency, and Liupanshui, Anshun, and Qianxinan Autonomous Prefecture had high emissions–low efficiency. The low emissions–low efficiency areas included Zunyi, Tongren, Qiandongnan Autonomous Prefecture, and Qiannan Autonomous Prefecture, and Bijie was the only low emissions–high efficiency area. As the capital city of Guizhou Province, Guiyang has a high population density and a relatively high level of economic development, resulting in a high energy demand. There are many mountains and hills in Bijie, and the ecosystem is relatively intact compared with other areas. Additionally, Bijie has a high capability for absorbing carbon and a low population density. Zunyi, Tongren, Qiandongnan Autonomous Prefecture, and Qiannan Autonomous Prefecture lag behind the other cities in terms of economic development, and their secondary and tertiary industries are not particularly advanced, making them low emissions–low efficiency cities. As can be seen from Figure 7, the spatial distribution of carbon emissions per capita and carbon emissions intensity in Guizhou Province also presents certain agglomeration characteristics.

5. Discussion

In this paper, the law of land-use change in Guizhou Province from 2009 to 2019 was discussed. Based on the conclusions, the land-use carbon emissions calculation model is used to quantitatively analyze the temporal and spatial evolution of carbon emissions. The purpose is to make a detailed study on the existing problems of low-carbon development in Guizhou Province and draw a convincing conclusion. The results provide theoretical guidance and practical improvement for sustainable development in Guizhou Province and other regions of China.

5.1. Analysis of Land-Use Change

The dynamic change in land-use structure and spatiotemporal evolution of carbon emissions in Guizhou Province from 2009 to 2014 were explored, and it was found that urban land expansion was one of the main driving factors for the increase in carbon emissions. In recent years, with the acceleration of urbanization, ecological problems caused by the rapid expansion of urban construction land have attracted increasing attention [30]. In order to reasonably control the growth of land-use carbon emissions, it is necessary to establish a scientific carbon emission standard system for construction land and continue to promote the total amount and intensity control measures for construction land [31,32]. The regional land-use structure in Guiyang, Liupanshui, Anshun, and other high discharge and low efficiency areas needs to be adjusted scientifically. The internal structure of existing urban land use should be optimized, and land for administration, commerce, residence, sports, and culture should be rationally allocated [33]. At the same time, measures can be taken to make full use of urban land stock, develop and utilize underground space resources, and improve the degree of intensive land use.
In terms of the proportion of land-use structure, the forest coverage rate of Guizhou Province in 2019 exceeded 58.30%, of which Guiyang was the lowest, only 53.81%. It can be seen that human activities have different degrees of influence on the development and utilization of land resources. Attention should be paid to protecting existing forest resources to prevent the rapid reduction in agricultural land and forest land. It is necessary to increase the proportion of ecological land use and enhance the carbon sink capacity of ecosystems. For example, several agroforestry systems prevail in different agro-ecological zones of Pakistan and cover a remarkable area of 19.3 million hectares. They not only play an important role in slowing down carbon emissions, but also contribute to mitigating climate change [34]. In California’s national climate change policy development process for 2016–2019, balancing nature and working land (NWL), such as woodlands, rangelands, and wetlands, was seen as a key step in achieving carbon reduction goals [35].

5.2. Analysis of Low-Carbon Development Path

Low-carbon development is a new development mode to cope with global climate change and excessive energy consumption. Since 2010, China has launched three batches of low-carbon pilot cities, totaling 87 provinces and regions. The modernization of Guizhou Province was still in its early stages in 2019, and its three industrial structures lacked sufficient coordination. In order to realize low-carbon development, Guizhou Province should attach importance to low-carbon development planning. The adjustment of industrial structure, energy structure, and rational distribution of population need to be conducted well, low-carbon industries and low-carbon buildings should be vigorously developed, and the relevant government policies and regulations should play a crucial role in promoting low-carbon development.

5.2.1. Promote the Optimization of Industrial Structure

To achieve further energy conservation and emissions reduction, resource consumption and ecological damage can be reduced by transforming the economic development model and upgrading the industrial structure [36]. At present, the global economic pattern is deeply adjusted, and competition in industrial fields is extremely fierce. On the one hand, it is imperative to optimize and upgrade the industrial structure. Concerted efforts should be made to develop tertiary, in particular low-energy and high-tech, industries and service industries. Electricity, solar power, biofuels, and other new energy technologies can be used to replace some facilities currently fueled by coal, oil, and natural gas [37,38]. In order to induce gains in energy efficiency, Brazil instituted its new biofuels policy (known as RenovaBio—Law 13.576/2017) [39]. On the other hand, according to the characteristics of ecological environment in Guizhou, tourism, vacation, leisure, health, adventure, and other special tourism products can be fully developed. Eco-tourism brands can be built to promote the development of leisure agriculture and rural tourism [40]. The barriers between industries and regions can be gradually removed through industrial structure adjustments, and the relationship between land-use carbon emissions and economic growth can be effectively managed.

5.2.2. Guide the Rational Distribution of Population

Geographical variation in population distribution is a key element affecting the carbon emissions of the cities in Guizhou Province. In 2019, the total population of Bijie was temporarily the highest, followed by Zunyi and Guiyang. A Matthew effect with regard to the flow of talent is observed, with highly qualified labor tending to gravitate to densely populated and economically developed areas, with the ethnic minority areas in the south facing severe skills shortages. It is therefore necessary to appropriately guide the rational distribution of the population and control the brain drain phenomenon in the undeveloped economic areas. More funds should be invested in education to upgrade facilities for primary education in areas where there is a talent deficit. High-quality talent should be brought in when necessary, and the relevant talent management systems should be improved. In addition, the population should be upskilled, particularly in the rural areas. For example, high-quality farming training could be conducted to reserve talent for the development of the agricultural industry.

5.2.3. Improve Relevant Policies and Systems

To realize the sustainable development of economy and environment, the government’s policy support is an indispensable link. On the one hand, financial input and subsidy policies need to be sound to provide financial guarantees for low-carbon development. Special funding for low-carbon development needs to be increased to use financial subsidies to encourage industrial enterprises to implement energy-saving transformation and reduce consumption, and to support the green and clean environmental protection works of relevant departments. On the other hand, the carbon tax is often regarded as a profitable tool to mitigate emissions rate. In the 1990s, a small number of advanced European economies such as Denmark, Finland, Sweden, the Netherlands, and Norway began to implement a tax on carbon dioxide (CO2) emissions [41]. Since implementation of carbon tax in 2012, Japan has made steady progress in reducing its carbon emissions [42]. With the establishment and operation of the carbon trading market in China, the carbon tax policy can also be considered and piloted. Carbon tax can be levied on some high-carbon emission and high-pollution industries, tax discounts can be provided to low-carbon emission enterprises. Enterprises that meet certain standards for carbon emission reduction can be rewarded to encourage industries to curb and reduce carbon emissions [43,44]. At the same time, the carbon tax policy also needs to carry out more advanced and innovative reforms to adapt to the development of the times.

6. Conclusions

As a province with a large area of forest land, Guizhou has an outstanding capacity for carbon absorption. Investigating the link between carbon emissions and carbon absorption can help to achieve reductions in carbon emissions. The following conclusions were reached after analyzing the spatiotemporal evolution of land use and carbon emissions in Guizhou Province.
(1)
Cultivated land and construction land in Guizhou Province have undergone the most significant changes in recent years. Construction land showed a trend of continuous expansion, and its main source was cultivated land. Guizhou Province is located in the mountainous region, with the area of forest land accounting for more than half of its total area. Forest land fulfils strong ecosystem functions and is the primary source of the carbon sink.
(2)
From 2009 to 2019, carbon emissions intensity in Guizhou Province continued to decline, while total carbon emissions and carbon emissions per capita maintained an upward trend. Accelerating urbanization, energy structure transformation, the immoderate utilization of land by human beings, and the increasing population density were the key causes of the significantly increasing trend in carbon emissions in Guizhou Province.
(3)
From the perspective of the cities in Guizhou Province, there were obvious spatial differences in carbon emissions and carbon emissions efficiency. Because of variations in land-use and economic growth patterns, Guiyang was the only high emission–high efficiency city, and Bijie was the only low emission–high efficiency city. Over time, the carbon emissions per capita and carbon emissions intensity in the different regions also exhibited agglomeration effects.
Future research on land-use carbon emissions will be conducted from the perspectives of carbon emissions prediction, scenario simulation, and optimization of data methods. The research results are expected to contribute to the optimization of low-carbon development paths from the perspective of land-use and energy consumption structure, population distribution, industrial structure, and carbon emissions reduction policies.

Author Contributions

Conceptualization, X.L. and S.H.; methodology, X.L., L.J. and B.H.; visualization, X.L., X.W. and J.L.; writing—original draft, X.L.; writing—review and editing, X.L. and S.H. All authors have read and agreed to the published version of the manuscript.

Funding

This research was funded by the Humanities and Social Sciences Research Program of the Ministry of Education (No. 22YJC630036), Jiangsu University Philosophy and Social Science Research Project (No. 2021SJA1712), Natural Science Foundation of the Jiangsu Higher Education Institutions of China (23KJD170003), and Postgraduate Research & Practice Innovation Program of Jiangsu Ocean University (KYCX2022-15).

Data Availability Statement

The data presented in this paper are available on request from the corresponding author.

Acknowledgments

The authors thank the reviewers and editors for their constructive comments and suggestions.

Conflicts of Interest

The authors declare no conflict of interest.

References

  1. Masson-Delmotte, V.; Zhai, P.; Pirani, A.; Connors, S.L.; Péan, C.; Berger, S.; Caud, N.; Chen, Y.; Goldfarb, L.; Gomis, M.I.; et al. IPCC, 2021: Climate Change 2021: The Physical Science Basis; Cambridge University Press: Cambridge, UK; New York, NY, USA, 2021; p. 2391. [Google Scholar]
  2. Lee, C.C.; Huang, K.C.; Kuo, S.Y.; Cheng, D.K.; Tung, C.P.; Liu, T.M. Climate change research in Taiwan: Beyond following the mainstream. Environ. Hazards-Hum. Policy Dimens. 2023, 22, 79–97. [Google Scholar] [CrossRef]
  3. An, N.; Yao, Q.; Shen, Q.J. A review of human settlement research on climate change response under carbon-oriented: Literature characteristics, progress and trends. Buildings 2022, 12, 1614. [Google Scholar] [CrossRef]
  4. Redlin, M.; Gries, T. Anthropogenic climate change: The impact of the global carbon budget. Theor. Appl. Climatol. 2021, 146, 713–721. [Google Scholar] [CrossRef]
  5. Wang, M.M.; Kong, D.Z.; Mao, J.H.; Ma, W.J.; Ayyamperumal, R. The impacts of land use spatial form changes on carbon emissions in Qinghai–Tibet Plateau from 2000 to 2020: A case study of the Lhasa metropolitan area. Land 2023, 12, 122. [Google Scholar] [CrossRef]
  6. Kang, T.T.; Wang, H.; He, Z.Y.; Liu, Z.Y.; Ren, Y.; Zhao, P.J. The effects of urban land use on energy-related CO2 emissions in China. Sci. Total Environ. 2023, 870, 161873. [Google Scholar] [CrossRef] [PubMed]
  7. Zhai, P.M.; Yuan, Y.F.; Yu, R.; Guo, J.P. Climate change and sustainable development for cities. Chin. Sci. Bull. 2019, 64, 1995–2001. [Google Scholar] [CrossRef]
  8. Lin, Q.W.; Wang, S.S.; Li, Y.C.; Riaz, L.; Yu, F.; Yang, Q.X.; Han, S.J.; Ma, J.M. Effects and mechanisms of land-types conversion on greenhouse gas emissions in the Yellow River floodplain wetland. Sci. Total Environ. 2022, 813, 152406. [Google Scholar] [CrossRef]
  9. Zhang, K.; Shen, J.; Zhang, J.; Han, H. Recent advances on renewable energies and carbon capture. Pol. J. Environ. Stud. 2019, 28, 2541–2552. [Google Scholar] [CrossRef] [PubMed]
  10. Li, J.S.; Guo, X.M.; Chuai, X.W.; Xie, F.J.; Yang, F.; Gao, R.Y.; Ji, X.P. Reexamine China’s terrestrial ecosystem carbon balance under land use-type and climate change. Land Use Policy 2021, 102, 105275. [Google Scholar] [CrossRef]
  11. Sleeter, B.M.; Marvin, D.C.; Cameron, D.R.; Selmants, P.C.; Westerling, A.R.; Kreitler, J.; Daniel, C.J.; Liu, J.X.; Wilson, T.S. Effects of 21st-century climate, land use, and disturbances on ecosystem carbon balance in California. Glob. Chang. Biol. 2019, 25, 3334–3353. [Google Scholar] [CrossRef]
  12. Bridhikitti, A.; Ketuthong, A.; Prabamroong, T.; Li, R.Z.; Li, J.; Liu, G.H. How do sustainable development-induced land use change and climate change affect water balance? A case study of the Mun River Basin, NE Thailand. Water Resour. Manag. 2023, 37, 2737–2756. [Google Scholar] [CrossRef]
  13. Zhang, Y.Q.; Luo, H.L.; Wang, C. Progress and trends of global carbon neutrality pledges. Clim. Chang. Res. 2021, 17, 88–97. [Google Scholar]
  14. Xi, J.P. Note on the Proposal of the Central Committee of the Communist Party of China for Formulating the 13th Five-Year Plan for National Economic and Social Development. Communist 2015, 23, 9–13. [Google Scholar]
  15. Yang, P.G.; Liang, X.; Drohan, P.J. Using Kaya and LMDI models to analyze carbon emissions from the energy consumption in China. Environ. Sci. Pollut. Res. 2020, 27, 26495–26501. [Google Scholar] [CrossRef] [PubMed]
  16. Hepburn, C.; Qi, Y.; Stern, N.; Ward, B.; Xie, C.P.; Zenghelis, D. Towards carbon neutrality and China’s 14th Five-Year Plan: Clean energy transition, sustainable urban development, and investment priorities. Environ. Sci. Ecotechnol. 2021, 8, 100130. [Google Scholar] [CrossRef] [PubMed]
  17. Huang, Q.F. The key stage of the great rejuvenation: Learning the understanding and experience of the 14th Five-Year Plan for National Economic and Social Development of the People’s Republic of China and the Outline of the 2035 Vision Goals. People’s Trib. 2021, 15, 6–10. [Google Scholar]
  18. Xu, D. The issuance of the “1+N” policy system constitutes the top-level design of China’s realization of the “Dual Carbon” goal. Int. Pet. Econ. 2022, 30, 24–26. [Google Scholar]
  19. Sun, M.Y.; Li, X.H.; Yang, R.J.; Zhang, Y.; Zhang, L.; Song, Z.W.; Liu, Q.; Zhao, D. Comprehensive partitions and different strategies based on ecological security and economic development in Guizhou Province, China. J. Clean. Prod. 2020, 274, 122794. [Google Scholar] [CrossRef]
  20. Liu, M.; Chen, Y.R.; Chen, K.; Chen, Y. Progress and hotspots of research on land-use carbon emissions: A global perspective. Sustainability 2023, 15, 7245. [Google Scholar] [CrossRef]
  21. Zhou, M.; Ma, Y.X.; Tu, J.T.; Wang, M.C. SDG-oriented multi-scenario sustainable land-use simulation under the background of urban expansion. Environ. Sci. Pollut. Res. 2022, 29, 72797–72818. [Google Scholar] [CrossRef]
  22. Tang, M.G.; Hu, F.X. How does land urbanization promote CO2 emissions reduction? Evidence from Chinese prefectural-level cities. Front. Environ. Sci. 2021, 9, 766839. [Google Scholar] [CrossRef]
  23. Zeng, C.; Wu, S.; Zhou, H.; Cheng, M. The Impact of urbanization growth patterns on carbon dioxide emissions: Evidence from Guizhou, west of China. Land 2022, 11, 1211. [Google Scholar] [CrossRef]
  24. Wang, H.H.; He, Y.Y.; Shi, W.Y.; Zeng, W.H.; He, Y.F. Spatiotemporal spillover effect and efficiency of carbon emissions from land use in China. Environ. Dev. Sustain. 2023. [Google Scholar] [CrossRef]
  25. Cai, C.; Fan, M.; Yao, J.; Zhou, L.L.; Wang, Y.Z.; Liang, X.Y.; Liu, Z.Q.; Chen, S. Spatial -temporal characteristics of carbon emissions corrected by socio-economic driving factors under land use changes in Sichuan Province, southwestern China. Ecol. Inform. 2023, 77, 102164. [Google Scholar] [CrossRef]
  26. Yan, H.M.; Guo, X.; Zhao, S.Q.; Yang, H.C. Variation of net carbon emissions from land use change in the Beijing-Tianjin-Hebei Region during 1990–2020. Land 2022, 11, 997. [Google Scholar] [CrossRef]
  27. Huang, K.W.; Ma, Z.; Wang, X.F.; Shan, J.Y.; Zhang, Z.M.; Xia, P.H.; Jiang, X.; Wu, X.L.; Huang, X.F. Control of soil organic carbon under karst landforms: A case study of Guizhou Province, in southwest China. Ecol. Indic. 2022, 145, 109624. [Google Scholar] [CrossRef]
  28. Lin, T.; Wu, D.; Yang, M.; Ma, P.; Liu, Y.; Liu, F.; Gan, Z. Evolution and simulation of terrestrial ecosystem carbon storage and sustainability assessment in Karst Areas: A case study of Guizhou Province. Environ. Res. Public Health 2022, 19, 16219. [Google Scholar] [CrossRef] [PubMed]
  29. Peng, T.; Deng, H.W. Research on the sustainable development process of low-carbon pilot cities: The case study of Guiyang, a low-carbon pilot city in south-west China. Environ. Dev. Sustain. 2021, 23, 2382–2403. [Google Scholar] [CrossRef]
  30. Peng, J.Y.; Zheng, Y.H.; Liu, C.J. The Impact of urban construction land use change on carbon emissions: Evidence from the China land market in 2000–2019. Land 2022, 11, 1440. [Google Scholar] [CrossRef]
  31. Wang, Y.; Chai, J.; Zhang, H.W.; Yang, B. Evaluating construction land use efficiency under carbon emission constraints: A comparative study of China and the USA. Environ. Sci. Pollut. Res. 2022, 29, 49998–50009. [Google Scholar] [CrossRef]
  32. Hu, X.T.; Li, Z.H.; Cai, Y.M.; Wu, F. Urban construction land demand prediction and spatial pattern simulation under carbon peak and neutrality goals: A case study of Guangzhou, China. J. Geogr. Sci. 2022, 32, 2251–2270. [Google Scholar] [CrossRef]
  33. Li, L.; Chen, Z.; Wang, S. Optimization of spatial land use patterns with low carbon target: A case study of Sanmenxia, China. Int. J. Environ. Res. Public Health 2022, 19, 14178. [Google Scholar] [CrossRef]
  34. Yasin, G.; Nawaz, M.F.; Zubair, M.; Azhar, M.F.; Mohsin Gilani, M.; Ashraf, M.N.; Qin, A.; Ur Rahman, S. Role of traditional agroforestry systems in climate change mitigation through carbon sequestration: An investigation from the Semi-Arid Region of Pakistan. Land 2023, 12, 513. [Google Scholar] [CrossRef]
  35. Simmonds, M.B.; Vittorio, A.V.D.; Jahns, C.; Johnston, E.; Jones, A.; Nico, P.S. Impacts of California’s climate-relevant land use policy scenarios on terrestrial carbon emissions (CO2 and CH4) and wildfire risk. Environ. Res. Lett. 2021, 16, 014044. [Google Scholar] [CrossRef]
  36. Lin, Q.W.; Zhang, L.; Qiu, B.K.; Zhao, Y.; Wei, C. Spatiotemporal analysis of land use patterns on carbon emissions in China. Land 2021, 10, 141. [Google Scholar] [CrossRef]
  37. Wu, L.F.; Sun, L.W.; Qi, P.X.; Ren, X.W.; Sun, X.T. Energy endowment, industrial structure upgrading, and CO2 emissions in China: Revisiting resource curse in the context of carbon emissions. Resour. Policy 2021, 74, 102329. [Google Scholar] [CrossRef]
  38. Zou, C.N.; Xiong, B.; Xue, H.Q.; Zheng, D.W.; Ge, Z.X.; Wang, Y.; Jiang, L.Y.; Pan, S.Q.; Wu, S.T. The role of new energy in carbon neutral. Pet. Explor. Dev. 2021, 48, 480–491. [Google Scholar] [CrossRef]
  39. Guarenghi, M.M.; Garofalo, D.F.T.; Seabra, J.E.A.; Moreira, M.M.R.; Novaes, R.M.L.; Ramos, N.P.; Nogueira, S.F.; de Andrade, C.A. Land use change net removals associated with sugarcane in Brazil. Land 2023, 12, 584. [Google Scholar] [CrossRef]
  40. Su, J. Impact of tourism resource development based on low-carbon mode: A case study of Guizhou ethnic areas. Ecol. Process. 2019, 8, 21. [Google Scholar] [CrossRef]
  41. Ghazouani, A.; Xia, W.J.; Jebli, M.B.; Shahzad, U. Exploring the role of carbon taxation policies on CO2 emissions: Contextual evidence from tax implementation and non-implementation European countries. Sustainability 2020, 12, 8680. [Google Scholar] [CrossRef]
  42. Gokhale, H. Japan’s carbon tax policy: Limitations and policy suggestions. Curr. Res. Environ. Sustain. 2021, 3, 100082. [Google Scholar] [CrossRef]
  43. McAusland, C.; Najjar, N. Carbon Footprint Taxes. Environ. Resour. Econ. 2015, 61, 37–70. [Google Scholar] [CrossRef]
  44. McAusland, C. Carbon taxes and footprint leakage: Spoilsport effects. J. Public Econ. 2021, 204, 104531. [Google Scholar] [CrossRef]
Figure 1. Schematic diagram of the scope and geographical location of the study area.
Land 12 01875 g001
Figure 2. Land-use classification maps for 2009, 2014, and 2019.
Land 12 01875 g002
Figure 3. Changes in carbon emissions in various cities of Guizhou Province from 2009 to 2019.
Land 12 01875 g003
Figure 4. Spatial changes in land-use carbon emissions in Guizhou Province from 2009 to 2019.
Land 12 01875 g004
Figure 5. Spatial changes in energy carbon emissions intensity in various cities of Guizhou Province.
Land 12 01875 g005
Figure 6. Spatial change in carbon emissions per capita in various cities of Guizhou Province.
Land 12 01875 g006
Figure 7. (a) Emissions and efficiency scatter diagram. (b) Spatial distribution of emissions and efficiency.
Land 12 01875 g007
Table 1. Reference table for land-use carbon emissions coefficient.
Land TypeCoefficient ValueUnit
Cultivated land0.0422kg/(m2·a)
Forest land−0.0578kg/(m2·a)
Grassland−0.0021kg/(m2·a)
Water area−0.0252kg/(m2·a)
Unused land−0.0005kg/(m2·a)
Table 2. Coefficients for the conversion to standard coal and for the carbon emission of different types of energy.
Energy TypeCoefficient for Conversion to Standard Coal (kj·kg−1)Average Lower Heating Value (kg·GJ−1)Carbon Oxidation Rate (%)Carbon Emissions Coefficient
Raw coal0.714320,90895%0.5183
Coal0.714320,90894%0.7559
Coke0.971428,43593%0.8550
Cleaned coal0.900026,34497%0.6225
Crude oil1.428641,81698%0.5857
Gasoline1.471443,07098%0.5538
Kerosene1.471443,03098%0.5714
Diesel oil1.457142,65298%0.5921
Liquefied petroleum gas1.714350,17998%0.6225
Fuel oil1.428641,81698%0.6185
Natural gas1.214335,54499%0.4483
Electric power0.404359699%0.7935
Table 3. Changes in land-use area structure in Guizhou Province from 2009 to 2019.
YearUnit
(km2)
Cultivated LandForest LandGrasslandWater AreaConstruction LandUnused LandTotal
2009Area49,419.8295,496.3529,586.67686.85874.5429.94176,094.17
Proportion28.06%54.23%16.80%0.39%0.50%0.02%100.00%
2014Area49,087.3895,423.0129,529.73697.751322.2833176,093.15
Proportion27.88%54.19%16.77%0.40%0.75%0.02%100.00%
2019Area48,437.8793,082.9231,327.961045.692159.2530.58176,084.27
Proportion27.51%52.86%17.79%0.59%1.23%0.02%100.00%
2009–2019Area change−981.95−2413.431741.29358.841284.710.64/
Rate of area change−1.99%−2.53%5.89%52.24%146.90%2.14%/
Table 4. Dynamic degree of land use in Guizhou Province from 2009 to 2019.
Land Type2009–20142014–20192009–2019
Cultivated land−0.13%−0.26%−0.40%
Forest land−0.02%−0.49%−0.51%
Grassland−0.04%1.22%1.18%
Water area0.32%9.97%10.45%
Construction land10.24%12.66%29.38%
Unused land2.04%−1.46%0.43%
Comprehensive dynamic degree0.13%0.60%0.64%
Table 5. Carbon emissions, carbon absorption, and net carbon emissions in Guizhou Province.
YearLand-Use Carbon Emissions (104 t)Total Carbon EmissionsCarbon AbsorptionNet Carbon Emissions
Cultivated Land Forest LandGrasslandWater AreaConstruction LandUnused Land
2009208.55−551.97−6.21−1.735943.7−0.00146152.22−559.915592.31
3.39%98.58%1.11%0.31%96.61%0.00%100.00%100.00%
2014207.15−551.55−6.2−1.767941.6−0.00168148.71−559.517589.2
2.54%98.58%1.11%0.31%97.46%0.00%100.00%100.00%
2019204.41−538.02−6.58−2.648756.9−0.00158961.34−546.648417.7
2.28%98.42%1.20%0.48%97.72%0.00%100.00%100.00%
Table 6. Carbon emissions intensity of energy consumption in various cities of Guizhou Province.
RegionGDP (CNY 108)Carbon Emissions Intensity (t/CNY 104)
200920142019200920142019
Guiyang1121.822891.163798.454.48 1.84 1.57
Liupanshui500.631201.081525.696.93 2.80 2.37
Zunyi908.762168.343000.232.99 1.43 1.28
Anshun232.9625.41849.45.87 2.65 2.33
Tongren293.62770.891066.523.73 1.82 1.54
Qianxinan Autonomous Prefecture307.13801.651163.776.35 3.07 2.33
Bijie600.851461.351921.432.56 1.28 1.11
Qiandongnan Autonomous Prefecture312.57811.551026.625.13 2.29 2.07
Qiannan Autonomous Prefecture356.68902.911313.465.55 2.35 1.88
Table 7. Carbon emissions per capita in various cities of Guizhou Province.
RegionPopulation (104 Person)Carbon Emissions per Capita (t·a−1·pp)
200920142019200920142019
Guiyang432.93462.18488.1911.6111.512.18
Liupanshui285.43288.99293.7312.1511.6312.31
Zunyi613.29619.21627.074.4256.11
Anshun230.04231.35235.315.917.188.39
Tongren309.63312.24316.883.514.495.17
Qianxinan Autonomous Prefecture281.02282.16287.176.928.729.04
Bijie654.57660.61668.612.332.823.18
Qiandongnan Autonomous Prefecture348.52348.54353.834.65.336
Qiannan Autonomous Prefecture323.51324.22329.216.116.547.48
Disclaimer/Publisher’s Note: The statements, opinions and data contained in all publications are solely those of the individual author(s) and contributor(s) and not of MDPI and/or the editor(s). MDPI and/or the editor(s) disclaim responsibility for any injury to people or property resulting from any ideas, methods, instructions or products referred to in the content.

