Article

Spectral Mixture Analysis (SMA) Model for Extracting Urban Fractions from Landsat and Sentinel-2A Images in the Al-Ahsa Oasis, Eastern Region of Saudi Arabia

Department of Geography, Faculty of Arts, King Faisal University, Al-Ahsa 31982, Saudi Arabia
Land 2023, 12(10), 1842; https://doi.org/10.3390/land12101842
Submission received: 10 September 2023 / Revised: 21 September 2023 / Accepted: 25 September 2023 / Published: 27 September 2023
(This article belongs to the Section Land – Observation and Monitoring)

Abstract

:
The rapid expansion of urban areas is a major driver of deforestation and other associated damage to the local ecosystem and environment in arid and semi-arid oases, especially in the eastern region of Saudi Arabia. It is therefore necessary to accurately map and monitor urban areas to maintain the ecosystem services in these oases. In this study, built-up areas were mapped using a spectral mixture analysis (SMA) model in the Al-Ahsa Oasis in the eastern region of Saudi Arabia by analyzing Landsat images, including Thematic Mapper (TM), Enhanced Thematic Mapper Plus (ETM+), Operational Land Imager (OLI), and Sentinel-2A images, acquired between 1990 and 2020. Principle component analysis (PCA) was used to build and select endmembers, and then SMA was applied to each image to extract urban/built-up fractions. In addition, this study also discusses the possible driving forces of the urban dynamics. SMA classification performance was assessed using fraction error maps and a confusion matrix. The results show that the Al-Ahsa Oasis’ urban area had been rapidly expanding during 2010–2020 with an expansion rate of nearly 9%. The results also indicated that the SMA model provides high precisions (overall accuracy = ~95% to 100%) for an oasis urban mapping in an arid and semi-arid region that is disturbed by the mixed-pixel problem, such as the Al-Ahsa Oasis in eastern Saudi Arabia.

Graphical Abstract

1. Introduction

Rapid urbanization has become a central issue in urban studies and policy decision-making processes, and as a result a lot of research in recent years has concentrated on its consequences and impact as well as its mapping. It has several impacts on the economy, society, and the environment. For example, urbanization has raised sea levels, degraded land for agricultural use, increased urban heat intensity, and accelerated the rate of deforestation [1]. Moreover, precise information about land use/cover features such as urban structures is considered one of the most critical elements for development worldwide [2]. The increase in population and rapid sprawl of cities is a severe environmental problem, mainly in arid and semi-arid environments where information about these issues is inadequate. Thus, recently, many researchers have focused on mapping and extracting urban or built-up areas from remotely sensed images.
In the Al-Ahsa Oasis—one of the most important date palm regions in the Kingdom of Saudi Arabia, which is located in the eastern part of Saudi Arabia (see Figure 1)—the accelerated economic development has led to increased urbanization, expanding both built-up and impervious surfaces. In this oasis, urban growth is a serious problem that threatens sustainable agriculture [3,4,5]. It is considered one of the oldest date palm (Phoenix dactylifera L.) sources worldwide that guarantees reasonable and sustainable revenue for the government and local farmers [4]. Nevertheless, the date palm plantations and their productivity in this oasis have been harmfully impacted by environmental factors such as soil salinity. During the recent decades, the rapid urbanization process significantly modified the oasis, specifically since the discovery of oil on 3 March 1938. For instance, human-induced factors resulting from activities such as urban development have also been affecting this ecosystem. Mapping and monitoring urban development by utilizing reliable approaches can reliably reduce these negative impacts of urbanization. Therefore, the development of methods to accurately map urban areas and monitor their growth is strongly required to provide accurate and up-to-date data regarding urban areas. Remote sensing data and techniques are among the rapid mapping methods that can be used for this purpose.
The availability of sophisticated techniques for spatially mapping urban areas has become one of the most challenging tasks due to several reasons, including a mixture of objects in one pixel [6] and the low resolution of the data available (e.g., Landsat satellite images). One way to map urban areas is to use remote sensing data and techniques and there has been considerable investigation regarding the mapping of urban areas from remote sensing imagery. Among many remote sensing techniques that are commonly used in the literature, spectral index [7] and spectral mixture analysis (SMA), which are commonly used for mapping and assessing land use/cover changes [6], can be used for mapping urban areas. For example, Bouzekri et al. [7] established a new spectral index to extract urban areas of Djelfa city, South Algeria from Landsat-8 (OLI). They concluded that the newly established index yielded satisfactory results compared with four previously used spectral indices, including the normalized built-up index (NDBI). The normalized difference built-up index (NDBI) and the built-up area extraction method (BAEM) were utilized in Lahore, Pakistan to extract information about built-up areas by analyzing Landsat-8 (OLI) images; the results indicated that the BAEM was superior, with omission and commission accuracies of more than 75% [8]. However, the study concluded that the accuracy of the examined methods declined with the use of Landsat-8 (OLI) data compared with Landsat (TM) images.
In 2020, Deliry et al. [9] evaluated the normalized difference built-up index (NDBI) and the normalized difference impervious index (NDII) with other classification algorithms, including a supervised object-based nearest neighbor (NN) classifier, supervised pixel-based spectral angle mapper (SAM), and the maximum likelihood classifier (MLC) to delineate and map impervious surfaces. They found that the NN classifier obtained satisfactory results compared to the other methods by achieving an overall classification accuracy of ~90%. Nevertheless, they demonstrated that accurate results could not be obtained using these methods without more training samples. The new automated built-up extraction index (ABEI) improved the accuracy in areas dominated by bright features such as bare lands, where high errors of classification are expected [10]; however, its accuracy can be affected by deep water bodies and in areas covered with dense vegetation canopies. Moreover, such techniques would not be suitable for extracting urban or built-up areas within a mixed cover.
On the contrary, SMA has been seen as an influential model applied for evaluating land use/cover changes in arid and semi-arid areas (e.g., [6,11,12,13]). For example, it produces extraordinary accuracies when applied to oasis vegetation mapping, particularly in arid and semi-arid areas, and substantially reduces mixed-pixel problems [11]. Furthermore, the results obtained from the SMA showed accurate and consistent outcomes regarding vegetation cover and soil surfaces, demonstrating the powerful effects of such technique in land cover/use mapping [14]. A subsequent study documented the usefulness of using what is known as “multiple endmember spectral mixture analysis (MESMA)” for vegetation mapping and assessment in urban areas by utilizing medium-resolution satellite imagery [15]. Another study, using a spectral unmixing-based method and statistical decision trees, found that vegetation–dark mixing line, tree, mixed grass, and vegetation ground cover fractions could be accurately separated with accuracies ranging from 80% to more than 94% [16]. These investigations together indicate that SMA can have positive effects on mapping and assessing land cover features such as urban from medium-resolution satellite images. Even though there is ample scientific literature addressing the mapping of urban areas from medium spatial resolution data using different spectral indices and classification techniques, the literature regarding the mapping of urban fractions using the SMA model has been largely neglected.
Furthermore, although significant progress was made in mapping and assessing land use/cover, including urban areas, from remotely sensed data with medium spatial resolution, there are few pieces of scientific literature in the popular databases that have used such a technique for mapping urban or built-up fractions in oasis environments [17,18]. However, to date, no research has mapped urban fractions in the Al-Ahsa Oasis based on the SMA model. Tooke et al. [16] noted the potential of the technique for investigating and mapping urban areas as long as 12 years ago following the use of endmember fractions in a study of extracting urban vegetation characteristics. Consequently, this study investigated the use of the SMA model to test its applicability to map urban fractions from Landsat and Sentinel-2A satellite images over an oasis environment. In addition, the study also examined the driving factors that stimulate urban growth against the dominant date palm surface cover of Al-Ahsa Oasis, eastern province of Saudi Arabia, by analyzing population data for the period between 1992 and 2016. The study hypothesized that SMA, with its ability to resolve the complexity of the mixed-pixel feature problem, would capture more urban fractions when applied in arid and semi-arid oases characterized by mixed land use/cover features from medium spatial resolution satellite images such as Landsat and Sentinel, and it would give results with high accuracy. The results represent an important step toward understanding how urban expansion can be accurately mapped.
This study is structured as follows. Section 2 provides a description of the study area. Section 3 explains the materials and methods used to apply the SMA model. The results are described and discussed in Section 4. Finally, the conclusions are given in Section 5.

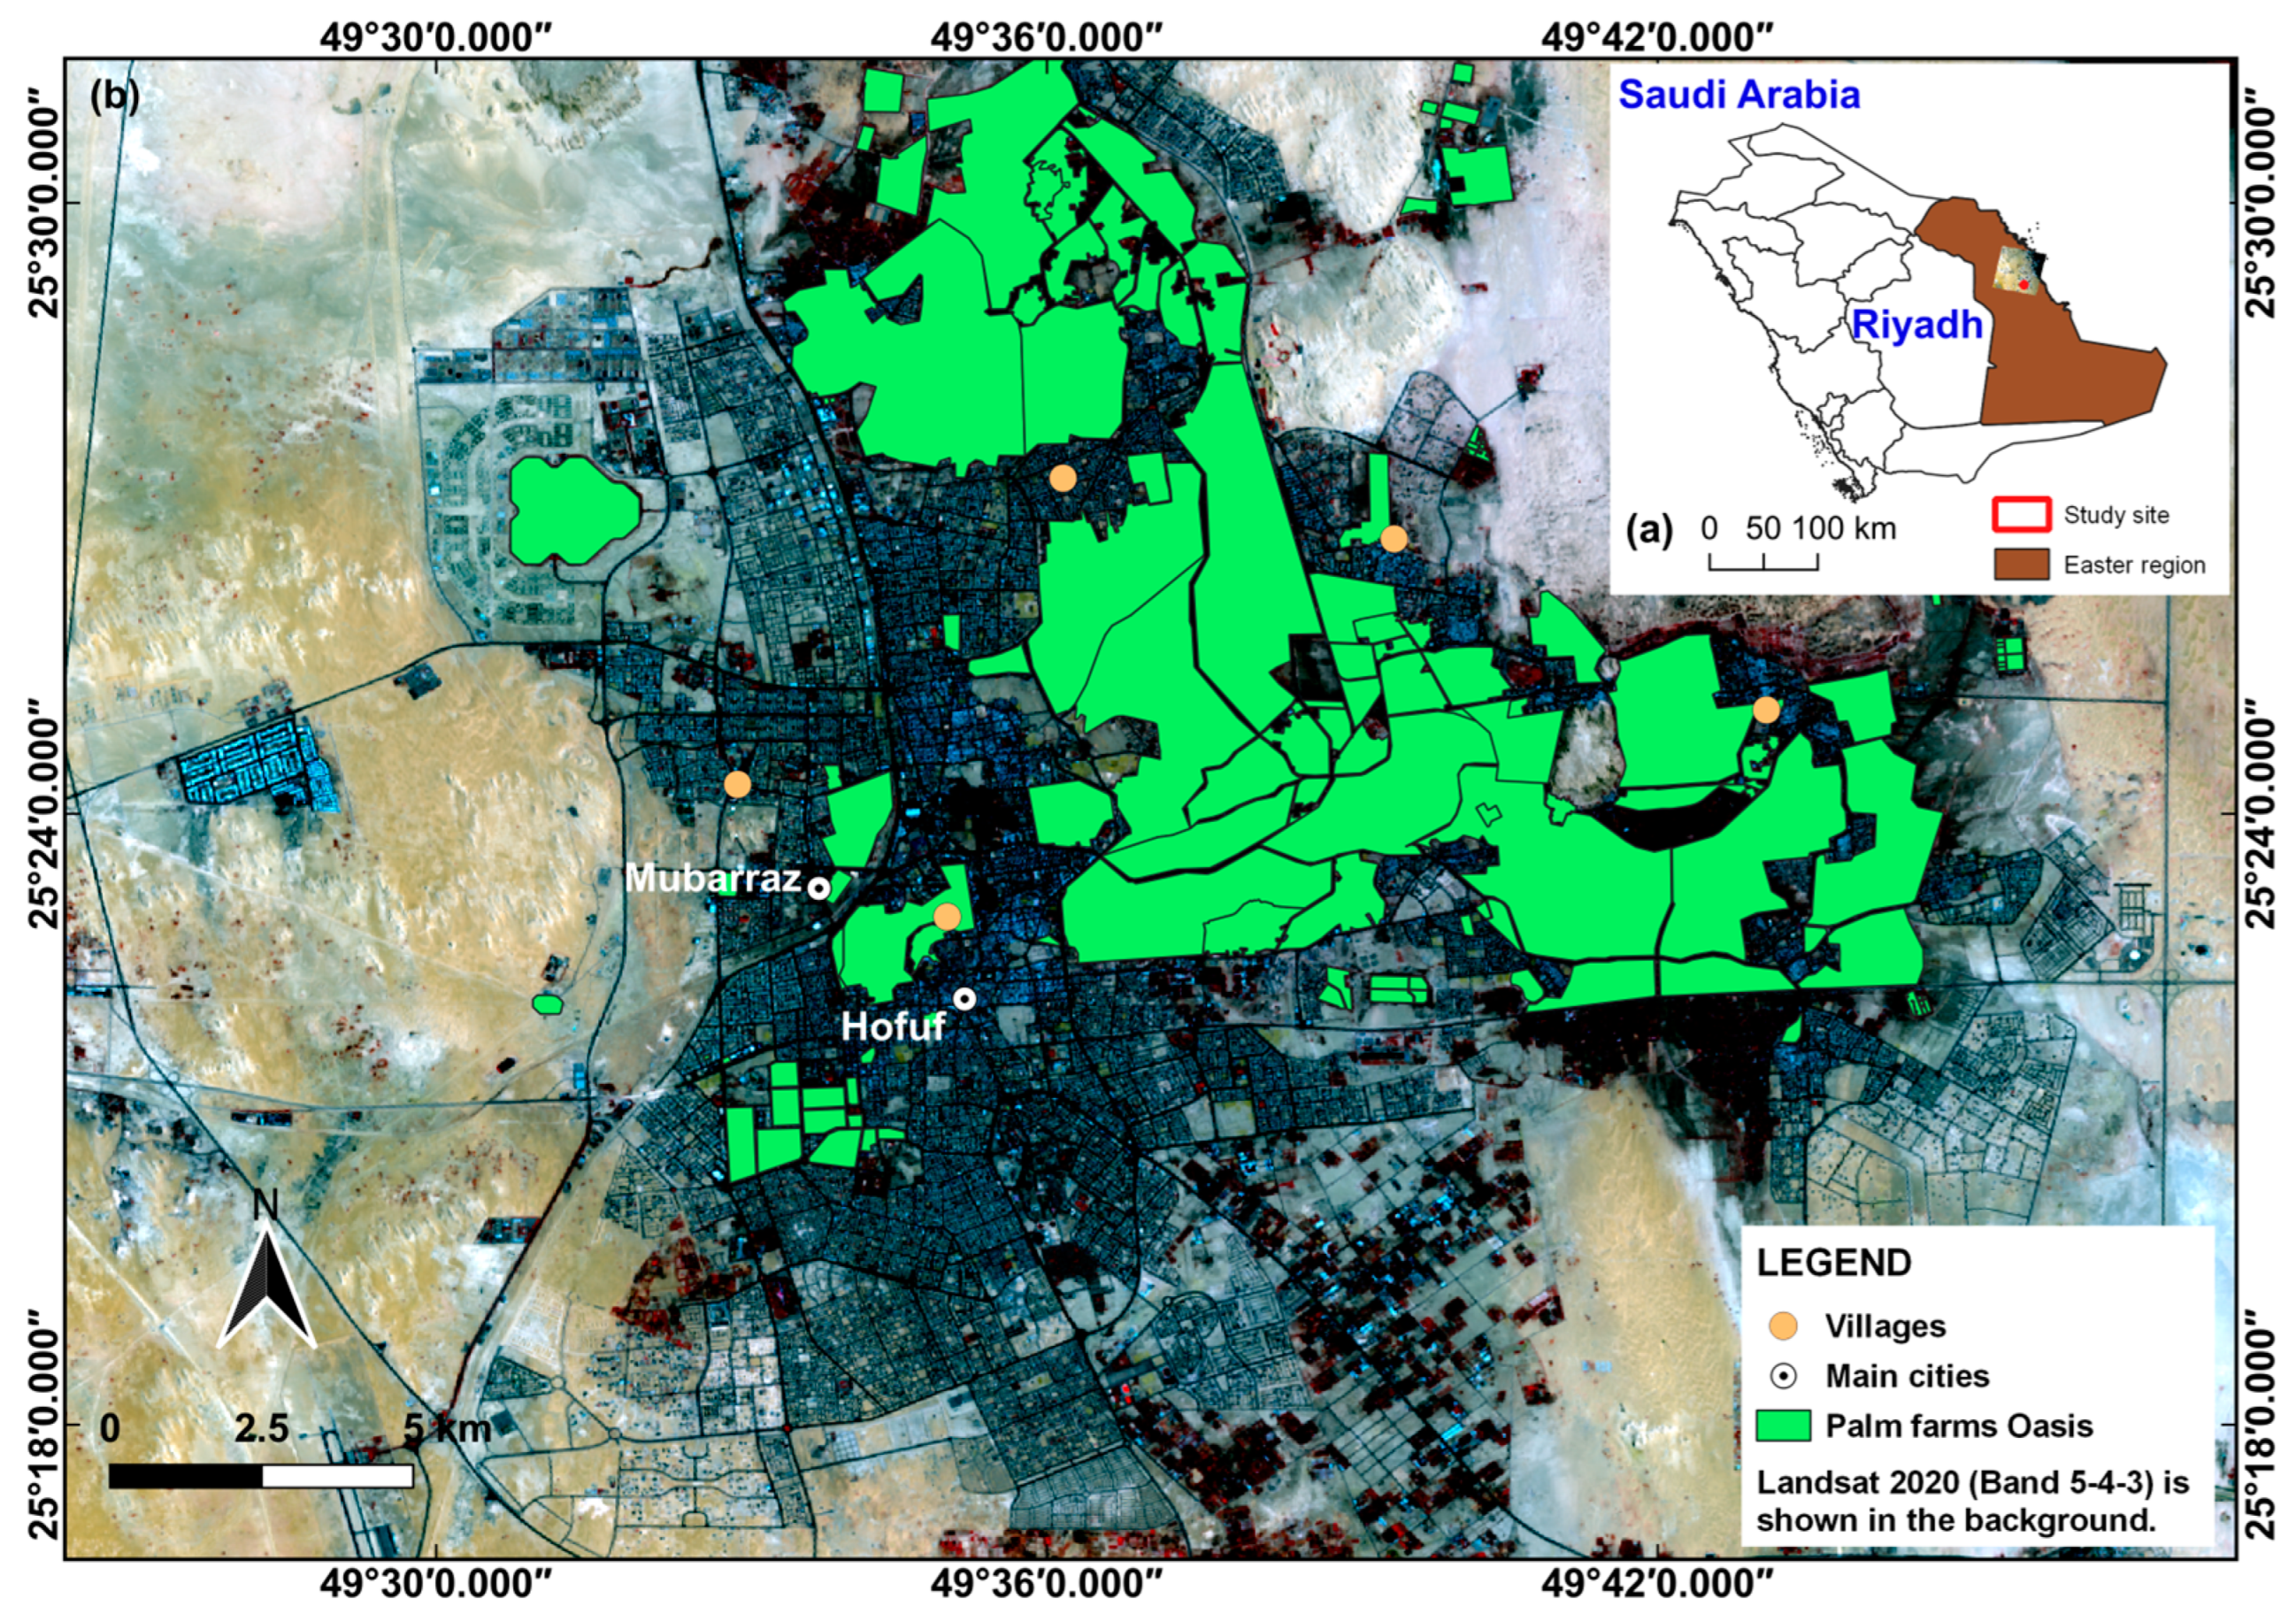
2. Description of the Study Site

The selected site is situated in the Al-Ahsa Oasis, eastern part of Saudi Arabia (between the latitudes of 25°20′ and 25°32′ N, and the longitudes of 49°30′ and 49°45′ E) (Figure 1). This oasis is classified as the biggest date palm region in the kingdom and worldwide—it covers around 8000 ha (i.e., 92%) of the land [19]. It is located 45 km inland of the Arabian Gulf coast and 320 km east of the Riyadh capital city. The topography is very gentle and features some prominent hills and ridges. The climate is dry and semi-arid, with annual rainfall of less than 46 mm, and the temperature varies between 40 and 45 °C in summer and 2 and 15 °C in winter. The elevation ranges from 130 to 160 m a.s.l. from the west to the east [20].
Two main cities, namely Hofuf and Al-Mubarraz, feature all kinds of human activities and nature of land use/cover with a population number of 660,788 [21]. The Al-Ahsa Oasis is truly classified among the most treasured agronomic sources in the Kingdom of Saudi Arabia, where 92% of its area is occupied by 40 distinct cultivars of date palm trees [22,23]. The economic importance of the oasis is robustly linked to food production, so that comprehensive agro-activities are experienced, including varied agro-products. The alteration in agricultural activity concepts has converted the oasis’ agricultural nature into a cultural as well as natural heritage form of landscape, which has led to a severe infringement of new surface cover features against the date palm trees. Such new surface cover features, set up in terms of the components of urban sprawl, have been progressing throughout the evolving phase between 1973 and 1994 correlating with fast growth in the region’s population [5]. It was notable that in order to meet the intensifying traditional and social needs, the oasis’ population started establishing leisure residences inside/underneath the canopies of the date palm trees. Ultimately, these activities have diversified the oasis’ sole surface cover into compound features, initiating some kind of inadaptability for medium-resolution satellites to accurately distinguish the built-up from the cultivated areas [24].

3. Materials and Methods

3.1. Datasets

3.1.1. Landsat Images

The methodology relies on four Landsat and two Sentinel-2A Level 1C images. The Landsat images were freely downloaded from the United States Geological Survey (USGS) Earth Explorer open-access platform (http://earthexplorer.usgs.gov/, accessed on 12 December 2022). The images were acquired with different sensors, including (TM, ETM+, and OLI), for the years 1990, 2000, 2010, and 2020. All the images were cloud-cover-free and mostly obtained between June and August. Moreover, all four images were obtained as level 1 products; their characteristics are displayed in Table 1.

3.1.2. Sentinel-2A Images

Two Sentinel-2A images with minimum cloud coverage, provided by the European Space Agency (ESA), for the years 2015 and 2020 were selected and downloaded from the Copernicus Open Access Hub website (https://scihub.copernicus.eu/, accessed on 9 December 2022). The 2015 image was obtained as a Level 1C product, while the image from 2020 was obtained as a Level 2A product (bottom-of-atmosphere reflectance), which is a ready data product for analysis, as no additional preprocessing is required. The spatial resolution of the obtained images ranges from 10 to 60 m, depending on the band. Table 1 provides the characteristics of the acquired images.

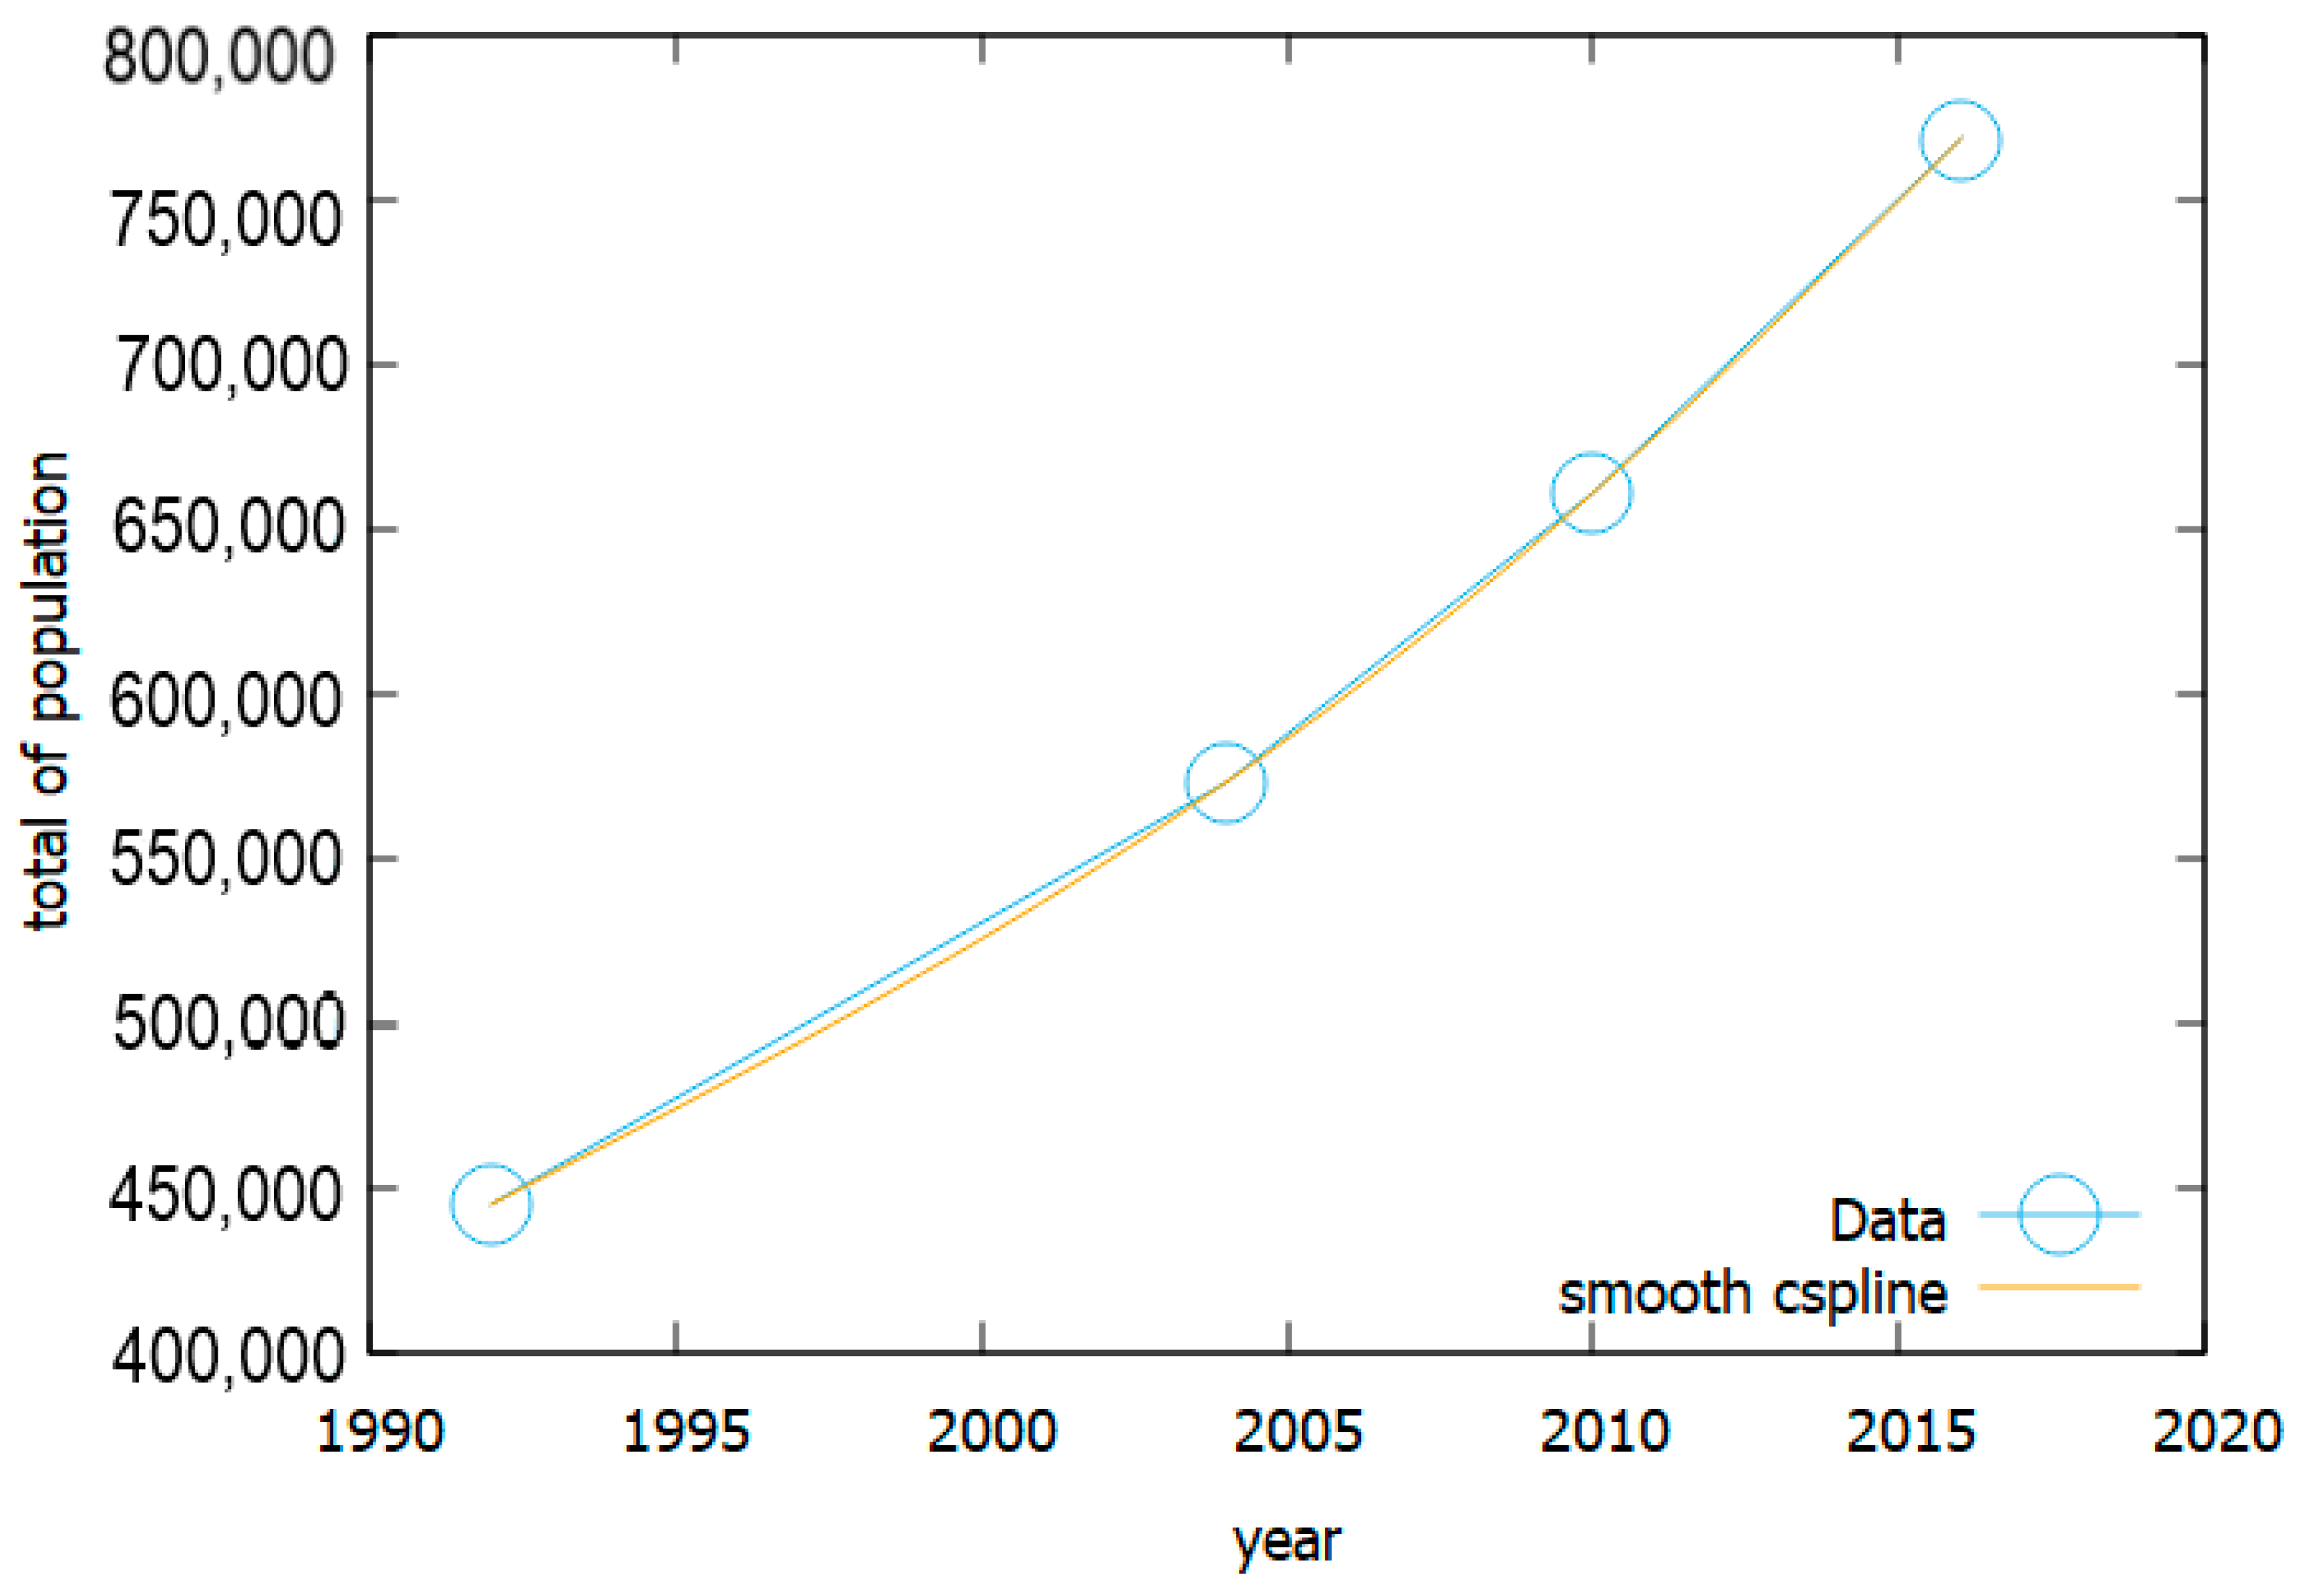
3.1.3. Population Data
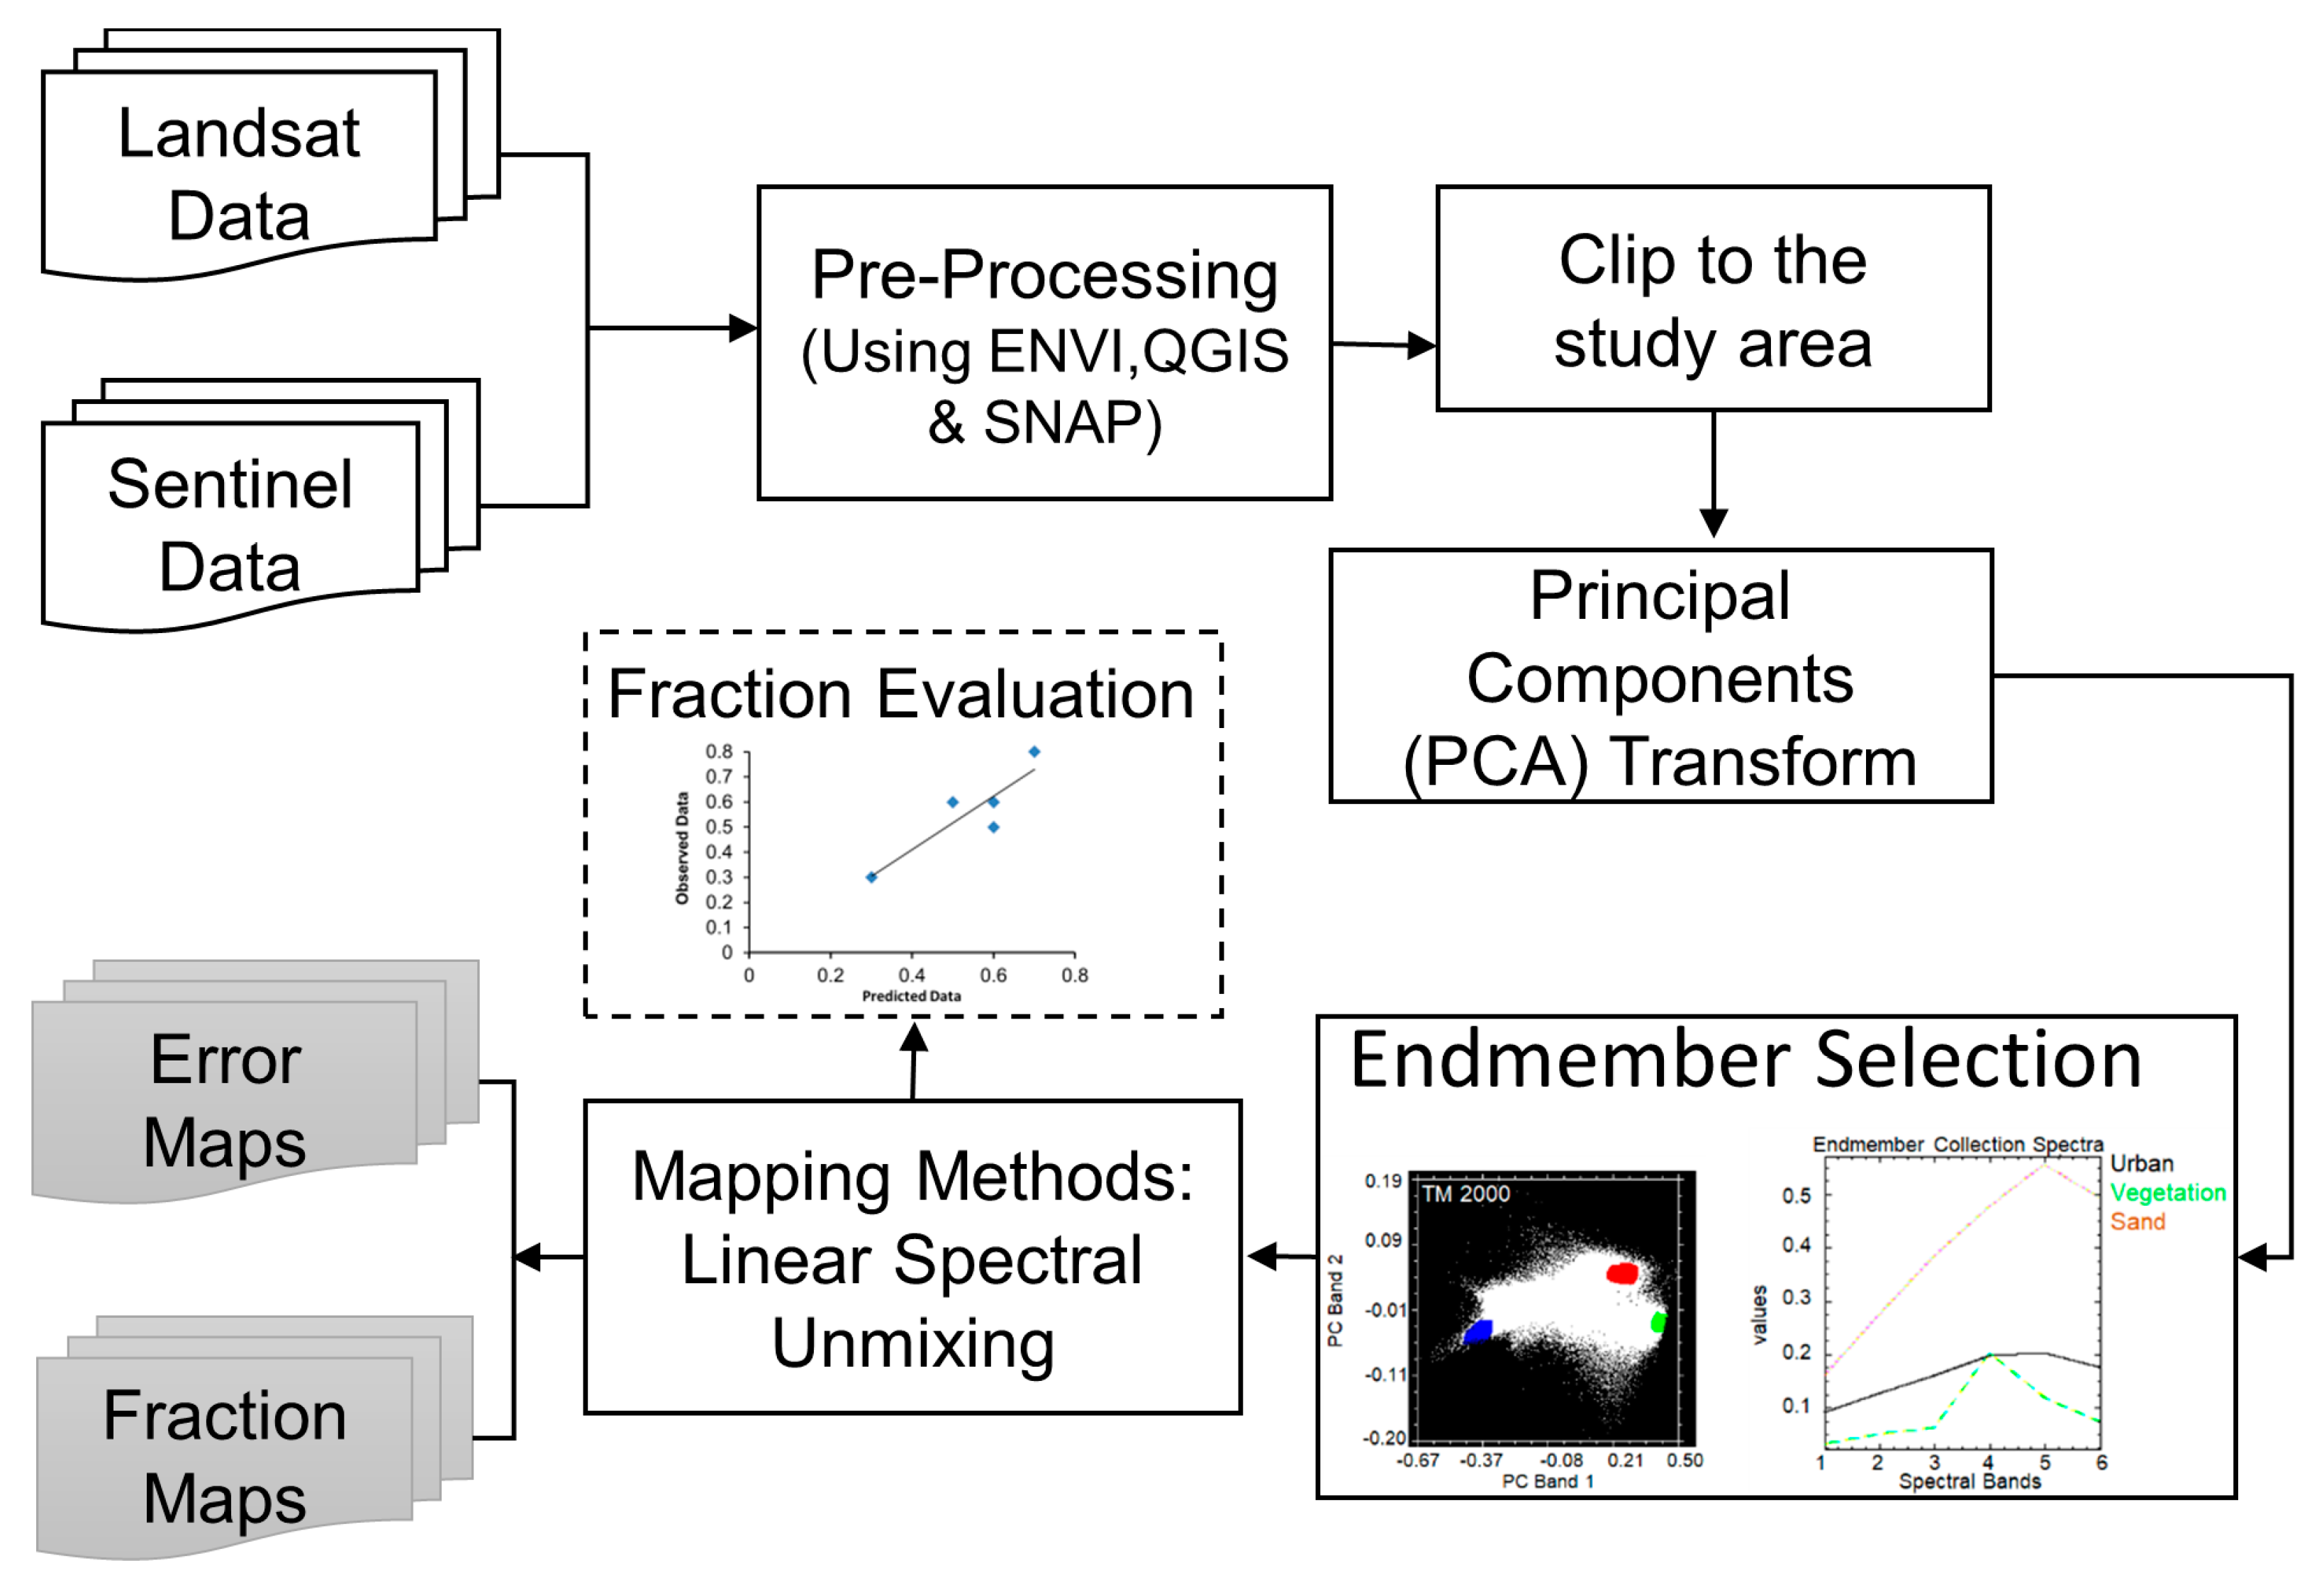
Population data were obtained for the period from 1992 to 2016 from the Saudi General Authority for Statistics [21]. These data were used as part of the driving forces of urban development at the site, and to show to what extent the growth in inhabitants can accelerate the growth of oases’ urban structures as well as the growth in cities.

3.2. Methodology

The aim of this study is to use the SMA model, Landsat, and Sentinel-2A images for mapping and assessing the fraction of pixels related to urban/built-up in the Al-Ahsa Oasis. The methodology had four main parts: The first part concerned the collection of the images; the second part included the preprocessing of the satellite images, which included radiometric and atmospheric calibration to ensure spatial and spectral consistency between the multi-date images. The third part included image transformation using principle component analysis (PCA) and endmember selection. The last part included the extraction and mapping of urban fractions from the Landsat and Sentinel-2A images by using linear spectral mixture analysis. Figure 2 presents an overview of the methodology. All Landsat images were preprocessed and analyzed using QGIS version 3.18, and ENVI version 5.1 softwares, while the Sentinel-2A images were preprocessed using SNAP version 9.0 software.

3.2.1. Preprocessing of Images

The Landsat images were calibrated using a Semi-Automatic Classification Plugin (SCP) [25] based on the QGIS software environment, where the sensor’s digital numbers (DN) were converted into at-surface spectral reflectance. On the other hand, the Sentinel-2A image of the year 2015 was converted from a Level 1C top-of-atmosphere (TOA) image to a Level 2A bottom-of-atmosphere (BOA) image using the Sen2Cor tool version 2.11 in SNAP software, version 9.0. All the datasets were georeferenced to the Universal Transverse Mercator (WGIS-84) zone 38 north projection. For the purpose of this study, all spectral bands with a resolution of 10–20 m were chosen, and by using SNAP software, the 20 m resolution bands of Sentinel-2A images were resampled to 10 m spatial resolution.
A sub-scene depicting the study site, shown in Figure 1, was selected and cropped from the Landsat and Sentinel-2A images; next, a false-color band composite was constructed.

3.2.2. The Oasis’ Urban Area Extraction Using SMA

As remotely sensed images depicting arid and semi-arid surface features are available at medium or coarse spatial resolution, one pixel contains mixed spectral information. To solve this problem, the SMA model was used as it has proven to be a powerful method of image classification [26]. It is a sub-pixel classification method used by remote sensing experts to address the mixed-features problem by un-mixing them into fraction abundance. It is therefore useful for identifying ingredients that cover superior areas such as urban/built-up, vegetation, or both, that are always mixed with other materials, especially in arid and semi-arid environments, which may make its classification harder.
The SMA transforms the image’s content from reference into limited endmember fractions [26]. These fractions characterize the mixing quantities of these endmembers [27]. For detailed information about SMA, previously published studies are strongly highlighted (i.e., [13,14]).

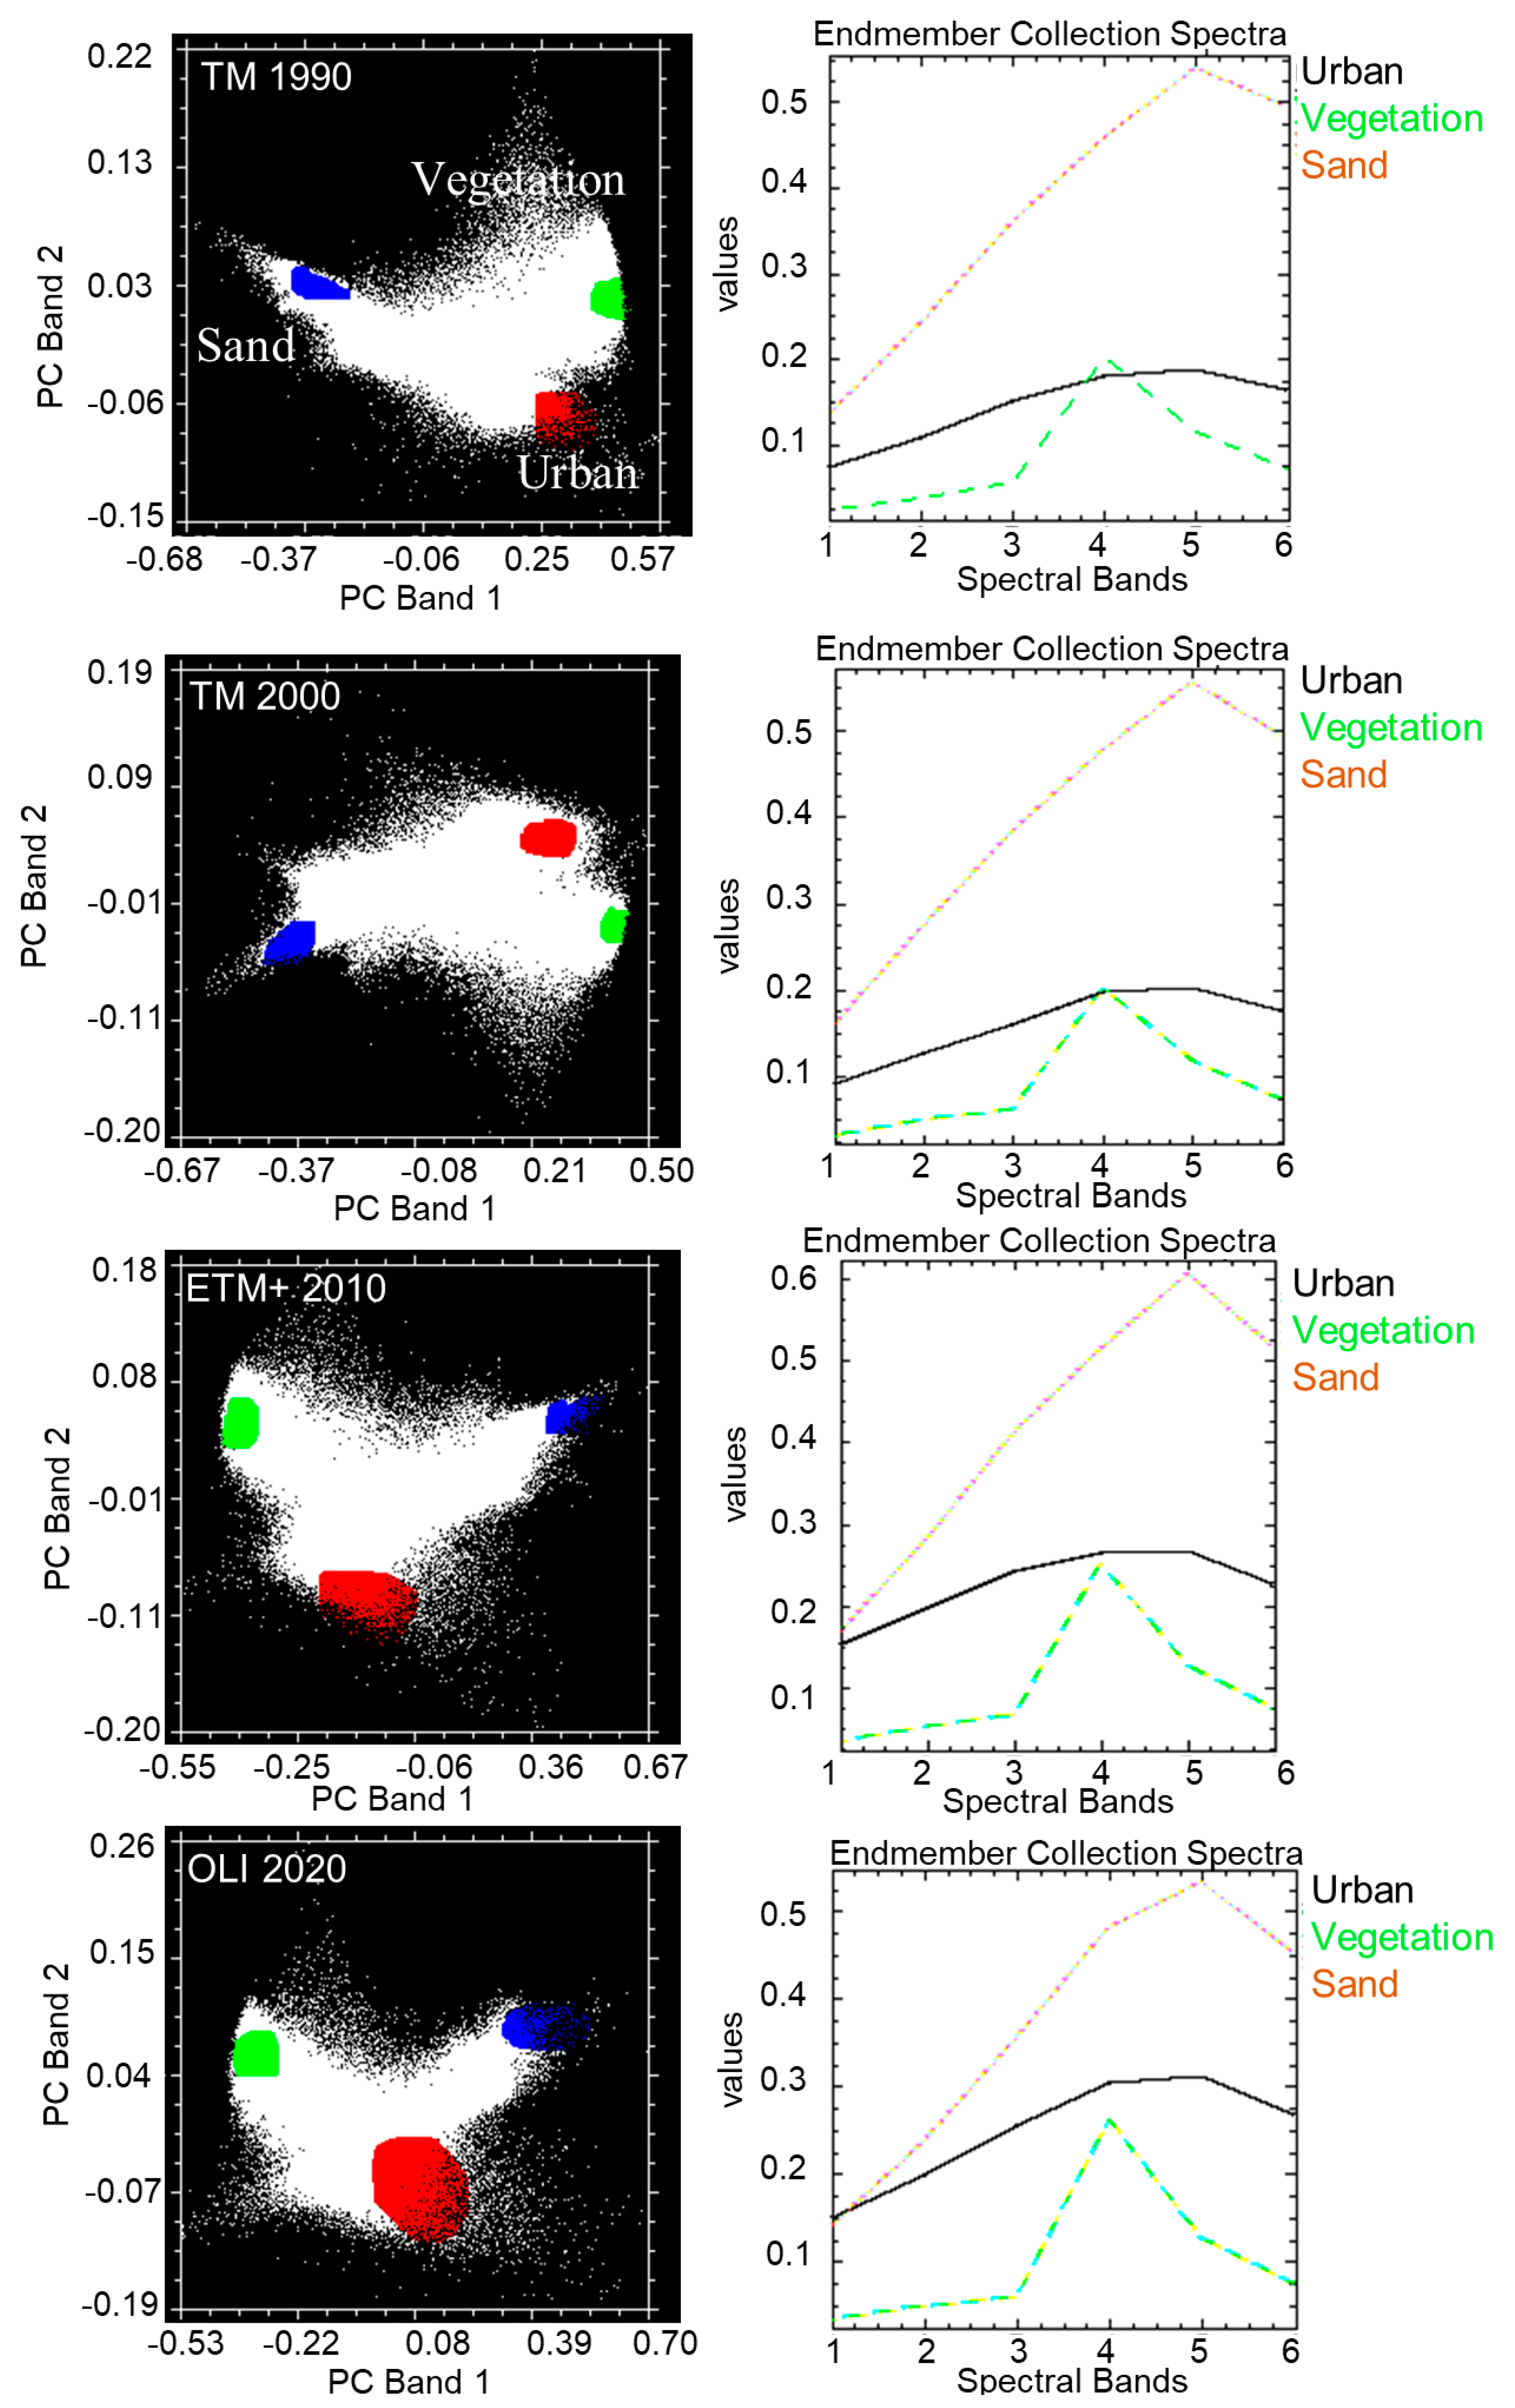
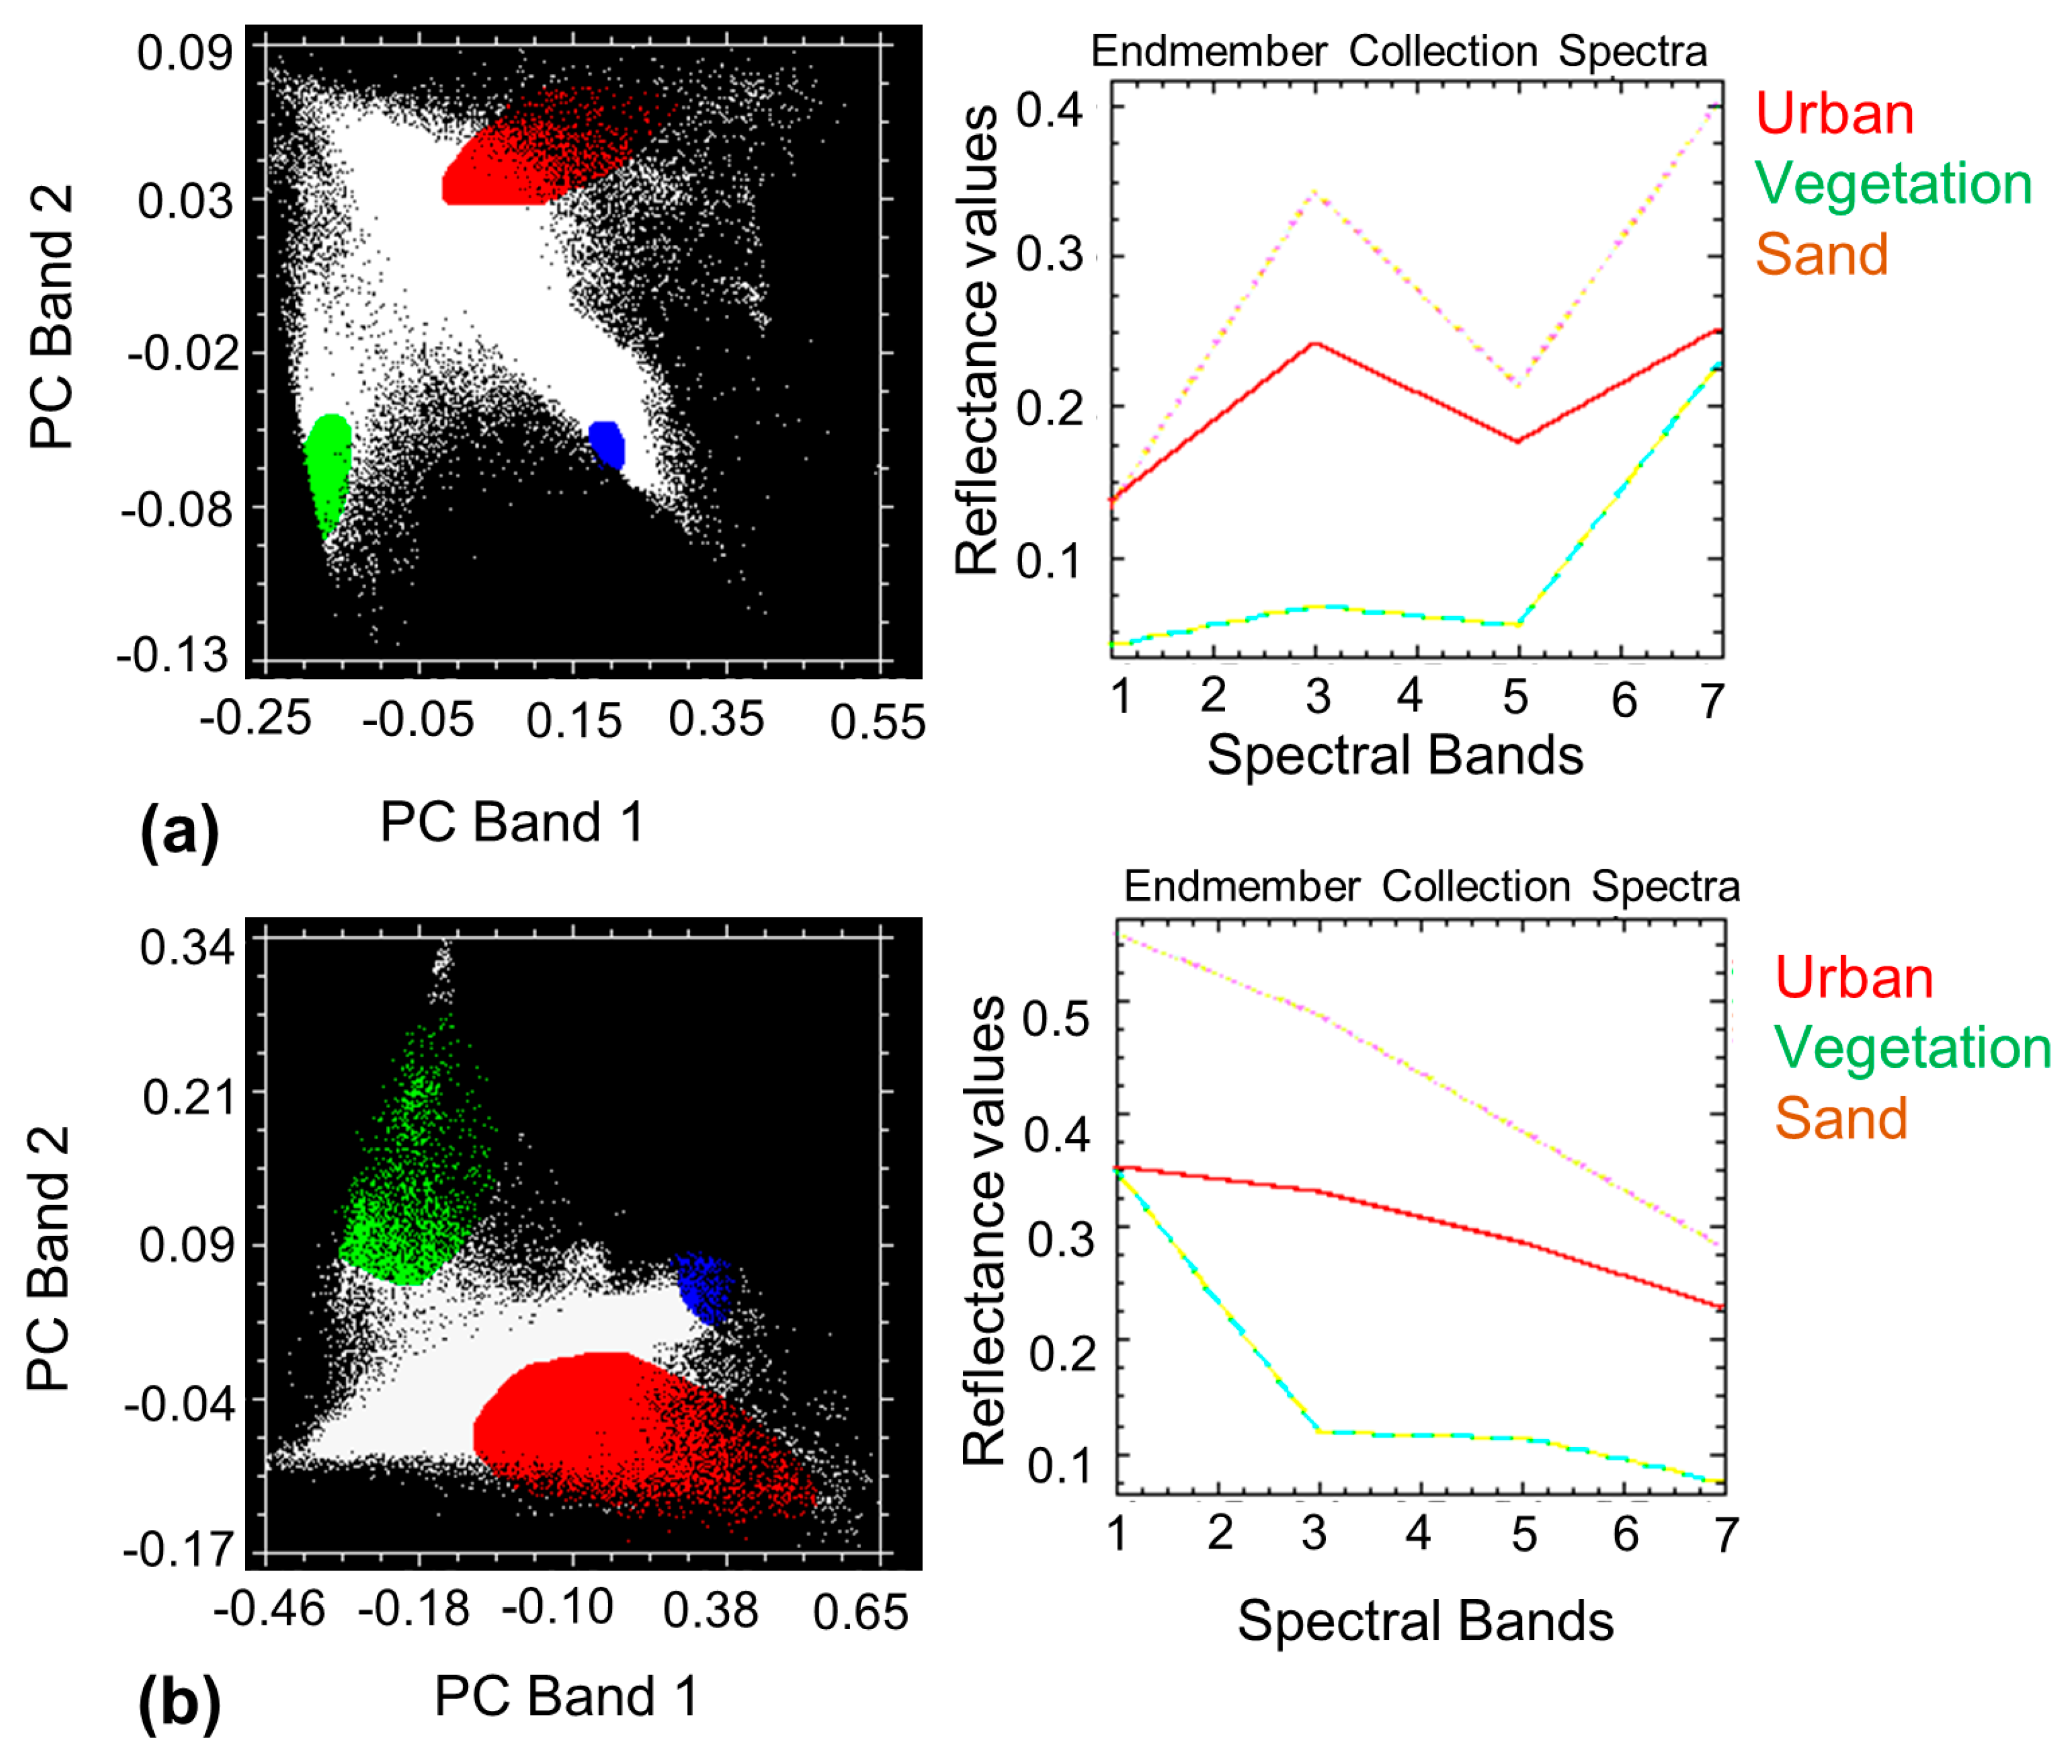
3.2.3. Endmember Selection

In a remote sensing image, when a pixel contains a reflectance of one land cover/use feature then that pixel contains a pure pixel and is therefore referred to as an endmember. Hence, endmembers are prerequisites to utilize the SMA model [11]. Here, image endmember extraction was used to identify the specific endmembers of multiple surface components by utilizing the transformed PCA images. The PCA was applied to the Landsat and Sentinel-2A data by utilizing ENVI software. The PCA transform tool was used to reduce the image dimensionality. Other image transformation is also practical such as minimum noise fraction (MNF) [11,28]. In this study, orthogonal linear plots were created using the first, second, and third PC bands, as described previously [12,13,14,29], in which the apexes of the plots were chosen as pure endmembers based on the original images’ visualization. Using the obtained pure endmembers, the SMA was applied in the ENVI software environment for generating the urban fractions with a “sum to unity constraint” where the summation of the endmember fractions for every pixel equals 1.

3.2.4. Accuracy Assessment Methods

The SMA’s accuracy can be assessed by comparing field ground points with image fractions of land cover in linear plot correlations [12]. In the present study, however, owing to limited financial resources and lack of field devices (such as spectroradiometers, which can be utilized to quantitatively assess the correctness of the SMA results), a confusion (error) matrix as an effective approach to measure urban fraction classification accuracies based on remote sensing images was applied using a stratified random sampling approach. An image from Google Earth Image Pro, taken on 9 May 2023, was used for sampling. For this purpose, 100 points were randomly collected from urban and non-urban areas (i.e., vegetation or bare soil). Previously, several studies have recommended the use of “quantity disagreement and allocation disagreement” to assess the accuracy of image classification [30,31,32]. Nevertheless, in the current study, and according to the method described by Congalton and Green [33], the overall accuracy, producer accuracy (PA), and user accuracy (UA) were calculated, in addition to errors of omission and commission, as described previously [30] to assess the SMA model’s classification accuracy.

3.2.5. Driving Forces of Urban Fraction Dynamics

The focus of this section is to discuss the key driving causes behind the urban expansion in the area of study during the study period. For this purpose, population data ranging from 1992 to 2016, provided by the Saudi General Authority for Statistics [21], were collected and analyzed. The population data were analyzed using Excel software version 2010.

4. Results and Discussion

4.1. Endmember Spectra and SMA

In all images, the first three PCs (principal components) explained about 99% of the total disproportion in the study site. Hence, three endmembers were manually selected from each Landsat and Sentinel-2A image based on the PCA 2D scatter plot (also called feature space). The selected endmembers included vegetation, urban structures (built-up), and sand features (Figure 3 and Figure 4); however, the analysis only focused on urban feature extraction. The reflectance of urban feature spectra was found higher at bands 4 and 5 in all images, suggesting very low reflectance of urban fractions in other spectral bands in both Landsat and Sentinel-2A sensors.

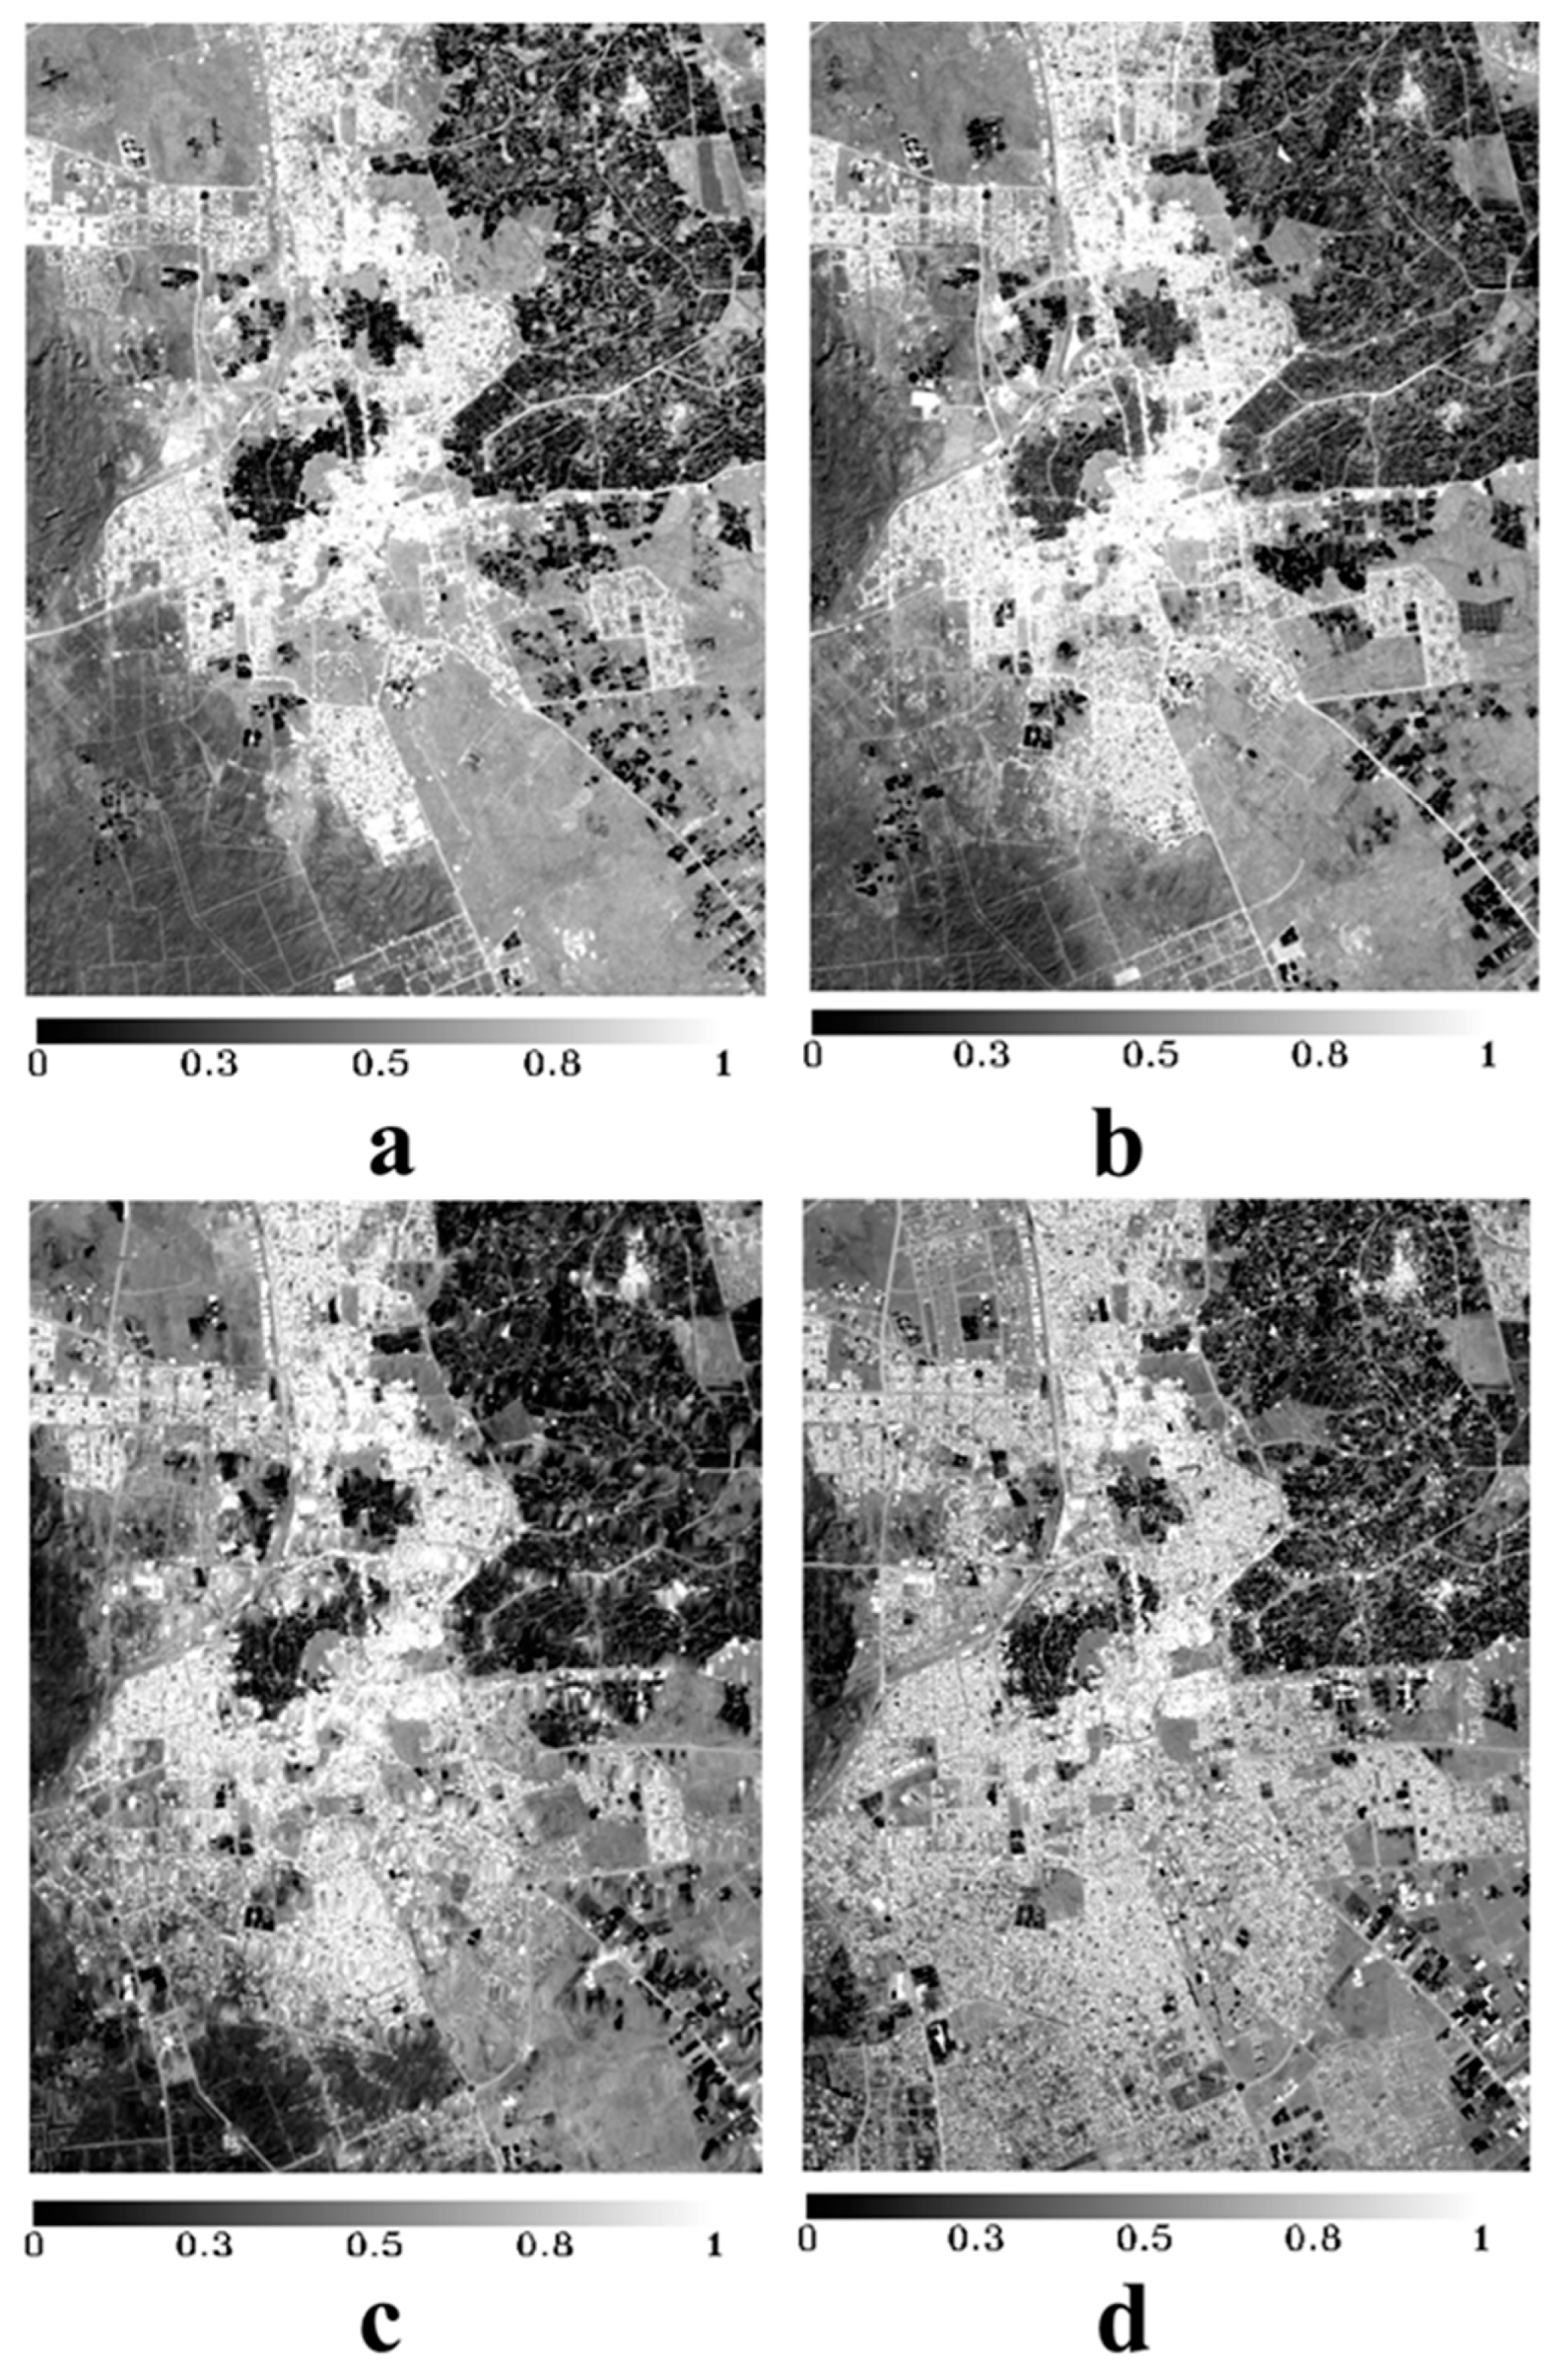
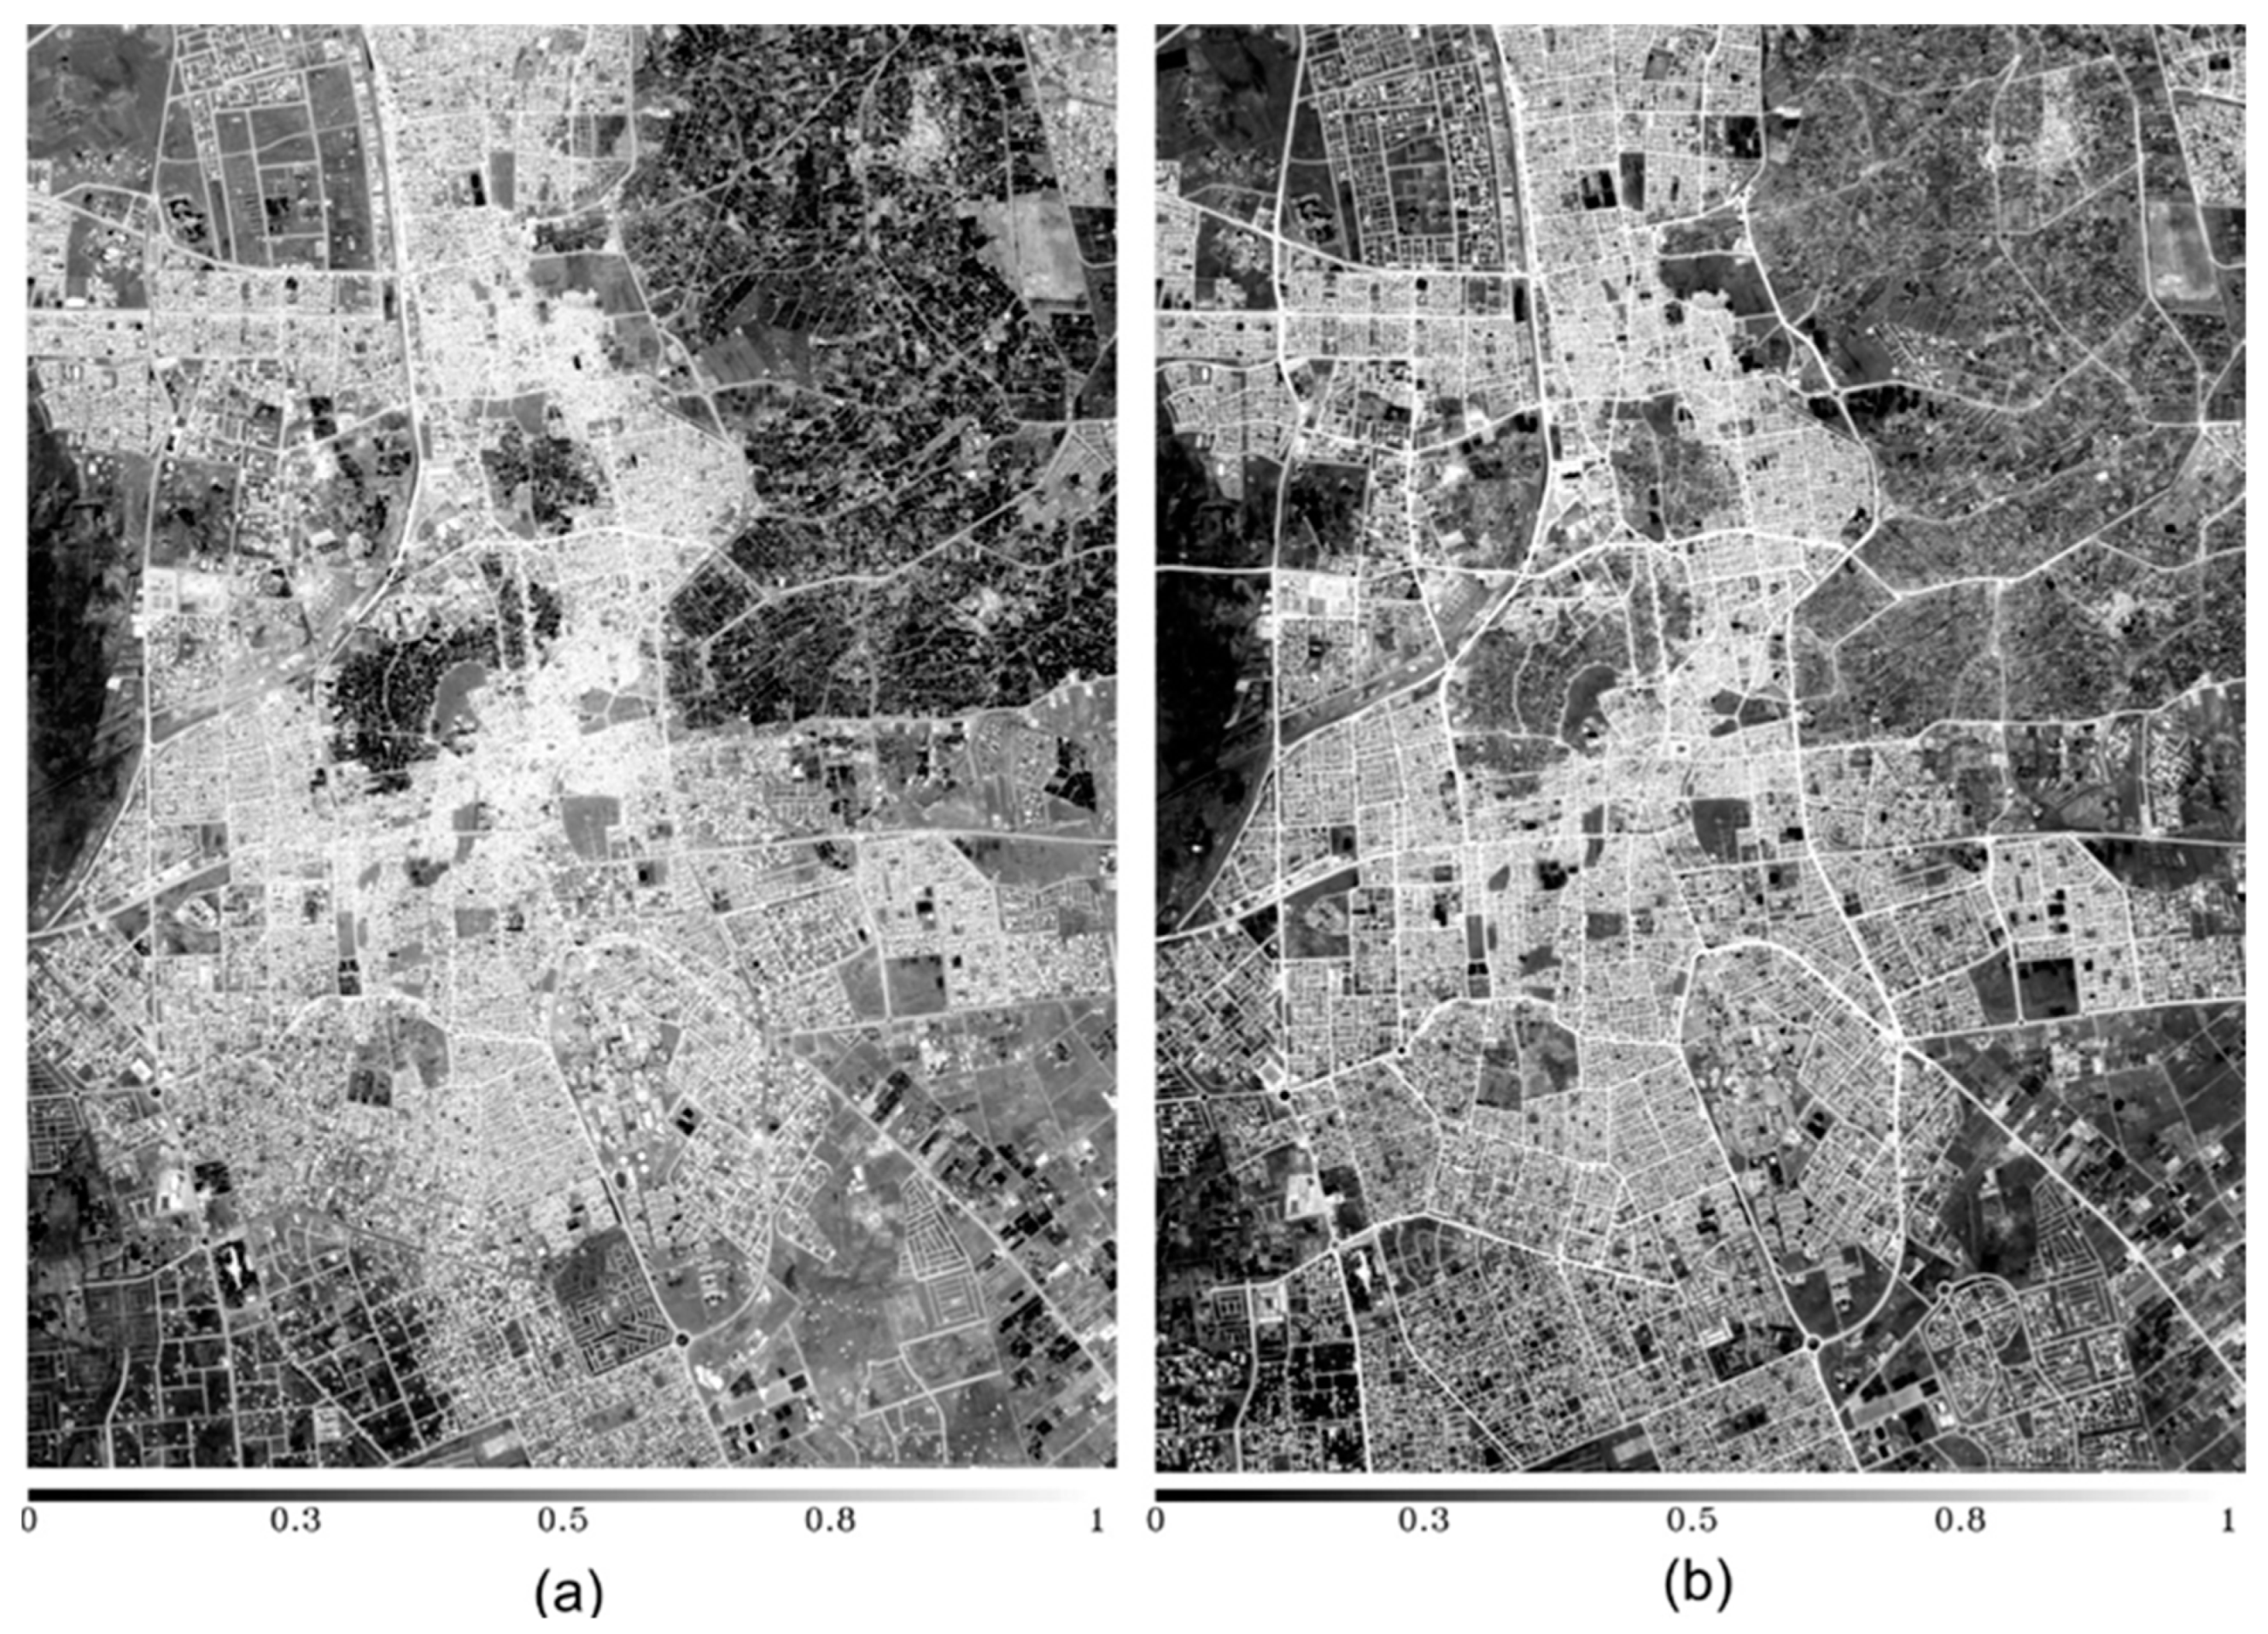
4.2. Urban Fractions

The SMA was applied to accurately map urban fractions in the Al-Ahsa Oasis over different periods from two types of sensors namely, Landsat and Sentinel-2A. The fractions of urban endmembers for these two sensors are presented in Figure 5 and Figure 6, respectively. The urban fractions are represented by brighter pixels (high fraction), while other darker pixels (low fraction) represent other cover fractions (i.e., vegetation, sand dunes/sheets, and water bodies). The resulting fraction images (Figure 7), supported with visual interpretation, indicated that the urban fraction has increased in the study site during the period from 1990 to 2020. This increase in urban areas likely may mainly be attributed to population increases due to many factors, including oil discovery. The increase in urban fractions is mainly concentrated in the northern and southern parts of the study area as the other parts are either covered by date palm plantations or sand dunes/sheets. The percentage of the urban fractions analyzed from the Landsat sensor was 0.29 for the year 1990; 0.38 for the year 2000; 0.38 for the year 2010; and 0.59 for the year 2020, while for the Sentinel-2A sensor it was 0.58 for the year 2015; and 0.74 for the year 2020. These results indicate that urban growth was rapidly taking place in the study area at an increasing rate (0.09) during the years 1990, 2015, and 2020 (see Figure 7 and Table 2). The information given in Figure 7 shows that the urban areas increased significantly between 1990 and 2020. These results show the capabilities of the SMA model in calculating the abundance proportion of urban fractions in an oasis environment dominated by mixed features such as date palms, sand dunes/sheets, built-up, and water bodies. Moreover, these results are in agreement with a study conducted by Alqahtany [34] who demonstrated an increase in the settlement in the Al-Ahsa Oasis, where the urban area has significantly increased from 199 km2 to approximately 276 km2 between 1992 and 2022. The same study predicted an increase in the area covered by settlements to approximately 27% in the year 2032. Furthermore, these findings extend those of Allbed et al., confirming that an increase in the urban areas might be explained by a decrease in the vegetation cover where, according to their study, the vegetated areas decreased by approximately 3% between 1985 and 2000 [35].
Moreover, a research study carried out by Rebecca et al. [36], in which a multiple endmember spectral mixture analysis (MESMA) was utilized to map the apparent components of urban areas in Manaus city in Brazil, made use of ETM+ imagery. The achieved fraction models were used to produce continuous per-pixel abundance maps for each generalized land-cover component. This study demonstrated the high potential of moderate-resolution multispectral images for mapping and monitoring the evolution of a physical urban environment.
Another study by Dengsheng and Weng [37] also confirmed that the SMA was an efficient technique for depicting the patterns of urban landscapes, as the SMA involved crucial techniques for image processing and providing an appropriate model to deconstruct the spectral mixtures of coarse resolution data. Their work indicates that the SMA method was appropriate for solving the problem of mixtures within the low-resolution data, and produced enhanced classification outcomes for the urban environments compared to traditional pixel-based maximum likelihood classifier or the spectral indices. As a result, the SMA “fraction images” might likely have a very good classification level improvement once jointed with other factors, such as temperature, in addition to other GIS auxiliary information and other socio-economic parameters.
The RMS error of the SMA fraction images ranged from 0.006 to 0.013 (Table 2). This RMS error was calculated for each pixel of the analyzed Landsat and Sentinel-2A images. A low RMS residual error suggests a high performance of the SMA model for urban classification, especially in arid and semi-arid environments, where a smaller RMS indicates pure endmembers and accurate fractions.
Figure 8 depicts an instance of the areas in the study site that are dominated by a high and low error of urban classification. By making use of the visual interpretation, it can be seen that the areas with high error are covered by urban structures surrounded by date palm plantations. The urban fractions within these plantations are characterized by significant bright textures as they have different spectral reflectances or different signatures. Therefore, to obtain more accurate urban fraction images with the SMA model, the water regions and bright pixels should be masked out before mapping urban fractions.
An increase in urban areas in the Al-Ahsa Oasis was also reported by many previous studies. For example, Almadini and Hassaballa [4] found that the urban area had expanded by approximately 3200 ha during 1999 and by nearly 1270 ha in 2017. These increases took place upon barren lands and the oasis’ vegetation cover (mainly date palm plantations). A substantial decrease in the vegetation cover and barren soil besides an increase in the urban area was detected between 1990 and 2020, because of the growth of the population all over the study site, which is possibly due to oil industry production as previously reported [19]. A reduction in vegetated cover by nearly 17% because of the rapid increase in urban development (more than 17% in 1990 to approximately 46% in 2020) was also reported in the same study. A close relationship was found between development of transportation and urbanization; in addition, road expansion and its directions may have affected the morphological shape of the cities in the study site [38,39]. Furthermore, urban growth was not just a result of population increase; it was also a result of sustainable development [38]. For example, the road network in the study area—as one of the sustainable development options—covered about 36 km2 in 1996 within the study area, while currently it covers about 48 km2 [38].

4.3. Accuracy Assessment

Table 3 and Table 4 present the confusion matrices obtained after applying the SMA model to map the urban feature fractions. The overall accuracy of the final urban fraction maps varied from 95% to 100%, and the user’s and producer’s accuracy ranged from 91% to 100%. The values of the omission and commission errors ranged from a min. value of 0 for all fractions to max. values of 9.1 and 10, respectively (Table 3 and Table 4). By and large, these results demonstrate a significant correlation between urban fractions and the reference points, demonstrating the advantage of using the SMA model for urban analysis, mapping, and assessment, especially in an oasis environment where mixed features are dominant. According to this accuracy, no pixel was misclassified; this may have two explanations. Firstly, SMA is a highly sensitive model for extracting and mapping land cover, such as urban fractions, by using pure endmembers collected at the sub-pixel level with spatial and spectral variability. Finally, however, this can illustrate the drawbacks of the methods used to check the accuracy of the SMA model, the confusion (error) matrix, as previously mentioned by several scholars (e.g., [30,31,32]), where they recommended using “quantity disagreement and allocation disagreement” to evaluate image classification accuracy.

4.4. Driving Forces and Consequences of Urban Fraction Changes

The major driving forces of urban changes in the study area must have been due to human activity and population increases, since oil discovery on 3 March 1938. Figure 9 shows areas that were covered by agricultural lands in 1990 and transformed for urban use in 2020. A rapid shrinkage of agricultural lands and vegetation cover in general, which is mainly dominated by seasonal crops and date palm plantations, was noted after 1990. However, the visual analysis of urban fraction images indicated that major changes in the urban fraction generally implied its increase from 1990 and 2010 to 2020. In particular, an increase in urban areas was found in the year 2020, and this increase almost concentrated in two directions: north and south. The reasons behind this concentration, according to the images’ visual interpretation, are that in the east direction, the area is surrounded by sand dunes/sheets, while in the west direction the area is dominated by date palm plantations. Therefore, most of the built-up expansion was found toward the northern and the southern parts where the area is dominated by bare soil, crops, or both. Eventually, an increase in the urban fraction because of high agricultural practices was observed between 2010 and 2020 in a large southern part of the study site. This claim was supported by the recent study of Almadini and Hassaballa [4], (cf. Figure 4 and Figure 5 in their study). They reported that “between 2013 and 2017, approximately 1270 ha of the vegetated area in the Al-Ahsa Oasis was replaced by urban uses”. By contrast, an increase in other land cover classes, such as bare lands, was observed and concentrated in the eastern and western parts of the study site. Mohammed and Elhadary [38] offered another reason for urban expansion by demonstrating that the increase in urban cover over the Al-Ahsa Oasis may have resulted from oil and gas exploration since 3 March 1938 and other industries, such as road network development.
Moreover, the information given in Figure 10 shows that the population in the study area increased significantly during the period from 1990 to 2020, and according to Abdelatti et al. [24], the population of the Al-Ahsa Oasis (see Figure 10) has apparently doubled since the oil discovery, and this increase in population might have contributed to the current urban growth as a main driving force. They concluded that the increase in urban areas might increase what is known as dark surfaces, and consequently, it may increase land surface temperatures and urban heat islands as documented recently by Hassablla and Salih [19].

5. Conclusions

This study used the SMA model, Landsat, and Sentinel-2 images to map urban/built-up fraction covers in the Al-Ahsa Oasis, eastern Saudi Arabia. The SMA classification error was evaluated using error fraction images and a confusion matrix. The SMA is a helpful model for extracting an oasis’ urban fraction by using pure endmembers which are extracted from transformed PC images. The overall accuracy, producer’s and user’s accuracies, and omission and commission errors of the SMA model vary from 93 to 100, 86 to 100, 100, 0 to 100, and 0 to 14, respectively. The results indicated that urban areas increased rapidly between 1990 and 2020 at the expense of agricultural lands. The analysis procedure used to collect the training datasets (i.e., endmembers) to train the SMA model is what makes this model suitable for urban mapping compared to other classification methods and spectral indices (e.g., maximum likelihood classifier and built-up spectral indices). It provides pure signatures (i.e., endmembers) for different land cover types. By utilizing these endmembers, the SMA model has the ability to map land cover features (fractions) such as urban/built-up fractions with high accuracy especially in arid and semi-arid areas in which images with mixed-pixel problems are dominant. Although a straightforward analysis procedure was presented, which enables the accurate mapping of urban fractions, the present study shows that urban areas surrounded by other types of land cover can increase the mapping error. Future investigation efforts will require an enhanced understanding of elements that control urban expansion. In particular, these efforts could be oriented to seek the area in which the urban growth can progress. Comparisons of SMA with other classification approaches are needed to determine its drawbacks and improve its accuracy in areas surrounding other types of land cover. However, the results obtained from this study can be considered as base data and a guide for decision-makers to control urban expansion and for future sustainable development of urban areas in the study site. Potential applications of recent advances in remote sensing, such as high-resolution imaging spectrometry and unmanned aerial vehicles (UAVs) to quantify urban conditions in arid and semi-arid oases, should receive careful consideration. The results of the proposed method can provide an initial assessment and valuable insight for a more detailed urban expansion assessment. Incorporating models such as the one described in this study would help provide the community with more contemporary information regarding urbanization compared to other conventional methods.

Funding

This work was supported by the Deanship of Scientific Research, Vice Presidency for Graduate Studies and Scientific Research, King Faisal University, Saudi Arabia (Grant No. 4,107).

Data Availability Statement

The datasets and final maps are available on request from the corresponding author.

Acknowledgments

The author would like to thank the King Faisal University for its continuous support and help. The author would also like to thank the editor and the anonymous reviewers for their valuable comments to enhance the manuscript.

Conflicts of Interest

The author declares no conflict of interest.

References

  1. Abdulaziz, I.A.; Cobbinah, P.B. Urbanizationenvironment conundrum: An invitation to sustainable development in Saudi Arabian cities. Int. J. Sustain. Dev. 2023, 30, 359–373. [Google Scholar]
  2. Xu, C.; Liu, M.; An, S.; Chen, J.M.; Yan, P. Assessing the impact of urbanization on regional net primary productivity in Jiangyin County, China. J. Environ. Manag. 2007, 85, 597–606. [Google Scholar] [CrossRef] [PubMed]
  3. Salih, A.; Hassaballa, A.A.; Ganawa, E. Mapping desertification degree and assessing its severity in Al-Ahsa Oasis, Saudi Arabua, using remote sensing-based indicators. Arab. J. Geosci. 2021, 14, 192. [Google Scholar] [CrossRef]
  4. Almadini, A.M.; Hassaballa, A.A. Depicting changes in land surface cover at Al-Hassa oasis of Saudi Arabia using remote sensing and GIS techniques. PLoS ONE 2019, 14, e0221115. [Google Scholar] [CrossRef]
  5. Abdelatti, H.; Elhadary, Y.; Babiker, A.A. Nature and Trend of Urban Growth in Saudi Arabia: The Case of Al-Ahsa Province—Eastern Region. Resour. Environ. 2017, 7, 69–80. [Google Scholar]
  6. Salih, A.A.; Ganawa, E.T.; Elmahl, A.A. Spectral mixture analysis (SMA) and change vector analysis (CVA) methods for monitoring and mapping land degradation/desertification in arid and semiarid areas (Sudan), using Landsat imagery. Egypt. J. Remote Sens. Space Sci. 2017, 20, S21–S29. [Google Scholar] [CrossRef]
  7. Bouzekri, S.; Lasbet, A.A.; Lachehab, A. A new spectral index for extraction of built-up area using Landsat-8 data. J. Indian Soc. Remote Sens. 2015, 43, 867–873. [Google Scholar] [CrossRef]
  8. Bhatti, S.S.; Tripathi, N.K. Built-up area extraction using Landsat 8 OLI imagery. GIScience Remote Sens. 2014, 51, 445–467. [Google Scholar] [CrossRef]
  9. Deliry, S.I.; Avdan, Z.Y.; Avdan, U. Extracting urban impervious surfaces from Sentinel-2 and Landsat-8 satellite data for urban planning and environmental management. Environ. Sci. Pollut. Res. 2021, 28, 6572–6586. [Google Scholar] [CrossRef] [PubMed]
  10. Firozjaei, M.K.; Sedighi, A.; Kiavarz, M.; Qureshi, S.; Haase, D.; Alavipanah, S.K. Automated built-up extraction index: A new technique for mapping surface built-up areas using LANDSAT 8 OLI imagery. Remote Sens. 2019, 11, 1966. [Google Scholar] [CrossRef]
  11. Lamqadem, A.A.; Afrasinei, G.M.; Saber, H. Analysis of Landsat-derived multitemporal vegetation cover to understand drivers of oasis agroecosystems change. J. Appl. Remote Sens. 2019, 13, 014517. [Google Scholar] [CrossRef]
  12. Dawelbait, M.; Dal Ferro, N.; Morari, F. Using Landsat Images and Spectral Mixture Analysis to Assess Drivers of 21-Year LULC Changes in Sudan. Land Degrad. Dev. 2017, 28, 116–127. [Google Scholar] [CrossRef]
  13. Khiry, M.A. Spectral Mixture Analysis for Monitoring and Mapping Desertification Processes in Semi-Arid Areas in North Kordofan State, Sudan. Ph.D. Thesis, Technische Universität Dresden—TU Dresden, Dresden, Germany, 2007. [Google Scholar]
  14. Dawelbait, M.; Morari, F. Monitoring desertification in a Savannah region in Sudan using Landsat images and spectral mixture analysis. J. Arid. Environ. 2012, 80, 45–55. [Google Scholar] [CrossRef]
  15. Liu, T.; Yang, X. Mapping vegetation in an urban area with stratified classification and multiple endmember spectral mixture analysis. Remote Sens. Environ. 2013, 133, 251–264. [Google Scholar] [CrossRef]
  16. Tooke, T.R.; Coops, N.C.; Goodwin, N.R.; Voogt, J.A. Extracting urban vegetation characteristics using spectral mixture analysis and decision tree classifications. Remote Sens. Environ. 2009, 113, 398–407. [Google Scholar] [CrossRef]
  17. Du, P.; Liu, S.; Liu, P.; Tan, K.; Cheng, L. Sub-pixel change detection for urban land-cover analysis via multi-temporal remote sensing images. Geo-Spat. Inf. Sci. 2014, 17, 26–38. [Google Scholar] [CrossRef]
  18. Small, C. High spatial resolution spectral mixture analysis of urban reflectance. Remote Sens. Environ. 2003, 88, 170–186. [Google Scholar] [CrossRef]
  19. Hassaballa, A.; Salih, A. A Spatio-Temporal Analysis of Heat Island Intensity Influenced by the Substantial Urban Growth between 1990 and 2020: A Case Study of Al-Ahsa Oasis, Eastern Saudi Arabia. Appl. Sci. 2023, 13, 2755. [Google Scholar] [CrossRef]
  20. Salih, A. Classification and mapping of land cover types and attributes in Al-Ahsaa Oasis, Eastern Region, Saudi Arabia using Landsat-7 data. J. Remote Sens. GIS 2018, 7, 228–234. [Google Scholar] [CrossRef]
  21. General Authority for Statistics (2010). Available online: https://www.stats.gov.sa/en (accessed on 12 June 2020).
  22. Aldakheel, Y.Y. Assessing NDVI Spatial Pattern as Related to Irrigation and Soil Salinity Management in Al-Hassa Oasis, Saudi Arabia. J. Indian Soc. Remote Sens. 2011, 39, 171–180. [Google Scholar] [CrossRef]
  23. Elprince, A.; Makkp, Y.M.; Ai-Barrak, S.; Tamim, M.T. Use of Computer Graphics in Developing Density Maps for the Date Culture of Al-Hasa Oasis in Saudi Arabia. In Proceedings of the First Symposium on Date Palm Conference, AI-Hassa, Saudi Arabia, 23–25 March 1982. [Google Scholar]
  24. Salih, A.; Hassaballa, A.; Elhadary, Y. Consistency Measurement for Different-Scale Satellite Data Sets Applied on Vegetation Assessment: Case Study Al-Ahsa Province, Saudi Arabia. Adv. Biores. 2022, 13, 161–173. [Google Scholar]
  25. Luca, C. Semi-Automatic Classification Plugin: A Python tool for the download and processing of remote sensing images in QGIS. J. Open Source Softw. 2021, 6, 3172. [Google Scholar]
  26. Elmore, A.J.; Mustard, J.F.; Manning, S.J.; Lobell, D.B. Quantifying vegetation change in semiarid environments. Remote Sens. Environ. 2000, 73, 87–102. [Google Scholar] [CrossRef]
  27. Adams, J.B.; Smith, M.O.; Johnson, P.E. Spectral mixture modeling: A new analysis of rock and soil types at the Viking Lander I Site. J. Geophys. Res. 1986, 91, 8098–8112. [Google Scholar] [CrossRef]
  28. ENVI User’s Guide. 2009. Available online: https://www.tetracam.com/PDFs/Rec_Cite9.pdf (accessed on 12 October 2022).
  29. Pan, J.; Li, T. Extracting desertification from Landsat TM imagery based on spectral mixture analysis and Albedo-Vegetation feature space. Nat. Hazards 2013, 68, 915–927. [Google Scholar] [CrossRef]
  30. Stehman, S.V.; Foody, G.M. Key issues in rigorous accuracy assessment of land cover products. Remote Sens. Environ. 2019, 231, 111199. [Google Scholar] [CrossRef]
  31. Olofsson, P.; Foody, G.M.; Herold, M.; Stehman, S.V.; Woodcock, C.E.; Wulder, M.A. Good practices for estimating area and assessing accuracy of land change. Remote Sens. Environ. 2014, 148, 42–57. [Google Scholar] [CrossRef]
  32. Pontius, R.G., Jr.; Millones, M. Death to Kappa: Birth of quantity disagreement and allocation disagreement for accuracy assessment. Int. J. Remote Sens. 2011, 32, 4407–4429. [Google Scholar] [CrossRef]
  33. Congalton, R.G.; Green, K. Assessing the Accuracy of Remotely Sensed Data: Principles and Practices, 2nd ed.; CRC Press: Boca Raton, FL, USA, 2009; p. 208. [Google Scholar]
  34. Alqahtany, A. GIS-based assessment of land use for predicting increase in settlements in Al Ahsa Metropolitan Area, Saudi Arabia for the year 2032. Alex. Eng. J. 2023, 62, 269–277. [Google Scholar] [CrossRef]
  35. Allbed, A.; Kumar, L.; Sinha, P. Soil salinity and vegetation cover change detection from multi-temporal remotely sensed imagery in Al Hassa Oasis in Saudi Arabia. Geocarto Int. 2018, 33, 830–846. [Google Scholar] [CrossRef]
  36. Powell, R.L.; Roberts, D.A.; Dennison, P.E.; Hess, L.L. Sub-pixel mapping of urban land cover using multiple endmember spectral mixture analysis: Manaus, Brazil. Remote Sens. Environ. 2007, 106, 253–267. [Google Scholar] [CrossRef]
  37. Lu, D.; Weng, Q. Spectral mixture analysis of the urban landscape in Indianapolis with Landsat ETM+ imagery. Photogramm. Eng. Remote Sens. 2004, 70, 1053–1062. [Google Scholar] [CrossRef]
  38. Mohammed, H.; Elhadary, Y.A. Land Transport and Urban Expansion: Present Requirements and Future Chanllenges A case Study on Al-Ahsa Province-Eastern Region-Saudi Arabia. J. Gulf Arab. Penins. Stud. 2020, 46, 259–304. [Google Scholar]
  39. Ehadary, Y.A.; Al-Omair, A.A. Indicators and causes of rural settlement changes in Saudi Arabia: Al-hasa province in the Eastern district as case study. J. Gulf Arab. Penins. Stud. 2014, 155, 40. [Google Scholar]
Figure 1. Location of the study area. (a) The study area location in the eastern region of Saudi Arabia highlighted with a red rectangle. (b) The green color is the date palm farm oasis. Landsat 2020 (bands 5-4-3) shown in the background presenting the other dominant land cover/use of the Al-Ahsa Oasis.
Land 12 01842 g001
Figure 2. Flow chart of the methodology. The colors in the inside figure show the position of the selected endmembers as follows: The red represents urban pixels, the green represents vegetation pixels and the blue represents sand pixels.
Land 12 01842 g002
Figure 3. PC1 versus PC2 linear plot for different Landsat sensors: TM 1990, TM 2000, ETM+ 2010, and OLI 2020, along with their spectral reflectances of the selected endmembers used in the investigation. The six bands on the x-axis are the Landsat images’ spectral bands (1–5 and 7). The colors in the figures on the left side show the position of the selected endmembers as follows: The red represents urban pixels, the green represents vegetation pixels and the blue represents sand pixels.
Land 12 01842 g003
Figure 4. PC1 versus PC2 linear plot for Sentinel-2A of the years: (a) 2015 and (b) 2020 along with their spectral reflectances of selected endmembers used in the investigation. The six bands on the x-axis are the Sentinel images’ spectral bands (2–8). The colors in the figures on the left side show the position of the selected endmembers as follows: The red represents urban pixels, the green represents vegetation pixels and the blue represents sand pixels.
Land 12 01842 g004
Figure 5. Urban fraction of Landsat images in long-term monitoring: (a) 1990; (b) 2000; (c) 2010; and (d) 2020. White pixels show a significant (high) fraction of urban features in the study site.
Land 12 01842 g005
Figure 6. Urban fraction of Sentinel-2 images in long-term monitoring: (a) 2015 and (b) 2020. White pixels depict a significant (high) fraction of urban features in the study area.
Land 12 01842 g006
Figure 7. Urban fraction assessment during the selected period 1990–2020.
Land 12 01842 g007
Figure 8. Examples of high and low SMA classification errors in the study site. In (a,c), error resulting from Landsat image 2020 or Sentinel-2A image 2020 (b), the bright pixels represent a high error, while the dark pixels represent a low error. White frames show the position of the subfigures below.
Land 12 01842 g008
Figure 9. Urban fraction comparison between: (a) 1990 and (b) 2020. An increase in urban fractions from 1990 to 2020 is obvious (indicated by bright pixels), and this increase may be at the expense of other land cover types, for example vegetation and crop areas.
Land 12 01842 g009
Figure 10. Population growth in the study area for the period from 1992 to 2016.
Land 12 01842 g010
Table 1. Description of datasets used in this study.
Sensor-IDSpacecraft-IDAcquired DateNo. of BandsResolution (m)
TMLandsat-515 July 19906 (optical),
1 (thermal)
30 m (optical),
120 m (thermal)
ETM+Landsat-72 July 2000
14 July 2010
6 (optical),
2 (thermal)
30 m (optical),
120 m (thermal)
OLI and TIRSLandsat-817 July 20208 (optical),
2 (thermal)
30 m (optical),
100 m (thermal)
MSISentinel-210 July 2015
19 July 2020
1 (coastal aerosol),
3 (red edge), and
7 (optical)
10–60 m
Table 2. RMS residual errors of the endmember fractions. The word “NA” in the second and third columns means that the Sentinel images are missing or unavailable. For Landsat images, the time interval is ten years, so the 2015 image is not included in the analysis.
YearsRMS Residual Value of LandsatRMS Residual Value of Sentinel-2A
19900.013NA
20000.010NA
20100.011NA
2015NA0.006
20200.0120.008
Table 3. Results of the SMA verification of urban fraction classification from Landsat images: producer’s accuracy (PA), user’s accuracy (UA), omission error (OE), commission error (CE), and overall accuracy (OA).
Fraction1990200020102020
UA%PA%OECEUA%PA%OECEUA%PA%OECEUA%PA%OECE
Urban fraction861000149010001096100100410010000
Non-urban fraction1008812.30100919.101009696010010000
Overall accuracy (OA)9398100100
Table 4. Results of the SMA of urban fraction classification from Sentinel-2 images: producer’s accuracy (PA), user’s accuracy (UA), omission error (OE), commission error (CE), and overall accuracy (OA).
Fraction20152020
UA%PA%OECEUA%PA%OECE
Urban fraction1001000010010000
Non-urban fraction1001000010010000
Overall accuracy (OA)100100
Disclaimer/Publisher’s Note: The statements, opinions and data contained in all publications are solely those of the individual author(s) and contributor(s) and not of MDPI and/or the editor(s). MDPI and/or the editor(s) disclaim responsibility for any injury to people or property resulting from any ideas, methods, instructions or products referred to in the content.

