Article

Detection and Assessment of Changing Drought Events in China in the Context of Climate Change Based on the Intensity–Area–Duration Algorithm

1
College of Surveying and Geo-Informatics, North China University of Water Resources and Electric Power, Zhengzhou 450046, China
2
Hydraulics and Geotechnics Section, KU Leuven, Kasteelpark Arenberg 40, BE-3001 Leuven, Belgium
3
The National Key Laboratory of Water Disaster Prevention, Hohai University, Nanjing 210098, China
4
State Key Laboratory of Desert and Oasis Ecology, Xinjiang Institute of Ecology and Geography, Chinese Academy of Sciences, Urumqi 830011, China
5
Faculty of Natural Sciences, Institute of Earth Sciences, University of Silesia in Katowice, Będzińska Street 60, 41-200 Sosnowiec, Poland
*
Authors to whom correspondence should be addressed.
Land 2023, 12(10), 1820; https://doi.org/10.3390/land12101820
Submission received: 14 August 2023 / Revised: 17 September 2023 / Accepted: 22 September 2023 / Published: 23 September 2023

Abstract

:
Drought can have a significant impact on both society and the economy, resulting in issues such as scarcity of water and shortages of food and energy, as well as elevated health risks. However, as global temperatures continue to rise, the impact of drought events is increasingly exacerbated, manifested by an increase in the frequency, intensity, duration, and spatial extent of their effects. Therefore, studying the changing characteristics of drought events with the background of climate change is of great significance. Based on the high-precision and high-resolution CN05.1 dataset, this study obtained the monthly Standardized Precipitation Evapotranspiration Index (SPEI) dataset from 1961 to 2020, and then identified regional drought events in China using the Intensity–Area–Duration (IAD) method, which considers both temporal continuity and spatial dynamics. On this basis, the spatiotemporal variations in frequency, intensity, duration, and affected area of drought events in China and its seven subregions were analyzed. The results showed that the subregions located in the northern region of China generally have lower mean, maximum, and minimum temperatures than those located in the southern region, but the associated interannual change rate of the subregions in the north is higher than that in the south. As for the annual total precipitation, results show a clear pattern of decreasing southeast–northwest gradient, with an increasing trend in the northern subregions and a decreasing trend in the southern subregions except for the subregion south China (SC). The northeast of China (NE), SC, the southwest of China (SW) and north China (NC) are the regions with a high frequency of drought events in China, while the frequency of drought events in NW and Qinghai–Tibetan Plateau (QTP), although lower, is on a significantly increasing trend, and the increasing rate is higher than for the other regions. For drought intensity, Xinjiang (XJ) and QTP had greater drought intensity, and the change rate of these regions with greater drought intensity was also greater. The drought impact area in China showed a significant increasing trend, mainly concentrated in QTP, NW and NE. Particular attention needs to be focused on the southwest of QTP, where drought events in this region show a significant increase in frequency, intensity, duration and impact area.

1. Introduction

Climate change has become a pressing global issue, posing a significant threat to the environment, human societies, and economies worldwide [1]. An outcome of climate change that stands out prominently is the heightened occurrence and intensity of extreme weather [2], such as floods [3], storms [4], forest fires [5], heatwaves [6,7], and droughts [8,9]. Among these extreme events, drought, in particular, has garnered considerable attention in recent years due to its far-reaching impacts on agriculture, water resources, ecosystems, and socioeconomic development [10,11]. Drought is a multifaceted and intricate phenomenon marked by an extended deficiency in precipitation [12,13], leading to water scarcity and a myriad of cascading effects [14]. Given the increasing concerns over the potential implications of climate change on drought patterns, it is imperative to identify and analyze drought events and their spatiotemporal characteristics under the context of climate change.
China, as the most populous country [15] and the second-largest economy [16] in the world, is particularly vulnerable to the adverse effects of climate change and drought [17]. The country’s vast territory encompasses a diverse range of climate zones and ecosystems, which are differentially affected by drought events [18]. Furthermore, over recent decades, climate change has exacerbated drought conditions [19]. Several major droughts have struck various regions of China, causing significant socioeconomic impacts [20,21]. For example, a severe drought in 1997 caused the lower reach of the Yellow River to experience 226 consecutive days without any water flow, leading to the formation of a dry riverbed that extended for a distance of 687 km [21,22]. Southwestern China suffered an intense drought from autumn 2009 to spring 2010, which left 21 million people with scarce drinking water and incurred $30 billion in economic losses [23]. Compared with other regions in China, drought disasters in northeast China cover wider areas, last longer, and are more severe [24]. More specifically, on average, northeast China experiences mega-droughts every 20 years, serious droughts every 7 years, and moderate droughts every 3 years [25]. Therefore, understanding the changing patterns of drought in China is of great importance for informing adaptation and mitigation strategies, as well as for guiding sustainable water resource management and agricultural planning.
So far, the commonly used drought monitoring indices include Standardized Precipitation Index (SPI) [26], Palmer Drought Severity Index (PDSI) [27], Standardized Precipitation Evapotranspiration Index (SPEI) [28], the available water resources index (AWRI) [29], the composite drought index (CDI) [30], the China-Z index and modified version (CZI and MCZI) [31,32], effective drought index (EDI) [33], the multivariate standardized drought index (MSDI) [34], and the standardized soil moisture index (SSI) [35]. Among them, SPEI, SPI, and PDSI are the most widely applied drought indices. SPI results have comparability in both spatial and temporal dimensions [36], and their multiscale characteristics facilitate the identification of different types of drought (i.e., meteorological, agricultural, and hydrological drought) [37]. However, SPI cannot reflect drought conditions caused by warming due to only considering precipitation factors [38]. Although PDSI considers temperature factors and overcomes the shortage of SPI, it lacks multiscale features to evaluate different types of drought [39]. Considering the convenience of the multiscale assessment of time and temperature effects in drought monitoring, SPEI is particularly suitable for monitoring and studying drought characteristics under warming conditions [40].
In addition to that, a sophisticated approach is necessary to identify drought events, as they are a spatiotemporal phenomenon and require consideration of the spatiotemporal component [41]. Dracup et al. [40] put forward the notion that a drought event consists of three key components: duration, intensity, and severity. Andreadis et al. [42] pioneered a spatial identification approach, acknowledging the possibility of merging multiple drought events occurring at a single time step into more significant drought events in subsequent time steps. Then, Sheffield [43] expanded upon this approach, introducing the severity–area–duration (SAD) algorithm. However, it should be noted that SAD does not consider the spatial dynamics inherent in extreme events. Fortunately, the Intensity–Area–Duration (IAD) algorithm was developed based on SAD [44], which can provide a comprehensive and robust assessment of drought events, which is particularly useful for understanding the complex interactions between drought and climate change. Furthermore, the IAD method has been successfully applied in many studies [45,46,47,48], demonstrating its versatility and applicability in diverse climatic contexts.
The primary objective of this study is to identify and analyze drought events in China under the context of climate change, with a particular focus on the application of the IAD method. To achieve this goal, the study will proceed by (1) investigating the variation characteristics of climate change in China from 1961–2020; (2) calculating monthly SPEI based on the precipitation and temperature datasets; (3) identifying regional drought events at both time and space scales using the IAD algorithm; and (4) analyzing the frequency, intensity, duration, and impact area of regional drought events. Through a comprehensive and systematic examination of drought events in China within the framework of climate change, this study aims to furnish valuable insights to decision-makers addressing drought risks and a broad spectrum of stakeholders concerned about the incidence and repercussions of recurring droughts.

2. Materials and Methods
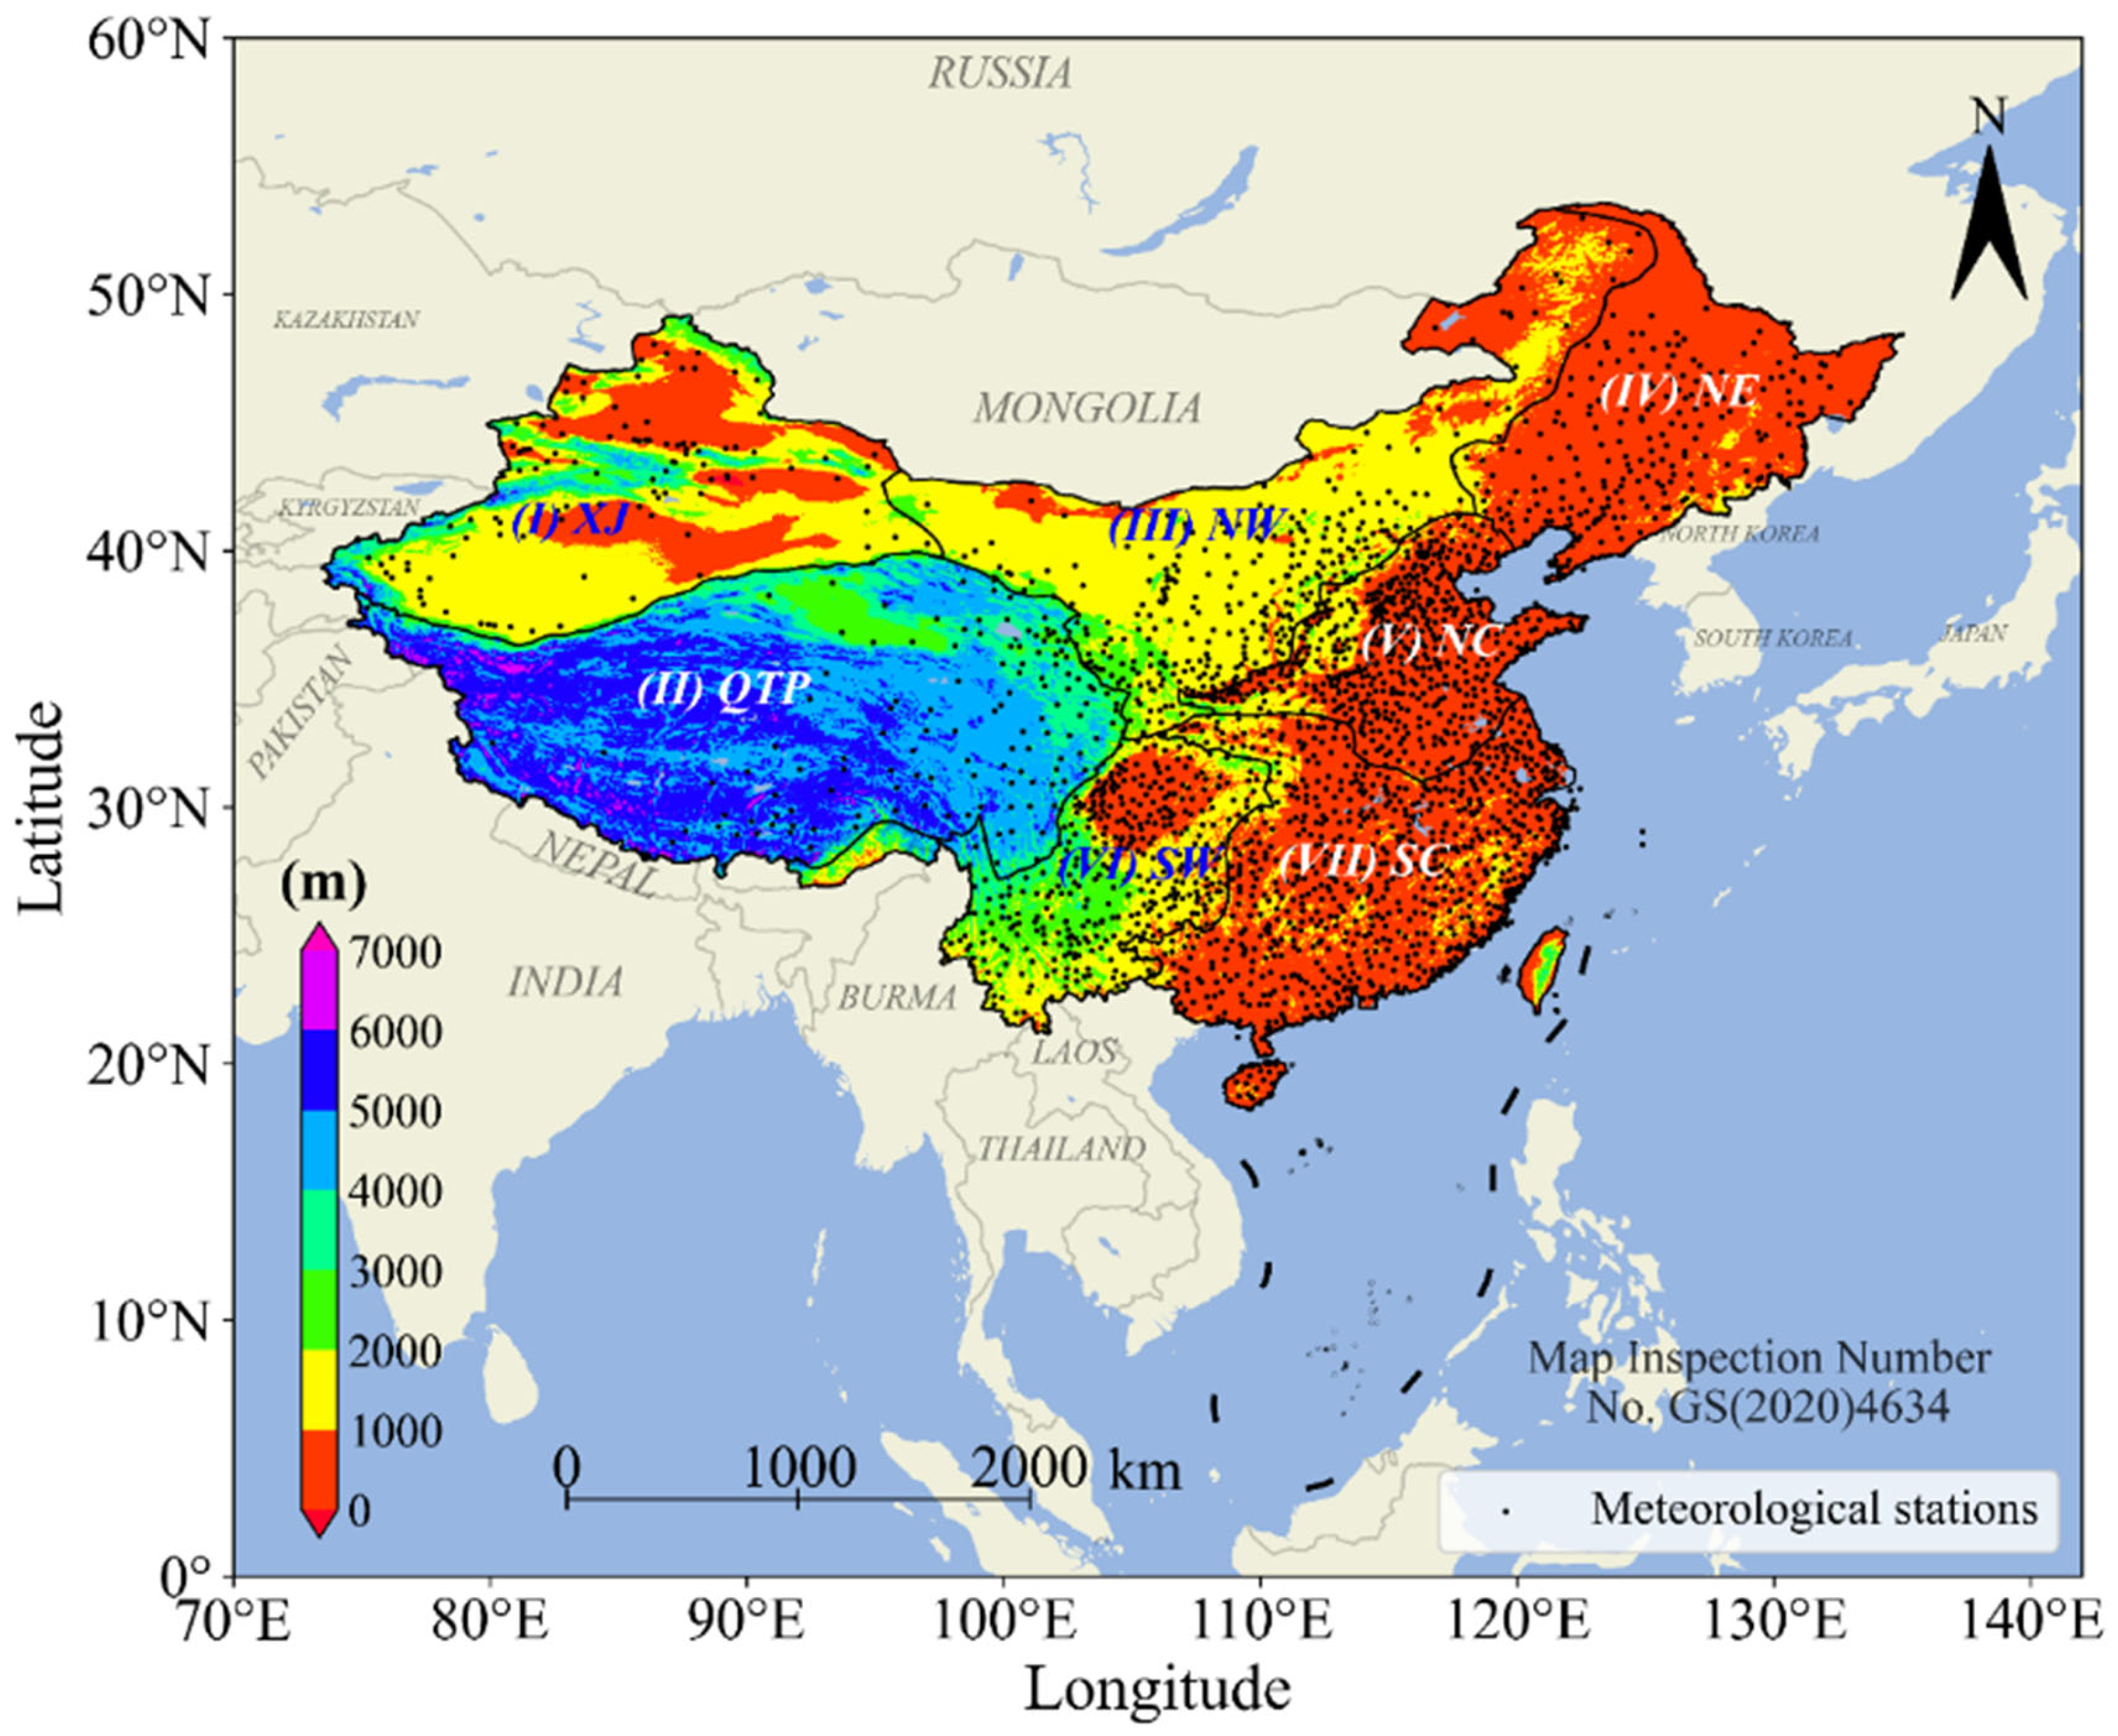
2.1. Study Area

China, located in the eastern part of Asia, is the world’s third-largest country, with a land area of approximately 9.6 million square kilometers between around 73.5–135° E and 3.8–53.6° N (Figure 1) [9,49]. The country is characterized by diverse topography, i.e., plains, plateaus, basins, and hill and mountain ranges [50], which results in a highly varied climate [51]. To better understand drought variability across different regions of China, we employed a geographic subregions approach, as previously used in our earlier research [51,52]. As a result, we identified seven distinct subregions, each with its own unique climate characteristics, described as follows: (I) Xinjiang (XJ), known for its temperate continental climate; (II) the Qinghai–Tibetan Plateau (QTP), characterized by a sub-frigid climate; (III) the northwest (NW), exhibiting an arid and semiarid climate; (IV) the northeast (NE), experiencing a humid and semi-humid climate; (V) north China (NC), with a semi-humid climate; and (VI) the southwest (SW) and (VII) south China (SC), both characterized by a humid climate. It is worth noting that we ignored Taiwan’s parameters in SC due to the shortage of observed data. Overall, these seven subregions feature a diversity of climates, including temperate continental, sub-frigid, arid, semi-arid, humid, and semi-humid, as well as monsoonal [9]. In general, northern subregions tend to be colder and drier, while southern regions are typically warmer and wetter [8]. In terms of elevation, there are significant differences in China’s terrain. Among them, NE, NC, and SC are generally below 1000 m in elevation; NW is in the range of 1000–2000 m, and the elevation of the QTP region is almost all above 5000 m, and even exceeds 7000 m in some areas. As for the XJ and SW regions, the terrain is relatively complex, and there exist areas below 1000 m in the elevation of these two regions, as well as areas in the range of 1000–2000 m and 2000–3000 m areas.

2.2. Data Utilization

To analyze climate change and obtain SPEI in China, the climate variables precipitation and temperature from the dataset of CN05.1 were employed in this study. CN05.1 is a daily gridded dataset with a spatial resolution of 0.25° × 0.25°, which was developed based on intensive 2416 national meteorological stations by the “anomaly approach” [53,54,55], in which a gridded climatology of 1971–2000 is first obtained by thin-plate smoothing splines, and then a gridded daily anomaly derived via an angular weighting method is added to the climatology [56]. To date, CN05.1 contains mean temperature (Tmean, °C), maximum temperature (Tmax, °C), minimum temperature (Tmin, °C), precipitation (mm), evapotranspiration (mm/d), mean wind speed (m/s), and relative humidity (%) in both Binary and NetCDF formats, with a long time series of 1961–2020 [57]. In this study, the daily precipitation and mean, maximum, and minimum temperature were selected from 1961–2020, and then the monthly mean, maximum, and minimum temperature were obtained by averaging the daily mean, maximum, and minimum temperature, respectively, and the monthly total precipitation was determined by aggregating the daily precipitation.

2.3. Methods

2.3.1. SPEI Calculation

The SPEI is regarded as an enhanced drought index in comparison to the SPI, as it incorporates both reference evapotranspiration and precipitation [58,59], which is especially suited for studies of effects of global warming on drought severity [60]. More specifically, the SPEI utilizes the concept of a “climatic water balance”, which considers the difference between precipitation and potential evapotranspiration (P–PET) as input, as opposed to relying solely on precipitation (P) [61,62]. The climatic water balance involves the comparison of available water (P) with atmospheric evaporative demand (PET), resulting in a more robust gauge of drought severity when compared to solely examining precipitation [63]. SPEI is capable of accounting for multi-scale drought conditions, generally including 1-month (SPEI-01), 3-month (SPEI-03), 6-month (SPEI-06), 12-month (SPEI-12), and 24-month scales (SPEI-24), which represent different types of drought [64]. In general, SPEI-01 and SPEI-03 represent meteorological droughts and SPEI-06 describes agricultural droughts, while SPEI-12 and SPEI-24 are suitable for depicting hydrological droughts [65]. In this study, the shortest time scale of SPEI-01 was adopted as an input to identify regional drought events by Intensity–Area–Duration (IAD) algorithm (see Section 2.3.2).
In SPEI, the Hargreaves model based on temperature and solar radiation was suggested as being more successful in taking into account for PET than other methods (e.g., Thornthwaite and Penman–Monteith methods) especially in cases where data are scarce [66,67]. Therefore, the PET can be calculated as Equation (1) [68,69]:
P E T = c H 0.408 R o ( T m e a n + 17.8 ) T max T min
where cH stands for the Hargreaves coefficient with an empirical value of 0.0023, Ro represents solar radiation, which is a function of the latitude; Tmean, Tmax, and Tmin are the mean, maximum, and minimum temperature, respectively. Then, the accumulating deficit of water balance at specific timescale can be expressed as Equation (2):
D i = P i P E T i
where i denotes any specific month. To obtain the SPEI series, Di needs be normalized into a probability distribution. Among several probability distributions, i.e., generalized logistic distribution, Pearson type III distribution, normal distribution, and generalized extreme value (GEV) distribution [70], generalized logistic distribution is widely used for the calculation of SPEI. Therefore, the probability density function for the D series can be given as Equation (3):
F x = 1 + α x γ β 1
where α, β, and γ depict the scale, shape, and origin, respectively, and x is the cumulative series of D values in a given time window. Then, the SPEI can be calculated by standardizing the values of F(x). An empirical approximation can be expressed as Equation (4) [69]:
S P E I = W C 0 + C 1 W + C 2 W 2 1 + d 1 W + d 2 W 2 + d 3 W 3
where W can be calculated by Equation (5):
W = 2 ln ( P ) P = 1 F ( x ) P 0.5
where if P > 0.5, then P should be replaced by 1 − P and the sign of the resultant SPEI is reversed [71]. Additionally, C0, C1, C2, and C3 are constants with values of 2.515517, 0.802853, 0.010328, and 0.189269, respectively [72]. Finally, based on the thresholds of SPEI, droughts can be identified as SPEI ≤ −1.0 [73,74].

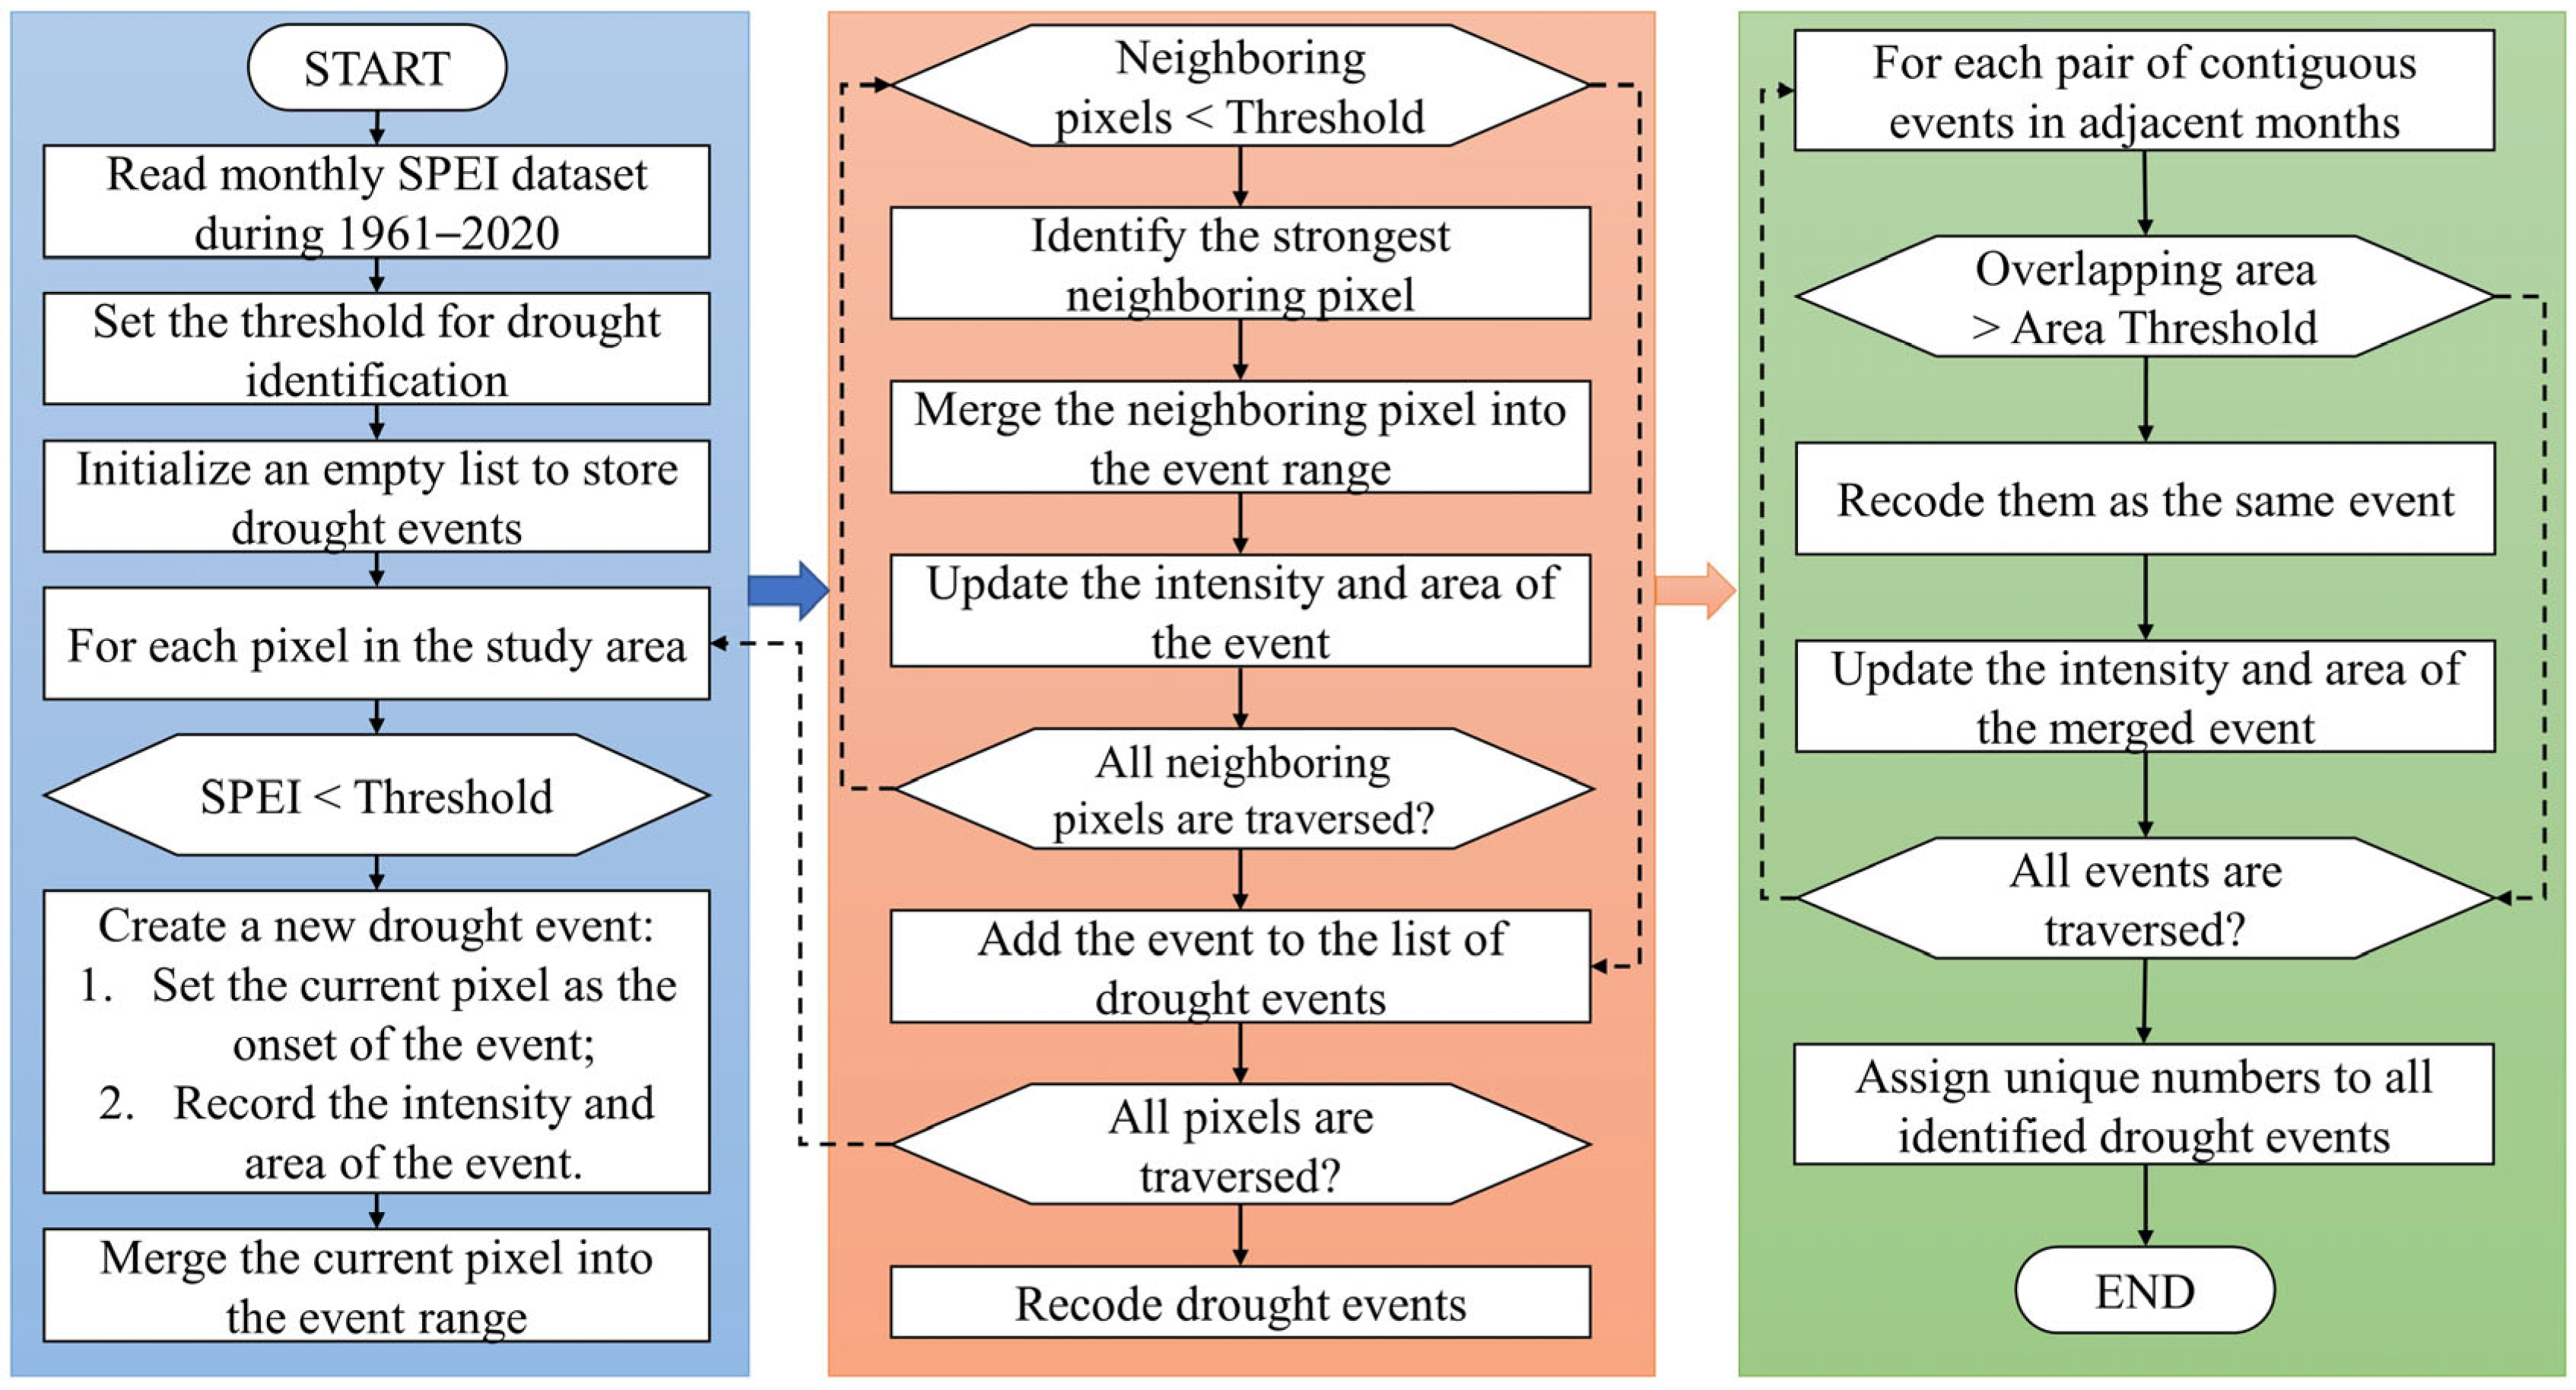
2.3.2. Identification of Regional Drought Events

A regional drought event refers to a prolonged period of abnormally low precipitation or water availability that occurs within a specific geographical region [75]. It can last for months or even years, leading to reduced soil moisture, decreased water levels in rivers and reservoirs, and a general water scarcity throughout the affected region [76,77]. However, it is challenging to extract drought events simultaneously at spatial and temporal scales due to their natural complexity. Fortunately, the latest Intensity–Area–Duration (IAD) framework can perfectly solve this kind of problem, with the ability to identify drought occurrences and high-temperature events at a spatial and temporal scale, and has been used successfully in many studies [9,47,77,78]. Therefore, it was also introduced into this study to identify regional drought events in China.
The idea of IAD framework can be succinctly summarized as follows: (1) finding the strongest center (SPEI ≤ −1.0) for the current month based on the monthly SPEI dataset; (2) obtaining influence range of the present event by clustering all neighboring drought pixels; (3) identifying all regional drought events of the current month according to step 1 and 2; (4) identifying all regional drought events from 1961–2020 according to step 1–3; (5) determining the continuity of events in time scale based on the minimum overlap area of drought events in adjacent months. It is worth noting that the minimum overlap area of drought events is set to 20,000 km2 in this study according to our sensitivity testing [79]. More details about IAD can be found in Ren et al. [48].
According to the idea of the latest IAD framework, it was programmed in Matlab 2021b, and the algorithm flowchart can be seen in Figure 2. After obtaining the dataset of regional drought events, the associated key parameters (i.e., intensity, area, and duration) were extracted to investigate and analyze the change characteristics of drought events in China.

3. Results

3.1. Analysis of the Variation Characteristics of Climate Change

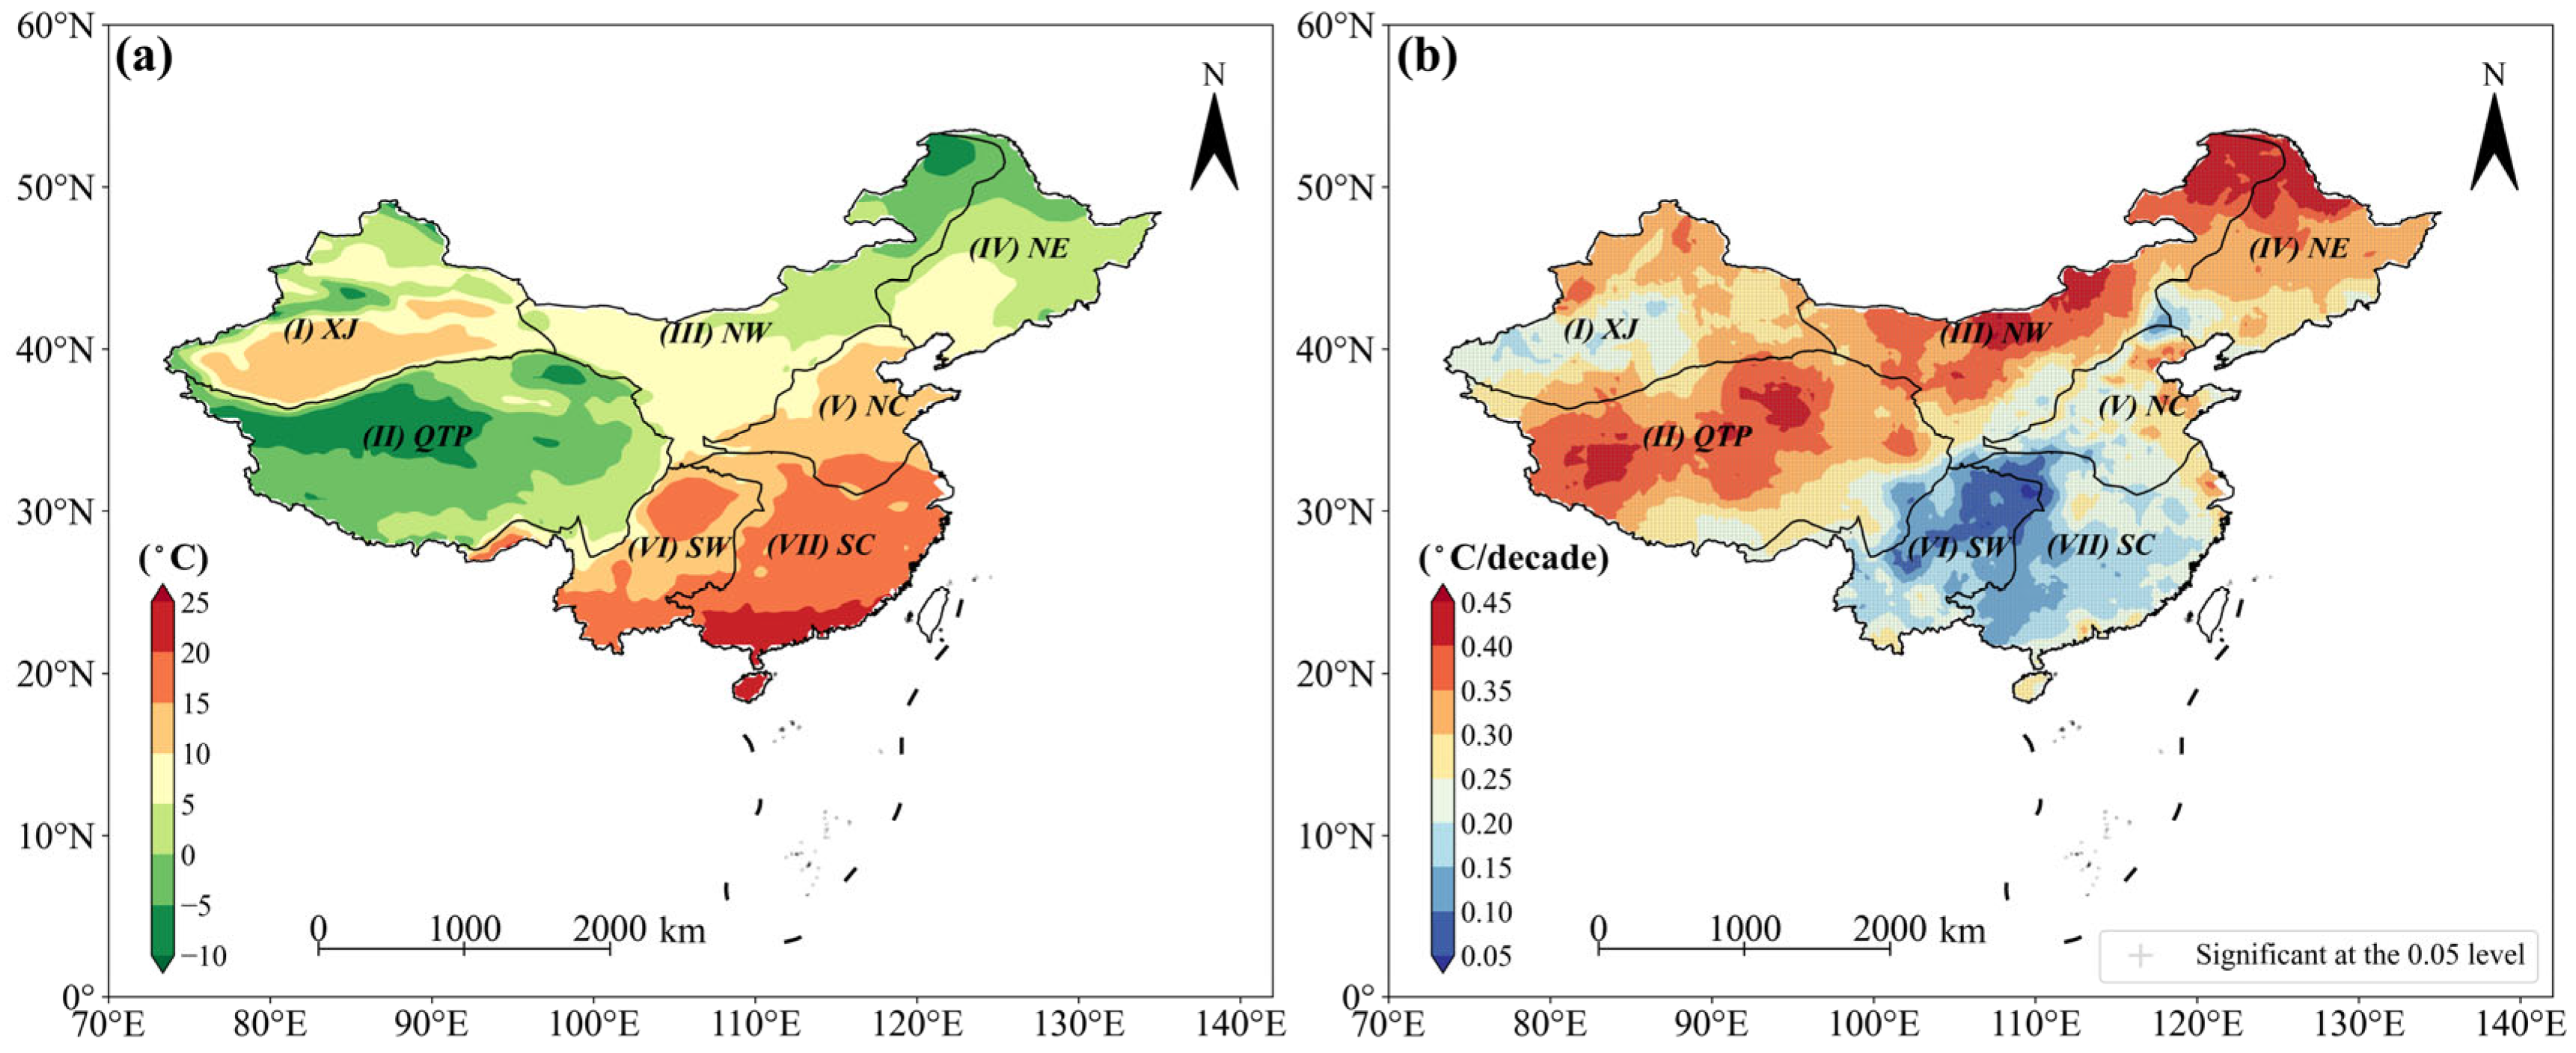
3.1.1. Variation Characteristics of Tmean

It can be seen from Figure 3a that the subregions located in the north of China (i.e., XJ, QTP, NW, and NE) have a significantly lower Tmean than those located in the south of China (i.e., NC, SW, and SC). The coldest region is QTP, where the regional Tmean is at −1.9 °C, with some regions having Tmean below −10 °C. It is worth noting that the Tmean in the Tarim Basin in the XJ region is significantly higher than in the surrounding areas, with a Tmean ranging from 10 to 15 °C. The region with the highest Tmean is SC, with a regional average of 17.2 °C and above 20 °C in the southern part of SC. Unlike the mean spatial distribution, the interannual variation in Tmean (Figure 3b) exhibits the opposite pattern. Although the Tmean of all subregions showed a significant increasing trend from 1961 to 2020, the change rates in subregions XJ, QTP, NW, and NE were higher than those in subregions NC, SW, and SC.
Specifically, the change rate of the Tmean for the China scale was 0.28 °C/decade, and was statistically significant. Among the seven subregions, the highest Tmean increase rate was observed in NW with a value of 0.34 °C/decade, followed by QTP, NE, and XJ with values of 0.33, 0.32, and 0.28 °C/decade, respectively. Among the subregions located in the south of China, SW has the lowest increase rate of Tmean, with a value of 0.15 °C/decade, which is 0.03 and 0.09 °C/decade lower than SC and NC, respectively. Notably, each subregion’s increase rate of Tmean was also statistically significant. Overall, when Figure 3a and Figure 3b are combined together, it can be inferred that the increase rate tends to be higher in subregions with lower Tmean, and vice versa.

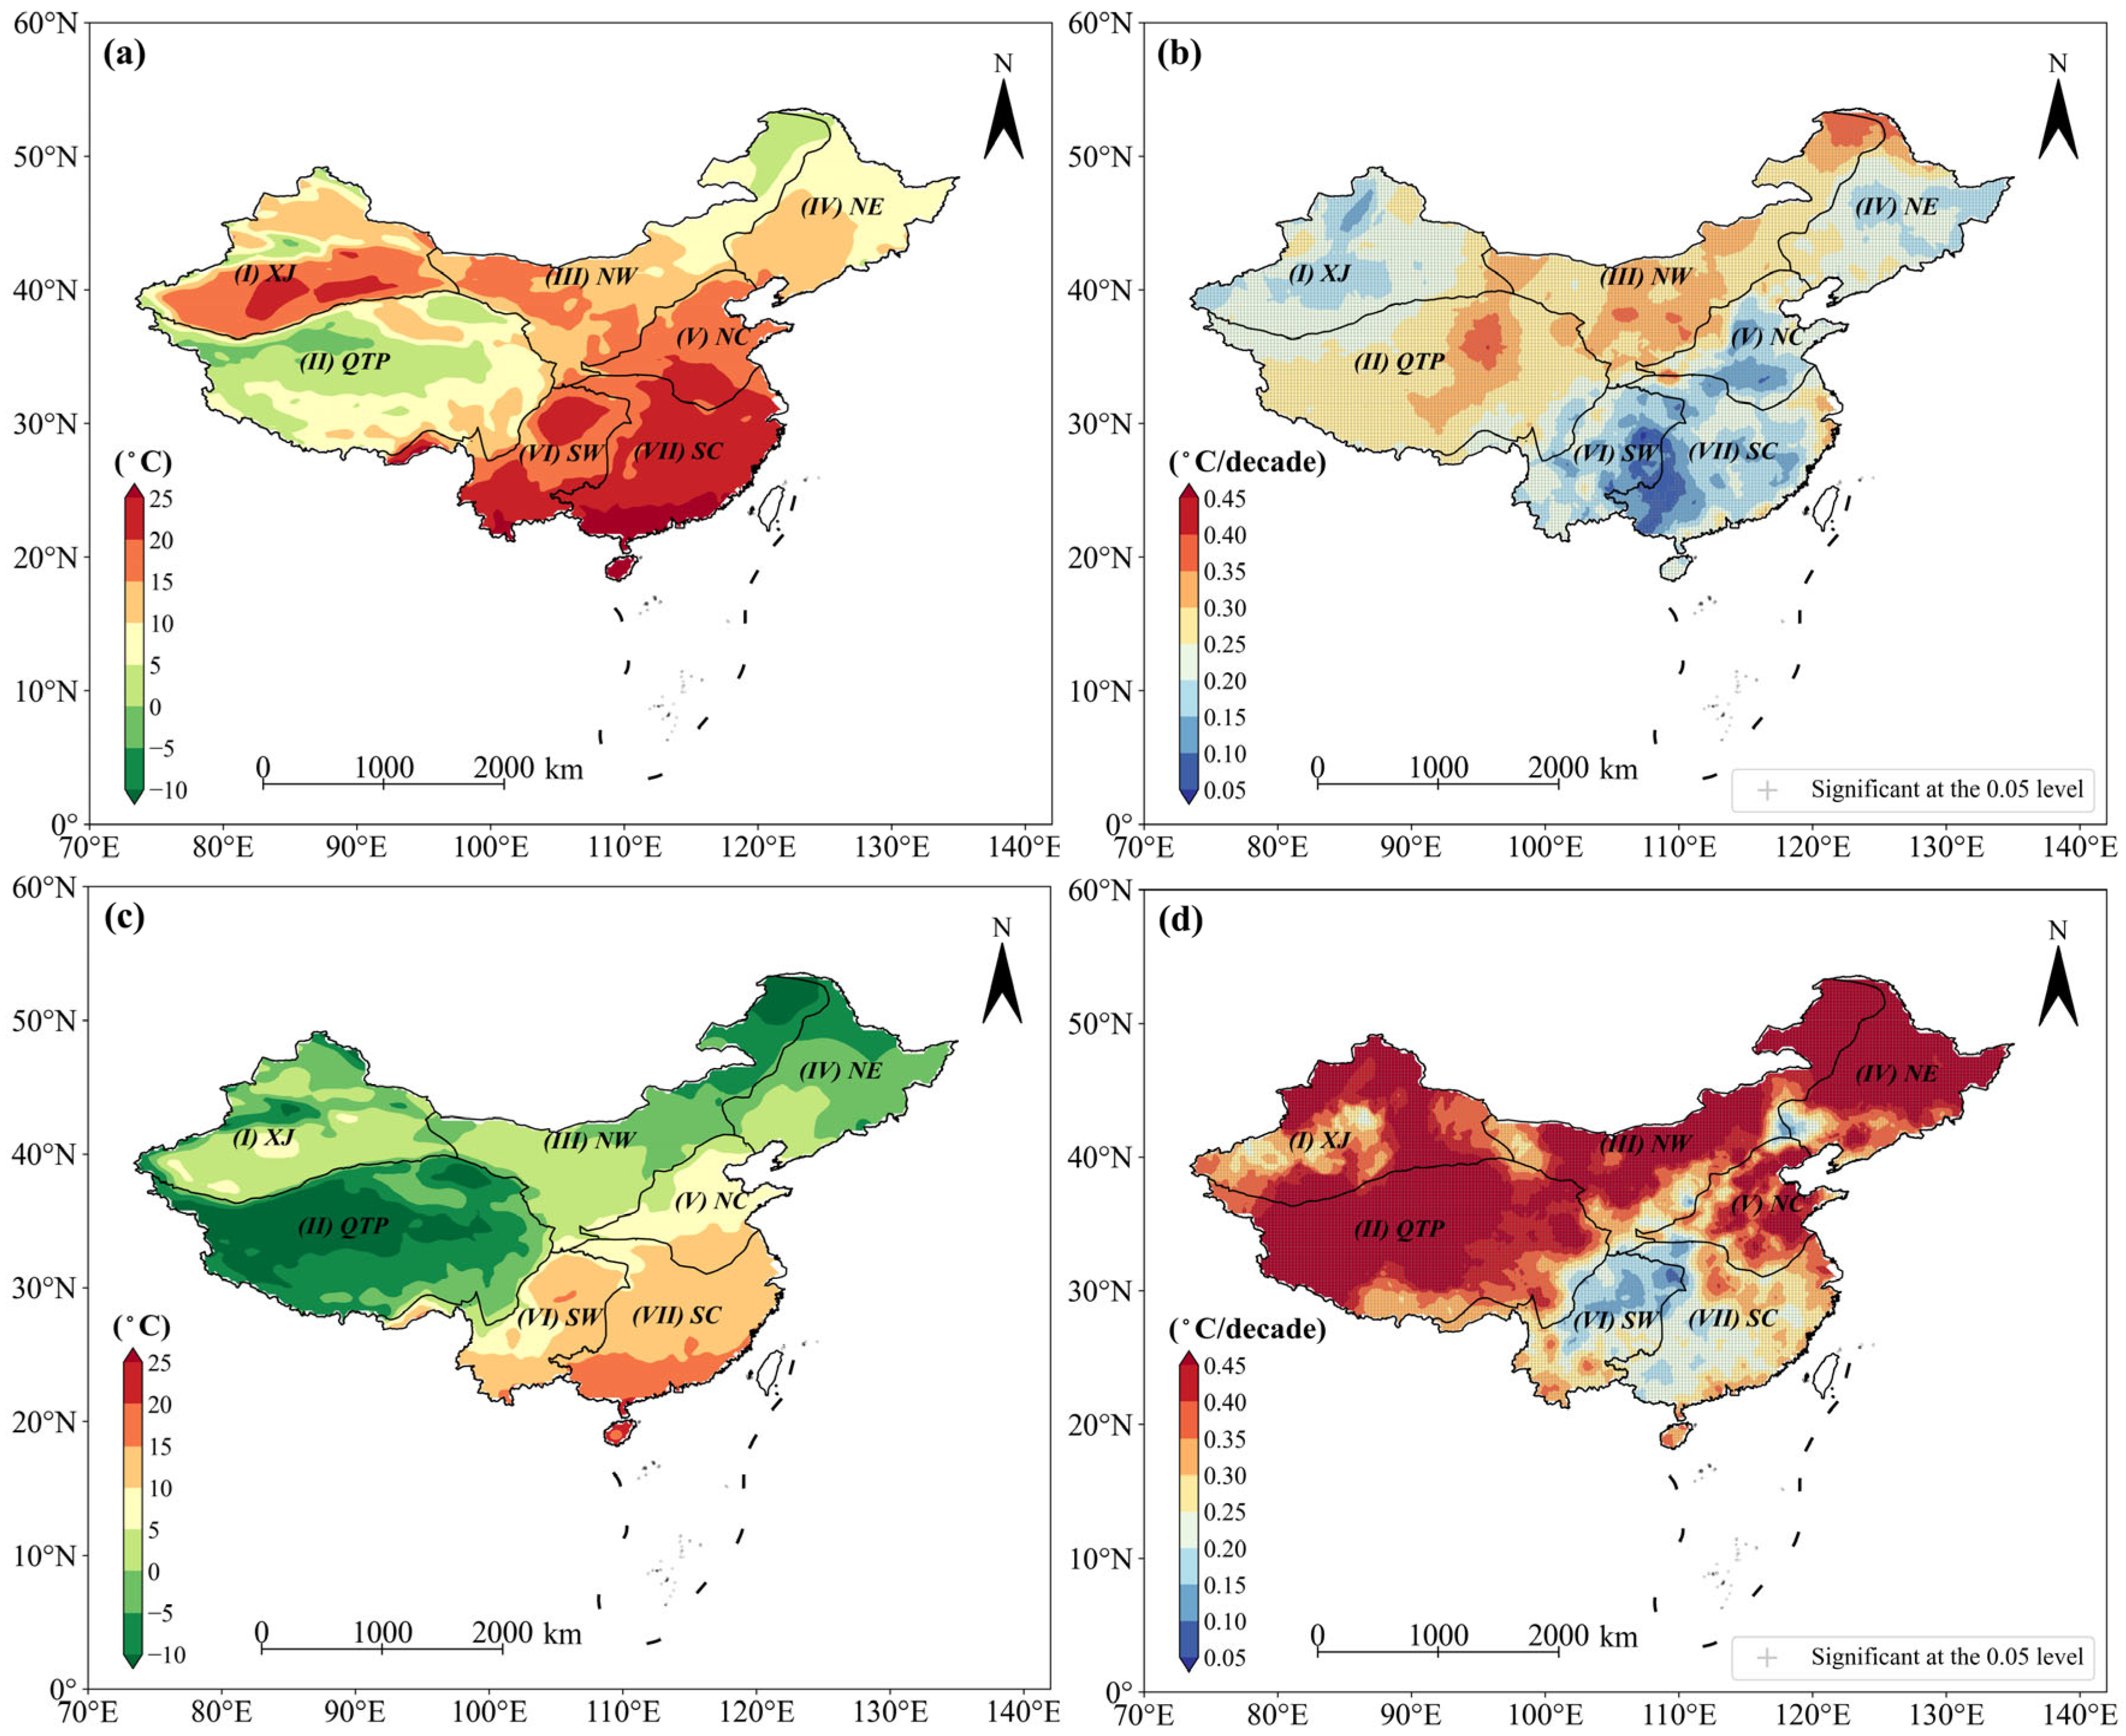
3.1.2. Variation Characteristics of Tmax and Tmin

The annual mean spatial distribution pattern of Tmax from 1961 to 2020 (Figure 4a) is similar to that of Tmean, but significantly higher in magnitude. For example, the regional average Tmax of QTP is 5.6 °C, which is 4.7 °C higher than Tmean. SC has the highest temperature among the seven subregions, where the Tmax is generally above 20 °C. Particularly, the Tmax in the southern part of SC can be above 25 °C, and the regional average Tmax is 22.1 °C. From Figure 4b, the increase rate of Tmax is significantly lower than Tmean, especially for the subregions located in the north of China (i.e., XJ, QTP, NW, and NE). The highest change rate of Tmax subregion is still NW, with a value of 0.30 °C/decade, followed by QTP, NE, and XJ, with values of 0.27, 0.23, and 0.22 °C/decade, respectively. the change rate of Tmax on the scale of China is 0.24 °C/decade, which is significantly lower than the change rate of Tmean.
The annual average spatial distribution pattern of Tmin during the study period (Figure 4c) is similar to that of Tmean and Tmax, but is the lowest in magnitude. The regional mean Tmin of QTP, which belongs to the coldest subregion, is −8.1 °C, while the warmest temperature subregion, SC, is only 13.9 °C. However, it is noteworthy that the change rate of the Tmin is the highest among the three types of temperatures (Figure 4d). The spatial distribution pattern of Tmin still shows a significantly higher change rate in the subregion located in the north of China than in the subregion located in the south of China, which is consistent with the Tmean and Tmax. Specifically, QTP and NE have the highest change rate of 0.47 °C/decade, followed by NW and XJ, with 0.45 and 0.42 °C/decade, respectively. In addition, SW remains the subregion with the lowest change rate of Tmin, with a value of 0.23 °C/decade. The change rate of the Tmin on the scale of China is 0.40 °C/decade, which is significantly higher than that of the Tmean and Tmax.

3.1.3. Variation Characteristics of Precipitation

The mean spatial distribution of the annual total precipitation (ATP) from 1961–2020 has a pronounced pattern of a decreasing southeast–northwest gradient (Figure 5a). The multi-year mean ATP in China is 635.9 mm. Among the seven subregions, SC has the highest ATP of 1504.9 mm, followed by SW, SC, NE, QTP, and NW, while XJ is only 149.0 mm. From Figure 5b, it can be seen that the interannual variation in ATP in China has obvious spatial heterogeneity. Among the seven regions of China, SC, XJ, QTP and most regions of NW and NE have increasing trends, but the statistically significant regions are mainly distributed in XJ, QTP, the western region of NW, the eastern region of NE, and the northeastern region of SC. However, SW, NC, the north of NE, and parts of NW show a decreasing but not statistically significant trend in ATP. From the regional scale on average (Table 1), the change rate of ATP over China is 5.9 mm/decade. Among the seven subregions, SC has the largest increase in ATP with a value of 16.8 mm/decade, followed by QTP with a value of 8.9 mm/decade. It is interesting that precipitation in XJ shows a surprisingly significant increasing trend with 6.6 mm/decade, while SW and NC show a decreasing, but not significant, trend with −8.8 and −4.4 mm/decade of change, respectively. Overall, precipitation in the subregions located in the north of China showed an increasing trend from 1961–2020, while those in the south showed a decreasing trend except for SC.

3.2. Characterization of Changes in Drought Events

3.2.1. Changes in Frequency of Drought Events

As can be seen from Figure 6a, the total frequency of drought events in China was above 60 times from 1961–2020. Among the seven subregions, NE had the highest frequency of drought events with 92.5 times, followed by SC, SW, and NC, with 91.9, 89.9, and 89.2 times, respectively, while the lowest frequency was QTP, with a value of 84.6 times. However, the interannual trend in drought event frequency (Figure 6b) differs from the mean spatial distribution pattern. The increasing rate of drought event frequency is statistically significant and remarkably higher in NW and QTP than in the other subregions, with change rates of 0.13 and 0.12 times/decade, respectively. In addition, SW and the north of XJ have a significantly increasing trend. On the contrary, the lowest change rate of drought event frequency is in SC, which has a very slight decreasing trend of −0.03 times/decade.

3.2.2. Changes in Drought Intensity

The readers need to keep in mind that in this section, the greater the negative direction of drought intensity the greater the intensity; the negative direction of the change rate means increased drought intensity, and the positive direction means weakened drought intensity. Figure 7a generally shows that the mean drought intensity is stronger in the subregions located in the north of China than those located in the south. Among the seven subregions, the drought intensity was stronger in XJ and QTP from 1961–2020, with regional mean intensities of −1.46 and −1.44, respectively, especially in the central part of the XJ region (within the Tarim Basin), and the southwestern part of QTP, where the mean intensity was above moderate drought with the mean intensity less than or equal to −1.5. There are some areas in SW, NW and NE with drought intensity ranging from −1.45 to −1.50, while the subregion with the least drought intensity is NC with a value of only −1.38. It is noteworthy that the interannual change rate is also greater for regions with higher mean drought intensity (Figure 7b). The drought intensities of XJ and QTP intensified significantly from 1961–2020, with a change rate of −0.03 and −0.02 per decade, respectively, while the subregions located in the south of China (e.g., SW, SC, and NC) showed a decreasing trend. However, the regions with significant change rates in drought intensity were all areas of increased drought (e.g., parts of QTP, XJ, NW, and NE), while none of the weakening regions were statistically significant.

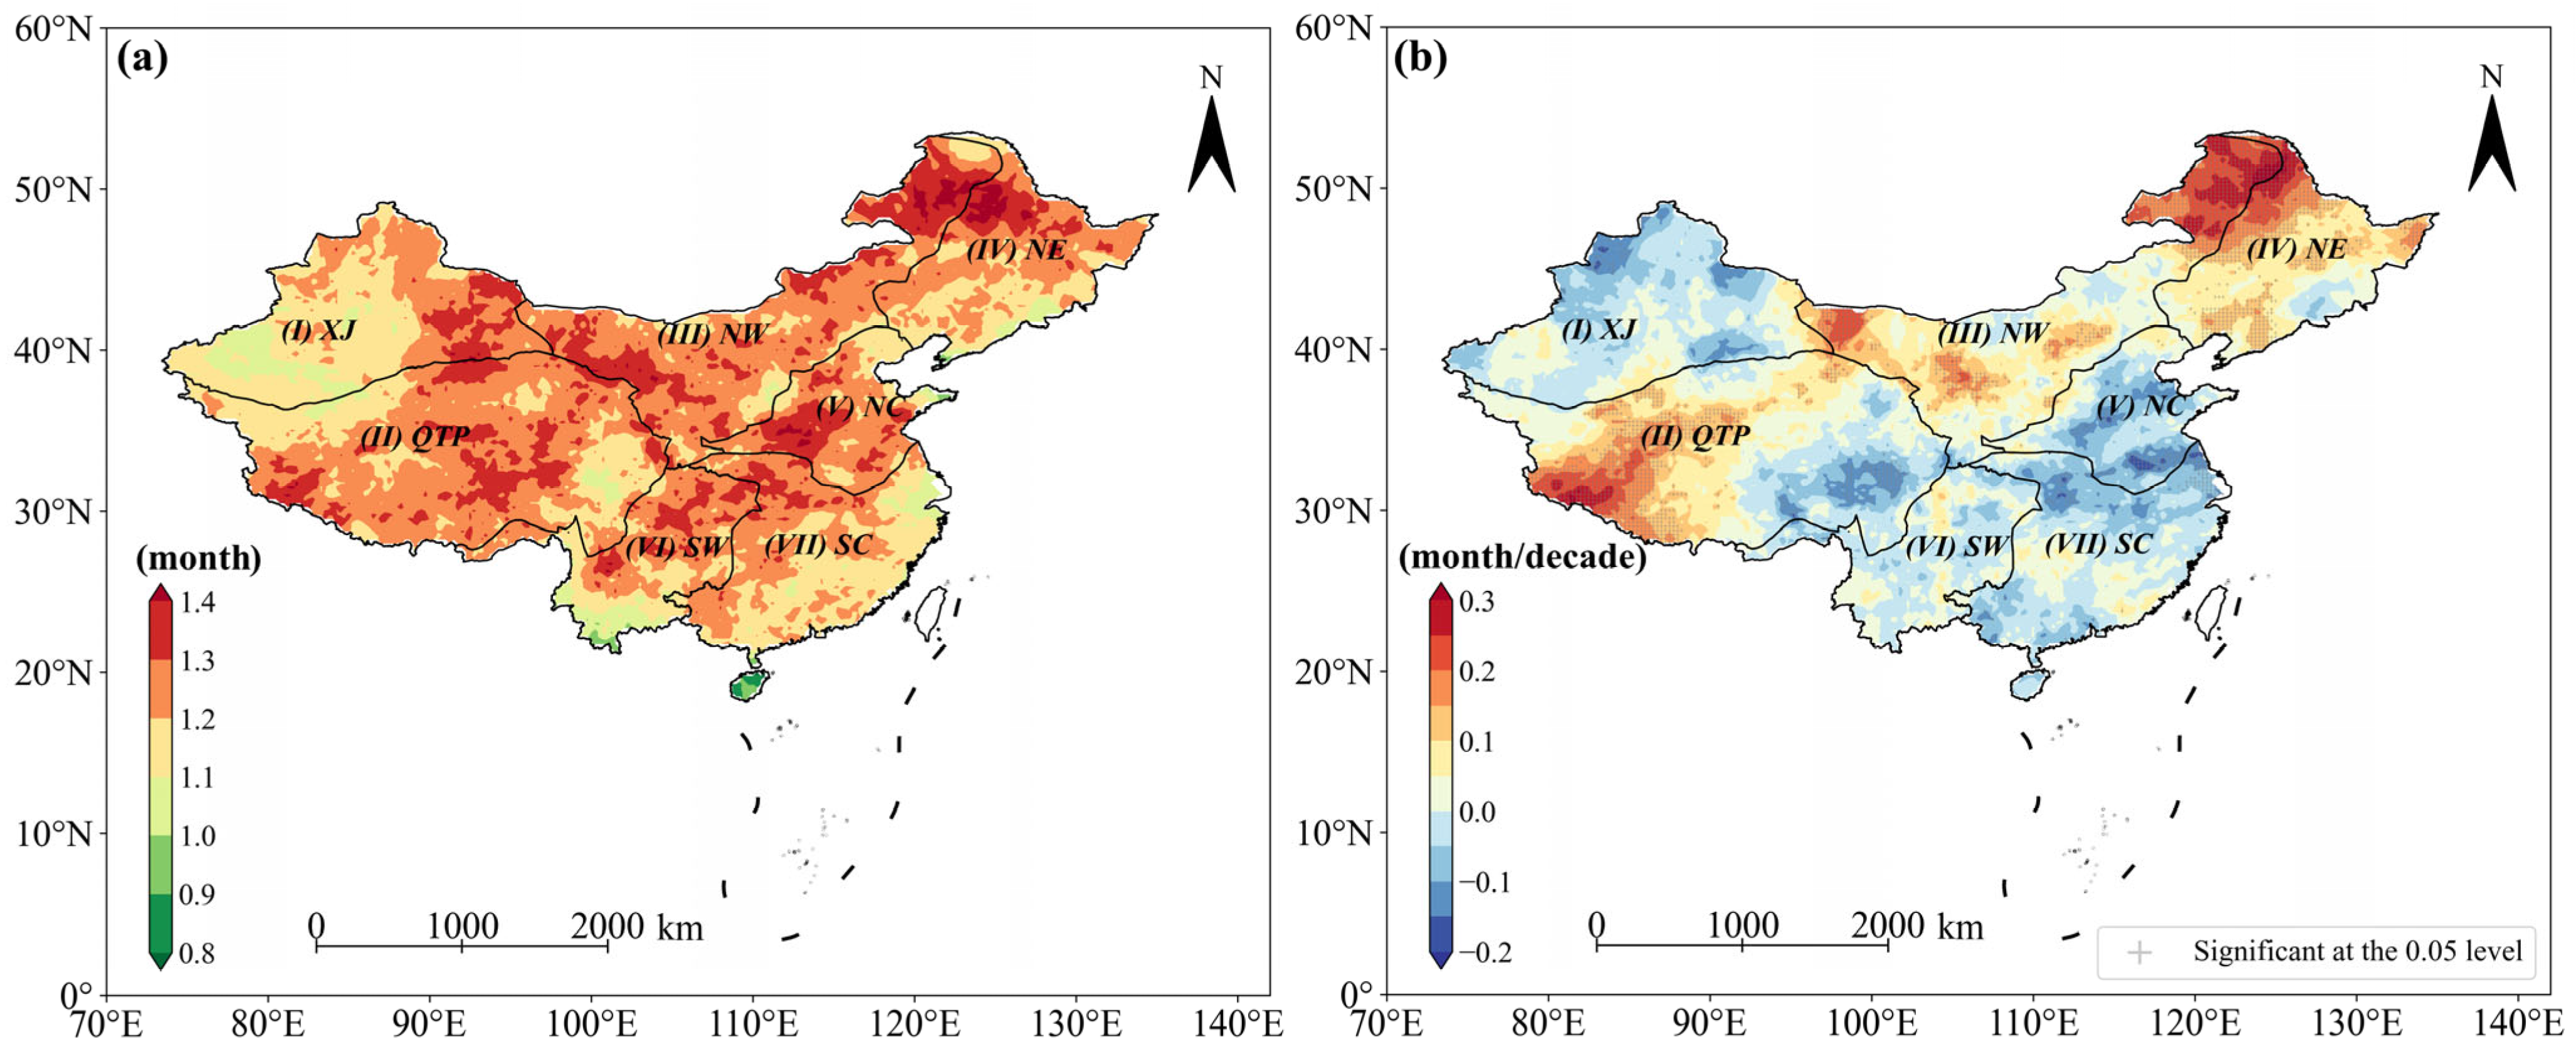
3.2.3. Changes in Drought Duration

Figure 8a shows that the area with a mean drought event duration of 1.2 to 1.3 months is larger than the other durations, accounting for 45.9% of the total area of the study area, which can be found in all subdivisions, but mainly distributed in NW, QTP, NC, and SW. The area of regions with a duration above 1.3 months accounted for 16.2% of the total area of the study area, and their distribution showed no obvious spatial clustering characteristics, while the regions with a mean duration of 1.1–1.2 months for drought events were mainly located in XJ and SC, indicating that drought events in these regions usually do not last long compared with other subregions. In terms of interannual variation in the duration of drought events (Figure 8b), southwestern QTP, northeastern NW, and the northern part of NE are the areas with high values of change rates that can reach 0.3 month/decade. From the subregional area average, NW and NE have the largest change rate overall, both at 0.10 month/decade, followed by QTP with a value of 0.05 month/decade. In contrast, the drought duration in the subregions located in the south of China (e.g., SW, SC, and NC) is in a slightly decreasing trend, but not significantly. It is noteworthy that the drought duration in the subregion XJ, located in the north of China, is also in a non-significant decreasing trend.

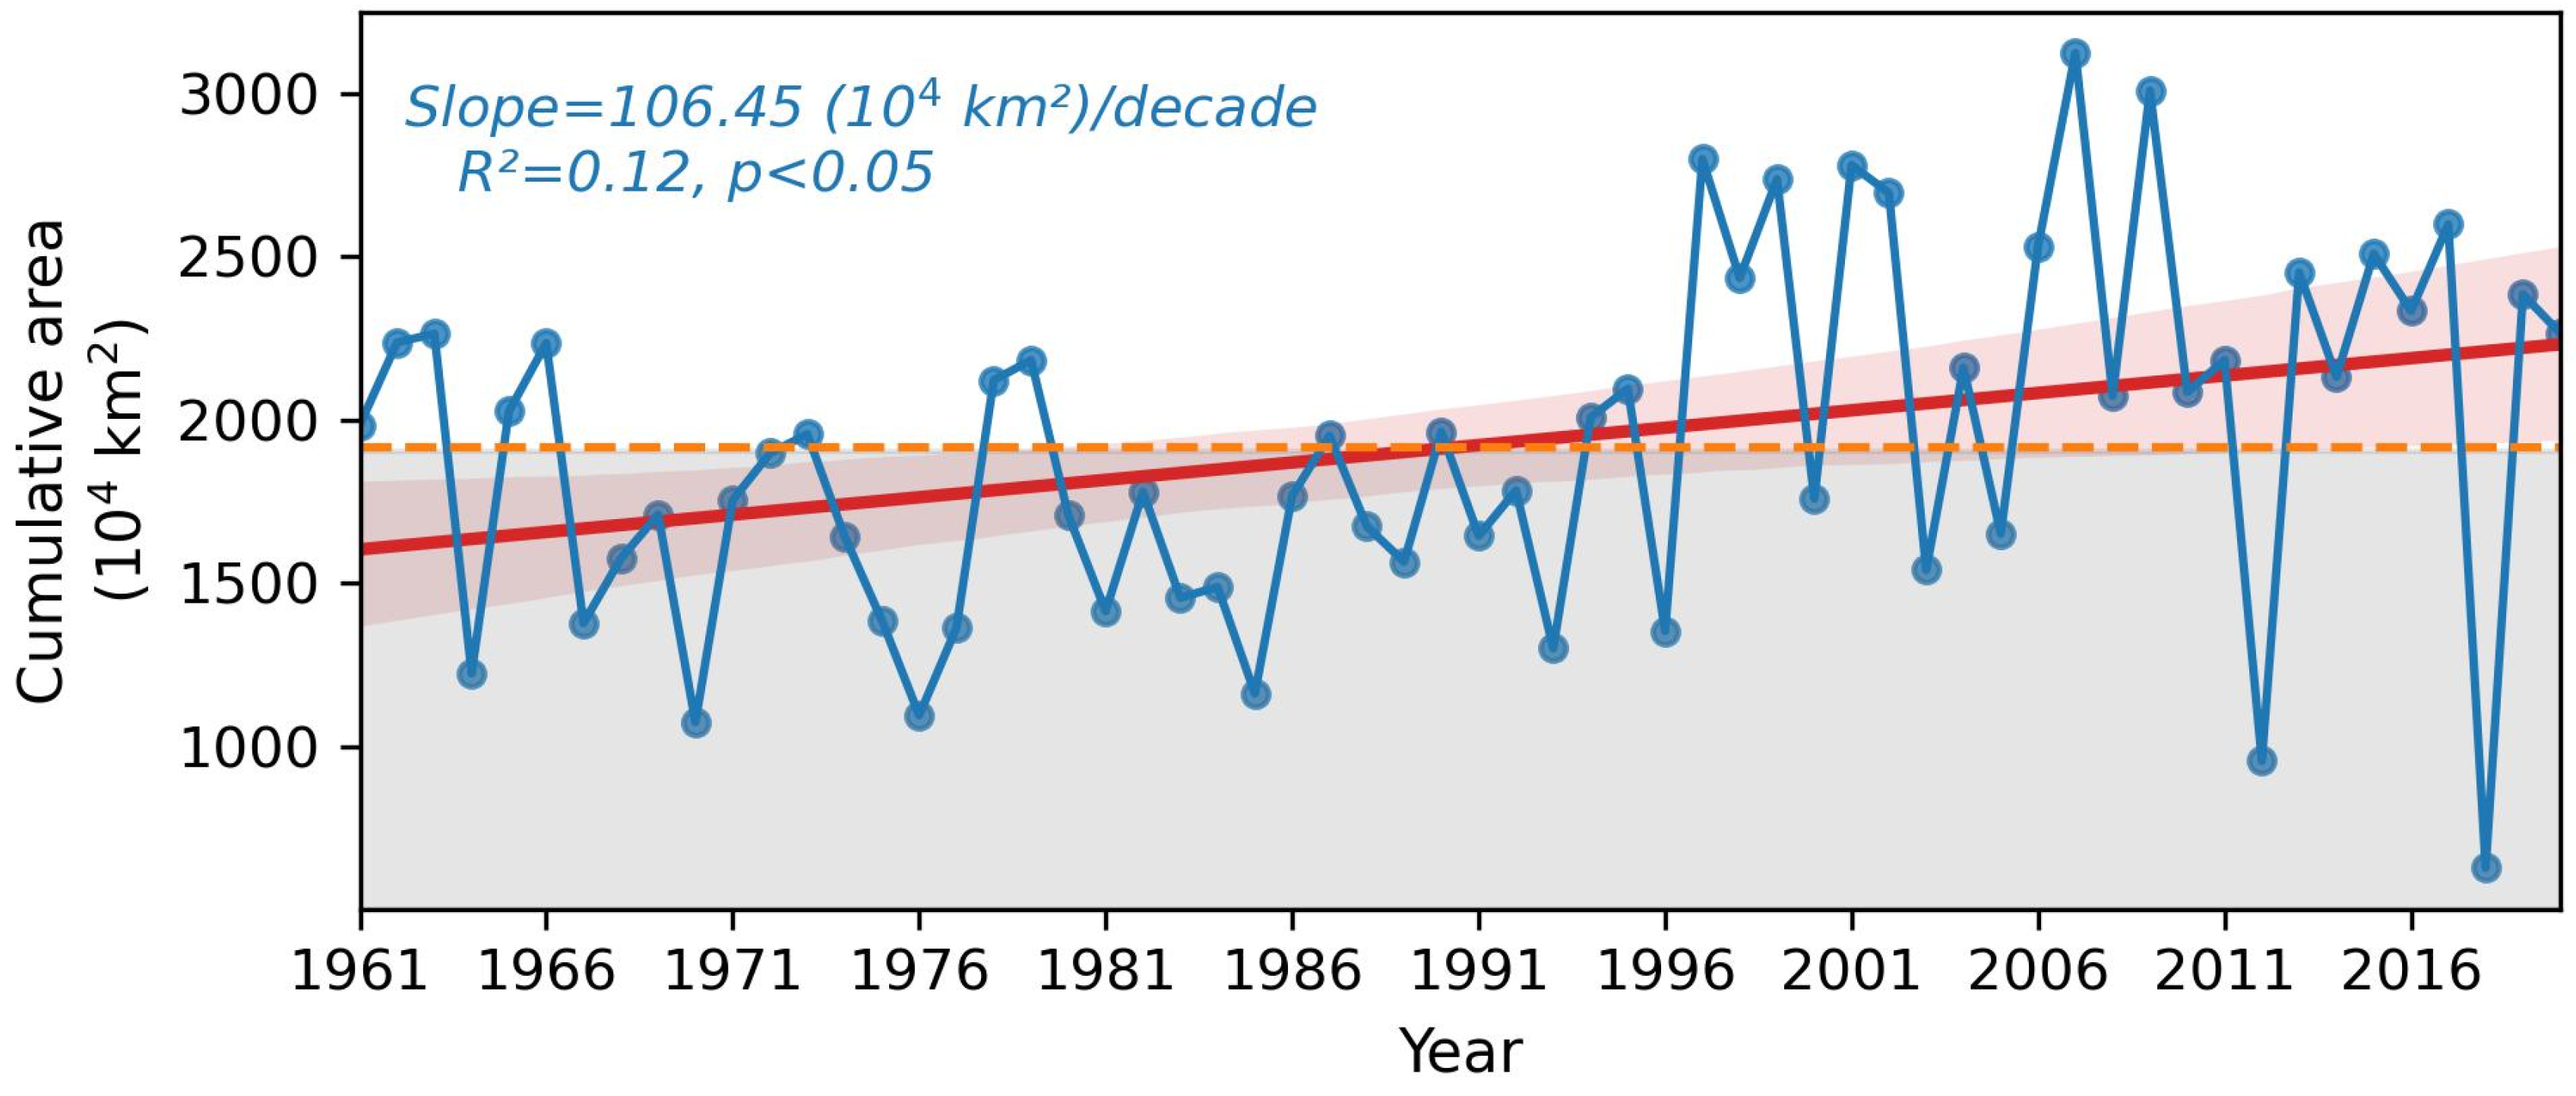
3.2.4. Changes in Cumulative Area of Drought

Figure 9 shows the interannual variation in the cumulative impact area (CIA) of drought in China, from which it is clear that the CIA shows a significant increasing trend from 1961–2020, with a change rate of 106.45 × 10⁴ km2/decade. The multi-year average of the CIA is 1918.03 × 104 km2/decade, based on which it is evident that the CIA is significantly higher for the period 1997–2020 compared to the period 1961–1996. From the variation characteristics of CIA in each subregion (Figure 10), the subregions with a significant increasing trend of CIA include QTP, NW, and NE with values of 51.24 × 10⁴ km2/decade, 40.31 × 10⁴ km2/decade and 17.65 × 10⁴ km2/decade, while the subregions with a decreasing trend in CIA were XJ and SC, but none of them were statistically significant. The remaining two subregions, NC and SW, although showing a slight increasing trend, were also both statistically insignificant.

4. Discussion

In this study, the variation characteristics of climate change in China and its seven geographic subregions, including XJ, QTP, NW, NE, NC, SW, and SC, from 1961–2020 period were first investigated. On the basis of the Intensity–Area–Duration (IAD) approach and monthly SPEI dataset derived from this study, the spatial and temporal variation characteristics of drought events’ intensity, duration, and impact area were explored. According to the methodology and findings presented in this study, some of the elements worth discussing are presented as follows:

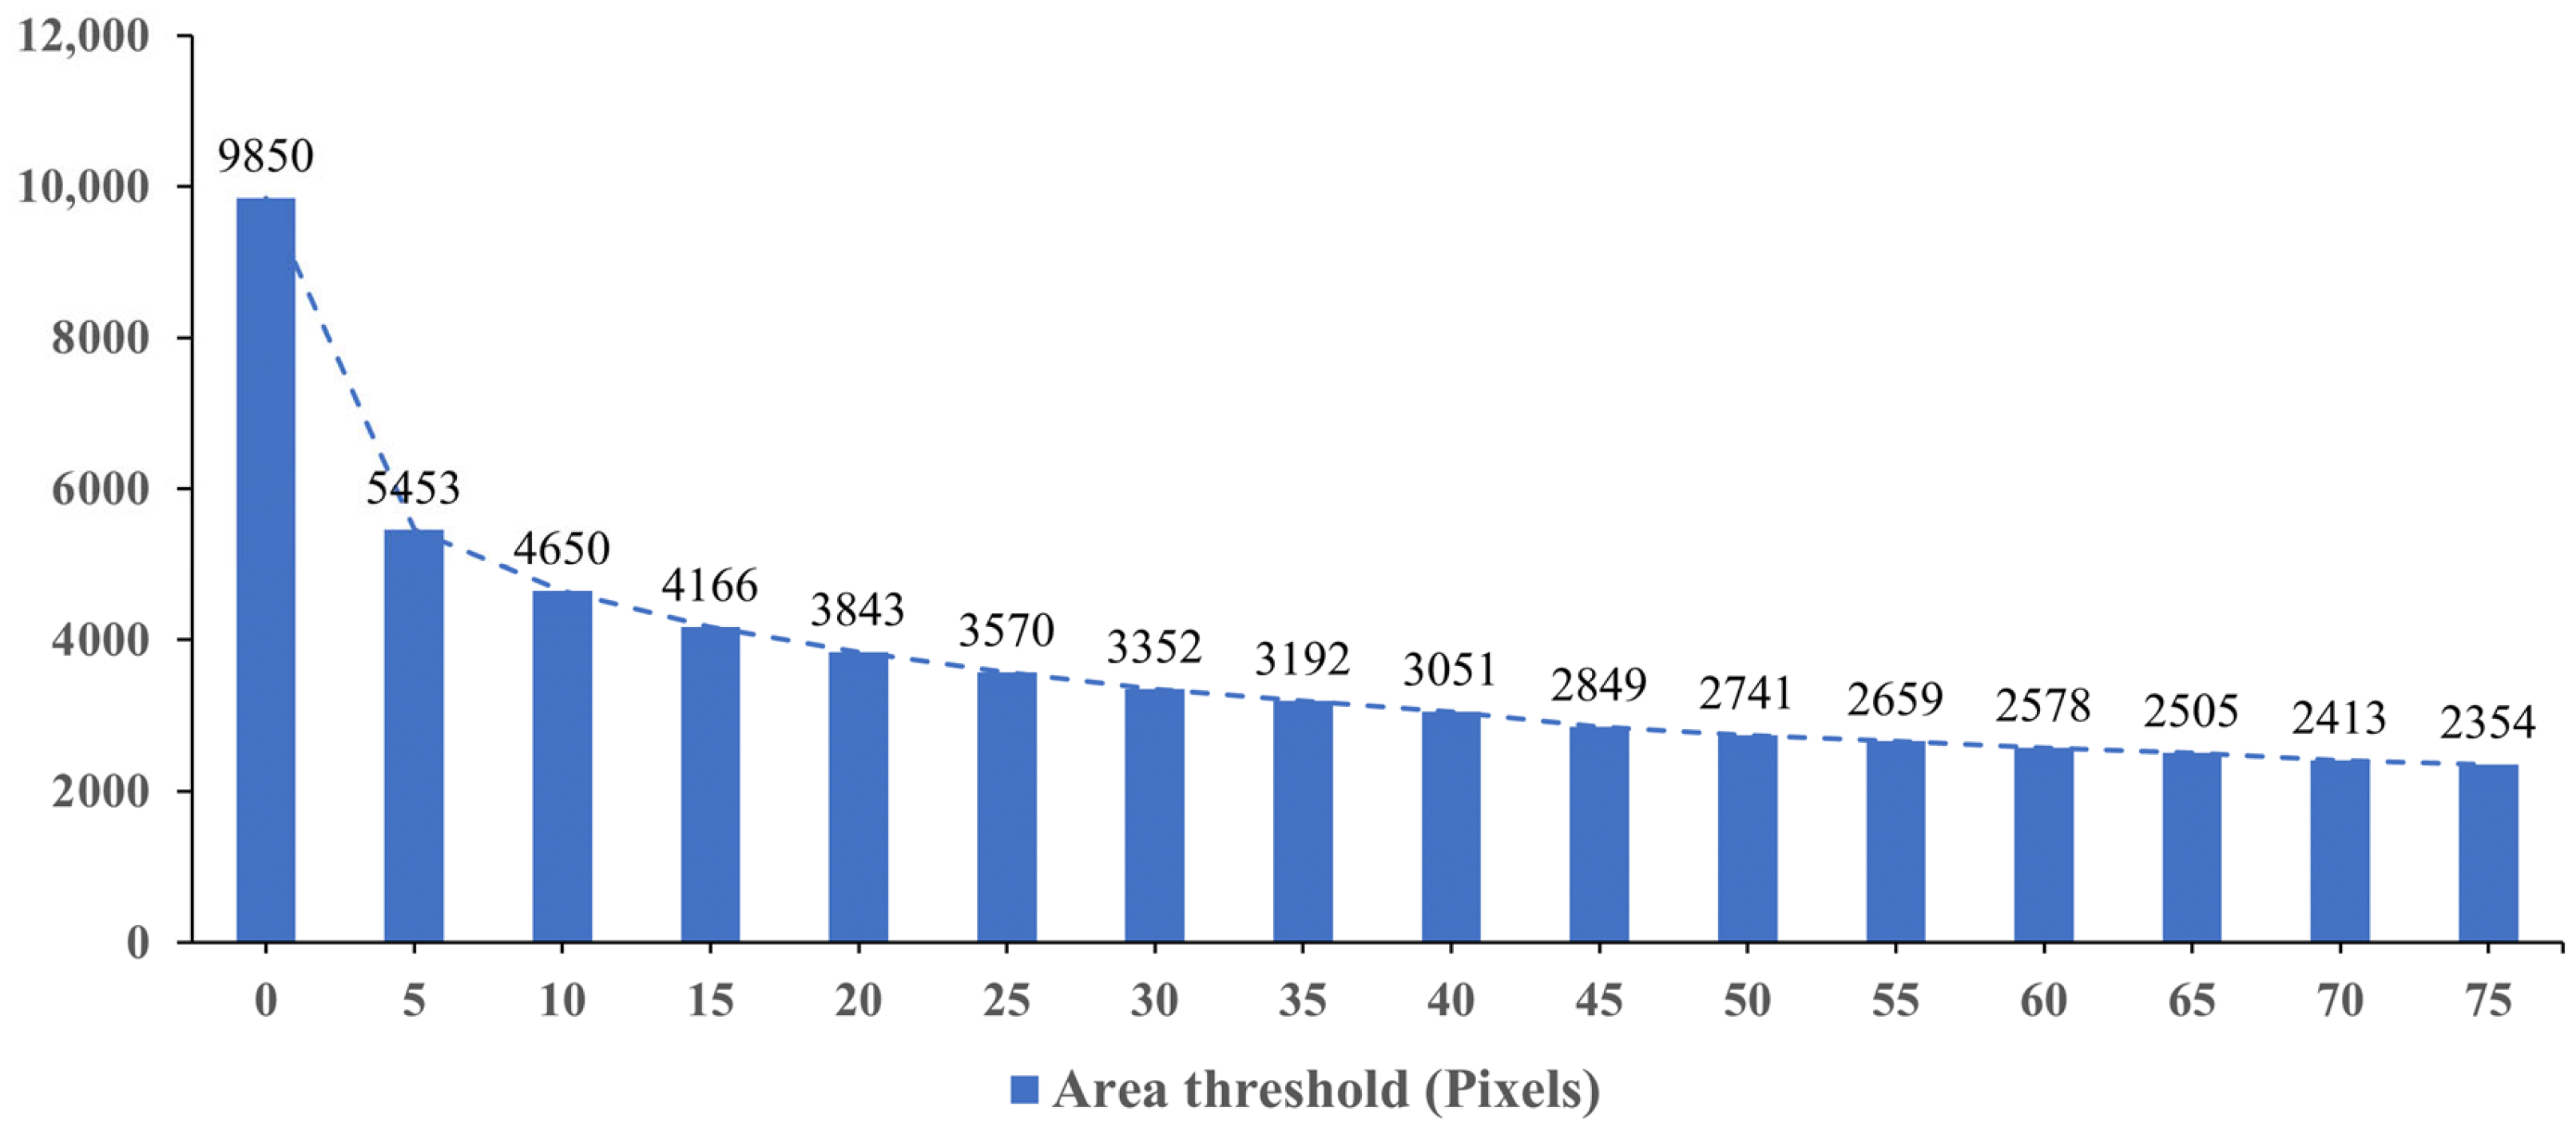
4.1. Determination of the Minimum Drought Area Threshold

Although we have discussed the issue of the minimum area threshold of heatwave events in our previous research [9], this parameter plays a crucial role in the analysis of results due to the significant differences it exhibits for data with different spatial resolutions, extreme climate types, and study area sizes [80,81]. At present, there are no standardized methods for establishing the minimum overlapping area threshold necessary for assessing the temporal and spatial continuity of events. Additionally, even within the same category of extreme climate events, various criteria are utilized, including different drought indices [60]. To improve the rationale and applicability of extreme climate event identification, the selection of this threshold should be context-specific, taking into account various influencing factors.
In the past two decades, there have been significant variations in the definition of the minimum area threshold for regional drought events. For example, Andreadis et al. [44] defined the minimum area threshold for events as approximately 2.5 × 10⁴ km2 with a spatial resolution of 0.5° × 0.5°, while other studies defined an area threshold of 50 × 104 km2 for drought event analysis [45,82]. In a study by Wang et al. [24], sensitivity tests were conducted to assess the impact of different minimum areas on the count of drought events, and they concluded that a minimum area threshold of 15 × 104 km2 was suitable for studying drought event evolution in China. Consequently, for the scientific and precise determination of the minimum drought threshold in this research, it is essential to perform a sensitivity analysis on the minimum drought area threshold.
Figure 11 illustrates that the total count of drought events decreased significantly, declining from 9850 to 2354 between 1961 and 2020 as the minimum area threshold increased from 0 to 75 grid points. It is important to note that the trend in the number of drought events stabilizes gradually once the minimum area threshold surpasses 30 pixels. Consequently, for this study, we set the minimum overlapping area threshold at 30 pixels, with a spatial resolution of 0.25° × 0.25°.

4.2. Possible Links between Climate Change and Drought Events

Although this study has extensively investigated the characteristics of drought events under climate change, specifically analyzing the variations in maximum, minimum, and mean temperature, as well as precipitation from 1961 to 2020, and further examining the frequency, intensity, duration, and impact area of drought events, it does not delve into the causes or mechanisms underlying the changes in drought occurrence. Therefore, in this section, we will discuss the potential impacts of climate change on key features of drought events in this region.
Climate change on a global scale has led to an increase in surface temperatures and alterations in precipitation patterns, thereby exerting a significant influence on the frequency of drought events [83]. For instance, according to the Intergovernmental Panel on Climate Change (IPCC) Fifth Assessment Report, the global mean temperature has risen by approximately 0.85 °C since the Industrial Revolution and is projected to continue increasing in the coming decades [84]. Increasing temperature has resulted in more frequent heat events, accelerating soil moisture evaporation, and vegetation transpiration, leading to more drought events [85]. In the past few decades, the frequency of global drought events has indeed shown a notable increase [86]. Research indicates that the majority of drought events worldwide are linked to climate change, with warm and arid conditions being significant factors contributing to the frequent occurrence of droughts [87]. In fact, not only on a global scale but also in various regions, studies have demonstrated the significant impact of temperature and precipitation changes on the frequency of drought events [88,89]. Additionally, temperature and precipitation changes also affect the extent of the impact area of drought events [90].
Additionally, it is worth noting the changes in drought events in the southwestern part of the QTP. Drought events in this subregion have exhibited a significant increase in frequency, intensity, duration, and even impact area. The potential causes can be attributed to a combination of climate change [11], topographical factors [91], and the overall influence of human activities [92]. Specifically, global climate warming has resulted in rising temperatures in the southwestern region of the QTP. This exacerbates the evaporation process and accelerates the evaporation of soil moisture [93]. Due to the already limited distribution of precipitation in this area (Figure 5a), the soil becomes drier. Furthermore, the region features complex terrain with mountains, plateaus, deep valleys, and river valleys. These topographical and geomorphological features contribute to spatial variations in climate, creating significant differences between wet and dry areas. Moreover, the mountains and plateaus in the southwestern part of the QTP also influence the distribution of precipitation, resulting in a “rain shadow effect” that causes certain regions to experience scarce rainfall and intensifies the severity of drought [94]. Finally, human activities may play a role in exacerbating drought in the southwestern region of the QTP. Land use changes, excessive grazing, and water resource development activities can alter vegetation cover and disrupt the water cycle, further aggravating soil dryness [95].

5. Conclusions

The subsequent content provides an overview of the principal discoveries made in the current research.
The subregions in the north of China (i.e., XJ, QTP, NW, and NE) have lower multi-year mean, maximum, and minimum temperatures than the subregions in the south (i.e., NC, SW, and SC), but, in contrast, their interannual change rates all exhibit higher rates of change in the northern subregion of China than in the southern subregion. It is noteworthy that the increasing rate of the maximum temperature is significantly lower than the increasing rate of the mean temperature, while the interannual variation in the minimum temperature is higher than the other two temperatures, especially in the QTP subregion. The annual total precipitation in China shows a clear spatial pattern of decreasing southeast–northwest gradient, with XJ, QTP, the western regions of NW, the eastern part of NE, and the northeastern part of SC showing statistically significant increasing trends, while SW, NC, the southwestern part of NE, and the southern and eastern parts of NW show decreasing but insignificant precipitation trends.
The frequency of drought events was high in China from 1961–2020, with NE having the most frequent drought events, followed by SC, SW, and NC. Interannual trends in drought events varied across subregions, with a significant increase in the frequency of drought events in NW and QTP, whereas there was a slight decrease in SC. Regarding the drought intensity, it was greater in XJ and QTP, while lesser in NC. The change rate was also greater in regions with higher drought intensity, especially in XJ and QTP, where drought intensity increased significantly. The cumulative impact area (CIA) of drought in China showed a significant increasing trend, mainly concentrated in QTP, NW, and NE. The areas with a longer duration of drought events were mainly distributed in NW, QTP, NC, and SW, while XJ and SC had a shorter duration of drought events. In addition, it is very noteworthy that the southwestern part of the QTP shows a significant increase in the frequency, intensity, and duration of drought events from 1961–2020, and the QTP as a whole shows a significant increase in the drought-affected area, which needs to be focused on this region. Overall, these findings are important for understanding the drought situation in China and the related water resources management and climate change adaptation.

Author Contributions

Conceptualization, J.L.; methodology, Y.R. and J.L.; software, J.L.; validation, J.L. and Y.R.; formal analysis, Y.R. and J.L.; investigation, Y.R. and J.L.; resources, J.L.; data curation, J.L.; writing—original draft preparation, Y.R. and J.L.; writing—review and editing, Y.R., J.L., P.W., T.L. and Q.B.P.; supervision, Y.R. and J.L. All authors have read and agreed to the published version of the manuscript.

Funding

This research was jointly funded by the K.C. Wong Education Foundation under Grant Number GJTD-2020-14, The Tianshan Talent Training Program of Xinjiang Uygur Autonomous region under Grant Number 2022TSYCLJ0011, the Key Program of National Natural Science Foundation of China under Grant Number 42230708, Henan Province Joint Fund Project of Science and Technology (222103810097), The Belt and Road Special Foundation of the State Key Laboratory of Hydrology-Water Resources and Hydraulic Engineering (2021491411), and The Third Integrated Scientific Expedition Project in Xinjiang under Grant Number 2021xjkk070104.

Data Availability Statement

The data presented in this study are available on request from the corresponding author.

Acknowledgments

The authors would like to thank Jun Wang from the Institute of Atmospheric Physics, Chinese Academy of Sciences, who provided the CN05.1 dataset.

Conflicts of Interest

The authors declare no conflict of interest.

References

  1. Abbass, K.; Qasim, M.Z.; Song, H.; Murshed, M.; Mahmood, H.; Younis, I. A review of the global climate change impacts, adaptation, and sustainable mitigation measures. Environ. Sci. Pollut. Res. 2022, 29, 42539–42559. [Google Scholar] [CrossRef] [PubMed]
  2. Mishra, P. Socio-economic impacts of climate change in Odisha: Issues, challenges and policy options. J. Clim. Change 2017, 3, 93–107. [Google Scholar] [CrossRef]
  3. Borrelli, P.; Robinson, D.A.; Panagos, P.; Lugato, E.; Yang, J.E.; Alewell, C.; Wuepper, D.; Montanarella, L.; Ballabio, C. Land use and climate change impacts on global soil erosion by water (2015–2070). Proc. Natl. Acad. Sci. USA 2020, 117, 21994–22001. [Google Scholar] [CrossRef]
  4. Grillakis, M.G. Increase in severe and extreme soil moisture droughts for Europe under climate change. Sci. Total Environ. 2019, 660, 1245–1255. [Google Scholar] [CrossRef] [PubMed]
  5. Swain, D.; Wing, O.E.; Bates, P.D.; Done, J.; Johnson, K.; Cameron, D. Increased flood exposure due to climate change and population growth in the United States. Earth’s Future 2020, 8, e2020EF001778. [Google Scholar] [CrossRef]
  6. Tamarin-Brodsky, T.; Kaspi, Y. Enhanced poleward propagation of storms under climate change. Nat. Geosci. 2017, 10, 908–913. [Google Scholar] [CrossRef]
  7. Abram, N.J.; Henley, B.J.; Sen Gupta, A.; Lippmann, T.J.; Clarke, H.; Dowdy, A.J.; Sharples, J.J.; Nolan, R.H.; Zhang, T.; Wooster, M.J. Connections of climate change and variability to large and extreme forest fires in southeast Australia. Commun. Earth Environ. 2021, 2, 8. [Google Scholar] [CrossRef]
  8. Liu, J.; Ren, Y.; Tao, H.; Shalamzari, M.J. Spatial and Temporal Variation Characteristics of Heatwaves in Recent Decades over China. Remote Sens. 2021, 13, 3824. [Google Scholar] [CrossRef]
  9. Ren, Y.; Liu, J.; Zhang, T.; Shalamzari, M.J.; Arshad, A.; Liu, T.; Willems, P.; Gao, H.; Tao, H.; Wang, T. Identification and Analysis of Heatwave Events Considering Temporal Continuity and Spatial Dynamics. Remote Sens. 2023, 15, 1369. [Google Scholar] [CrossRef]
  10. Cook, B.I.; Mankin, J.S.; Anchukaitis, K.J. Climate change and drought: From past to future. Curr. Clim. Change Rep. 2018, 4, 164–179. [Google Scholar] [CrossRef]
  11. Mukherjee, S.; Mishra, A.; Trenberth, K.E. Climate change and drought: A perspective on drought indices. Curr. Clim. Change Rep. 2018, 4, 145–163. [Google Scholar] [CrossRef]
  12. Haile, G.G.; Tang, Q.; Li, W.; Liu, X.; Zhang, X. Drought: Progress in broadening its understanding. Wiley Interdiscip. Rev. Water 2020, 7, e1407. [Google Scholar] [CrossRef]
  13. Haile, G.G.; Tang, Q.; Sun, S.; Huang, Z.; Zhang, X.; Liu, X. Droughts in East Africa: Causes, impacts and resilience. Earth-Sci. Rev. 2019, 193, 146–161. [Google Scholar] [CrossRef]
  14. Zhu, Y.; Liu, Y.; Wang, W.; Singh, V.P.; Ma, X.; Yu, Z. Three dimensional characterization of meteorological and hydrological droughts and their probabilistic links. J. Hydrol. 2019, 578, 124016. [Google Scholar] [CrossRef]
  15. Luo, L.; Apps, D.; Arcand, S.; Xu, H.; Pan, M.; Hoerling, M. Contribution of temperature and precipitation anomalies to the California drought during 2012–2015. Geophys. Res. Lett. 2017, 44, 3184–3192. [Google Scholar] [CrossRef]
  16. Pagsuyoin, S.; Santos, J.; Salcedo, G.; Yip, C. Spatio-temporal drought risk analysis using GIS-based input output modeling. Adv. Spat. Econ. Model. Disaster Impacts 2019, 375–397. [Google Scholar]
  17. Li, Y.; Ren, T.; Kinney, P.L.; Joyner, A.; Zhang, W. Projecting future climate change impacts on heat-related mortality in large urban areas in China. Environ. Res. 2018, 163, 171–185. [Google Scholar] [CrossRef] [PubMed]
  18. Kantamaneni, K.; Li, Q.; Wu, H.; Zhu, M.; Apostolopoulou, A.; Xu, W.; Kenawy, I.; Rajendran, L.P.; Rice, L.; Jimenez-Bescos, C. Towards a Combined Physical and Social Evaluation of Climate Vulnerability in Coastal Urban Megacities. Water 2023, 15, 712. [Google Scholar] [CrossRef]
  19. Wang, X.; Luo, P.; Zheng, Y.; Duan, W.; Wang, S.; Zhu, W.; Zhang, Y.; Nover, D. Drought Disasters in China from 1991 to 2018: Analysis of Spatiotemporal Trends and Characteristics. Remote Sens. 2023, 15, 1708. [Google Scholar] [CrossRef]
  20. Li, J.; Wang, Z.; Lai, C. Severe drought events inducing large decrease of net primary productivity in mainland China during 1982–2015. Sci. Total Environ. 2020, 703, 135541. [Google Scholar] [CrossRef]
  21. He, J.; Yang, X.; Li, Z.; Zhang, X.; Tang, Q. Spatiotemporal Variations of Meteorological Droughts in China During 1961–2014: An Investigation Based on Multi-Threshold Identification. Int. J. Disaster Risk Sci. 2016, 7, 63–76. [Google Scholar] [CrossRef]
  22. Barriopedro, D.; Gouveia, C.M.; Trigo, R.M.; Wang, L. The 2009/10 Drought in China: Possible Causes and Impacts on Vegetation. J. Hydrometeorol. 2012, 13, 1251–1267. [Google Scholar] [CrossRef]
  23. Changming, L.; Shifeng, Z. Drying up of the yellow river: Its impacts and counter-measures. Mitig. Adapt. Strateg. Glob. Change 2002, 7, 203–214. [Google Scholar] [CrossRef]
  24. Wang, A.; Lettenmaier, D.P.; Sheffield, J. Soil Moisture Drought in China, 1950–2006. J. Clim. 2011, 24, 3257–3271. [Google Scholar] [CrossRef]
  25. Yang, J.; Gong, D.; Wang, W.; Hu, M.; Mao, R. Extreme drought event of 2009/2010 over southwestern China. Meteorol. Atmos. Phys. 2012, 115, 173–184. [Google Scholar] [CrossRef]
  26. Huang, S.; Wang, L.; Wang, H.; Huang, Q.; Leng, G.; Fang, W.; Zhang, Y. Spatio-temporal characteristics of drought structure across China using an integrated drought index. Agric. Water Manag. 2019, 218, 182–192. [Google Scholar] [CrossRef]
  27. Guo, E.; Liu, X.; Zhang, J.; Wang, Y.; Wang, C.; Wang, R.; Li, D. Assessing spatiotemporal variation of drought and its impact on maize yield in Northeast China. J. Hydrol. 2017, 553, 231–247. [Google Scholar] [CrossRef]
  28. McKee, T.B.; Doesken, N.J.; Kleist, J. The relationship of drought frequency and duration to time scales. In Proceedings of the 8th Conference on Applied Climatology, Anaheim, CA, USA, 17–22 January 1993; pp. 179–183. [Google Scholar]
  29. Palmer, W.C. Meteorological Drought; US Department of Commerce, Weather Bureau: Washington, DC, USA, 1965; Volume 30.
  30. Vicente-Serrano, S.M.; Beguería, S.; López-Moreno, J.I. A Multiscalar Drought Index Sensitive to Global Warming: The Standardized Precipitation Evapotranspiration Index. J. Clim. 2010, 23, 1696–1718. [Google Scholar] [CrossRef]
  31. Byun, H.-R.; Wilhite, D.A. Objective Quantification of Drought Severity and Duration. J. Clim. 1999, 12, 2747–2756. [Google Scholar] [CrossRef]
  32. Sepulcre-Canto, G.; Horion, S.; Singleton, A.; Carrao, H.; Vogt, J. Development of a Combined Drought Indicator to detect agricultural drought in Europe. Nat. Hazards Earth Syst. Sci. 2012, 12, 3519–3531. [Google Scholar] [CrossRef]
  33. Wu, H.; Hayes, M.J.; Weiss, A.; Hu, Q. An evaluation of the Standardized Precipitation Index, the China-Z Index and the statistical Z-Score. Int. J. Climatol. 2001, 21, 745–758. [Google Scholar] [CrossRef]
  34. Ju, X.; Yang, X.; Chen, L.; Wang, Y. Research on determination of station indexes and division of regional flood/drought grades in China. J. Appl. Meteorol. 1997, 8, 26–33. [Google Scholar]
  35. Byun, H.-R.; Wilhite, D.A. Daily quantification of drought severity and duration. J. Clim. 1996, 5, 1181–1201. [Google Scholar]
  36. Hao, Z.; AghaKouchak, A. A Nonparametric Multivariate Multi-Index Drought Monitoring Framework. J. Hydrometeorol. 2014, 15, 89–101. [Google Scholar] [CrossRef]
  37. Hao, Z.; AghaKouchak, A. Multivariate Standardized Drought Index: A parametric multi-index model. Adv. Water Resour. 2013, 57, 12–18. [Google Scholar] [CrossRef]
  38. Hayes, M.J.; Svoboda, M.D.; Wiihite, D.A.; Vanyarkho, O.V. Monitoring the 1996 drought using the standardized precipitation index. Bull. Am. Meteorol. Soc. 1999, 80, 429–438. [Google Scholar] [CrossRef]
  39. Wu, J.; Liu, Z.; Yao, H.; Chen, X.; Chen, X.; Zheng, Y.; He, Y. Impacts of reservoir operations on multi-scale correlations between hydrological drought and meteorological drought. J. Hydrol. 2018, 563, 726–736. [Google Scholar] [CrossRef]
  40. Wang, Q.; Wu, J.; Lei, T.; He, B.; Wu, Z.; Liu, M.; Mo, X.; Geng, G.; Li, X.; Zhou, H.; et al. Temporal-spatial characteristics of severe drought events and their impact on agriculture on a global scale. Quat. Int. 2014, 349, 10–21. [Google Scholar] [CrossRef]
  41. Liu, Y.; Chen, J.; Pan, T. Spatial and temporal patterns of drought hazard for China under different RCP scenarios in the 21st century. Int. J. Disaster Risk Reduct. 2021, 52, 101948. [Google Scholar] [CrossRef]
  42. Vernieuwe, H.; De Baets, B.; Verhoest, N.E.C. A mathematical morphology approach for a qualitative exploration of drought events in space and time. Int. J. Climatol. 2020, 40, 530–543. [Google Scholar] [CrossRef]
  43. Dracup, J.A.; Lee, K.S.; Paulson, E.G., Jr. On the definition of droughts. Water Resour. Res. 1980, 16, 297–302. [Google Scholar] [CrossRef]
  44. Andreadis, K.M.; Clark, E.A.; Wood, A.W.; Hamlet, A.F.; Lettenmaier, D.P. Twentieth-Century Drought in the Conterminous United States. J. Hydrometeorol. 2005, 6, 985–1001. [Google Scholar] [CrossRef]
  45. Sheffield, J.; Andreadis, K.M.; Wood, E.F.; Lettenmaier, D.P. Global and Continental Drought in the Second Half of the Twentieth Century: Severity–Area–Duration Analysis and Temporal Variability of Large-Scale Events. J. Clim. 2009, 22, 1962–1981. [Google Scholar] [CrossRef]
  46. Jing, C.; Hong-bin, L.; Yan-jun, W.; An-qian, W.; Bu-da, S.; Hui, J. Variation of drought characteristics and its agricultural exposure in North China Plain. Chin. J. Agrometeorol. 2016, 37, 587. [Google Scholar]
  47. Zhai, J.; Huang, J.; Su, B.; Cao, L.; Wang, Y.; Jiang, T.; Fischer, T. Intensity–area–duration analysis of droughts in China 1960–2013. Clim. Dyn. 2017, 48, 151–168. [Google Scholar] [CrossRef]
  48. Huang, J.; Mondal, S.K.; Zhai, J.; Fischer, T.; Wang, Y.; Su, B.; Wang, G.; Gao, M.; Jiang, S.; Tao, H. Intensity-area-duration-based drought analysis under 1.5 °C–4.0 °C warming using CMIP6 over a climate hotspot in South Asia. J. Clean. Prod. 2022, 345, 131106. [Google Scholar] [CrossRef]
  49. Huang, J.; Zhai, J.; Jiang, T.; Wang, Y.; Li, X.; Wang, R.; Xiong, M.; Su, B.; Fischer, T. Analysis of future drought characteristics in China using the regional climate model CCLM. Clim. Dyn. 2018, 50, 507–525. [Google Scholar] [CrossRef]
  50. Yang, R.; Xing, B. Evidence for Intensification in Meteorological Drought since the 1950s and Recent Dryness–Wetness Forecasting in China. Atmosphere 2022, 13, 745. [Google Scholar] [CrossRef]
  51. Lei, H.; Zhao, H.; Ao, T. A two-step merging strategy for incorporating multi-source precipitation products and gauge observations using machine learning classification and regression over China. Hydrol. Earth Syst. Sci. 2022, 26, 2969–2995. [Google Scholar] [CrossRef]
  52. Zhang, M.; Liu, H.; Wang, K.; Chen, Y.; Ren, Y.; Yue, Y.; Deng, Z.; Zhang, C. Nonlinear trends of vegetation changes in different geomorphologic zones and land use types of the Yangtze River basin, China. Land Degrad. Dev. 2023, 34, 2548–2559. [Google Scholar] [CrossRef]
  53. Zhang, D.e. Severe Drought Events as Revealed in the Climate Records of China and Their Temperature Situations over the Last 1000 Years*. Acta Meteorol. Sin. 2005, 19, 485–491. [Google Scholar]
  54. Chen, X.; Cui, X.; Gao, J. Differentiated agricultural sensitivity and adaptability to rising temperatures across regions and sectors in China. J. Environ. Econ. Manag. 2023, 119, 102801. [Google Scholar] [CrossRef]
  55. Wu, J.; GAO, X.-J. A gridded daily observation dataset over China region and comparison with the other datasets. Chin. J. Geophys. 2013, 56, 1102–1111. [Google Scholar]
  56. Wu, J.; Gao, X.; Giorgi, F.; Chen, D. Changes of effective temperature and cold/hot days in late decades over China based on a high resolution gridded observation dataset. Int. J. Climatol. 2017, 37, 788–800. [Google Scholar] [CrossRef]
  57. Xie, P.; Chen, M.; Yang, S.; Yatagai, A.; Hayasaka, T.; Fukushima, Y.; Liu, C. A gauge-based analysis of daily precipitation over East Asia. J. Hydrometeorol. 2007, 8, 607–626. [Google Scholar] [CrossRef]
  58. Xu, Y.; Gao, X.; Shen, Y.; Xu, C.; Shi, Y.; Giorgi, F. A daily temperature dataset over China and its application in validating a RCM simulation. Adv. Atmos. Sci. 2009, 26, 763–772. [Google Scholar] [CrossRef]
  59. Climate Change Research Center, C.A.S. CN05 Gridded Observation Dataset. Available online: https://ccrc.iap.ac.cn/resource/detail?id=228 (accessed on 31 May 2023).
  60. Ren, Y.; Liu, J.; Shalamzari, M.J.; Arshad, A.; Liu, S.; Liu, T.; Tao, H. Monitoring Recent Changes in Drought and Wetness in the Source Region of the Yellow River Basin, China. Water 2022, 14, 861. [Google Scholar] [CrossRef]
  61. Li, X.; He, B.; Quan, X.; Liao, Z.; Bai, X. Use of the standardized precipitation evapotranspiration index (SPEI) to characterize the drying trend in southwest China from 1982–2012. Remote Sens. 2015, 7, 10917–10937. [Google Scholar] [CrossRef]
  62. Beguería, S.; Vicente-Serrano, S.M.; Reig, F.; Latorre, B. Standardized precipitation evapotranspiration index (SPEI) revisited: Parameter fitting, evapotranspiration models, tools, datasets and drought monitoring. Int. J. Climatol. 2014, 34, 3001–3023. [Google Scholar] [CrossRef]
  63. Himayoun, D.; Roshni, T. Spatio-temporal variation of drought characteristics, water resource availability and the relation of drought with large scale climate indices: A case study of Jhelum basin, India. Quat. Int. 2019, 525, 140–150. [Google Scholar] [CrossRef]
  64. Li, X.; Huang, W.-R. How long should the pre-existing climatic water balance be considered when capturing short-term wetness and dryness over China by using SPEI? Sci. Total Environ. 2021, 786, 147575. [Google Scholar] [CrossRef]
  65. Kamruzzaman, M.; Almazroui, M.; Salam, M.; Mondol, M.A.H.; Rahman, M.M.; Deb, L.; Kundu, P.K.; Zaman, M.A.U.; Islam, A.R.M.T. Spatiotemporal drought analysis in Bangladesh using the standardized precipitation index (SPI) and standardized precipitation evapotranspiration index (SPEI). Sci. Rep. 2022, 12, 20694. [Google Scholar] [CrossRef]
  66. Wang, Q.; Zhang, R.; Qi, J.; Zeng, J.; Wu, J.; Shui, W.; Wu, X.; Li, J. An improved daily standardized precipitation index dataset for mainland China from 1961 to 2018. Sci. Data 2022, 9, 124. [Google Scholar] [CrossRef] [PubMed]
  67. Dikshit, A.; Pradhan, B.; Huete, A. An improved SPEI drought forecasting approach using the long short-term memory neural network. J. Environ. Manag. 2021, 283, 111979. [Google Scholar] [CrossRef]
  68. Hargreaves, G.H.; Allen, R.G. History and Evaluation of Hargreaves Evapotranspiration Equation. J. Irrig. Drain. Eng. 2003, 129, 53–63. [Google Scholar] [CrossRef]
  69. Qaisrani, Z.N.; Nuthammachot, N.; Techato, K.; Asadullah. Drought monitoring based on Standardized Precipitation Index and Standardized Precipitation Evapotranspiration Index in the arid zone of Balochistan province, Pakistan. Arab. J. Geosci. 2021, 14, 11. [Google Scholar] [CrossRef]
  70. Hargreaves, G.H.; Samani, Z.A. Reference Crop Evapotranspiration from Temperature. Appl. Eng. Agric. 1985, 1, 96–99. [Google Scholar] [CrossRef]
  71. Stagge, J.H.; Tallaksen, L.M.; Gudmundsson, L.; Van Loon, A.F.; Stahl, K. Candidate distributions for climatological drought indices (SPI and SPEI). Int. J. Climatol. 2015, 35, 4027–4040. [Google Scholar] [CrossRef]
  72. Wang, Q.; Zeng, J.; Qi, J.; Zhang, X.; Zeng, Y.; Shui, W.; Xu, Z.; Zhang, R.; Wu, X.; Cong, J. A multi-scale daily SPEI dataset for drought characterization at observation stations over mainland China from 1961 to 2018. Earth Syst. Sci. Data 2021, 13, 331–341. [Google Scholar] [CrossRef]
  73. Danandeh Mehr, A.; Sorman, A.U.; Kahya, E.; Hesami Afshar, M. Climate change impacts on meteorological drought using SPI and SPEI: Case study of Ankara, Turkey. Hydrol. Sci. J. 2020, 65, 254–268. [Google Scholar] [CrossRef]
  74. Danandeh Mehr, A.; Vaheddoost, B. Identification of the trends associated with the SPI and SPEI indices across Ankara, Turkey. Theor. Appl. Climatol. 2020, 139, 1531–1542. [Google Scholar] [CrossRef]
  75. Yu, X.; Zhang, L.; Zhou, T.; Zhang, X. Long-term changes in the effect of drought stress on ecosystems across global drylands. Sci. China Earth Sci. 2023, 66, 146–160. [Google Scholar] [CrossRef]
  76. Ma, B.; Zhang, B.; Jia, L.; Huang, H. Conditional distribution selection for SPEI-daily and its revealed meteorological drought characteristics in China from 1961 to 2017. Atmos. Res. 2020, 246, 105108. [Google Scholar] [CrossRef]
  77. Liang, Y.; Wang, Y.; Yan, X.; Liu, W.; Jin, S.; Han, M. Projection of drought hazards in China during twenty-first century. Theor. Appl. Climatol. 2018, 133, 331–341. [Google Scholar] [CrossRef]
  78. van der Wiel, K.; Batelaan, T.J.; Wanders, N. Large increases of multi-year droughts in north-western Europe in a warmer climate. Clim. Dyn. 2023, 60, 1781–1800. [Google Scholar] [CrossRef]
  79. Wang, A.; Wang, Y.; Su, B.; Kundzewicz, Z.W.; Tao, H.; Wen, S.; Qin, J.; Gong, Y.; Jiang, T. Comparison of Changing Population Exposure to Droughts in River Basins of the Tarim and the Indus. Earth’s Future 2020, 8, e2019EF001448. [Google Scholar] [CrossRef]
  80. Rita, A.; Camarero, J.J.; Nolè, A.; Borghetti, M.; Brunetti, M.; Pergola, N.; Serio, C.; Vicente-Serrano, S.M.; Tramutoli, V.; Ripullone, F. The impact of drought spells on forests depends on site conditions: The case of 2017 summer heat wave in southern Europe. Glob. Change Biol. 2020, 26, 851–863. [Google Scholar] [CrossRef]
  81. Yoon, D.; Cha, D.H.; Lee, G.; Park, C.; Lee, M.I.; Min, K.H. Impacts of synoptic and local factors on heat wave events over southeastern region of Korea in 2015. J. Geophys. Res. Atmos. 2018, 123, 12081–12096. [Google Scholar] [CrossRef]
  82. Lloyd-Hughes, B. A spatio-temporal structure-based approach to drought characterisation. Int. J. Climatol. 2012, 32, 406–418. [Google Scholar] [CrossRef]
  83. Alamgir, M.; Khan, N.; Shahid, S.; Yaseen, Z.M.; Dewan, A.; Hassan, Q.; Rasheed, B. Evaluating severity–area–frequency (SAF) of seasonal droughts in Bangladesh under climate change scenarios. Stoch. Environ. Res. Risk Assess. 2020, 34, 447–464. [Google Scholar] [CrossRef]
  84. Pachauri, R.K.; Allen, M.R.; Barros, V.R.; Broome, J.; Cramer, W.; Christ, R.; Church, J.A.; Clarke, L.; Dahe, Q.; Dasgupta, P. Climate Change 2014: Synthesis Report. Contribution of Working Groups I, II and III to the Fifth Assessment Report of the Intergovernmental Panel on Climate Change; IPCC: Geneva, Switzerland, 2014. [Google Scholar]
  85. Schwalm, C.R.; Anderegg, W.R.L.; Michalak, A.M.; Fisher, J.B.; Biondi, F.; Koch, G.; Litvak, M.; Ogle, K.; Shaw, J.D.; Wolf, A.; et al. Global patterns of drought recovery. Nature 2017, 548, 202–205. [Google Scholar] [CrossRef] [PubMed]
  86. Spinoni, J.; Naumann, G.; Carrao, H.; Barbosa, P.; Vogt, J. World drought frequency, duration, and severity for 1951–2010. Int. J. Climatol. 2014, 34, 2792–2804. [Google Scholar] [CrossRef]
  87. Haile, G.G.; Tang, Q.; Hosseini-Moghari, S.-M.; Liu, X.; Gebremicael, T.G.; Leng, G.; Kebede, A.; Xu, X.; Yun, X. Projected Impacts of Climate Change on Drought Patterns Over East Africa. Earth’s Future 2020, 8, e2020EF001502. [Google Scholar] [CrossRef]
  88. Spinoni, J.; Vogt, J.V.; Naumann, G.; Barbosa, P.; Dosio, A. Will drought events become more frequent and severe in Europe? Int. J. Climatol. 2018, 38, 1718–1736. [Google Scholar] [CrossRef]
  89. Bouabdelli, S.; Zeroual, A.; Meddi, M.; Assani, A. Impact of temperature on agricultural drought occurrence under the effects of climate change. Theor. Appl. Climatol. 2022, 148, 191–209. [Google Scholar] [CrossRef]
  90. Jenkins, K.; Warren, R. Quantifying the impact of climate change on drought regimes using the Standardised Precipitation Index. Theor. Appl. Climatol. 2015, 120, 41–54. [Google Scholar] [CrossRef]
  91. Agutu, N.; Awange, J.; Ndehedehe, C.; Mwaniki, M. Consistency of agricultural drought characterization over Upper Greater Horn of Africa (1982–2013): Topographical, gauge density, and model forcing influence. Sci. Total Environ. 2020, 709, 135149. [Google Scholar] [CrossRef]
  92. Yang, X.; Zhang, M.; He, X.; Ren, L.; Pan, M.; Yu, X.; Wei, Z.; Sheffield, J. Contrasting Influences of Human Activities on Hydrological Drought Regimes Over China Based on High-Resolution Simulations. Water Resour. Res. 2020, 56, e2019WR025843. [Google Scholar] [CrossRef]
  93. Li, H.; Liu, F.; Zhang, S.; Zhang, C.; Zhang, C.; Ma, W.; Luo, J. Drying–Wetting Changes of Surface Soil Moisture and the Influencing Factors in Permafrost Regions of the Qinghai-Tibet Plateau, China. Remote Sens. 2022, 14, 2915. [Google Scholar]
  94. Tran, H.T.; Campbell, J.B.; Tran, T.D.; Tran, H.T. Monitoring drought vulnerability using multispectral indices observed from sequential remote sensing (Case Study: Tuy Phong, Binh Thuan, Vietnam). GISci. Remote Sens. 2017, 54, 167–184. [Google Scholar] [CrossRef]
  95. Ren, L.-L.; Yuan, S.-S.; Yang, X.-L.; Jiang, S.-H.; Li, G.-B.; Zhu, Q.-A.; Fang, X.-Q.; Liu, Y.; Yan, Y.-Q. Initiatives to clarify mechanisms of hydrological evolution in human-influenced Yellow River Basin. Water Sci. Eng. 2023, 16, 117–121. [Google Scholar] [CrossRef]
Figure 1. Location map of the study area with seven subregions. Black dots represent national intensive meteorological observation sites, which were used to generate CN05.1 dataset.
Land 12 01820 g001
Figure 2. The flowchart of IAD algorithm. It should be noted that the flowchart is divided into three modules for graphical aesthetics and space saving. The flowchart itself follows the steps from START to END.
Land 12 01820 g002
Figure 3. The (a) multi-year mean spatial distribution and (b) trend changes of annual mean temperature in China from 1961–2020.
Land 12 01820 g003
Figure 4. The multi-year mean spatial distribution and trend changes of the maximum and minimum temperature in China from 1961–2020. (a) Spatial distribution and (b) trend changes of the maximum temperature, and (c) spatial distribution and (d) trend changes of the minimum temperature. Pixels marked with “+” denote that the corresponding change rates are statistically significant at the level of 0.05.
Land 12 01820 g004
Figure 5. The (a) multi-year mean spatial distribution and (b) trend changes of annual total precipitation in China from 1961–2020. Pixels marked with “+” denote that the corresponding change rates are statistically significant at the level of 0.05.
Land 12 01820 g005
Figure 6. The (a) spatial distribution of total frequency and (b) trend changes of annual total frequency of drought events in China from 1961–2020. Pixels marked with “+” denote that the corresponding change rates are statistically significant at the level of 0.05.
Land 12 01820 g006
Figure 7. The (a) spatial distribution of mean intensity and (b) trend changes of annual mean intensity of drought events in China from 1961–2020. Pixels marked with “+” denote that the corresponding change rates are statistically significant at the level of 0.05.
Land 12 01820 g007
Figure 8. The (a) spatial distribution of mean duration and (b) trend changes of annual mean duration of drought events in China from 1961–2020. Pixels marked with “+” denote that the corresponding change rates are statistically significant at the level of 0.05.
Land 12 01820 g008
Figure 9. Variations in the cumulative impact area (CIA) of drought events in China between 1961 and 2020. The orange dashed line represents the mean CIA for drought events during this period, while data points within the gray-shaded region indicate values below the average. The pink-shaded area represents a 95% confidence interval for the fitted line of all CIAs. The line in red represents the linear fitting of CIA series of drought events depicted by the blue line.
Land 12 01820 g009
Figure 10. Temporal-scale variations in the cumulative impact area (CIA) of drought events across the seven subregions during the period 1961–2020. The line in orange stands for the linear fitting of the CIA series of drought events depicted by the blue line.
Land 12 01820 g010
Figure 11. Sensitivity testing involving area thresholds and their impact on the count of drought events. It is important to emphasize that the count of drought events encompasses all occurrences during the study period before determining their inclusion in the same event.
Land 12 01820 g011
Table 1. Change rate of annual total precipitation and associated significance in China and seven subregions.
Name of RegionAcronymChange Rate (mm/decade)
ChinaChina5.9 *
XinjiangXJ6.6 *
Qinghai–Tibetan PlateauQTP8.9 *
NorthwestNW2.8
NortheastNE7.4
North ChinaNC−4.4
SouthwestSW−8.8
South ChinaSC16.8 *
* represents significance at the level of 0.05.
Disclaimer/Publisher’s Note: The statements, opinions and data contained in all publications are solely those of the individual author(s) and contributor(s) and not of MDPI and/or the editor(s). MDPI and/or the editor(s) disclaim responsibility for any injury to people or property resulting from any ideas, methods, instructions or products referred to in the content.

