Article

Spatial Impact of Government Venture Capital on Urbanization and Its Path—Evidence from the Yangtze River Delta Urban Agglomeration in China

1
Business School, Sichuan University, Chengdu 610064, China
2
Sichuan Key Laboratory for Science &Technology Finance and Mathematical Finance, Sichuan University, Chengdu 610064, China
3
Institute of Development and Competitiveness of Listed Companies, Sichuan University, Chengdu 610064, China
4
Department of Economics, University of Warwick, Coventry CV4 7AL, UK
*
Author to whom correspondence should be addressed.
Land 2023, 12(1), 53; https://doi.org/10.3390/land12010053
Submission received: 2 December 2022 / Revised: 16 December 2022 / Accepted: 21 December 2022 / Published: 24 December 2022
(This article belongs to the Special Issue Urbanization and City Development in China's Transition)

Abstract

:
Despite being the world’s largest developing country and experiencing rapid economic growth, China’s urbanization process lags behind the global standard. The comprehensive promotion of urbanization development is a critical issue for the Chinese government, with government venture capital playing a significant role in promoting regional economic development. Using urbanization dimension levels extracted through factor analysis, this study analyzes the impact of government venture capital on the urbanization development of the Yangtze River Delta region of China and explores its path to determine its spatial spillover effect on surrounding areas. The results show that government venture capital funds can significantly promote urbanization development in this region, primarily by influencing the residents’ standard of living and urban construction levels. In addition, the spatial spillover effect of urbanization can be realized through the promotion of the urban construction level and the ecological health level of surrounding areas. While previous literature has examined government venture capital from multiple perspectives and dimensions, few scholars have investigated the impact of government venture capital on the critical issue of urbanization development. This study fills that research gap and serves as a reference for the Chinese government to promote high−quality urbanization development.

1. Introduction

In response to the wave of global urbanization, increasing attention has recently been given to issues associated with urbanization development. As the most populous country in the world, China’s urbanization model has significant research value. On the one hand, China’s urbanization process has lagged behind other economies at the same level of development [1]. In 2021, the China Development Planning and Reform Commission issued the National New Urbanization Plan 2021–2035, emphasizing that, “by 2025, the urbanization rate of the permanent resident population will increase steadily, the urbanization rate of the household registration population will be significantly increased, and the gap between the urbanization rate of the household registration population and the urbanization rate of the resident population will be significantly narrowed” [2]. The urbanization lag has long been a critical challenge for the Chinese government. On the other hand, China’s urbanization rate has increased by 14.21% in the past decade, a relatively fast growth rate; the rapid increase in land use and land cover have led to more environmental pollution, ecosystem degradation, and biodiversity loss [3,4]. Rapid urbanization increases the likelihood of urban heat island formation, which endangers the physical and mental health of residents [5]. In addition, due to the rapid urbanization development in China, some provinces have experienced “urbanization without growth,” which is similar to excessive urbanization in many developing countries [6]. In addition, China’s urbanization has produced clear regional differences, with the urbanization level in the eastern region significantly higher than that in the central and western regions. China’s urbanization development is unstable, unbalanced, and incomplete. Promoting high−quality urbanization both scientifically and comprehensively, on the basis of the sustainable development theory, is an important issue faced by the Chinese government.
In terms of economic growth, as the world’s second−largest economy, the Chinese government also attaches significant importance to government venture capital. In 2005, the State Development and Reform Commission, the Ministry of Science and Technology, the Ministry of Finance, as well as other ministries and commissions, issued interim measures for the “Management of Venture Capital Enterprises,” which states that, “the state and local governments can set up government venture capital to support the establishment and development of venture capital enterprises through equity participation and financing guarantees.” In 2008, the General Office of the State Council issued the “Guidance on the Establishment and Operation of Government Venture Capital,” formulated by the Development and Reform Commission and other departments and made provisions on the establishment and operation of government venture capital.
Through an empirical study of Chinese provinces, Tao Hong and other scholars found that urbanization, as promoted by the Chinese local government, is not suitable for the local social, cultural, and economic environment and has produced a quasi−“urbanization without growth” [6]. Government venture capital, as a measure of the economic development stage, plays a significant role in promoting regional economic development and enterprise innovation. Therefore, this study explores government venture capital to determine an effective government intervention policy in promoting high−quality urbanization development.
As a policy tool, government venture capital is an intervention on the supply side of capital to prevent market failure [7]. The Chinese government venture capital may be used to invest in industries with strong externalities, such as public goods, and thus aid in urbanization development [8]. Therefore, we propose the first hypothesis.
Hypothesis 1 (H1).
The size of government venture capital can promote the level of urbanization development.
In addition, the impact of spatial factors on economic activity and urban development cannot be ignored. China’s urbanization has typical spatial group characteristics. Urban agglomeration construction in China can be traced back to one of the key regional proposals regarding comprehensive land development, as outlined in the National Land Planning submitted by the State Planning Commission to the State Council in 1990 [9]. Since the turn of the 21st century, urban agglomeration has gradually become a new regional opportunity for China to participate in global competition and the international division of labor as well as a spatial subject to promote the new urbanization of the country [10]. In the latest National New Urbanization Plan (2021–2035), the Chinese government further clarified the policy of a “coordinated and balanced development between mega polis and small cities.” Accordingly, the study of China’s urbanization development cannot be separated from the relationship between cities, and adjacent cities can promote regional development through this type of policy cooperation. Similarly, government venture capital initially aimed to pry and absorb the idle capital of society; however, with the establishment of surrounding city government venture capital, it will compete for the entire region‘s social capital, thus, creating a crowding−out effect on the local city’s government venture capital [11]. On the basis of this, we propose the additional hypotheses:
Hypothesis 2a (H2a).
The scale of government venture capital in surrounding cities positively affects a city’s urbanization development.
Hypothesis 2b (H2b).
The promotion of the government venture capital scale of surrounding cities has a negative crowding−out effect on a city’s urbanization development.
Among the major urban agglomerations in China, the Yangtze River Delta urban agglomeration plays a strategic role in the overall situation and opening pattern of China‘s national modernization drive. The Yangtze River Delta is an important engine of China‘s economic and social development and has been one of the most urbanized areas in China in recent years. In order to intensely study the role of government venture capital as an important part of China‘s economic system in the process of urbanization, this study introduces the relevant data of the Yangtze River Delta region government venture capital and cities. Shanghai, as a highly developed city, has little demand for the “guidance” function of government venture capital [12]. Therefore, to avoid the endogenous impact, this study intentionally removed Shanghai data when examining prefecture−level cities in the Yangtze River Delta and used the data of 40 prefecture−level cities in Jiangsu, Zhejiang, and Anhui provinces from 2015 to 2020 as the sample. Next, using the spatial measurement method, this study empirically analyzed the impact of government venture capital on the level of urbanization development and the impact of surrounding cities using the government venture capital model in this city.
The remainder of this paper is organized as follows. Section 2 introduces the related literature. Section 3 introduces the data sources, variable definitions, and various research methods used, including factor analysis, spatial econometric model, and Moran’s test. 
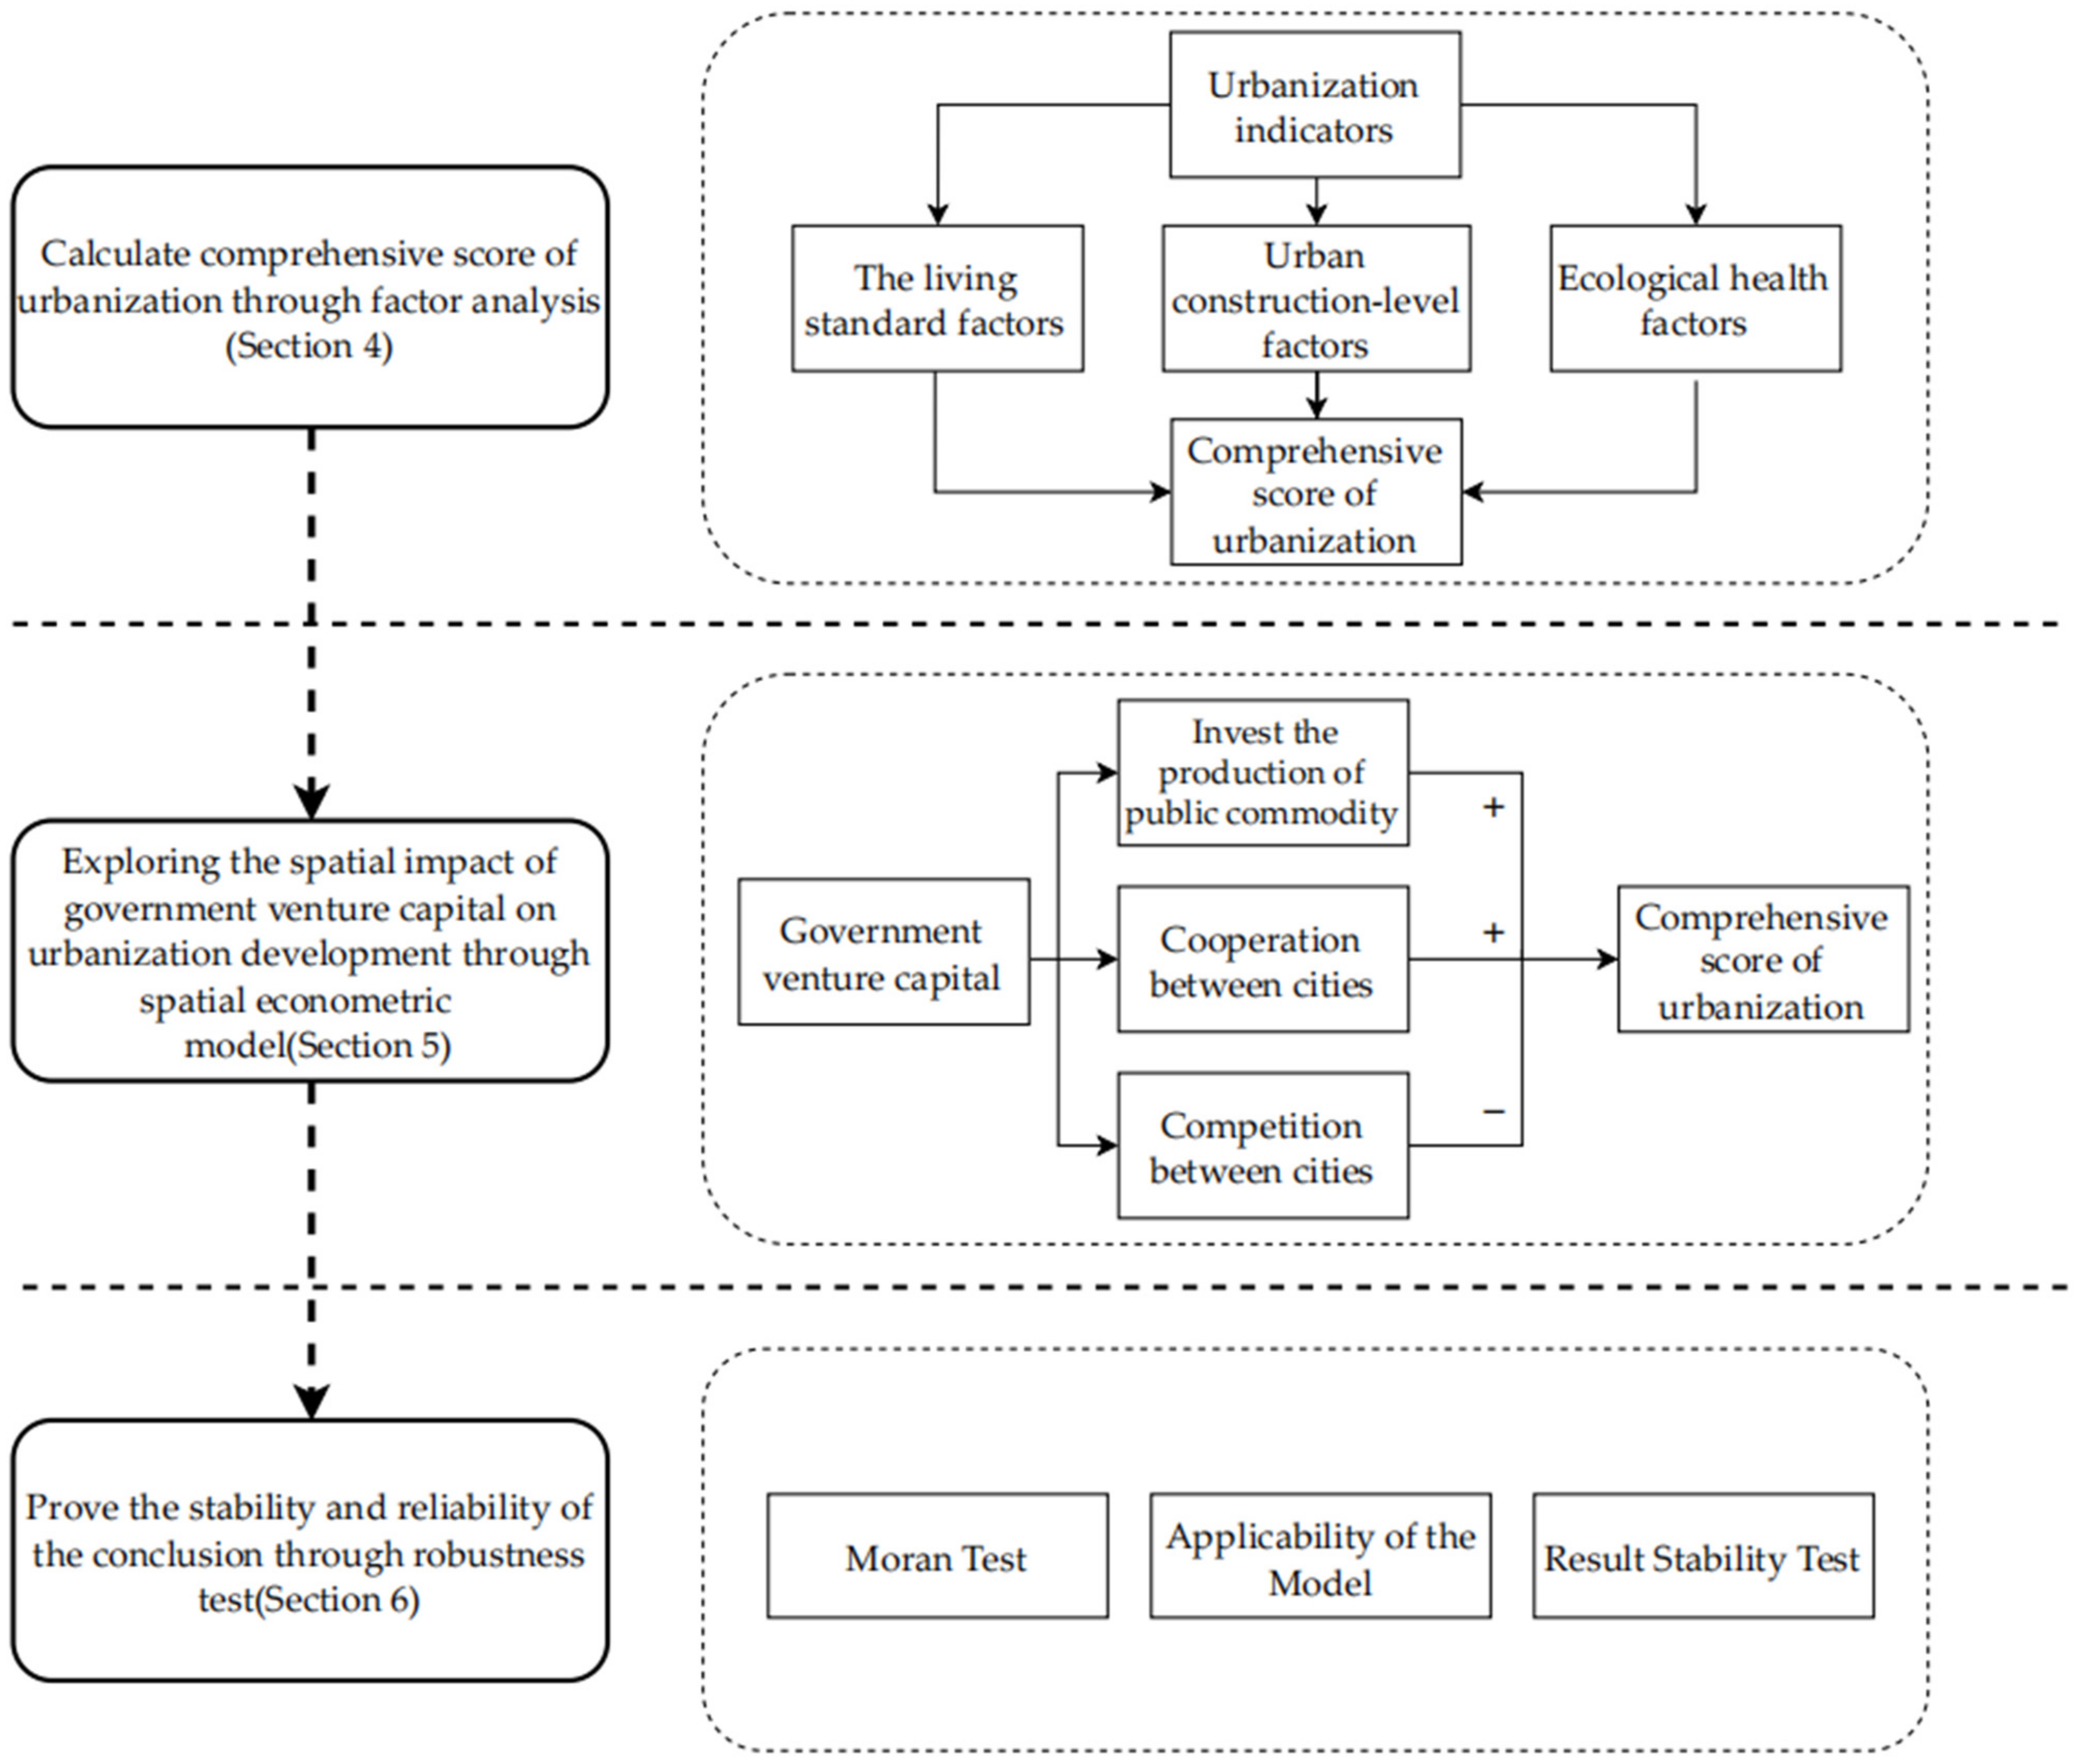
Section 4 reveals that the specific load of each factor is obtained through factor analysis, and the spatial−temporal evolution law of the urbanization level of cities in the Yangtze River Delta is presented through images. Section 5 designs an empirical model for empirical testing. Section 6 presents a series of robustness tests. Finally, Section 7 and Section 8 concludes the paper and provides policy recommendations, such as expanding the scale of government venture capital for underdeveloped cities.

2. Literature Review

Urbanization has been extensively studied in academic circles. Schwirian and Prehn stated that urbanization can be regarded in three ways: (1) as the process of radiation from the concept and practice of urban centers to the surrounding areas of the city; (2) changes in behavior and survival mode; and (3) the process of increasing the proportion of the urban population [13]. As the urbanization level continues to rise, so too do theories surrounding urbanization, including Albert Otto Hirschman’s “unbalanced growth theory” [14], Walt Whitman Rostow’s “theory of economic growth stage” [15], Milton Friedman’s “Core−Edge Model” [16], and Ray M. Northam‘s “S−shaped Curve of urbanization process,” all of which have great influence [17].
With the deepening of research, the impact of economic activities on urbanization development has gradually entered the field of scholars’ vision. Chenery first discovered a link between the urbanization process and the level of economic development using empirical research [18]. Lin et al. used the Granger causality test to determine that venture capital can stimulate economic growth [19]. Government intervention research on venture capital is an indispensable component of the entrepreneurship and regional innovation systems fields [20]. Early on, academic research on government intervention was conducted. Consequently, from the 1950s to the present, the research paradigm has matured, and the research framework has gradually taken shape. With the improvement of government intervention policy tools, particularly the establishment of government venture capital, which has become the predominant method of practical intervention, the focus of academic research has shifted from the early theoretical analysis of how venture capital is addressing market failure, to the quantitative demonstration of the impact of government venture capital operations.
After gradually clarifying the concept and motivation of government venture capital, current research efforts on government venture capital focus primarily on its operating mechanism and impact effects. In terms of operational mechanism, Cumming and MacIntosh believe that government venture capital with pure official background is contracted by policymakers, and the “slap the head” decisions without professional skills will lead to inefficient operation of the fund [21,22]. Wilson and Silva found that the Istanbul Venture Capital Initiative, the United Kingdom Future Technologies Fund, and the Belgian ARKimedes Fund all support the venture capital market [23]. In addition, Fang Su and other Chinese scholars have studied and analyzed the operation mode of government venture capital in the United States, Israel, Italy, Australia, and other countries, and have explored the theoretical assistance of their experience in promoting government venture capital in China [24,25,26,27,28,29,30,31,32].
Research on the impact of government venture capital primarily focuses on the impact on the investment market. Gompers et al. believe that government venture capital can promote private capital to enter the venture capital market, especially in seed enterprises with less private capital investment, which partially compensates for market failure [33]. Seunghwan Oh confirmed the significance of the monitoring effect in enhancing various performance variables, such as corporate growth, job creation, and innovation capacity. In particular, the size of this effect was maximized in mid−stage companies and high−tech industries [34]. Leleux and Brander found that government venture capital can promote the joint force of public and private capital to maintain long−term economic growth [35,36]. Yan Alperovych found that the choices of location, colocation, syndication, and industry focus of a GVC program substantially influenced the extent to which it is able to achieve such goals. Important policy implications were discussed [37]. Yang Minli et al. explored whether government venture capital can introduce social funds into the venture capital market [38]. Shi Guoping et al. used the difference−in−difference model to determine whether government venture capital can act on early and high−tech enterprises [39]. Additionally, some scholars have studied the impact of government venture capital at the micro level. Yan and Bertoni empirically explored the impact of government venture capital on innovation output [40,41]. Meanwhile, Dong Jianwei et al. used the negative binomial distribution model to test the influence of government venture capital on enterprise innovation [42].
The aforementioned literature and policies have examined government venture capital from multiple perspectives and dimensions. However, most of these studies are based on macro−level policy theory analysis or demonstrate the effectiveness of a specific industry and city government venture capital on entrepreneurial innovation. Few scholars are currently investigating the impact of government venture capital on the critical issue of urbanization development. Therefore, the research of this paper can fill up this academic gap to some extent.

3. Materials and Methods

3.1. Data Source

The panel datasets of 40 prefecture−level cities in the Yangtze River Delta region from 2015 to 2020 were selected as samples for the empirical analysis. The data used for evaluating government venture capital for the years 2016 to 2020 were obtained from the Qingke Private Fundraising Database (PEDATA). The data used for the indicators of urbanization were derived from the China Statistical Yearbook, China Urban Construction Statistical Yearbook, and the local statistical yearbook.

3.2. Variables

3.2.1. Explained Variable

The urbanization level was selected as the explained variable. The urbanization level can be measured in two ways. The first is directly represented by the urbanization rate: the higher the percentage, the deeper the degree of urbanization. For example, Ponce de Leon Barido defined the urbanization level using the population rate in urban areas [43]. However, this method is limited in that it can only measure the urbanization level from the population dimension, which does not fully reflect the connotation of urbanization. The second method is to construct a comprehensive measurement index system of urbanization, which is widely used in economics and management fields. Ren et al. constructed an urbanization composite index from four aspects: population, economy, land, and society [44]. Bai et al. proposed an evaluation index system of the comprehensive urbanization level from four facets: population, economy, space, and society, and used principal component analysis to estimate 17 comprehensive indices [45]. In addition, a small number of scholars have used other methods to measure the urbanization level, such as Generaal, who measured the urbanization level by the average number of addresses per square kilometer [46].
With urbanization, the economic activities and lifestyle of the population have shifted from rural to urban, and people’s daily quality and standard of living have improved. To measure the level of urbanization development, a comprehensive evaluation index of the urbanization level from four aspects is constructed: urbanization of economic living level, urbanization of social development, urbanization of population, and urbanization of the ecological environment.
  • Urbanization of economic living standards. The standards of regional economic life are an intuitive reflection of the level of urbanization development. The urbanization index of economic and social development includes the total retail sales of social consumer goods (hereafter referred to as goods), the per capita disposable income of urban residents (hereafter referred to as income), and the per capita disposable expenditure of urban residents (hereafter referred to as expenditure). The total amount of social consumer goods can directly reflect the improvement in people’s material living standards over a specific period of time, as well as indirectly reflect the economic development level of the city. The per capita disposable income and expenditure of urban residents reflect the residents’ economic living standards.
  • Urbanization of social development. The social development level includes the construction of public services and the living standards of urban residents. It refers to the improvement of public health, public culture, and municipal public services by the state to improve living standards and quality of life. The indicators of social development urbanization include the per capita living water consumption of cities (hereafter referred to as water), the collection of books in public libraries (hereafter referred to as libraries), the social electricity consumption of different regions (hereafter referred to as electricity), and the number of beds in health institutions (hereafter referred to as health). These indicators comprehensively reflect the living standards of residents and the construction of public services in the urbanization process, as well as the urbanization process.
  • Urbanization of the population. Population urbanization in China is primarily reflected in rural–urban migration, which stimulates the growth of urban output due to population urbanization as a production factor and the effect of scale [47], thus, indirectly reflecting the urbanization process. The index of population urbanization includes the proportion of the urban population (hereafter referred to as population), the proportion of employees in the tertiary sector (hereafter referred to as tertiary), and the number of students in general higher education (hereafter referred to as education). The proportion of the urban population reflects the urbanization rate and is an important index of the urbanization level. The percentage of employees in the tertiary sector and the number of students in general higher education reflect changes in the employment structure of the population and the improvement in population quality.
  • Urbanization of the ecological environment. With the evolution of urbanization, the urban ecological environment has also improved. Future urban development will involve the coordinated development of urbanization and the ecological environment. The urbanization index of the ecological environment includes the sewage treatment rate (hereafter referred to as sewage), per capita park green area (hereafter referred to as green), and green coverage rate of built−up areas (hereafter referred to as greening).
These evaluation indicators can be seen in Table 1.

3.2.2. Explanatory Variable

In this study, the size of government venture capital was chosen as the explanatory variable. Considering the availability of data when selecting the relevant variables of government venture capital, the number and size of government venture capital were primarily taken from enterprises. Following the method of Cheng et al. [11], the logarithm of the government venture capital amount of each prefecture and city was selected as the explanatory variable. According to PEDATA, the number of government venture capitals in various prefectures and cities in the Yangtze River Delta region increased substantially after 2015. Given that it takes time for government venture capital to play a role in society, we assumed the lag period to be one year. Therefore, the logarithm of the government venture capital size of cities in the Yangtze River Delta from 2015 to 2019 was selected as the explanatory variable.

3.2.3. Control Variables

Many factors affect the urbanization level. The core explanatory variables chosen in this study reflect the scale of government venture capital from the perspective of government venture capital aggregation. To minimize the errors caused by missing variables in the regression model, control variables were derived from government intervention, innovation, traffic, and industrial structure, among others, to prevent endophytic problems resulting from the omission of significant explanatory variables. Concurrently, considering different regional scales, absolute value data can easily result in unfair phenomena. After referring to the methods of other scholars, the dimension of explanatory variable data was reduced to relative value data, including the ratio of government fiscal expenditure to local gross domestic product (GDP), the ratio of science and education expenditure to local GDP, the ratio of tertiary sector output value to local GDP, and the per capita road area.
The variable definitions used in this paper are shown in Table 2.

3.3. Method System

This section introduces the methods used in the following research, including factor analysis, spatial econometric model, and Moran test. Figure 1 shows the roadmap of these methods.

3.3.1. Factor Analysis Method

Factor analysis was first proposed by Thurstone, while the concept originated from the “two−factor” theory proposed by C.E. Spearman in 1904. Factor analysis uses dimension reduction to explore the internal dependencies among many variables, and then uses several abstract factors to represent the infrastructure of the entire variable group. Generally, it is a statistical method for extracting common factors from a variable group. Kaiser, Meyer, and Olkin proposed the KMO test [48] to determine whether samples are suitable for factor analysis; this test was used to measure the relative size of the simple correlation coefficient and partial correlation coefficient between the original variables to determine the correlation independence of the sample data, which is a Measure of Sampling Adequacy. In addition, Bartlett’s ball test was used to determine whether the samples were suitable for factor analysis. Given the large number of third−level indicators in this study, factor analysis was used to reduce their dimensions and calculate the comprehensive score of urbanization in Section 4.

3.3.2. Spatial Econometric Model

A spatial econometric model was adopted for this study, as the impact of government venture capital on local urbanization and its spatial spillover effect on surrounding areas were examined. Spatial econometrics has defined and set the mutual spatial relationship, or space–time relationship, of the individual observations individuals differently, brought the non−time−varying spatial relationship of the individual observations in some geographical locations into the econometric analysis, and quantitatively analyzed its role and function in the spatial spillover effect, which can support the spillover effect analysis caused by the change of some characteristic variables of the individual observations. Commonly used spatial econometric models include the spatial lag model (SAR) and the spatial error model (SEM). Later, through practical applications, scholars found that the transmission of spatial effects may also be affected by the spatial lag of dependent variables and the change in error terms caused by random shocks. Therefore, LeSage built a spatial Durbin model that comprehensively considered the above two spatial transmission mechanisms, also known as the spatial interaction model, or the SDM model [49].
However, the applicability of these models is different. SEM addresses the spatial spillover effect caused by the lack of important variables or unobservable random shocks. The SAR model assumes that the explained variables will affect the economy of other regions through spatial interaction [50], whereas the SDM model considers the two types of spatial transmission mechanisms simultaneously. The SDM model also considers spatial interaction, that is, the urbanization level of a region is not only affected by the independent variables of the region but is also affected by the urbanization level and independent variables of the surrounding regions. Accordingly, the widely used SDM model was used to verify the spatial impact of government venture capital on urbanization development in Section 5.

3.3.3. Moran Test

The Moran’s test was divided into the Global Moran’s test (Global Moran’s I) and Local Moran’s index (Local Moran’s I). The Global Moran index tests the spatial autocorrelation degree of the entire sample, and reflects the spatial correlation of the attribute value, and can visualize it [51]. The local spatial autocorrelation test further examines the spatial autocorrelation characteristics of each attribute value. This paper uses Moran test in Section 6 to test whether the samples in this paper are spatially related.

4. Construction of Urbanization Index System

In this study, 13 variables of urbanization were analyzed using factor analysis. First, to test whether the variables could be analyzed by factor analysis, Stata was used to test the urbanization panel data of 41 cities in the Yangtze River Delta from 2016 to 2020. The results are presented in Table 3.
Table 3 shows that the p-value of Bartlett’s spherical hypothesis test result was 0.000, which is significant at the level of 1%. Therefore, the original spherical hypothesis is rejected, indicating that the 13 urbanization−related indicators are not independent. Concurrently, the KMO value was 0.816, greater than 0.6, indicating that the selected samples can be factor analyzed.
Next, a factor analysis was conducted on the 13 variables. The results are presented in 
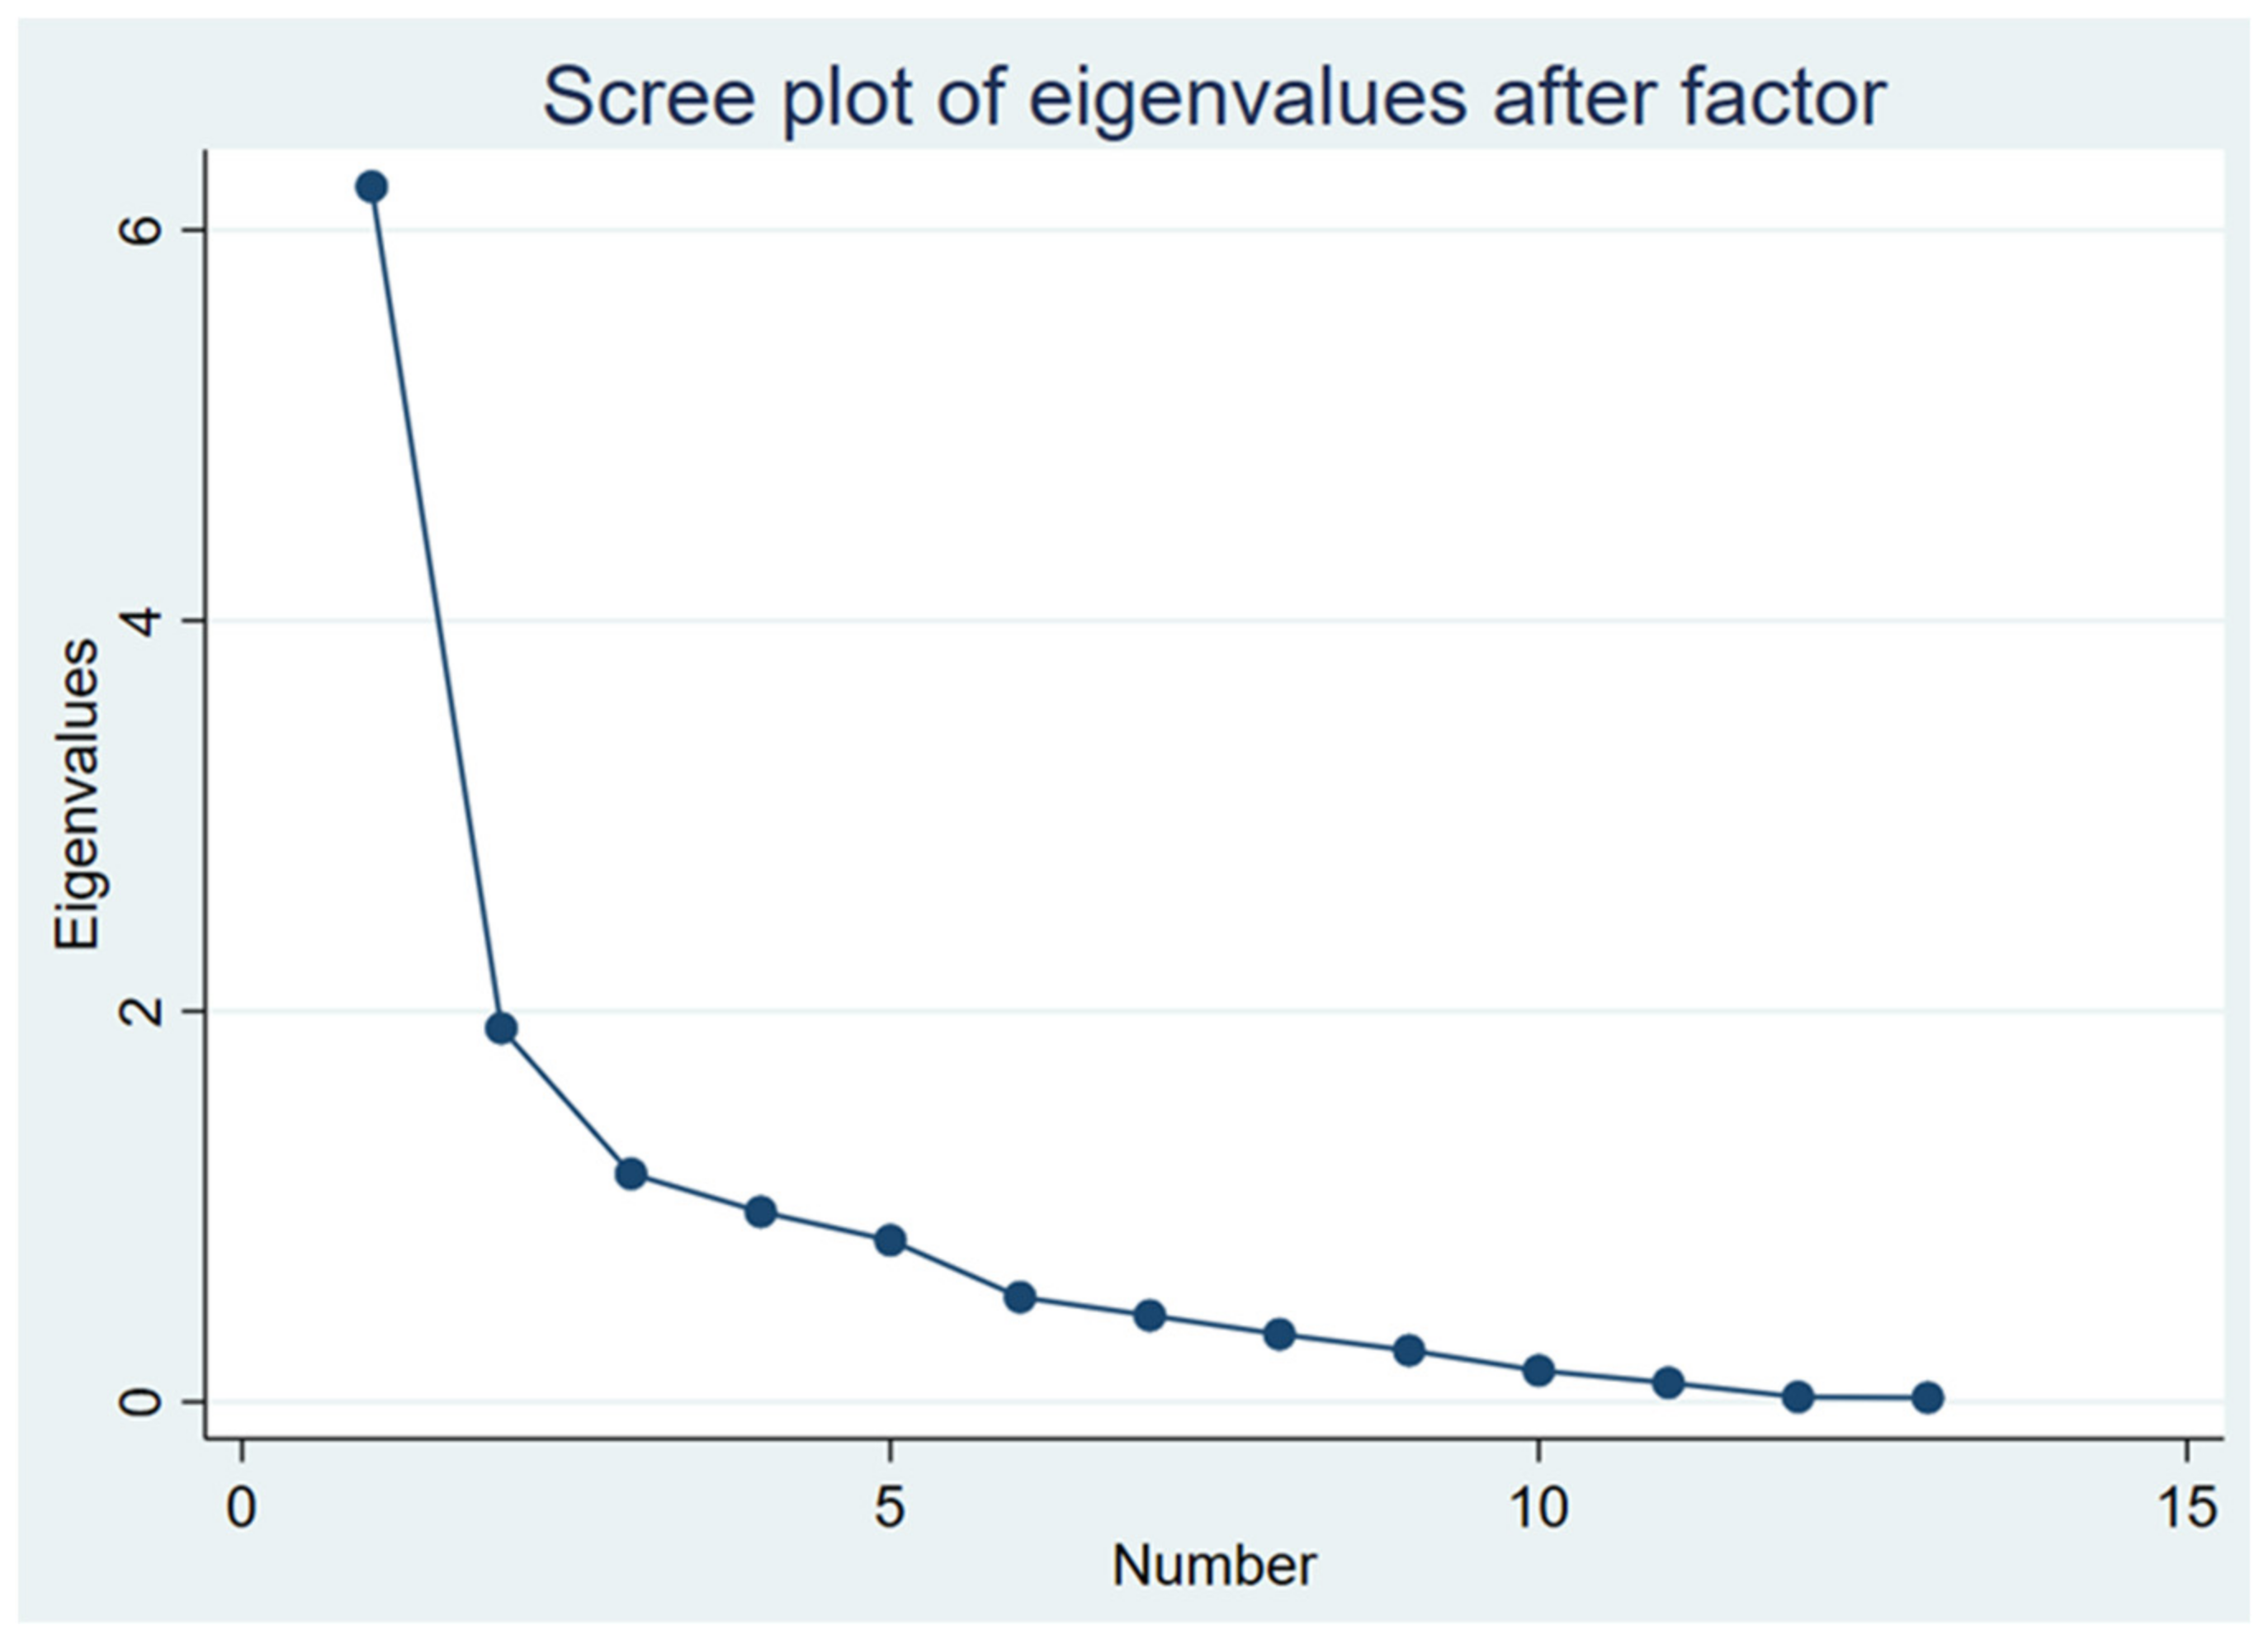
Table 4. The factor analysis method typically extracts explanatory factors with eigenvalues greater than 1. The eigenvalues of Factor1, Factor2, and Factor3 are all greater than 1. Simultaneously, the cumulative contribution rate of these three factors reached 71.58%, which was greater than 70%. Therefore, this study believes that these three factors can appropriately represent the 13 urbanization variables.
A scree plot was generated to test the rationality of the factor selection. Evidently, the characteristic root map of the first three factors is steep; however, after the fourth factor, it becomes more gradual. Therefore, the first three factors were selected (Figure 2).
To understand the specific load of each factor, the factor analysis results were rotated, with the factor load matrix obtained, as shown in Table 5. The main loads of F1 are population, electricity, goods, income, and expenditure, which are referred to as the living standard factors in this study. The main loads of F2 are education, tertiary, water, and libraries, which are referred to as urban construction−level factors in this study. The main load of F3 is sewage, green, health, and greening, which are referred to as ecological health factors in this study.
In this paper, the scores of each factor are calculated by STATA17.0, and the weights of each factor are calculated by rotation results. Finally, the comprehensive score of urbanization level of each observation value is obtained by weighted calculation (Table 6). 
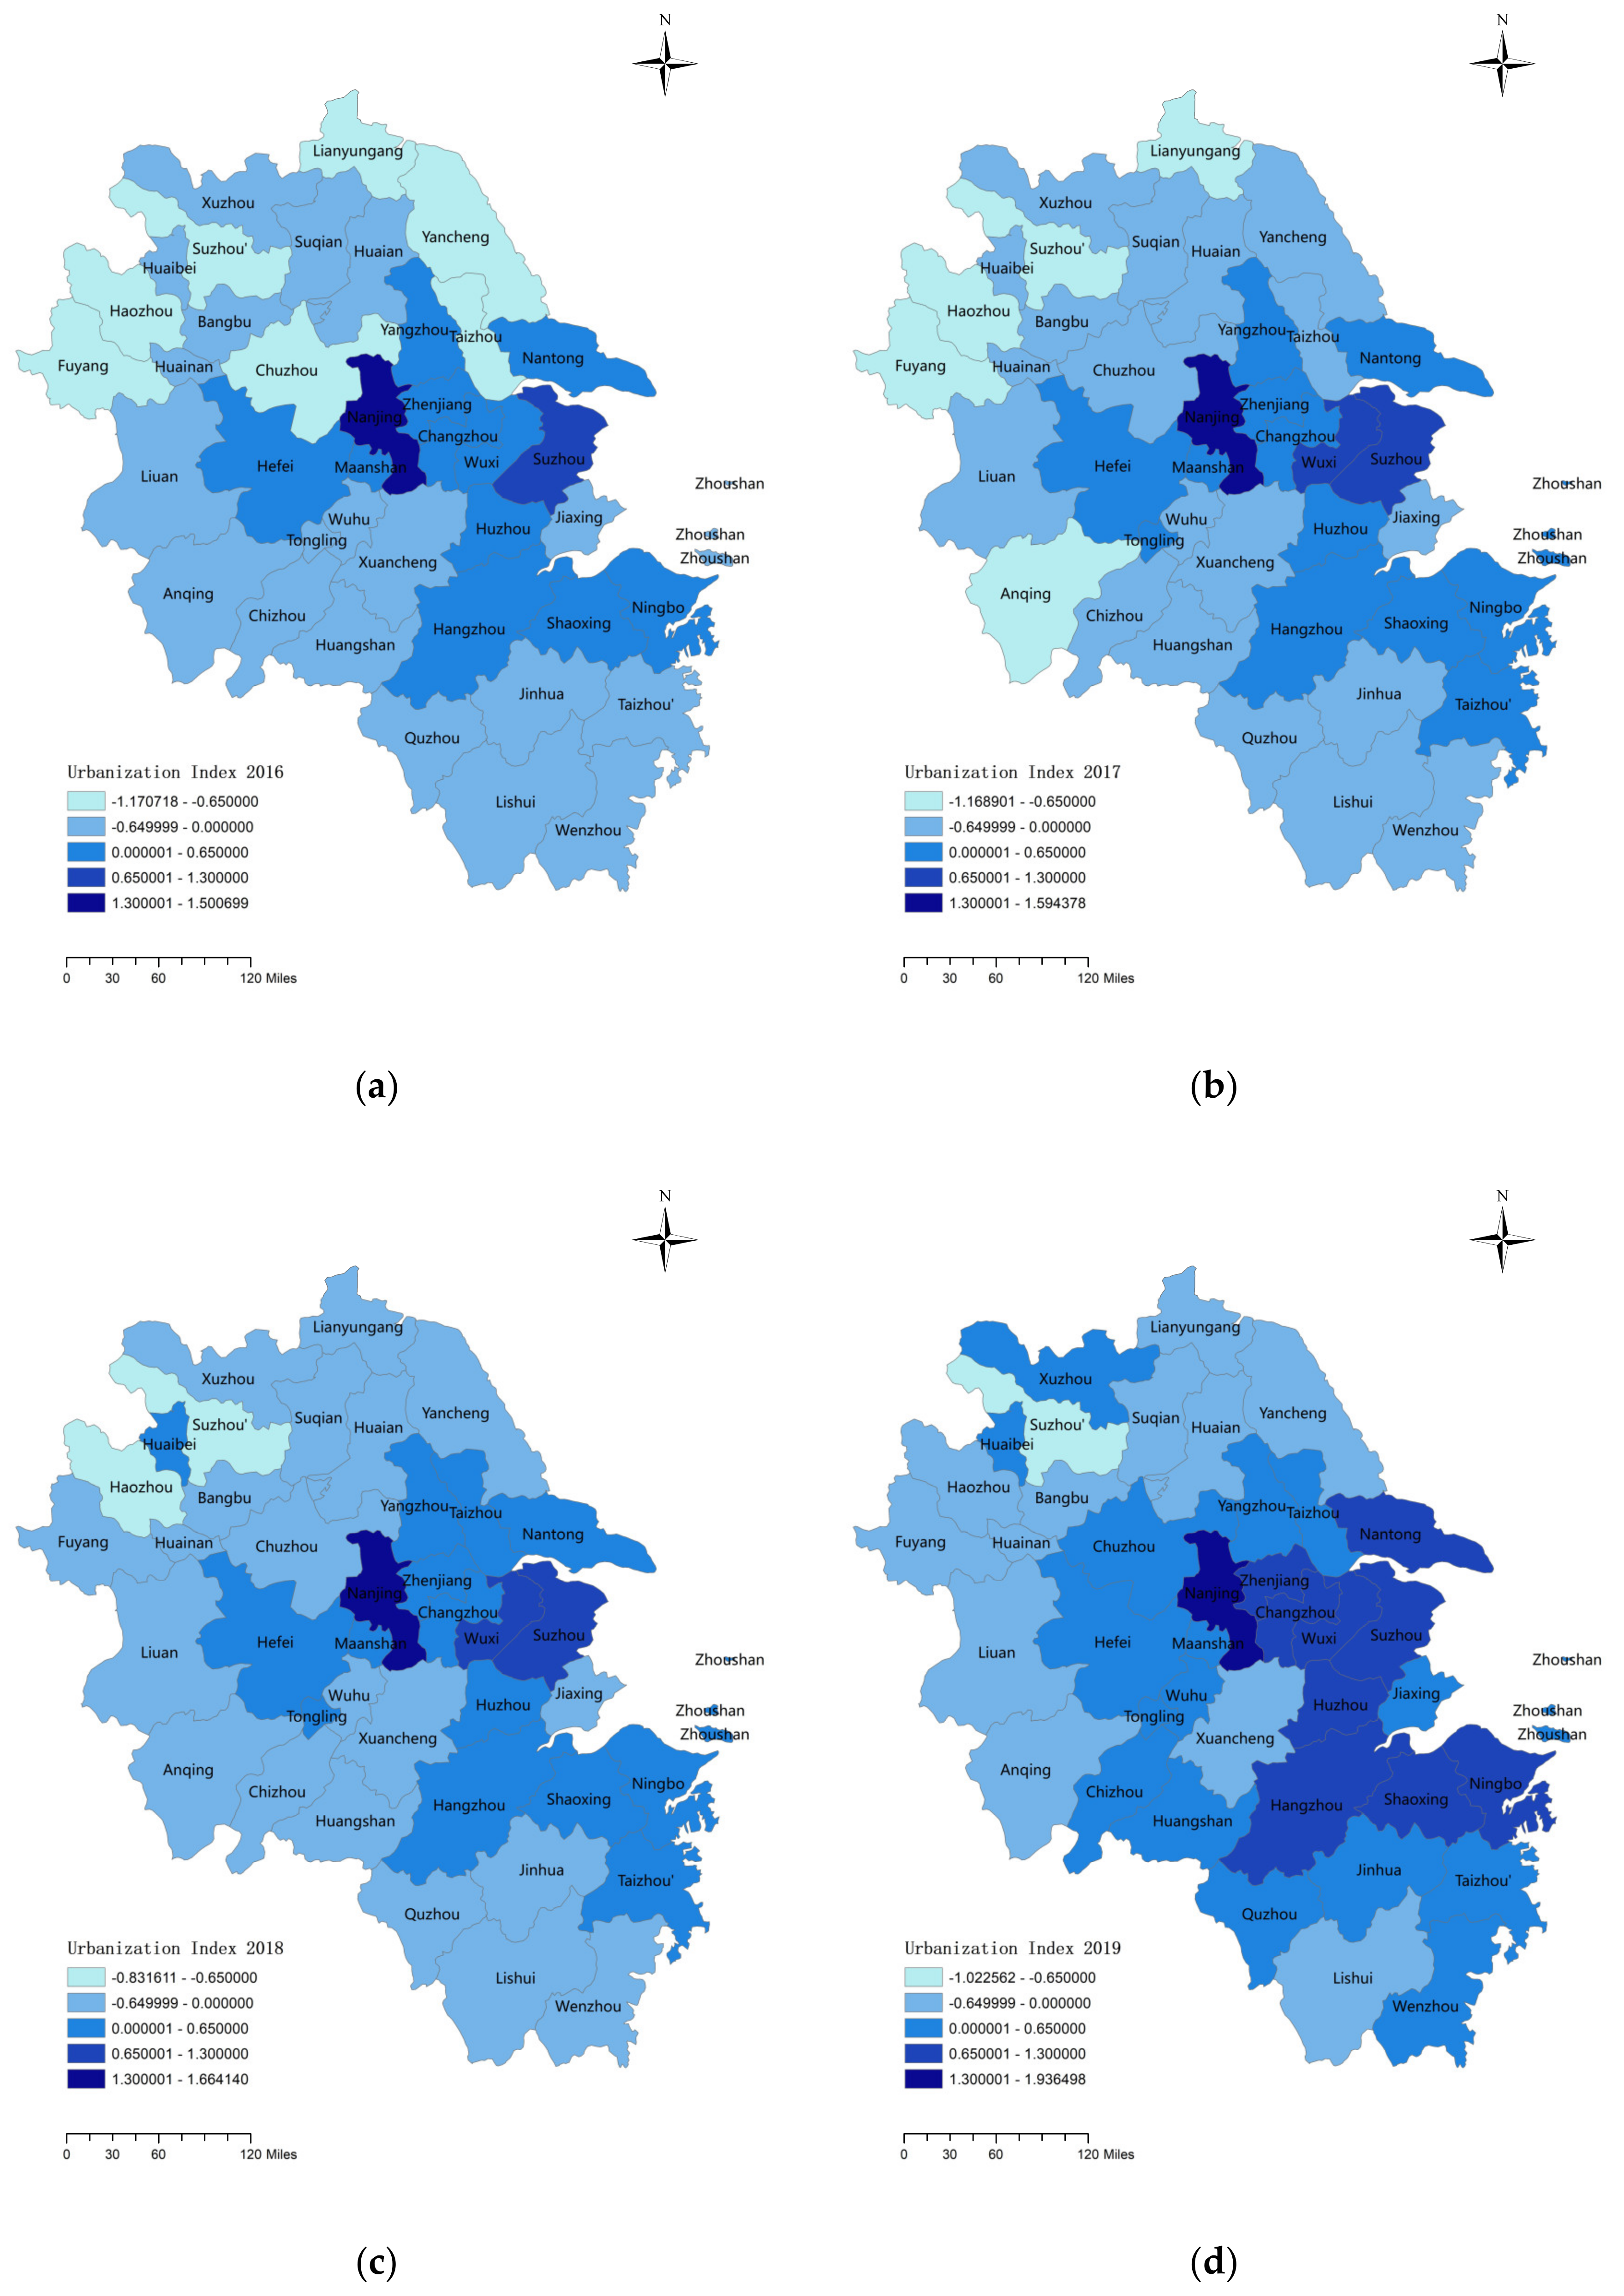
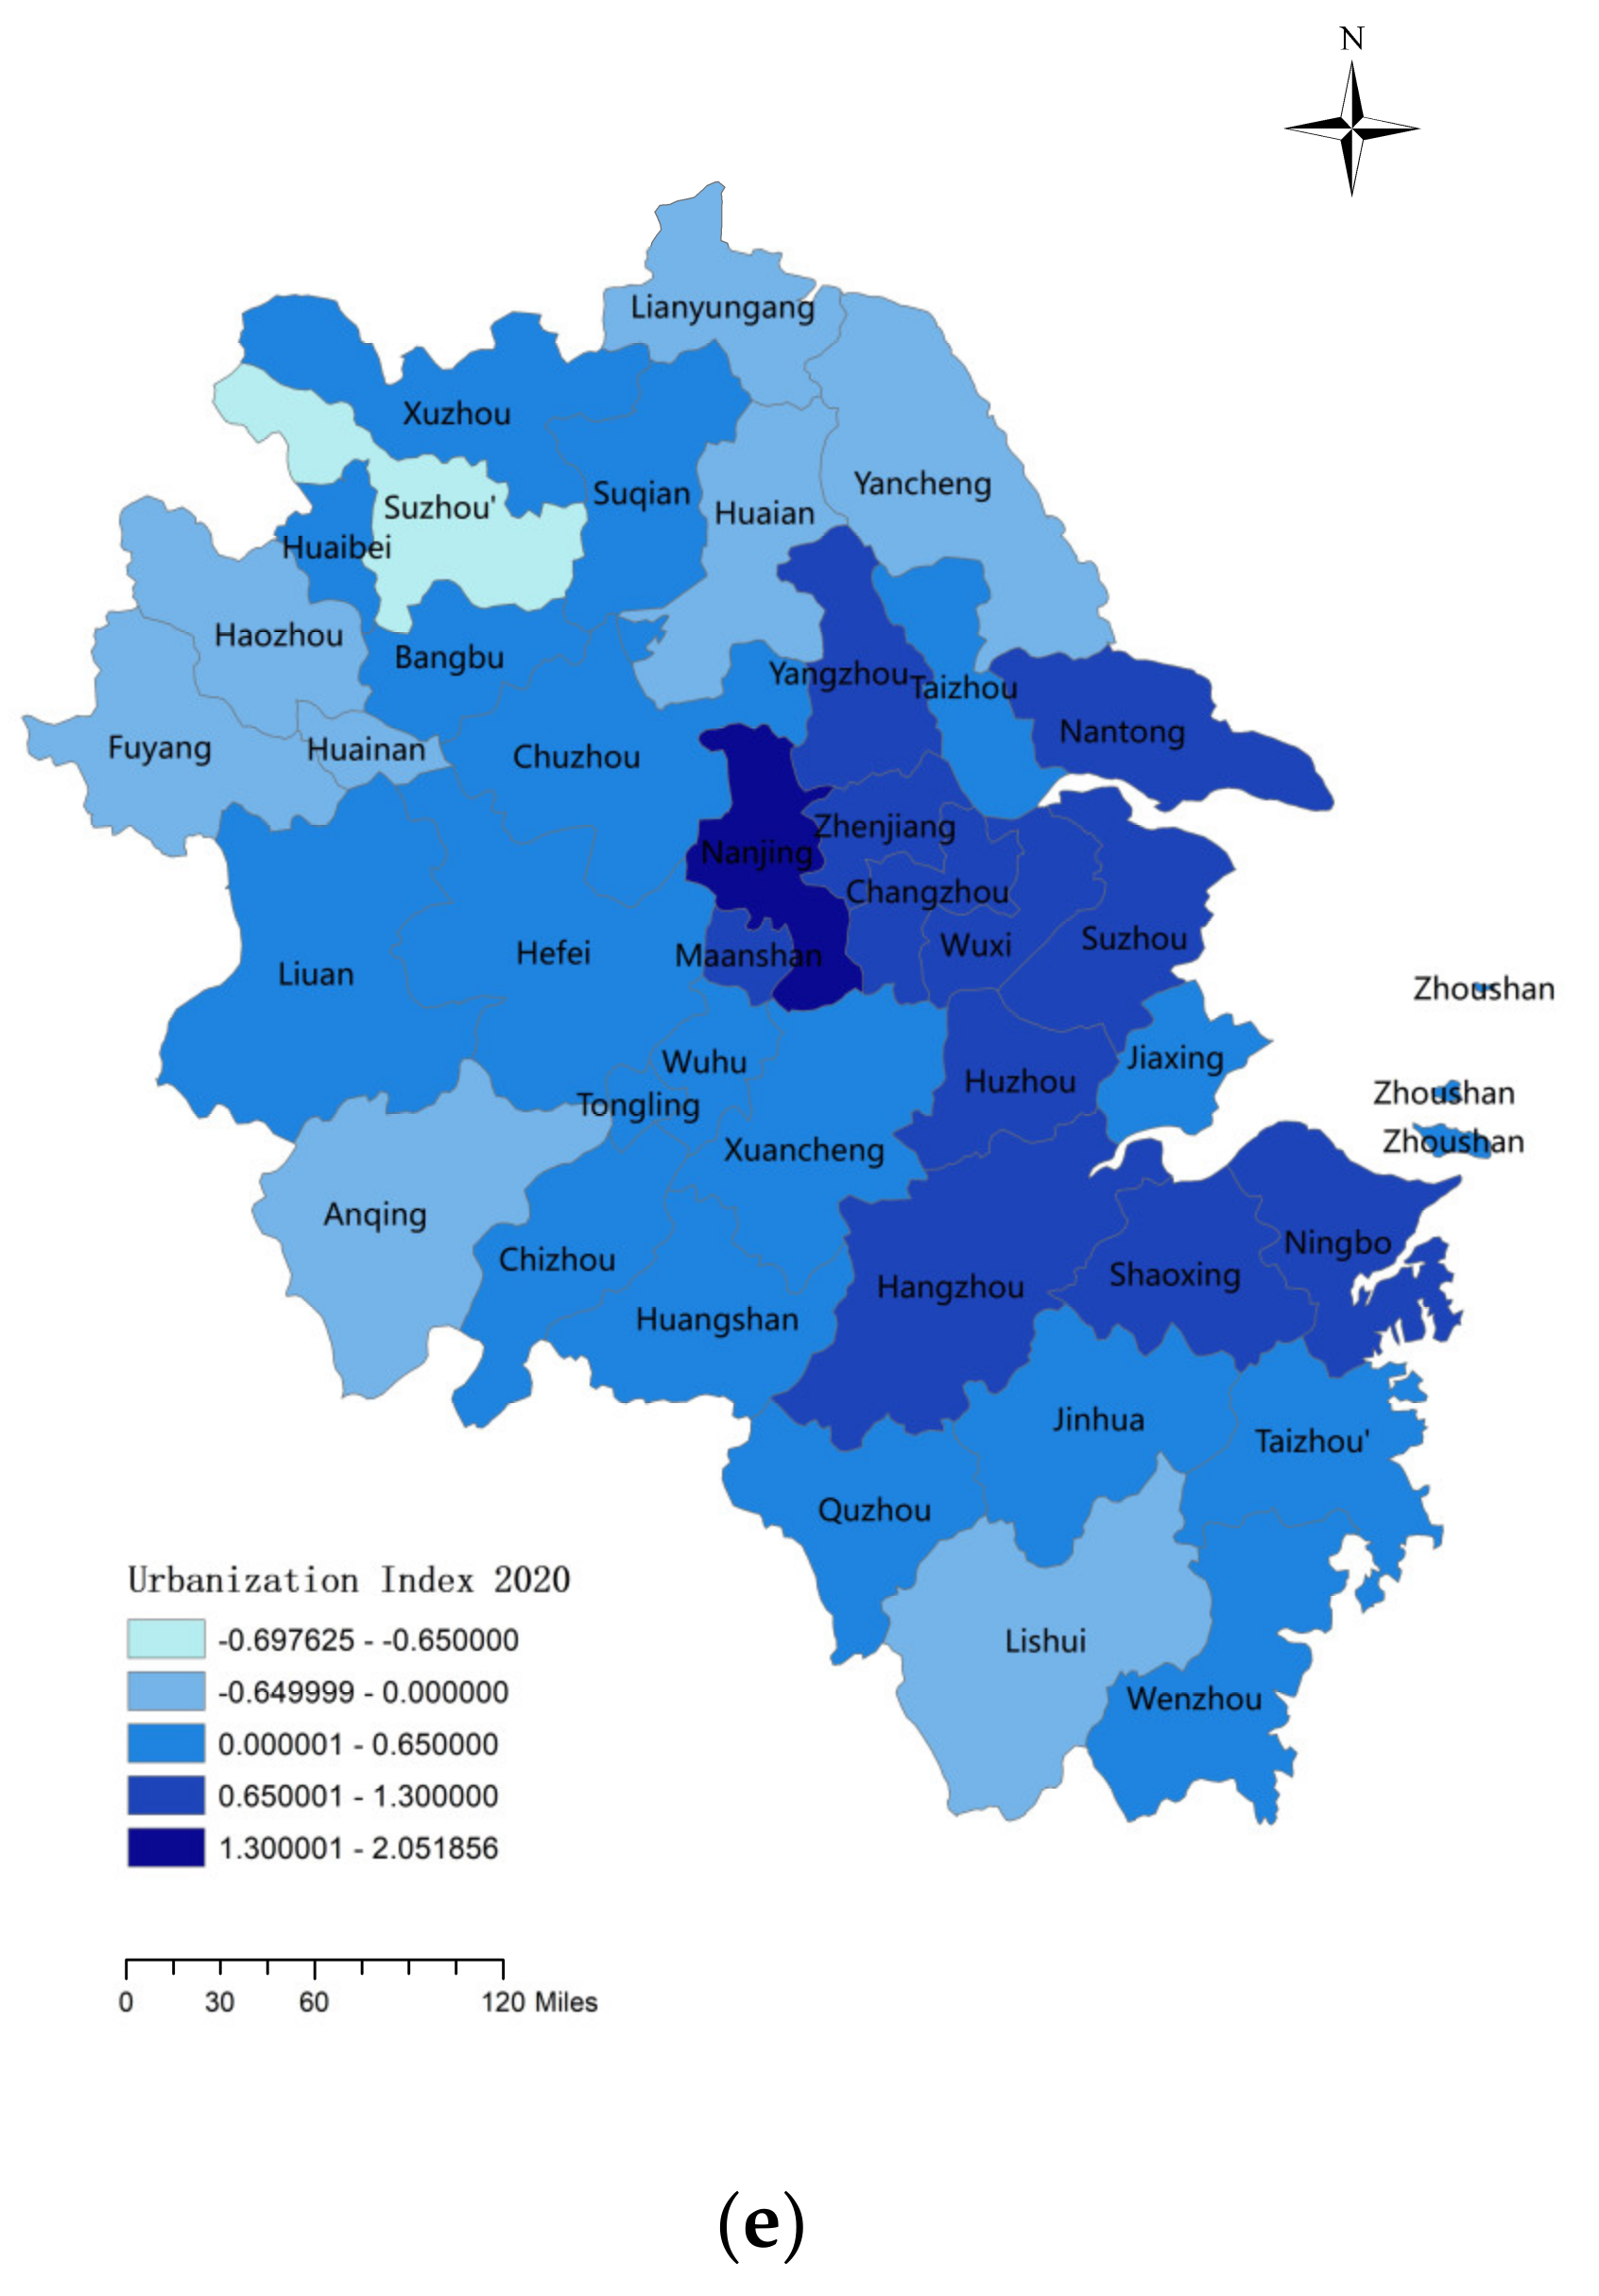
Figure 3 shows the spatial distribution map of the comprehensive score of urbanization level in the Yangtze River Delta region from 2016 to 2020.
The urbanization level in the study area of the Yangtze River Delta region generally shows the characteristics of high levels in the east, low in the southwest, and continually increasing from 2016 to 2020. The urbanization score of Nanjing in 2016 is significantly higher than that in other cities, which is at the highest grade. However, the urbanization score is mainly at the lowest grade in the northern region of the study area. As time goes by, the urbanization level of cities around Nanjing and Suzhou increased conspicuously. Compared with 2016, the urbanization level of the study area in 2020 is generally higher, and cities in the east−central part are mostly highly urbanized. The urbanization level of cities in the northern part are relatively low, which are always below average. A plausible reason for this kind of distribution is that the core cities such as Nanjing, Suzhou, and Hangzhou have more developed scientific and economic conditions, and convenient transportation, which can radiate to the surrounding area to promote urbanization, while the northern cities are lacking these conditions.

5. Empirical Test

5.1. Model Setting

The spatial Durbin model was constructed to test the impact of government venture capital on the urbanization level in the region, as well as to investigate the impact of government venture capital on the urbanization level of the surrounding areas. The specific model settings are as follows:
y i ,   t = ρ W y i ,   t + X β + W X γ + ε
where, y i ,   t is the explained variable representing the urbanization level development of local city i in year t , and W is the spatial weight matrix. As the urbanization level is closely related to regional development, this study adopts the inverse distance matrix: the closer the distance between spatial units, the stronger the spatial effect. W y is the spatial lag term of the explained variable y , representing the situation of the surrounding cities corresponding to the explained variable. X is the city’s various control variables related to urbanization. W X is the control variable of the urbanization characteristics of surrounding cities under spatial lag to reflect the impact of the urbanization characteristics of adjacent areas on the urbanization level of the region. ρ . β . γ is the coefficient of the relevant variable, where, if ρ is significantly positive, it indicates that the development of urbanization level in this region has a positive transmission effect on the adjacent areas; otherwise, if ρ is significantly negative, it indicates that the urbanization level in this region has a negative transmission effect on the adjacent areas. ε ~ N (0, σ 2 I n ) is a random disturbance term, independent of X .
Table 7 shows the results of the descriptive statistics of the relevant variables, where ln_gvc is the logarithm of the government venture capital size, gov is the government fiscal expenditure/GDP, sci is the science and education expenditure/GDP, road is the per capita road area, and tertiary is the tertiary sector output value/GDP. Y is the comprehensive score of the urbanization indicator system. The statistical results shown in Table 7 can be summarized as follows. First, the average urbanization score is 0.07, and the variance is 0.57, indicating that the urbanization development level in the Yangtze River Delta is relatively balanced. Second, the logarithmic variance of the size of the explanatory variable government venture capital is 3.92, which indicates that a large gap exists in the development of government venture capital among cities in the Yangtze River Delta each year. Third, the variance in government fiscal expenditure/GDP is 6.24, which reflects that the degree of government intervention varies greatly among cities. Fourth, the variance in per capita road area is 6.77, which indicates that a large gap exists in the level of basic traffic construction among cities. Fifth, the average value of the output value/GDP of the tertiary sector is 48.00%, and the variance is 6.10, reflecting that the industrial structure of the Yangtze River Delta is generally high, but a large gap also exists between cities.

5.2. Influence of Government Venture Capital on Urbanization

Table 8 presents the results of the spatial regression. The fixed−time spatial Durbin model revealed that that the scale of government venture capital positively correlated with the local urbanization development level, with an impact coefficient of 0.017, which is significant at the 1% level, indicating that government venture capital can significantly promote local urbanization development. The coefficient of W × ln_gvc is significantly positive at the 1% level, and the influence coefficient is 0.182, indicating that the expansion of government venture capital in surrounding cities contributes to promoting the city’s urbanization. In addition, the development of the tertiary sector significantly and positively impacts the local urbanization level. The results in Table 8 support Hypotheses 1 and 2a,b.

5.3. Load Factor Spatial Regression

As the index of urbanization level is relatively abstract, this study uses the spatial Durbin model to conduct a regression analysis on the above−mentioned factors of residents’ living standards, urban construction level, and ecological health level to explore the impact path of the government venture capital scale on the regional urbanization level. Table 9, Table 10 and Table 11 present the regression results for the three load factors. In terms of the direct effect, the impact coefficients of the government venture capital on the living standards of local residents and urban construction levels are 0.015 and 0.029, respectively, and both pass the 10% significance test, indicating that the government venture capital primarily promotes the development of urbanization by influencing the living standards of residents and the urban construction levels, which is consistent with the above hypothesis. The government venture capital promotes local urbanization by supporting infrastructure or public services and other industries. In terms of the indirect effect, the influence coefficient of government venture capital on urban construction levels is 0.256, which is significant at the 1% level. Government venture capital also has a significant indirect impact on the ecological health level, with a coefficient of 0.116. This demonstrates that government venture capital primarily realizes the spatial spillover effect of urbanization by promoting urban construction and ecological health levels throughout the entire region.

6. Robustness Test

6.1. Spatial Correlation Test

The Yangtze River Delta urban agglomeration in China is closely connected; therefore, a spatial econometric model is used. To test the logic of using this type of model, this study conducted a global Moran test on the five−year urbanization level indicators of the 40 cities. The results of the Moran test are presented in Table 12, all of which are significant at the 1% level. Taking 2016 as an example, the Moran scatterplot of the urbanization level score of this year is drawn (Figure 4), which reveals that a relatively obvious spatial aggregation effect exists, with primarily high−high aggregation and low−low aggregation. Therefore, this study believes that using a spatial econometric model is reasonable.

6.2. Applicability of the Model

In this study, the SDM containing spatial lag and spatial error terms was adopted. To test whether the model can be degenerated into SAR or SEM, this study conducted a Wald test on the data. The results rejected the original hypothesis at the 1% significance level, indicating that SDM is suitable for this study, and it cannot be degenerated into SAR or SEM models.

6.3. Result Stability Test

The above regression results are obtained using the inverse distance matrix as the spatial weight matrix; the regional economic level is not included. With reference to the research of Parent et al. [52], this study considered the spatial correlation of economic activities, and constructed a nested matrix containing spatial correlation and economic characteristics and regressed the government venture capital size against the aforementioned variables. Although the regression results using nested matrices have slightly different coefficients, their directions and significance levels do not change substantially, indicating that the results are robust. In addition, this study used the more common adjacency matrix to carry out the above tests, and the results remain robust.

7. Discussion and Analysis

The results presented in Table 8 demonstrate the validity of H1 and H2a, indicating that:
(1)
The promotion of the scale of government venture capital by the government of surrounding cities contributes to promoting the urbanization development of the city.
(2)
The size of government venture capital positively affects the improvement in local urbanization levels.
So that they would better correspond with the actual hypotheses.
Table 9, Table 10 and Table 11 exhibit that the direct effects of government venture capital are primarily achieved by promoting the living standards of residents and the level of urban construction, whereas the indirect effects are reflected through the living standards of residents and the levels of ecological health. Specifically, the establishment of H1 is consistent with the conclusion of this study: the government directs funds to compensate for market failure by supporting public goods with strong positive externalities, such as infrastructure, which directly promote the development and construction of the city and contribute to promoting the urbanization process.
The establishment of H2a demonstrates that the indirect effect emphasized in this study is also significantly positive, likely because government venture capital in urban agglomerations cooperates more than it competes. Alternatively, this may also be due to the fact that, as a developed region of China, the Yangtze River Delta urban agglomeration has sufficient idle social capital, and it is therefore difficult to produce a crowding−out effect or reduce the crowding−out effect. Infrastructure government venture capital promotes the construction of the city, while providing employment and a higher standard of living for city residents. Simultaneously, the industrial government venture capital and the innovation government venture capital may compensate for the key nodes of the industrial chain through cooperation between cities and strengthen the industrial cluster to boost the economic level of the entire region and raise the standard of living for its residents. Moreover, the indirect effects of ecological health were notably positive. In recent years, the Chinese government has focused more on environmental issues. Some cities have established green industry government venture capital on the basis of the experience of developed countries. Through coordination and cooperation among local governments, the entire green ecological health system can be improved, thus, promoting the development of ecological health levels in the entire region.

8. Conclusions and Implications

8.1. Conclusions

The improvement of the urbanization level is the inevitable outcome of a country’s or region’s social and economic development, and a mark of social progress. As a special form of venture capital, government venture capital plays a significant role in promoting regional development and enterprise innovation. This study analyzed the relationship between the regional urbanization level and the scale of government venture capital. On the basis of the panel data of each prefecture−level city in the Yangtze River Delta from 2015 to 2020, this study visually presents the urbanization score of each prefecture−level city through the comprehensive evaluation index of the urbanization level constructed by factor analysis, and draws additional conclusions using a spatial econometric model. The conclusions are as follows:
First, the urbanization development in the Yangtze River Delta has a clear spatial and temporal distribution. The urbanization level of the prefecture−level cities distributed in the eastern and middle regions of the Yangtze River Delta was higher, whereas that of the northwestern regions of the Yangtze River Delta was generally lower. From a provincial perspective, the urbanization level of cities in Jiangsu and Zhejiang Provinces surrounding their respective capitals, Nanjing and Hangzhou, is relatively high, whereas the urbanization level of prefecture−level cities in Anhui is generally low. Additionally, as time passed, the characteristics of this distribution became more apparent. The spatial agglomeration effect primarily presented the characteristics of high−high and low−low agglomerations.
Second, the increasing scale of government venture capital can help improve the urbanization level in a region, and the expansion of the government venture capital’s scale by the surrounding cities is also conducive to the improvement of the local urbanization level. With the characteristics of the combination of marketization and policy, government venture capital guides social capital into the field of venture capital by supporting the development of venture capital enterprises to promote regional industrial transformation and upgrading, as well as the development of regional economies and indirectly promotes the improvement of regional urbanization levels. The expanding scale of government venture capital in neighboring cities creates favorable conditions for the coordinated development of industries across regions, which can also contribute to the improvement of local urbanization levels.
Finally, government venture capital primarily promotes the development of local urbanization by promoting the standards of urban construction and the living standards of residents and fosters the development of regional urbanization by enhancing the level of ecological sanitation. In addition, the development of the tertiary sector will contribute significantly to the local urbanization process.

8.2. Implications

On the basis of the above conclusions, this study provides theoretical support for the development and improvement of China’s government venture capital system and urbanization construction through the following targeted policy recommendations:
First, due to the characteristics of high−high and low−low agglomeration in the spatial distribution of urbanization levels, cities with low urbanization levels will struggle to drive the development of urbanization in surrounding cities and towns. Therefore, for cities with low urbanization levels, the government should appropriately expand the scale of the local government venture capital to better leverage social capital. They should also strengthen complementarity and cooperation with the more developed surrounding cities to realize the full inflow of resources from high to low through cross−border government venture capital, which promotes the urbanization process of less developed cities.
Second, optimize the fund management system and promote the clustered development of capital industry. Establishing a scientific operational process is the key to ensuring the positive development of capital. The government venture capital established by government investment should clarify the project selection principle and bring in a senior talent management team, in order for the capital to have positive development prospects, drive regional economic development, alleviate employment pressure, and actively explore industrial transformation and upgrading to better promote the level of regional urbanization. Since this study found there’s a space spillover effect for government venture capital to facilitate the process of urbanization, the government can build high−level government guidance funds in cities like Hefei and Xuzhou. With the government guidance funds and national laboratories or new collaborative innovation platforms, these cities can attract excellent investment management institutions with rich industry experience to cooperate in setting up funds, and promote the high−quality gathering and development of regional venture capital industry, so as to further improve the urbanization level of this whole region.
Finally, governments should utilize venture capital to continuously deepen the reform of the service industry, promote high−quality development of the tertiary sector, and contribute key forces to the development of regional urbanization. In recent years, the emerging strategic service industry has become a new driver of economic growth. Social forces actively participating in the construction of public services, tourism, culture, sports, health, pension, and other industries enjoy a strong developmental momentum. Ultimately, vigorously developing the modern emerging service industry can not only bring considerable economic benefits, but also provide residents with more abundant material living conditions, which can contribute to the improvement of the local urbanization level in many aspects.

8.3. Reflections

Through static and dynamic analyses, this research revealed the positive impact of government venture capital on urbanization from a geospatial point of view. In addition, a multidimensional evaluation system was constructed to calculate the urbanization level of 40 cities in the YZD region. However, there may be some limitations to this study. Since it is relatively difficult to acquire the data on government venture capital, especially in economically underdeveloped areas where the guidance fund system is still in the early stages, this research only conducted an empirical study based on the YZD region and does not have a comparative analysis to explore the differences and experiences of different regions for reference. Furthermore, there may be some omitted factors that affected the urbanizing process when constructing the urbanization level evaluation system. In addition, this study only revealed the correlation between urbanization and government venture capital from a macro perspective, and more methods should be utilized to explain the theoretical mechanisms. Therefore, the next step for us will be to collect data from various geological regions and conduct further research in a national perspective, along with the refinement of the urbanization level calculation system. Meanwhile, based on this research framework, more empirical methods will be used to uncover the deeper theoretical connections and influence path between urbanization and government venture capital.

Author Contributions

Conceptualization, Q.C.; Data curation, X.L.; Formal analysis, A.H.; Funding acquisition, Q.C.; Methodology, Q.C. and A.H.; Software, A.H. and X.L.; Supervision, Q.C.; Writing—original draft, Q.C. and C.J.; Writing—review and editing, A.H. and X.L. All authors have read and agreed to the published version of the manuscript.

Funding

This research was funded by the National Natural Science Foundation of China (grant No. 72002144), the Sichuan Soft Science Research Project (grant number 2019JDR0345), the Social Science Planning Project of Sichuan Province (grant number SC19TJ026), and the Natural Science Foundation of Sichuan Province (grant number 23NSFSC1348).

Institutional Review Board Statement

Not applicable.

Informed Consent Statement

Not applicable.

Data Availability Statement

The data presented in this study are available on request from the corresponding author.

Acknowledgments

We thank the anonymous reviewers and editors for their constructive comments and suggestions to improve the quality of this article.

Conflicts of Interest

The authors declare no conflict of interest.

References

  1. You, J.H. Development stage, government function and China’s urbanization: Why is China’s urbanization lagging behind? Ind. Econ. Res. 2022, 2, 14–26+84. (In Chinese) [Google Scholar]
  2. Jin, S.L.; Zhang, H.Y.; Sun, H.; Chen, X.X. Promote the process of county urbanization: Facilitate the coordinated development of large, medium and small cities and small towns. Issues Agric. Econ. 2022, 10, 53–59. (In Chinese) [Google Scholar]
  3. Kumar, P. The Economics of Ecosystems and Biodiversity: Ecological and Economic Foundations; Earthscan: London, UK, 2011. [Google Scholar]
  4. Gumming, G.S.; Hoffmann, E.M.; Buerkert, A. Implications of agricultural transitions and urbanization for ecosystem services. Nature 2014, 515, 50–57. [Google Scholar] [CrossRef] [PubMed]
  5. Uday, C.; Sushobhan, M. Impact of land use change and rapid urbanization on urban heat island in Kolkata city: A remote sensing based perspective. J. Urban Manag. 2021, 9, 59–71. [Google Scholar]
  6. Hong, T.; Yu, N.N.; Mao, Z.G.; Zhang, S.H. Government−driven urbanisation and its impact on regional economic growth in China. Cities 2021, 117, 103299. [Google Scholar] [CrossRef]
  7. Fang, C.L. Progress and the future direction of research into urban agglomeration in China. Acta Geogr. Sin. 2014, 69, 1130–1144. (In Chinese) [Google Scholar]
  8. Li, Y.C. Research on the guiding effect and investment effect of China’s government industrial funds. Stud. Sci. Sci. 2021, 39, 442–450. (In Chinese) [Google Scholar]
  9. Gong, Q.N.; Yang, Y.; Yang, H.; Liu, Z.L. From urbanization to urban agglomeration: A summary of the Academic Conference on Population and Development of Major Cities in China. Popul. Econ. 2020, 1, 127–132. (In Chinese) [Google Scholar]
  10. Colombo, M.G.; Cumming, D.J.; Vismara, S. governmental venture capital for innovative young firms. J. Technol. Transf. 2006, 41, 10–24. [Google Scholar] [CrossRef]
  11. Cheng, C.; Li, W.T.; Yang, S.H. The impact and spillover effects of government guidance funds on regional economic development. Theory Pract. Financ. Econ. 2021, 42, 18–25. (In Chinese) [Google Scholar]
  12. Chen, S.Q.; Guo, L.; Jia, Z.H. Logical evolution of government guiding fund. J. Cent. Univ. Financ. Econ. 2017, 2, 3–13. (In Chinese) [Google Scholar]
  13. Schwirian, K.; Prehn, J. An axiomatic theory of urbanization. Am. Sociol. Rev. 1962, 13, 27. [Google Scholar] [CrossRef]
  14. Fedderke, J. Exploring unbalanced growth: Understanding the sectoral structure of the South African economy. Econ. Model. 2018, 72, 177–189. [Google Scholar] [CrossRef]
  15. Schweinitz, K. The stages of economic growth; politics and the stages of growth. J. Econ. Issues 2016, 6, 166–169. [Google Scholar] [CrossRef]
  16. Zaheer, K.; Wu, J.; Huda, K.; Amankwah−Amoah, J.; Czinkota, M.; Zahoor, N. Periphery–core relations and the knowledge domain of international management: New contingencies, characterizations and theories. Eur. Manag. J. 2021, 39, 685–687. [Google Scholar]
  17. Yang, Y.C.; Liu, J.H.; Zhang, Y.T. An analysis of the implications of China’s urbanization policy for economic growth and energy consumption. J. Clean. Prod. 2017, 161, 1251–1262. [Google Scholar] [CrossRef]
  18. Naciri, M.; Sutton, F.; Chenery, H.; Geertz, C.; Birdsall, N. Urban systems and development strategies [with Comments]. Daedalus 1989, 118, 159–181. [Google Scholar]
  19. Xie, L.; Tang, Z.M. Research on relationship between venture capital and economic growth. Sci. Technol. Manag. Res. 2011, 31, 181–185. (In Chinese) [Google Scholar]
  20. Christensen, J.L. Should government support business angel networks? The tale of Danish Business Angels Network. Ventur. Cap. 2011, 13, 337–356. [Google Scholar] [CrossRef] [Green Version]
  21. Cumming, D.; Macintosh. Mutual funds that invest in private equity? An analysis of labour−sponsored investment funds. Camb. J. Econ. 2007, 31, 445–487. [Google Scholar] [CrossRef]
  22. Cumming, D.; Johan, S. Venture Capital and Private Equity Contracting; Elsevier Science Academic Press: Oxford, UK, 2013. [Google Scholar]
  23. Wilson, K.; Silva, F. Policies for Seed and Early Stage Finance Findings from the 2012 OECD Financing Questionnaire; OECD Publishing: Berlin, Germany, 2013. [Google Scholar]
  24. Fang, S. Israeli government venture investment guide. New Financ. Econ. 2006, 7, 66. (In Chinese) [Google Scholar]
  25. Pang, Y.H.; Zeng, L.H. International comparison of operation mode of venture capital leading fund and choice of China. J. Hunan Univ. 2011, 25, 34–38. (In Chinese) [Google Scholar]
  26. Li, H.J.; Bao, X.Y. The empirical research on the performance of venture capital guidance fund abroad. Soft Sci. 2012, 26, 58–62. (In Chinese) [Google Scholar]
  27. Qin, Z.S.; Shu, Y. Research on the operational model of venture capital fund in China. J. Financ. Dev. Res. 2014, 6, 77–80. (In Chinese) [Google Scholar]
  28. Huang, M.Y.; Meng, Y.; Xu, W. Investment fund management and operation mode of Europe and the reference for Chinese government venture capital guide fund. J. Financ. Dev. Res. 2015, 7, 87–96. (In Chinese) [Google Scholar]
  29. Xie, C.S. Venture capital leading fund development in New Zealand and enlightenment to China. Global Science. Technol. Econ. Outlook 2016, 31, 45–54. (In Chinese) [Google Scholar]
  30. Zhang, Z.L. Reference and enlightenment from international experience of government guidance fund. Sub Natl. Fisc. Res. 2017, 10, 105–112. (In Chinese) [Google Scholar]
  31. Zheng, L.S.; Zhu, H.; Zhong, Z. Characteristics, models and revelation of foreign government industry guidance funds. Sub Natl. Fisc. Res. 2017, 30–36. (In Chinese) [Google Scholar]
  32. Cheng, C.H.; Guo, J.H. Review on the venture capital government guiding funds: Research abroad and implications. J. Public Adm. 2019, 12, 89–108. (In Chinese) [Google Scholar]
  33. Gompers, P.; Lerner, J. An analysis of compensation in the US venture capital partnership. Soc. Sci. Electron. Publ. 1999, 51, 3–44. [Google Scholar]
  34. Seunghwan, O.; Jang, P.; Kwak, G. Enhancing the efficiency of governmental intervention in the venture capital market: The monitoring effect. Econ. Anal. Policy 2022, 75, 450–463. [Google Scholar]
  35. Leleux, B.; Surlemont, B. Public versus private venture capital: Seeding or crowding out? a pan−European analysis. J. Bus. Ventur. 2003, 18, 81–104. [Google Scholar] [CrossRef]
  36. Brander, J.A.; Du, Q.; Hellmann, T. The effects of government−sponsored venture capital: International evidence. Rev. Financ. 2015, 19, 571–618. [Google Scholar] [CrossRef]
  37. Alperovych, Y.; Groh, A.; Quas, A. Bridging the equity gap for young innovative companies: The design of effective government venture capital fund programs. Res. Policy 2020, 49, 104051. [Google Scholar] [CrossRef]
  38. Yang, M.L.; Wang, H.; Dong, J.W. Could China’s government venture capital guiding funds guide social funds into venture capital market? Forum Sci. Technol. China 2015, 11, 107–111. (In Chinese) [Google Scholar]
  39. Shi, G.P.; Dang, X.H.; Dong, J.W. Could China’s government venture capital guiding funds lead venture capital firms to invest in early− stage enterprises and high− tech enterprises: Empirical study with difference− in− differences model. Stud. Sci. Sci. 2016, 34, 822–832. (In Chinese) [Google Scholar]
  40. Yan, A.H.; Bner, G.; Lobet, F. How does governmental versus private venture capital backing affect a firm’s efficiency? evidence from Belgium. J. Bus. Ventur. 2015, 30, 508–525. [Google Scholar]
  41. Bertoni, F.; Tykvov, T. Does governmental venture capital spur invention and innovation? Evidence from young European biotech companies. Res. Policy 2015, 44, 925–935. [Google Scholar] [CrossRef]
  42. Dong, J.W.; Wang, H.; Shi, G.P. The impact of GVCGFs equity participation in VC funds on enterprise innovation. Stud. Sci. Sci. 2018, 36, 1474–1486. (In Chinese) [Google Scholar]
  43. Ponce, D.; Marshall, J.D. Relationship between urbanization and CO2 emissions depends on income level and policy. Environ. Sci. Technol. 2014, 48, 3632–3639. [Google Scholar] [CrossRef]
  44. Ren, L.; Cui, E.; Sun, H. Temporal and spatial variations in the relationship between urbanization and water quality. Environ. Sci. Pollut. Res. 2014, 21, 13646–13655. [Google Scholar] [CrossRef] [PubMed]
  45. Bai, Y.; Deng, X.; Jiang, S. Exploring the relationship between urbanization and urban eco−efficiency: Evidence from prefecture−level cities in China. J. Clean. Prod. 2018, 195, 1487–1496. [Google Scholar] [CrossRef]
  46. Generaal, E.; Timmermans, E.J.; Dekkers, J.E.C. Not urbanization level but socioeconomic, physical and social neighbourhood characteristics are associated with presence and severity of depressive and anxiety disorders. Psychol. Med. 2019, 49, 149–161. [Google Scholar] [CrossRef] [Green Version]
  47. Zhou, G.X.; Lin, L.F.; Yu, J.X. Land urbanization, population urbanization and urban economic growth. Inq. Into Econ. Issues 2017, 10, 97–105. (In Chinese) [Google Scholar]
  48. Naglaa, Y.; Hanan, A. Validity and reliability of the English version of the Student Evidence−Based Practice Questionnaire among Arabic−speaking undergraduate students at health sciences colleges: A cross−sectional study. Nurse Educ. Today 2022, 118, 105525. [Google Scholar]
  49. LeSage, J. Spatial econometric panel data model specification: A Bayesian approach. Spat. Stat. 2014, 9, 122–145. [Google Scholar] [CrossRef]
  50. Rossi, F.; Robinso, P. Higher−order least squares inference for spatial autoregressions. J. Econom. 2022, 232, 244–269. [Google Scholar] [CrossRef]
  51. Kumari, M.; Sarma, K.; Sharma, R. Using Moran’s I and GIS to study the spatial pattern of land surface temperature in relation to land use/cover around a thermal power plant in Singrauli district, Madhya Pradesh, India. Remote Sens. Appl. Soc. Environ. 2019, 15, 100239. [Google Scholar] [CrossRef]
  52. Parent, O.; Lesage, J. Using the variance structure of the Conditional Autoregressive Spatial Specification to model knowledge spillovers. J. Appl. Econom. 2008, 23, 235–256. [Google Scholar] [CrossRef]
Figure 1. Roadmap of methods.
Land 12 00053 g001
Figure 2. Gravel diagram.
Land 12 00053 g002
Figure 3. Spatial distribution map of urbanization level, 2016–2020. Panels (ae) show the results for each year from 2016 to 2020, respectively.
Land 12 00053 g003aLand 12 00053 g003b
Figure 4. Moran scatterplot for the year 2016.
Land 12 00053 g004
Table 1. Comprehensive evaluation system of urbanization level.
Level I IndicatorLevel II IndicatorsLevel III Indicators
Comprehensive evaluation system of urbanization indexUrbanization of economic living standardsTotal retail sales of consumer goods
Per capita disposable income of urban residents
Per capita disposable expenditure of urban residents
Urbanization of social developmentPer capita domestic water consumption
Volume of books in public libraries
Sub−regional social electricity
Number of beds in health institutions
Urbanization of populationProportion of urban population
Proportion of employees in the tertiary sector
Number of students in general higher education
Urbanization of ecological environmentSewage treatment rate
Per capital park green space area
Green coverage rate of built−up areas
Table 2. Variable definitions.
Variable TypeVariablesDescription
Explained Variables 1goodsTotal retail sales of consumer goods (CNY 100 million)
incomePer capita disposable income of urban residents (CNY)
expenditurePer capita disposable expenditure of urban residents (CNY)
waterPer capita domestic water consumption (liter)
librariesVolume of books in public libraries (10,000 copies)
electricitySub−regional social electricity (100 million KWH)
healthNumber of beds in health institutions (10,000 sheets)
populationProportion of urban population (%)
tertiaryProportion of employees in the tertiary sector (%)
educationNumber of students in general higher education (10,000 person)
sewageSewage treatment rate (%)
greenPer capital park green space area. (square meters)
greeningGreen coverage rate of built−up areas. (%)
Explanatory Variable 2ln_gvcLogarithm of government venture capital scale
Control Variables 1govThe ratio of government fiscal expenditure to local GDP (%)
sciThe ratio of science and education expenditure to local GDP (%)
roadPer capita road area (square meters)
tertiaryThe ratio of tertiary sector output value to local GDP (%)
1 The data of explained variables and control variables were derived from the China Statistical Yearbook, China Urban Construction Statistical Yearbook and the local statistical yearbook (http://www.stats.gov.cn/tjsj/, accessed on 8 October 2022). 2 The data used for evaluating ln_gvc for the years 2016–2020 were obtained from the Qingke Private fundraising Database (PEDATA) (https://www.pedata.cn/data/index.html, accessed on 10 October 2022).
Table 3. KMO and Bartlett test results.
Kaiser−Meyer−Olkin metrics0.816
BartlettChi−Square3139.276
Df78
p-value0.000
Table 4. Extraction of interpretation factors.
FactorEigenvalueDifferenceProportionCumulative
Factor16.223154.309580.47870.4787
Factor21.913570.745480.14720.6259
Factor31.168080.194780.08990.7158
Factor40.973300.145940.07490.7906
Factor50.827360.291000.06360.8543
Factor60.536360.093530.04130.8955
Factor70.442820.095910.03410.9296
Factor80.346920.083090.02670.9563
Factor90.263820.103570.02030.9766
Factor100.160250.062600.01230.9889
Factor110.097650.072430.00750.9964
Factor120.025210.003700.00190.9983
Factor130.021520.00171.0000
Table 5. Rotating component matrix.
VariableFactor1Factor2Factor3Uniqueness
sewage0.12680.37910.21610.7935
green−0.40340.67580.09930.3707
health0.8436−0.3279−0.15910.1555
greening−0.10410.70500.16640.4645
education0.82020.1565−0.42460.1225
population0.84800.21840.19380.1956
tertiary0.80810.0730−0.10920.3298
water0.26380.6223−0.39910.3839
electricity0.7928−0.17010.12210.3277
libraries0.67320.3489−0.40630.2601
goods0.9133−0.2547−0.07870.0948
income0.79570.15980.48810.1031
expenditure0.81150.05330.49500.0936
Table 6. Top 10 and bottom 10 cities in urbanization level.
City20162017201820192020
Nanjing1.5006991.5943781.664141.9364982.051856
Suzhou, (Jiangsu)0.7427880.7408140.8292021.2444941.189343
Wuxi0.5492740.6894780.8132210.971441.062226
Changzhou0.4551220.6203110.5538290.801220.937329
Hangzhou0.2885080.3423670.5729620.6878090.914214
Ningbo0.0423790.088110.3512410.6841620.903884
Shaoxing0.2013710.271470.6109150.8449830.883624
Zhenjiang0.3103470.4089190.5850420.7379470.855591
Huzhou0.2808620.3528850.5336070.7136710.779099
Ma’anshan0.2620330.3143360.4696530.6081450.747828
Wuhu−0.47591−0.24034−0.126130.0587970.006358
Yancheng−0.73446−0.51943−0.3255−0.20412−0.02685
Lishui−0.28773−0.28416−0.15064−0.09593−0.04822
Huaian−0.56938−0.42007−0.36153−0.18641−0.08561
Lianyungang−0.89127−0.70963−0.55401−0.30318−0.11957
Huainan−0.59712−0.21901−0.06739−0.07987−0.26807
Bozhou−1.17072−1.1689−0.76128−0.56618−0.26829
Anqing−0.6219−0.73998−0.56847−0.34874−0.43782
Fuyang−1.12224−1.0568−0.35972−0.41869−0.48423
Suzhou, (Anhui)−0.84638−0.90996−0.83161−1.02256−0.69763
Table 7. Variable descriptive statistics.
VariableObsMeanStd. Dev.MinMax
Y2000.06577120.5661382−1.1707182.051856
ln_gvc2004.7195443.91737011.17043
gov20016.628726.2449128.12750634.22708
sci2003.4637351.2177571.73035910.24661
road20024.439456.77827412.0945.53
tertiary20047.99936.0960963468.04297
Table 8. Spatial regression results.
Variables(1)(2)(3)(4)
MainWxSpatialVariance
ln_gvc0.017 **0.182 ***
(2.478)(3.536)
Gov−0.026 ***−0.097 *
(−3.642)(−1.888)
Sci−0.064 *0.378
(−1.808)(1.486)
Road0.0010.087 ***
(0.162)(3.168)
tertiary0.027 ***−0.048 *
(5.760)(−1.852)
Rho 0.262
(1.129)
sigma2_e 0.115 ***
(10.060)
Observations200200200200
R−squared0.2210.2210.2210.221
Number of cities40404040
z−statistics in parentheses. *** p < 0.01, ** p < 0.05, * p < 0.1.
Table 9. Regression results of the living standards of regional residents.
Variables(1)(2)(3)(4)
MainWxSpatialVariance
ln_gvc0.015 *0.265 ***
(1.868)(4.344)
Gov−0.041 ***−0.250 ***
(−4.943)(−4.175)
Sci−0.0341.351 ***
(−0.826)(4.509)
Road−0.018 ***0.014
(−3.861)(0.429)
tertiary0.032 ***0.086 ***
(5.802)(2.761)
Rho 0.725 ***
(6.654)
sigma2_e 0.160 ***
(9.829)
Observations200200200200
R−squared0.2920.2920.2920.292
Number of cities40404040
z−statistics in parentheses. *** p < 0.01, * p < 0.1.
Table 10. Regression results of the urban construction levels.
Variables(1)(2)(3)(4)
MainWxSpatialVariance
ln_gvc0.030 *0.006
(1.943)(0.056)
Gov−0.045 ***0.148
(−2.913)(1.368)
Sci0.085−1.097 **
(1.111)(−1.979)
Road0.018 **0.204 ***
(2.041)(3.394)
tertiary0.056 ***−0.347 ***
(5.267)(−6.138)
Rho 0.089
(0.343)
sigma2_e 0.546 ***
(9.979)
Observations200200200200
R−squared0.3040.3040.3040.304
Number of cities40404040
z−statistics in parentheses. *** p < 0.01, ** p < 0.05, * p < 0.1.
Table 11. Regression results of the ecological health levels.
Variables(1)(2)(3)(4)
MainWxSpatialVariance
ln_gvc−0.0010.173 *
(−0.059)(1.873)
Gov0.029 **−0.043
(2.253)(−0.481)
Sci−0.318 ***−0.042
(−4.999)(−0.088)
Road0.014 *0.094 *
(1.953)(1.885)
tertiary−0.027 ***−0.020
(−3.295)(−0.410)
Rho −0.649 **
(−1.995)
sigma2_e 0.374 ***
(10.005)
Observations200200200200
R−squared0.1590.1590.1590.159
Number of cities40404040
z−statistics in parentheses. *** p < 0.01, ** p < 0.05, * p < 0.1.
Table 12. Moran test results.
VariablesIE(I)sd(I)zp-Value
Y20160.081−0.0260.0313.4470.000
Y20170.078−0.0260.0313.3520.000
Y20180.095−0.0260.0313.9020.000
Y20190.136−0.0260.0315.2300.000
Y20200.128−0.0260.0314.9650.000
Disclaimer/Publisher’s Note: The statements, opinions and data contained in all publications are solely those of the individual author(s) and contributor(s) and not of MDPI and/or the editor(s). MDPI and/or the editor(s) disclaim responsibility for any injury to people or property resulting from any ideas, methods, instructions or products referred to in the content.

