Article

Urban Industrial Carbon Efficiency Measurement and Influencing Factors Analysis in China

1
College of Resource Environment and Tourism, Capital Normal University, Beijing 100048, China
2
Institute of Geographic Sciences and Natural Resources Research, Chinese Academy of Sciences, Beijing 100101, China
*
Author to whom correspondence should be addressed.
Land 2023, 12(1), 26; https://doi.org/10.3390/land12010026
Submission received: 9 November 2022 / Revised: 15 December 2022 / Accepted: 16 December 2022 / Published: 22 December 2022

Abstract

:
Based on the EBM-DEA (Explainable Boosting Machine-Data Envelopment Analysis) model, this paper constructs an evaluation model of urban industrial carbon efficiency (UICE), measures and analyzes the spatial evolution characteristics of China’s UICE from 2003 to 2016, and analyzes the influencing factors of UICE using the Tobit model. The research draws the following conclusions: (1) China’s UICE improved from 2003 to 2016, and the distribution showed a spatial pattern decreasing from the east, central, west, and northeast regions. (2) The UICE, by region, was at an initial low stable level in 2003 and was in the process of moving towards a highly-efficient stable state up until 2016. The differences between regions have been the main aspect which affects the overall variation in UICE in China. (3) There is a logistic curve relationship between the economic development level and UICE. (4) Nationally, the factors that are significantly and positively correlated with UICE are: industrial agglomeration, local fiscal decentralisation, level of economic development, technological progress, industrial enterprises’ average size, and industrial diversification. Factors that are significantly negatively correlated with UICE are the level of industrialization, the share of output value of state-owned enterprises in total output value, industrial openness, and environmental regulation. The factors influencing UICE differ depending on the stage of industrialization.

1. Introduction

Climate change characterized by global warming has become one of the most destructive sustainable development crises in the global environment, and massive carbon emissions are thought to be the leading cause of global warming [1]. Major countries around the world have developed measures to address climate change in the base period of their carbon reduction targets [2], and committed to achieving carbon peak and carbon neutral targets in the next 30–40 years [3].
Industrial carbon emissions have always been an important component of carbon emissions in China [4]. According to the data of the China Statistical Yearbook from 2004 to 2017, industrial carbon emissions accounted for about 50–60% of total carbon emissions for many years. In 2020, the Chinese government set clear targets for carbon peaking by 2030 and carbon neutrality by 2060. The time window for reaching carbon peak and carbon neutrality is tight and promoting a green and low-carbon transformation of industry is daunting. At present, China is still in the development stage of in-depth industrialization, and the proportion of traditional industry is still very high. Promoting green technological advancement and improving industrial carbon emission efficiency is an important method to control the growth of industrial carbon emissions [5]. China’s 14th Five-Year Plan for National Economic and Social Development and the Long-Range Objectives Through the Year 2035 [6] suggests that a system based on the control of carbon intensity, supplemented by control of total carbon emissions, should be implemented to further promote a low-carbon transition in the industrial sector. The 14th Five-Year Plan for Green Industrial Development in China [7] proposes to uphold the principles of efficiency-first, innovation-driven, and market-led systematic promotion, and strive to achieve significant results in the green and low-carbon transformation of industrial structure and production modes by 2025.
Industrial carbon efficiency research has been a key area of industrial sustainability research for many scholars. According to the “Environmental Kuznets Hypothesis,” the environmental situation of a country or a region deteriorates during the process of economic development and then gradually improves [8]. In this process, environmental efficiency also changes, which provides a theoretical basis for judging the change characteristics of industrial carbon efficiency in countries or regions at different industrial development stages. On this basis, scholars have studied the industrial carbon emission efficiency of different countries or regions. Some scholars have studied the industrial carbon efficiency in developed countries such as the United States and Japan [9,10]. For example, Sueyoshi and Goto [11] proposed a new approach using DEA (Data Envelopment Analysis) to examine the sustainability of the Japanese industrial sector, which found that technological innovation could be more effective at improving the performance of the energy sector. Jung and Park [12] measured the CO2 intensity of manufacturing in Korea from 1981–1996 and found that the integration of local and global environmental policies played an important role in reducing CO2 emissions. Some scholars have studied industrial carbon emissions in developing countries, such as China and India. For example, by constructing a spatial double difference (SDID) model, Shufen, Yawen [13] studied the spatial spillover effect of carbon emission trading (CET) policies on the reduction of industrial carbon intensity. It is thought that the CET market is an effective way to improve carbon emission performance. Qiang, Xinyu [14] explored the impact of various technological factors on the intensity of industrial carbon emissions through an empirical study of carbon emissions in India. It is argued that the energy scale efficiency and technological advances are the most important factors in curbing carbon emissions. Due to the rapid economic growth and the resulting severe greenhouse gas emissions, the issue of the efficiency of China’s industrial carbon emissions has attracted widespread scholarly attention [15]. Lei, Zhang [16] and other scholars have analyzed China’s industrial carbon emission efficiency on a national scale and concluded that China’s industrial carbon emission efficiency has improved. At the same time, some economically developed and industrially intensive regions have also become the main targets of research, such as the Beijing-Tianjin-Hebei region, the Pearl River Delta region and the Yangtze River Delta region in the eastern coastal region of China. For example, Jingjie, Junli [17] used the Stochastic Frontier Analysis Method (SFA) combined with carbon productivity to measure the industrial carbon emission efficiency in the Yangtze River basin. In addition, the industrial carbon emission efficiency of some regional central cities and key industrial cities has also received attention from scholars [18,19].
The first chapter of this paper reviews the research background and puts forward the research problem. The second chapter is the literature review, which reviews the measurement of industrial carbon efficiency, analyses of the industrial carbon efficiency of different industries, and the factors influencing industrial carbon efficiency. The third chapter details the research method. In this section, the theoretical framework for the analysis of the factors influencing UICE is proposed. The fourth chapter is the study area and data source. The fifth chapter is the empirical findings and analysis. The sixth chapter is the main conclusions as well as recommendations.

2. Literature Review

For the measurement of industrial carbon efficiency, Data Envelopment Analysis is one of the most commonly-used methods in the field of efficiency evaluation due to its high flexibility in variable settings and data processing [20]. Based on different economic perspectives, DEA methods are usually divided into two categories: radial and non-radial methods; the former, such as CCR (A. Charnes & W. W. Cooper & E. Rhodes), is based on Debreu-Farrell economic theory, while the latter, such as SBM (Slack Based Measure) is based on Pareto-Koopmans economic theory. Radial models have overly stringent assumptions and deviate from the real economy. The most commonly-used methods in non-radial models are SBM (Slack Based Measure) and DDF (Directional Distance Function) [21]. For example, Cheng, Li [22] measured the met frontier total factor carbon emission efficiency of 30 industrial sectors in China from 2005–2015 using an improved non-radial directional distance function (NDDF). Hongtao, Jian [23] used the SBM model to measure the UICE in the Pearl River Basin from 2009–2017. Although the non-radial approach circumvents the assumption of radial reduction in input factors, this comes at the cost of losing the original proportional information of the projection of the efficiency frontier. Since its introduction, the EBM (Epsilon-based Measure) model, which combines radial and non-radial approaches in one framework, has been widely used by researchers. For example, Linhui, Hui [24] used a mixed-distance EBM–DEA model with non-desired outputs to measure the carbon total factor productivity of 281 representative cities in China. Yizhen, Luwei [25] used multi-source remote sensing and statistical data on 268 cities in China from 2008–2018, using the EBM–DEA model to measure urban eco-efficiency in China.
The analysis of carbon emission efficiency measures for industrial sectors focuses on the Chinese industrial sector as a whole [26,27]. For example, Ruiming, Rongqin [2] used a three-stage data envelopment analysis model to estimate the carbon emission efficiency of energy-intensive industries in China at the provincial level, and concluded that the carbon emission efficiency of energy-intensive industries has obvious spatial heterogeneity and spatial agglomeration, including high-energy-consuming and high-polluting industrial sectors such as petrochemicals, cement, thermal power, and iron and steel [28,29,30]. For example, Lin and Wang [30] measured CO2 emissions from the petroleum coking industry and concluded that the scale of investment expansion was the main driver of emissions growth. Research based on the enterprise perspective is relatively rare, focusing on the thermal power industry, petrochemical industry, and highly-polluting industries [30,31,32].
The “environmental Kuznets hypothesis” suggests that there is an “inverted U-shaped” relationship between environmental degradation and economic development, i.e., environmental degradation rises and then falls with economic development, and in the process [33], environmental efficiency changes as well. Grossman and Krueger argue that economic growth affects changes in environmental quality through three pathways: scale effects, technology effects, and structural effects [34], and scholars have studied how these factors also significantly affect industrial carbon emission efficiency. For example, a study by Yu and Yang [15] argues that economic growth has a positive effect on industrial carbon emission efficiency. A study by Lu and Li [35] argues that industrial scale and industrial enterprise size have a positive effect on the improvement of industrial carbon emission efficiency in the Yangtze River Delta region, and a study by Dong, Jin [36] argues that industrial structure upgrading will promote industrial carbon emission reduction. Porter hypothesis suggests that appropriate environmental regulation has a technological compensatory effect, stimulating technological innovation, and improving industrial emission efficiency. For example, Jianmin and Wei [37] concluded that technological progress has a positive effect on industrial carbon emission efficiency improvement. In addition, the “environmental halo hypothesis” describes the impact of foreign investment on the host country’s environment in the process of economic globalization. This hypothesis assumes that advanced clean technologies and environmental management systems adopted by multinational companies in the course of outward investment will be disseminated to the host country, thereby promoting improved environmental efficiency in the host country and having a beneficial impact on the host country’s environment. [23]. Lei, Linyu [5] also confirmed the significant impact of foreign investment on the carbon efficiency of Chinese industry. In addition, some scholars believe that the structure of energy consumption and environmental regulations also have an impact on industrial carbon emission efficiency [38].
At present, research on industrial carbon efficiency is mainly focused on the national and provincial/regional scales, with a focus on measuring and analyzing industrial carbon emission efficiency in different industrial sectors. Due to the lack of research data, there are relatively few studies on industrial carbon efficiency on an urban scale. Much of the analysis of the factors influencing industrial carbon efficiency has focused on macro socio-economic factors, with less systematic consideration of the factors that define industry itself. This article adds value to the existing literature in three ways: (1) in contrast to previous studies, this paper focuses on the city scale, which is the basic geographical unit for the implementation of industrial green development and ecological civilisation in China, making it necessary to conduct an in-depth and systematic study of industrial carbon emission efficiency at the city scale. (2) For the consideration of factors influencing industrial carbon efficiency, current research has focused more on regional socio-economic conditions and less on the systematic consideration of industrial characteristic factors. This paper systematically investigates the influencing factors on industrial carbon efficiency at the urban and industrial scales, based on micro-data from Chinese industrial enterprises. (3) Dividing China into the eastern, central, western, and northeastern regions, the study explores the regular changes in different factors influence on the UICE under different development levels. The study can provide an important reference for the development of low carbon urban industries in China.

3. Research Methods

3.1. Accounting for Industrial Carbon Emissions at City Scale

Commonly used methods for carbon emission accounting at the city scale include the IPCC Guidelines for National Greenhouse Gas Inventory (including sectoral and reference methods) [34], the Oak Ridge National Laboratory method [39], and the guidelines for accounting for greenhouse gas emissions published by the Energy Research Institute of the National Development and Reform Commission in China. The IPCC Inventory Guidelines method has been widely applied because of its more detailed classification of fuels [40]. However, industrial energy consumption at the city scale is difficult to obtain, making the accounting of urban industrial carbon emissions very difficult. Based on the top-down measurement perspective, some scholars put forward the idea of measuring industrial carbon emissions on the city scale by constructing provincial industrial carbon emission factors, such as Zhaohan, Zijie [41]. Based on the availability of data and with reference to the IPCC Inventory Guidelines methodology, we determined that urban industrial carbon emissions are based on two main sources: emissions measured through the industrial combustion of fossil fuels and emissions converted from electricity consumption at industrial endpoints. To measure carbon emissions from industrial fossil fuel combustion, we constructed a top-down approach to estimating industrial carbon emissions data. Provincial industrial carbon emissions were first calculated, and then the industrial carbon emissions of each city were measured using the total industrial output value as the allocation indicator. Meanwhile, based on previous scholarly research [2], we used the ratio of total employment in two carbon-emitting and energy-intensive industries, manufacturing and electricity and heat production and supply, to total industrial employment as an adjustment factor to reflect industrial differences between cities. The formulas are as follows:
T j = T 1 j + T 2 j
T 1 j = S t × C I j = ( ( Σ M t j × B t o × C C t o × C O t o × 44 12 ) / I t × C I j × ( M i M t )
T 2 j = E j × E F g r i d , h
M i = M E i / M N i
M t = M E t / M N t
where T j is the total carbon emissions from j prefecture-level cities; T 1 j represents the carbon emissions from fossil fuel combustion in each prefecture-level city; T 2 j represents the carbon emissions from electricity consumption in the terminal sector in each prefecture-level city; S t represents the carbon emission coefficient of industrial energy, that is, the carbon emissions per unit of industrial output value at province t; o is the 12 industrial fossil fuel energy sources selected from the statistical classification of the National Bureau of Statistics, including raw coal, washed coal, other washed coal, coke crude oil, fuel oil, gasoline, paraffin, diesel, liquefied petroleum gas, natural gas, and coke oven gas; t is the province/municipality where prefecture j is located; M r j represents the consumption of different energy sources; B j represents the emission factor of fuel j; C C j represents the default carbon content of j energy sources; C O j represents the carbon oxidation rate of j energy sources; I t represents the total industrial output value of province t; C I j represents the industrial output of city j; E j is the industrial terminal electricity consumption of city j; and E F g r i d , h is the average CO2 emission coefficient of the regional power grid where city j is located. The low calorific value of different types of energy are measured according to the China Energy Statistics Yearbook. Electricity emission factors were calculated for each year based on the average CO2 emission factor data of the regional grid from 2003–2016, released by the Department of Climate Change Response of the National Development and Reform Commission of the People’s Republic of China from 2006–2018. M i represents the ratio of total employment in both manufacturing and electricity, and heat production and supply industries to total industrial employment in city i; M t represents the ratio of total employment in both manufacturing and electricity, and heat production and supply industries to total industrial employment in the province t where city i is located; M E i represents total employment in manufacturing and electricity, and heat production and supply industries in city i; M N i represents total industrial employment in city i; M E t represents total employment in manufacturing and electricity, and heat production and supply in province t where city i is located; and M N t represents total industrial employment in province t where city i is located.

3.2. UICE Measurement Model

Data Envelopment Analysis models can be used to assess the efficiency of multifactor inputs and outputs and are mainly divided into CCR/BBC-DEA models, which are based on radial measures, and SBM-DEA models, which are based on non-radial measures. However, the traditional CCR/BBC model assumes that all factors vary proportionally and does not take into account slack variables (over-input and under-output), and the measured results are often inconsistent with reality. Non-radial SBM models measure efficiency based on slack variables, avoiding the assumption of radial estimation and seeking to maximize inputs by identifying the furthest frontier points; however, they lose the original scaling information of the efficiency frontier projections in the process [42]. For this reason, the Epsilon-Based measure (EBM) model proposed by Tone and Tsutsui is a hybrid model combining both radial and non-radial data envelopment analysis models, which avoids either underestimating or overestimating efficiency values and improvement spaces [43]. Therefore, the EBM-DEA model was used to calculate industrial carbon emissions efficiency. The traditional non-oriented EBM model (without considering the undesired output) can be expressed as follows:
min θ ε x i = 1 m W i s i x i k φ + ε y + j = 1 q W r + s r + y j k
j = 1 n x i j λ j + s i = θ x i k             i = 1 , , m
j n y r j λ j s r + = φ y r k                     r = 1 , , q
λ 0           s i 0   s r + 0         θ 1       φ 1
where x i k and y r k represent the inputs and outputs, respectively, of decision unit k, m and r represent the quantities of inputs and outputs, λ represents the linear combination coefficient of the decision unit, θ represents the desired output, φ represents the efficiency value of the radial component of the desired output component, s i represents the amount of slack in input factor i, and s r + represents the amount of slack in the output factor. W i represents the weight of each input indicator and W r + represents the weight of each output indicator. ε represents the weight of the non-radial component in the calculation of efficiency, which takes values in the range [0,1] for the radial model, that is, the super-efficiency (SBM) model. A mixture of radial and non-radial adjustments for scaling and slackening improvements yielded the target values for the inputs and outputs as follows:
χ * = θ x k s i
Y * = φ y k + s r +
Considering the undesired output, it follows that:
min θ ε x i = 1 m W i s i x i k φ + ε y + j = 1 n w r + s r + y i k + ε b t = 1 p w t b s t b b t k
i = 1 n x i j λ j + s i = θ x i k                       i = 1 , , n
j = 1 n y r j λ j s r + = φ y r k                       r = 1 , , q
j = 1 n b t j λ j + s t b = φ b t k                   t = 1 , , p
λ 0 ,   θ 1 ,   φ 1 ,   s i 0 ,   s r + 0 ,   s b 0
where b t k is defined as the first t undesired outputs of the kth decision unit (t = 1,…,p),   W t b represents the weight of the undesired output, and s t b represents the radial (slack) change in the undesired output. UICE (ICEE) is defined as the ratio of the desired industrial carbon emissions intensity to the actual carbon emissions intensity, and is given by the following equation:
I C E E = c / y / C / Y
where Y represents the actual total city industrial output, C represents the actual industrial carbon emissions, y represents the total industrial output adjusted by the EBM model, and c represents the industrial carbon emissions adjusted by the EBM model. Further, 0 < ICEE ≤ 1, where the closer the ICEE value is to 1, the closer the actual amount of CO2 emissions per unit of industrial output is to the ideal value, and, thus, the more significant the efficiency.

3.3. Constructing UICE Measurement Index System

Based on the definition of industrial carbon efficiency given above, and with reference to existing studies [27], the industrial carbon emission efficiency measurement and evaluation index system we constructed includes five aspects: capital input, labor input, energy input, desired output, and undesirable output, in which the capital input index is measured by the industrial fixed asset input, labor input is measured by the number of industrial employees, energy input is the sum of industrial end-use energy consumption and secondary energy power input, desired output is the value of total industrial output, and undesirable output is the industrial carbon dioxide emission.

3.4. UICE Factor Analysis Model

3.4.1. Theoretical Framework Construction

We consider the factors influencing industrial carbon emission efficiency at both urban and industrial scales. For the urban scale, we draw on existing studies to consider the level of economic development, the level of industrialization, environmental regulations, and also the impact of fiscal decentralization on industrial carbon efficiency in China [44,45,46]. Fiscal decentralization is an important part of China’s transformation to a market economy and an important institutional basis for the country’s rapid development of economy. According to promotion tournament theory, in pursuit of rapid local economic growth in a short period of time, local governments are more inclined to develop industries that contribute significantly to economic growth, which tend to be some pollution-intensive industries, while lacking investment incentives in areas such as pollution control, which require large capital investment and have low short-term economic benefits. This governmental behavior is not conducive to regional industrial structure upgrading and technological innovation, and carries on to affect industrial carbon emission efficiency [47,48].
According to existing studies, we have considered the size of industrial enterprises, industrial structure, industrial technological progress, and industrial openness in terms of factors influencing industrial scale, and also the impact of industrial agglomeration, industrial diversification, and industrial ownership structure on industrial carbon emission efficiency [49,50]. Combined with the theory of industrial agglomeration, we argue that the agglomeration of a large number of firms can lead to technological spillovers between firms and competition between firms to stimulate the adoption and creation of new technologies. Lu and Li [35] promote industrial carbon emission efficiency. Cross-industry clustering and diversification can stimulate new ideas and facilitate the creation of new products and technologies, thereby contributing to the carbon efficiency of industry. Under China’s economic system, in which public ownership is the mainstay and a variety of ownership systems develop together, state-owned enterprises are in a dominant position in the development of the national economy. State-owned enterprises are prone to inefficiencies due to their “waiting, relying and demanding” mentality, lack of operational autonomy, and low governance efficiency.
In summary, this paper presents a comprehensive analysis of the factors which influence industrial carbon emission efficiency in cities from 11 aspects, including the level of economic development, industrialization, environmental regulation, fiscal decentralization, and other urban development factors, as well as industrial enterprise scale, industrial structure, industrial technical advancement, industrial openness, industrial concentration, industrial diversification, industrial property structure, and other industrial characteristic factors (Figure 1).

3.4.2. Tobit Model

This paper measures UICE values between [0, 1], and the size of the explanatory variables in Ordinary Least Squares (OLS) is not limited. The regression results will be biased towards zero and will not reflect the actual situation. The greatest advantage of the Tobit model over traditional OLS is that it can address a situation where the explanatory variables are restricted to (0, 1] in the model regression [51]. Based on the aforementioned theoretical analysis, the panel Tobit impact factor analysis model was constructed as follows:
Y j t = α + β 1 U G P j t + β 2 U I C j t + β 3 E R j t + β 4 D L F j t + β 5 I S C j t + β 6 S T j t               + β 7 I T P j t + β 8 O I j t + β 9 I A j t + β 10 D I C j t + β 11 I O j t + ε j t
where Y represents UICE, UGP represents a level of economic development, UIC represents industrialization level, ER represents environmental regulation, DLF represents fiscal decentralization, ISC represents industrial size, ST represents industrial structure, ITP represents industrial technological progress, OI represents industrial openness, IA represents industrial agglomeration, DIC represents industrial diversification, IO represents industrial ownership structure, j represents city, α represents intercept terms, ε j t represents random disturbance terms, and t represents time. The metric data for each indicator are shown in Table 1.

4. Study Areas and Data Sources

4.1. Study Area

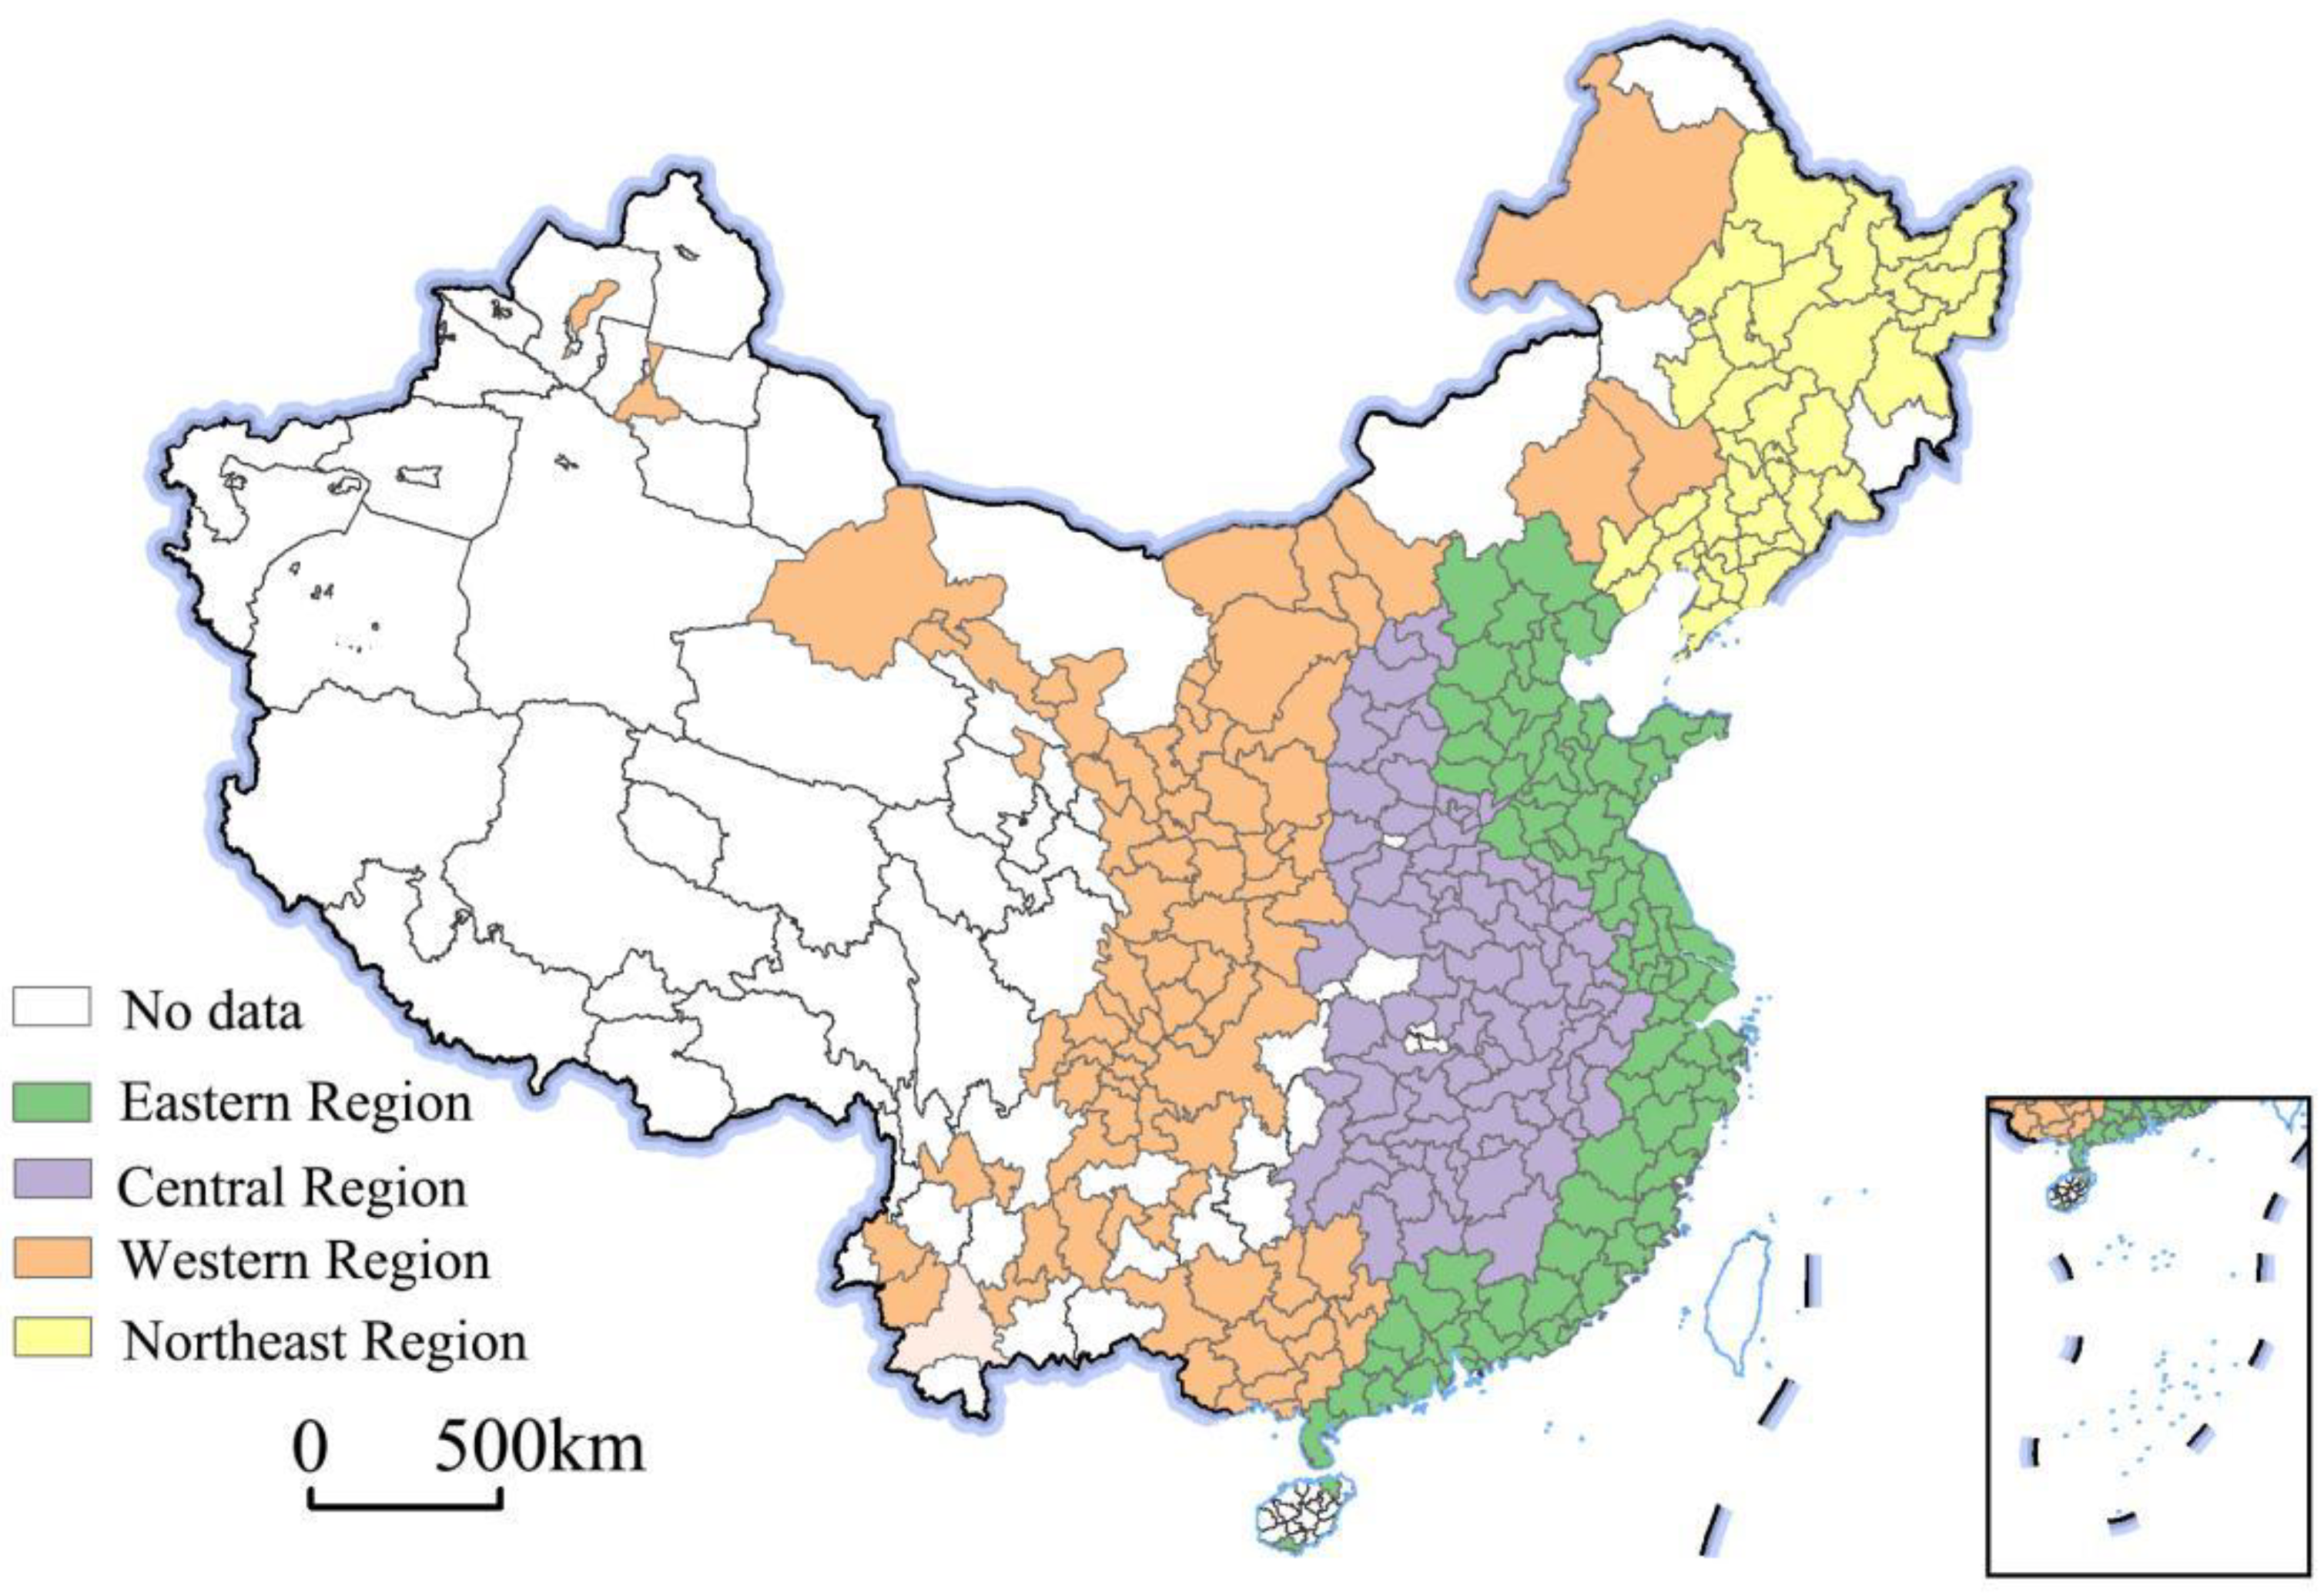
282 cities in mainland China were selected as the study objects (excluding cities in Hong Kong, Macao, Taiwan, and cities in self-increased autonomous regions due to data availability restrictions). Since China’s reform and opening-up, the Chinese government has successively put forward regional development strategies such as the pioneering development of the east, the development of the west, the revitalization of the northeast, and the rise of central China to promote the pioneering and coordinated development of the region. Each region has different levels of development due to its regional location, resource endowment, and policy conditions. In order to explore the evolutionary mechanism of industrial carbon emission efficiency under different development levels, this paper divides China into: eastern region, central region, western region, and northeastern region (Figure 2).

4.2. Data Source

The Tenth Five-Year Plan for National Economic and Social Development of China proposed to accelerate the transformation of industrial growth, save energy and reduce consumption, prevent pollution, improve labour productivity, and promote the transformation and upgrading of industrial structure. Due to the availability of data, the time frame of this paper is 2003–2018. Data on UICE accounting and impact factors on city scale were obtained from the China Urban Statistical Yearbook and the China Energy Statistical Yearbook. Data on variables related to industry’s own physical signs were obtained from the database of Chinese industrial enterprises from 2003–2013. Urban industrial patents data were obtained by matching Chinese Industrial Enterprise Data with Chinese Patent Data. The timeframe of the data is restricted and the indicators are replaced by the characteristic values of 2013. To ensure the accuracy of the data, we refer to [48], who have pre-processed the data in the China Industrial Enterprise Database.

5. Empirical Results

5.1. Spatial Evolution of UICE in China

Using the ArcGIS natural breakpoint method, UICEs in 2003 and 2016 were divided into high, medium, and low categories (Figure 3). For the purpose of this study, low efficiency ranged from 0 to 0.3, medium efficiency ranged from 0.3 to 0.7, and high efficiency ranged from 0.7 to 1. In 2003. China’s UICE was dominated by low efficiency, with 221 cities with low efficiency, accounting for 78.37% of the total number of cities. During this period, China’s industrialization level was generally quite low, and most cities were at the primary stage of industrialization, with crude industrial production, low technology level, and obvious resource and energy factor-driven characteristics. The number of medium- and high-efficiency cities with UICE was relatively small, with Sanya City, as the only high-efficiency city, and 60 medium-efficiency cities, accounting for 21.28% of the number of cities nationwide, mainly distributed in the eastern coastal region, including most cities in Jiangsu Province, Hangzhou, Ningbo, Wenzhou, Shaoxing, Zhoushan, Taizhou, Jiaxing, and Lishui in Zhejiang Province, most cities in Guangdong Province, Xiamen and Shanghai in Fujian Province, and a few in Western regions, such as Dingxi in Gansu Province, Guyuan in Ningxia Hui Autonomous Prefecture, Bazhong in Sichuan Province, Lijiang in Yunnan Province, Fangchenggang in Guangxi Province, etc.
In 2016, the overall spatial distribution of UICE in China showed a gradual decrease from the east to thecentral region, furthing decreasing to thewest and then to thenortheast region. The number of cities with medium and high UICE increased significantly, with 99 cities with high UICE, accounting for 35.23% of the total number of cities, mainly in most cities in Guangdong Province in the eastern region, most towns in Jiangsu Province, Tai’an, Zaozhuang, Linyi, Zibo, Dezhou, Dongying, Liaocheng, Heze, Qingdao, and Yantai in Shandong Province, Fuzhou, Nanping, Quanzhou, Sanming, Nanping, and Longyan in Fujian Province, and Huzhou, Hangzhou, Ningbo, Jinhua, Shaoxing, Lishui, and the cities of Beijing, Shanghai, and Tianjin in Zhejiang Province. The central region mostly consists of in Hefei, Wuhu, Xuancheng, Bengbu, Huangshan, Huabei, and Fuyang in Anhui Province, Shangrao and Jiujiang in Jiangxi Province, and Xiangtan, Shaoyang, Yiyang, Changsha, Xiangtan, Zhangjiajie, Chenzhou, and Yueyang in Hunan Province. The western region is partially contiguous, including cities in Chongqing, Sichuan Province, and Guangxi Province. The largest number of cities with medium efficiency in UICE, 138 in total, accounting for 48.94% of the total number of cities, are mainly located in Putian and Xiamen in Fujian Province, Wuwei and Lanzhou in Gansu Province, Guiyang, Anshun, Zunyi, and Liupanshui in Guizhou Province, Sanya and Haikou in Hainan, Quzhou, Taizhou, Jiaxing, Zhoushan, and Wenzhou in Zhejiang Province, and Anhui, Jiangxi, Shandong, Henan, Hunan, Hebei, Heilongjiang, Hubei, Guangxi, Sichuan, and most other cities in the mentioned provinces. The 45 cities with low efficiency in UICE are mainly located in the western and northeastern provinces of Inner Mongolia, Ningxia, Gansu, Liaoning, and Yunnan.
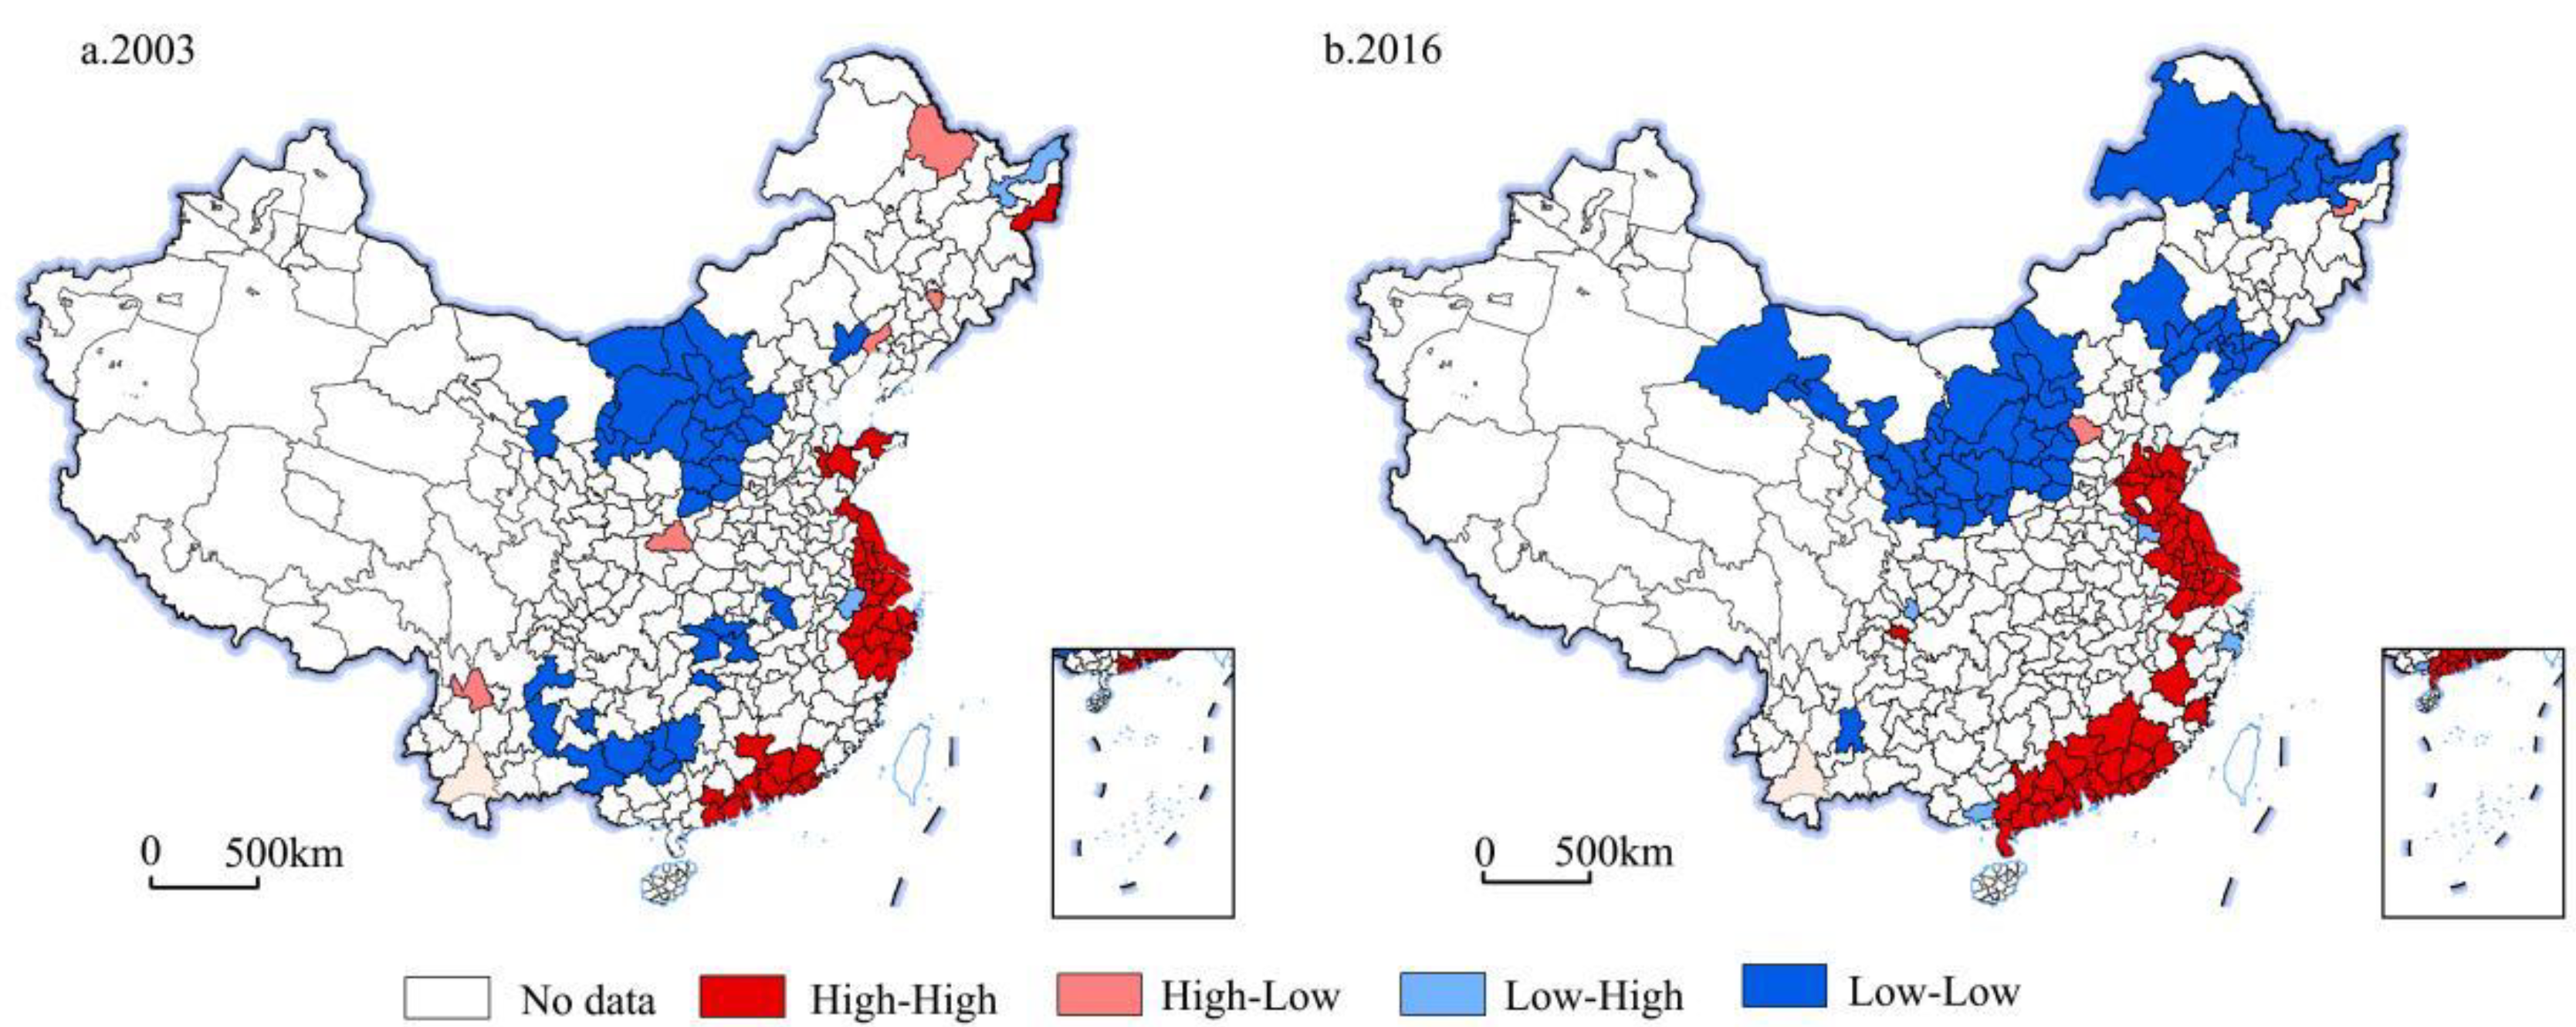
According to the global autocorrelation analysis, the global Moran’s I values for 2003 and 2016 were 0.4643 and 0.6667, respectively, passing the significance level test (p = 0.03). This indicates that UICE has significant favourable spatial correlation properties, and the spatial correlation tends to increase. According to the local spatial autocorrelation analysis, cities with significant spatial agglomeration effects were classified into four types (Figure 4). Among them, the high-high type, i.e., the UICE high-value agglomeration area, is concentrated in the middle and lower reaches of the Yangtze River plain area. The number of cities contained in the area shows an increasing trend. The region has a developed economy, high level of industrial technology, and high level of industrial carbon emission efficiency, showing an obvious spatial agglomeration effect. The low-low type, i.e., UICE low-value agglomeration area, is concentrated in the cities of the Yunnan-Guizhou Plateau and the Loess Plateau region in the western region, and the number of cities in the western region shows an increasing trend. Industrial development in the region is dominated by traditional industries, with high energy consumption and pollution as the main characteristics, driven by industrial transfer and the spatial proximity effect, showing a low-value agglomeration state. The number of cities in both low-high and high-low agglomerations is low.

5.2. Spatial Evolution of UICE Types in China

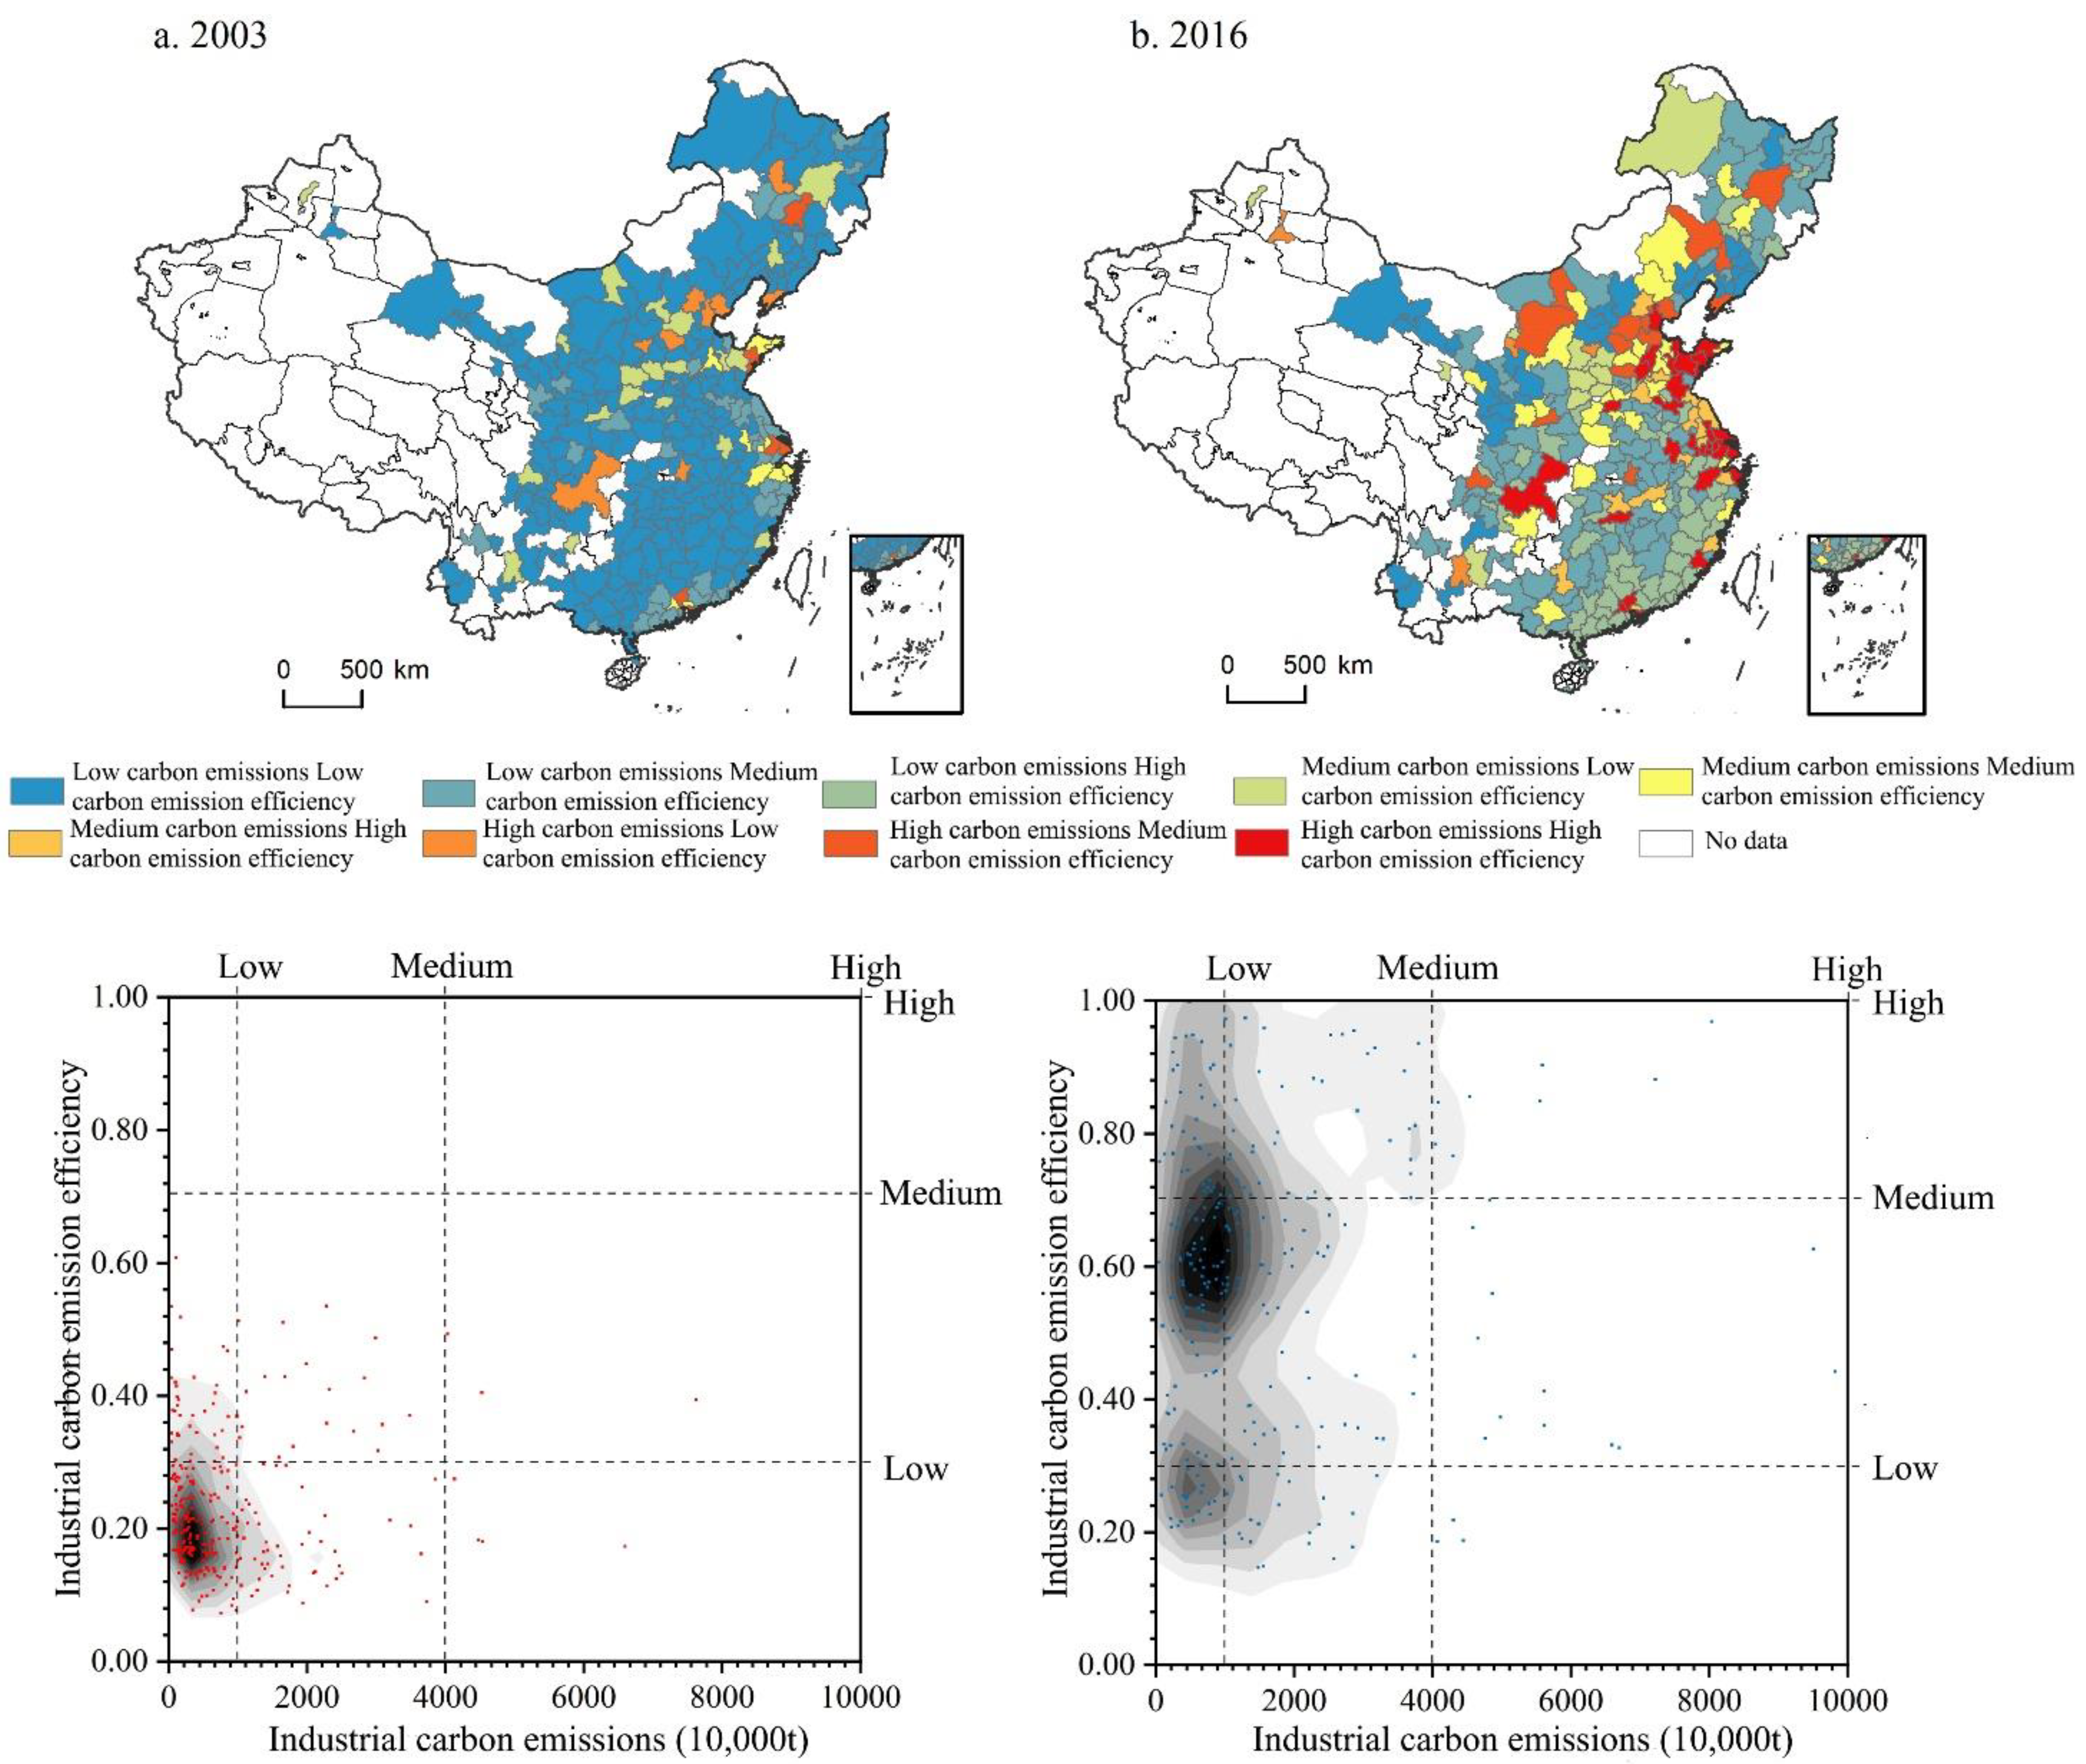
Using the natural breakpoint method, the industrial carbon emissions and industrial carbon efficiency of Chinese cities in 2003 and 2016 were divided into three types: low, medium, and high, and nine types were formed by the combination of two kinds.
In 2003, the UICE in China was dominated by the low carbon emission low efficiency type, with 60.09% of the cities in China falling into this type and spreading across the country. The second-most efficient type of low carbon emission city is found in Hebi and Luohe in Henan Province, Suizhou in Hubei Province, Dongying and Liaocheng in Shandong Province, occasionally in Liaoyuan, Songyuan, and Baicheng in Jilin Province, Hebi and Qitaihe in Heilongjiang Province, Bazhong in Sichuan Province, Lijiang in Yunnan Province, Shangluo in Shaanxi Province, and most cities in Guangdong, Zhejiang, and Jiangsu (Figure 5a). The single type dominant pattern of UICE in China was broken in 2016, with the largest proportion of cities with low carbon emissions medium efficiency accounting for 32.98% of all cities, mainly in Liupanshui and Anshun in Guizhou Province, Haikou and Sanya in Hainan Province, Hegang in Heilongjiang Province, Baicheng in Jilin Province, Rizhao in Shandong Province, Lijiang in Yunnan Province, Taizhou in Zhejiang Province, Zhoushan in Hunan Province, Henan Province, Hubei Province, Jiangxi Province, Shaanxi Province, Guangxi Zhuang Autonomous Region, and most cities in Sichuan Province. The second-largest group of cities with low carbon emissions is the high-efficiency category, which accounts for 20.21% of all cities, mainly in Jilin and Heilongjiang in the northeast, and in coastal areas such as Anhui, Fujian, Guangdong, and Zhejiang in the east. The medium-efficiency type with high carbon emissions is mainly located in Shandong Peninsula in the eastern region, while the medium efficiency type with high carbon emissions is mainly located in northern Jiangsu Province (Figure 5b). In 2003, the evolution mode of China’s UICE mode in 2003 can be summarized as “single core—horizontal expansion“ type, which means that a dominant core of low carbon emission and low efficiency type is formed and shows a clear horizontal growth of industrial carbon emissions (Figure 5c). The evolution mode of UICE in 2016 can be summarized as “double core—vertical increase,” which means that there are two cores of low carbon emission medium efficiency and low carbon emissions low efficiency, and they show obvious evolution characteristics of a significant vertical increase in UICE (Figure 5d).

5.3. Characteristics of Regional Differences in UICE in China

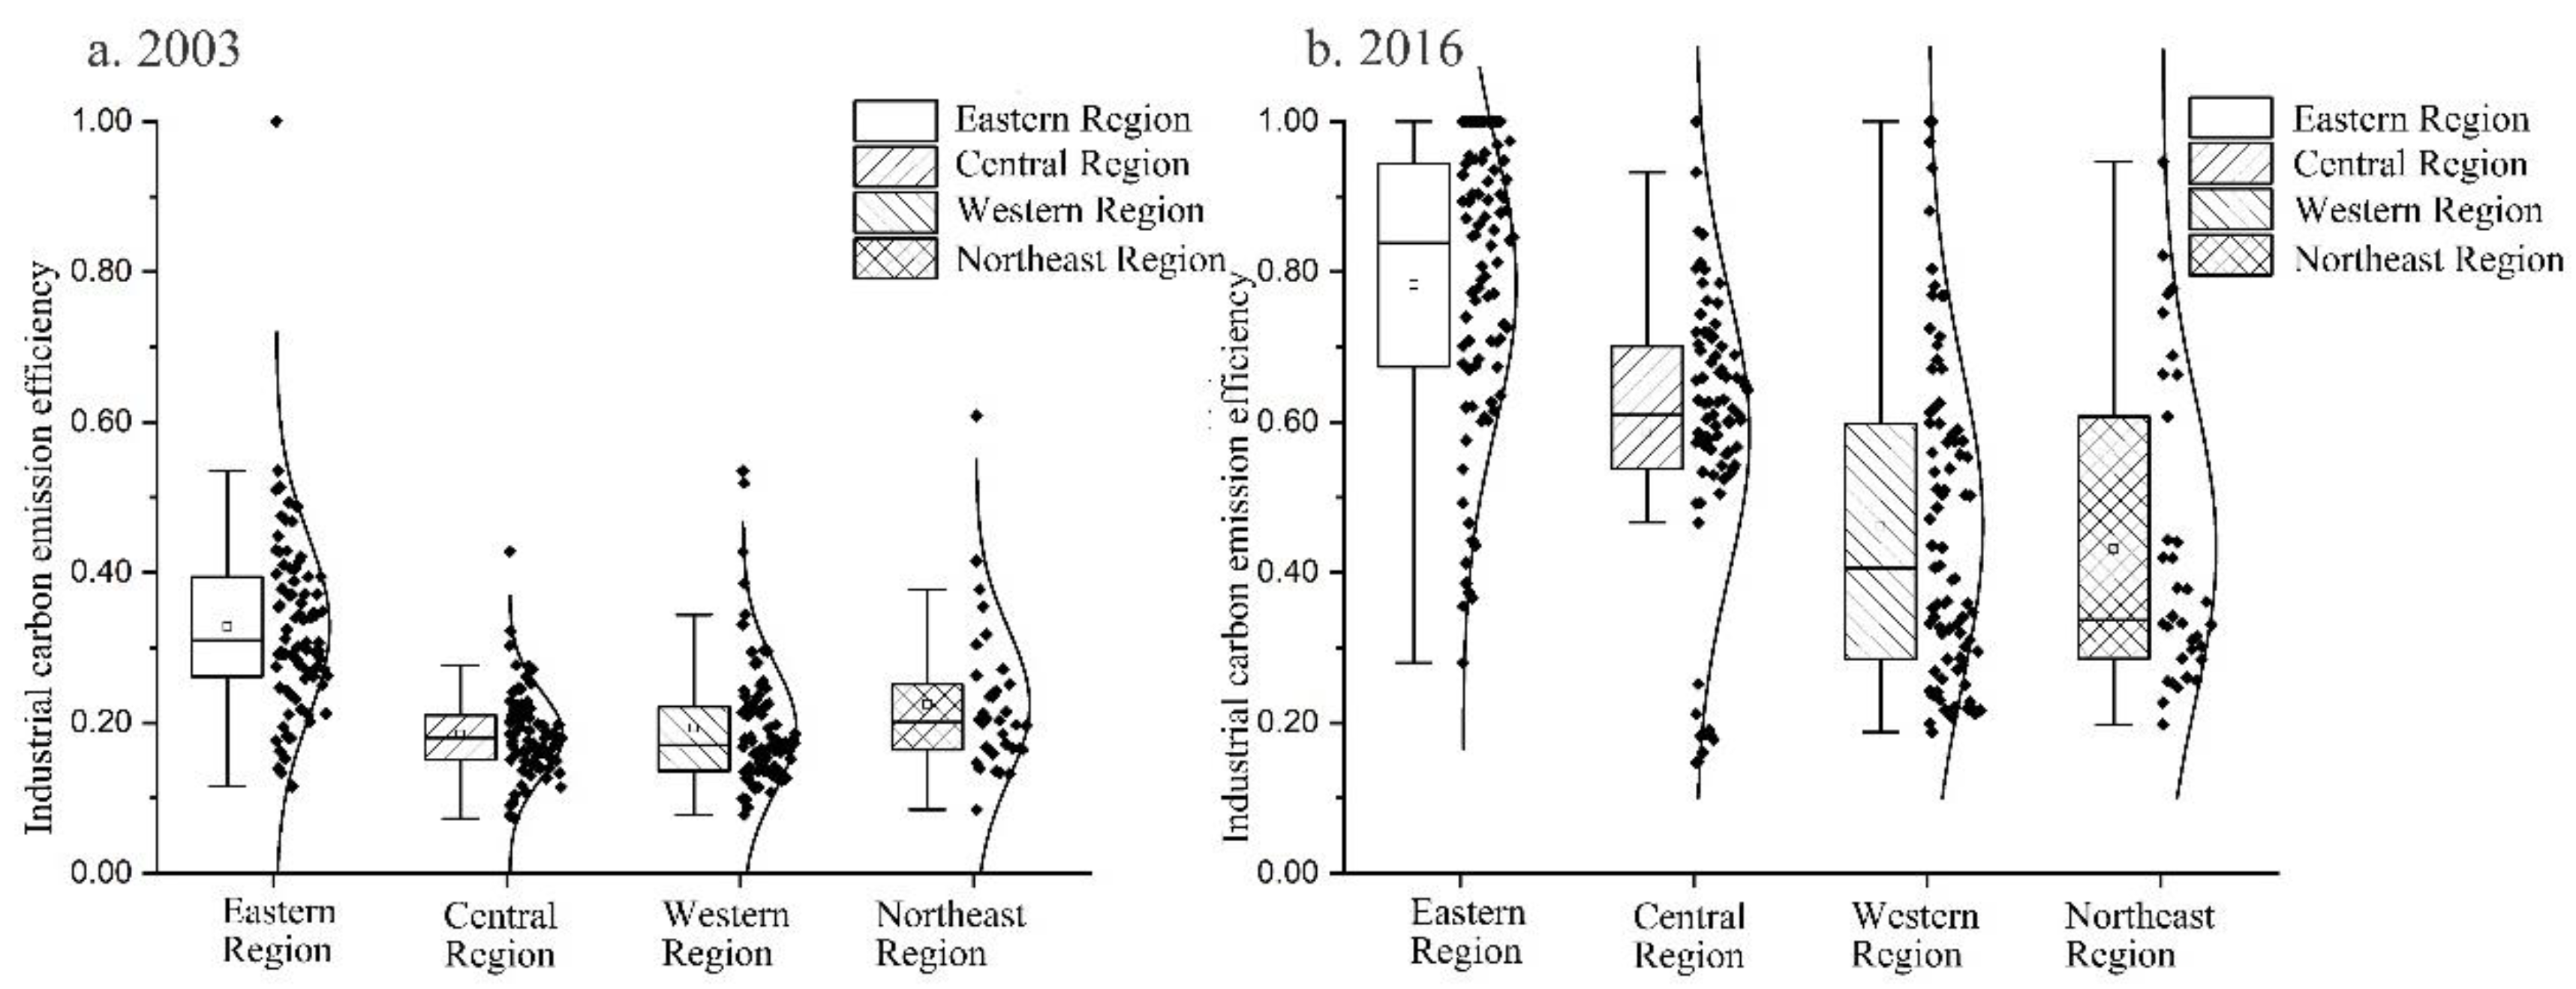
We plotted a box line of UICE for each region in China. In 2003, the average value of UICE in the eastern region was higher than that of other regions, while the differences among other regions were not significant. The overall level of UICE was low. The UICE distribution within each region was relatively concentrated and basically normally distributed. It was indicated that UICE in China was at an initial low level of stability at the beginning of the study (Figure 6a). UICE improved across all regions in 2016. Regional differences increased, with the eastern region reaching high efficiency levels overall, with the central and western regions, as well as the northeastern region, being moderately efficient. The normal distribution of each region is broken, and the distribution curve of UICE becomes flat. The distribution curves of the eastern and central regions form a “trailing effect,” indicating that, while the UICE of most cities in these two regions has increased, the industrial carbon efficiency of a small number of cities is still at a low level; the distribution curves of the western and northeastern regions form a “leading effect,” with the UICE of a small number of cities at a high level. However, most cities are still at a low level of industrial carbon efficiency (Figure 6b). It can be seen that UICE, in 2016, has not yet reached a new steady state in all regions and is still in the process of evolving towards a high-efficiency steady state.
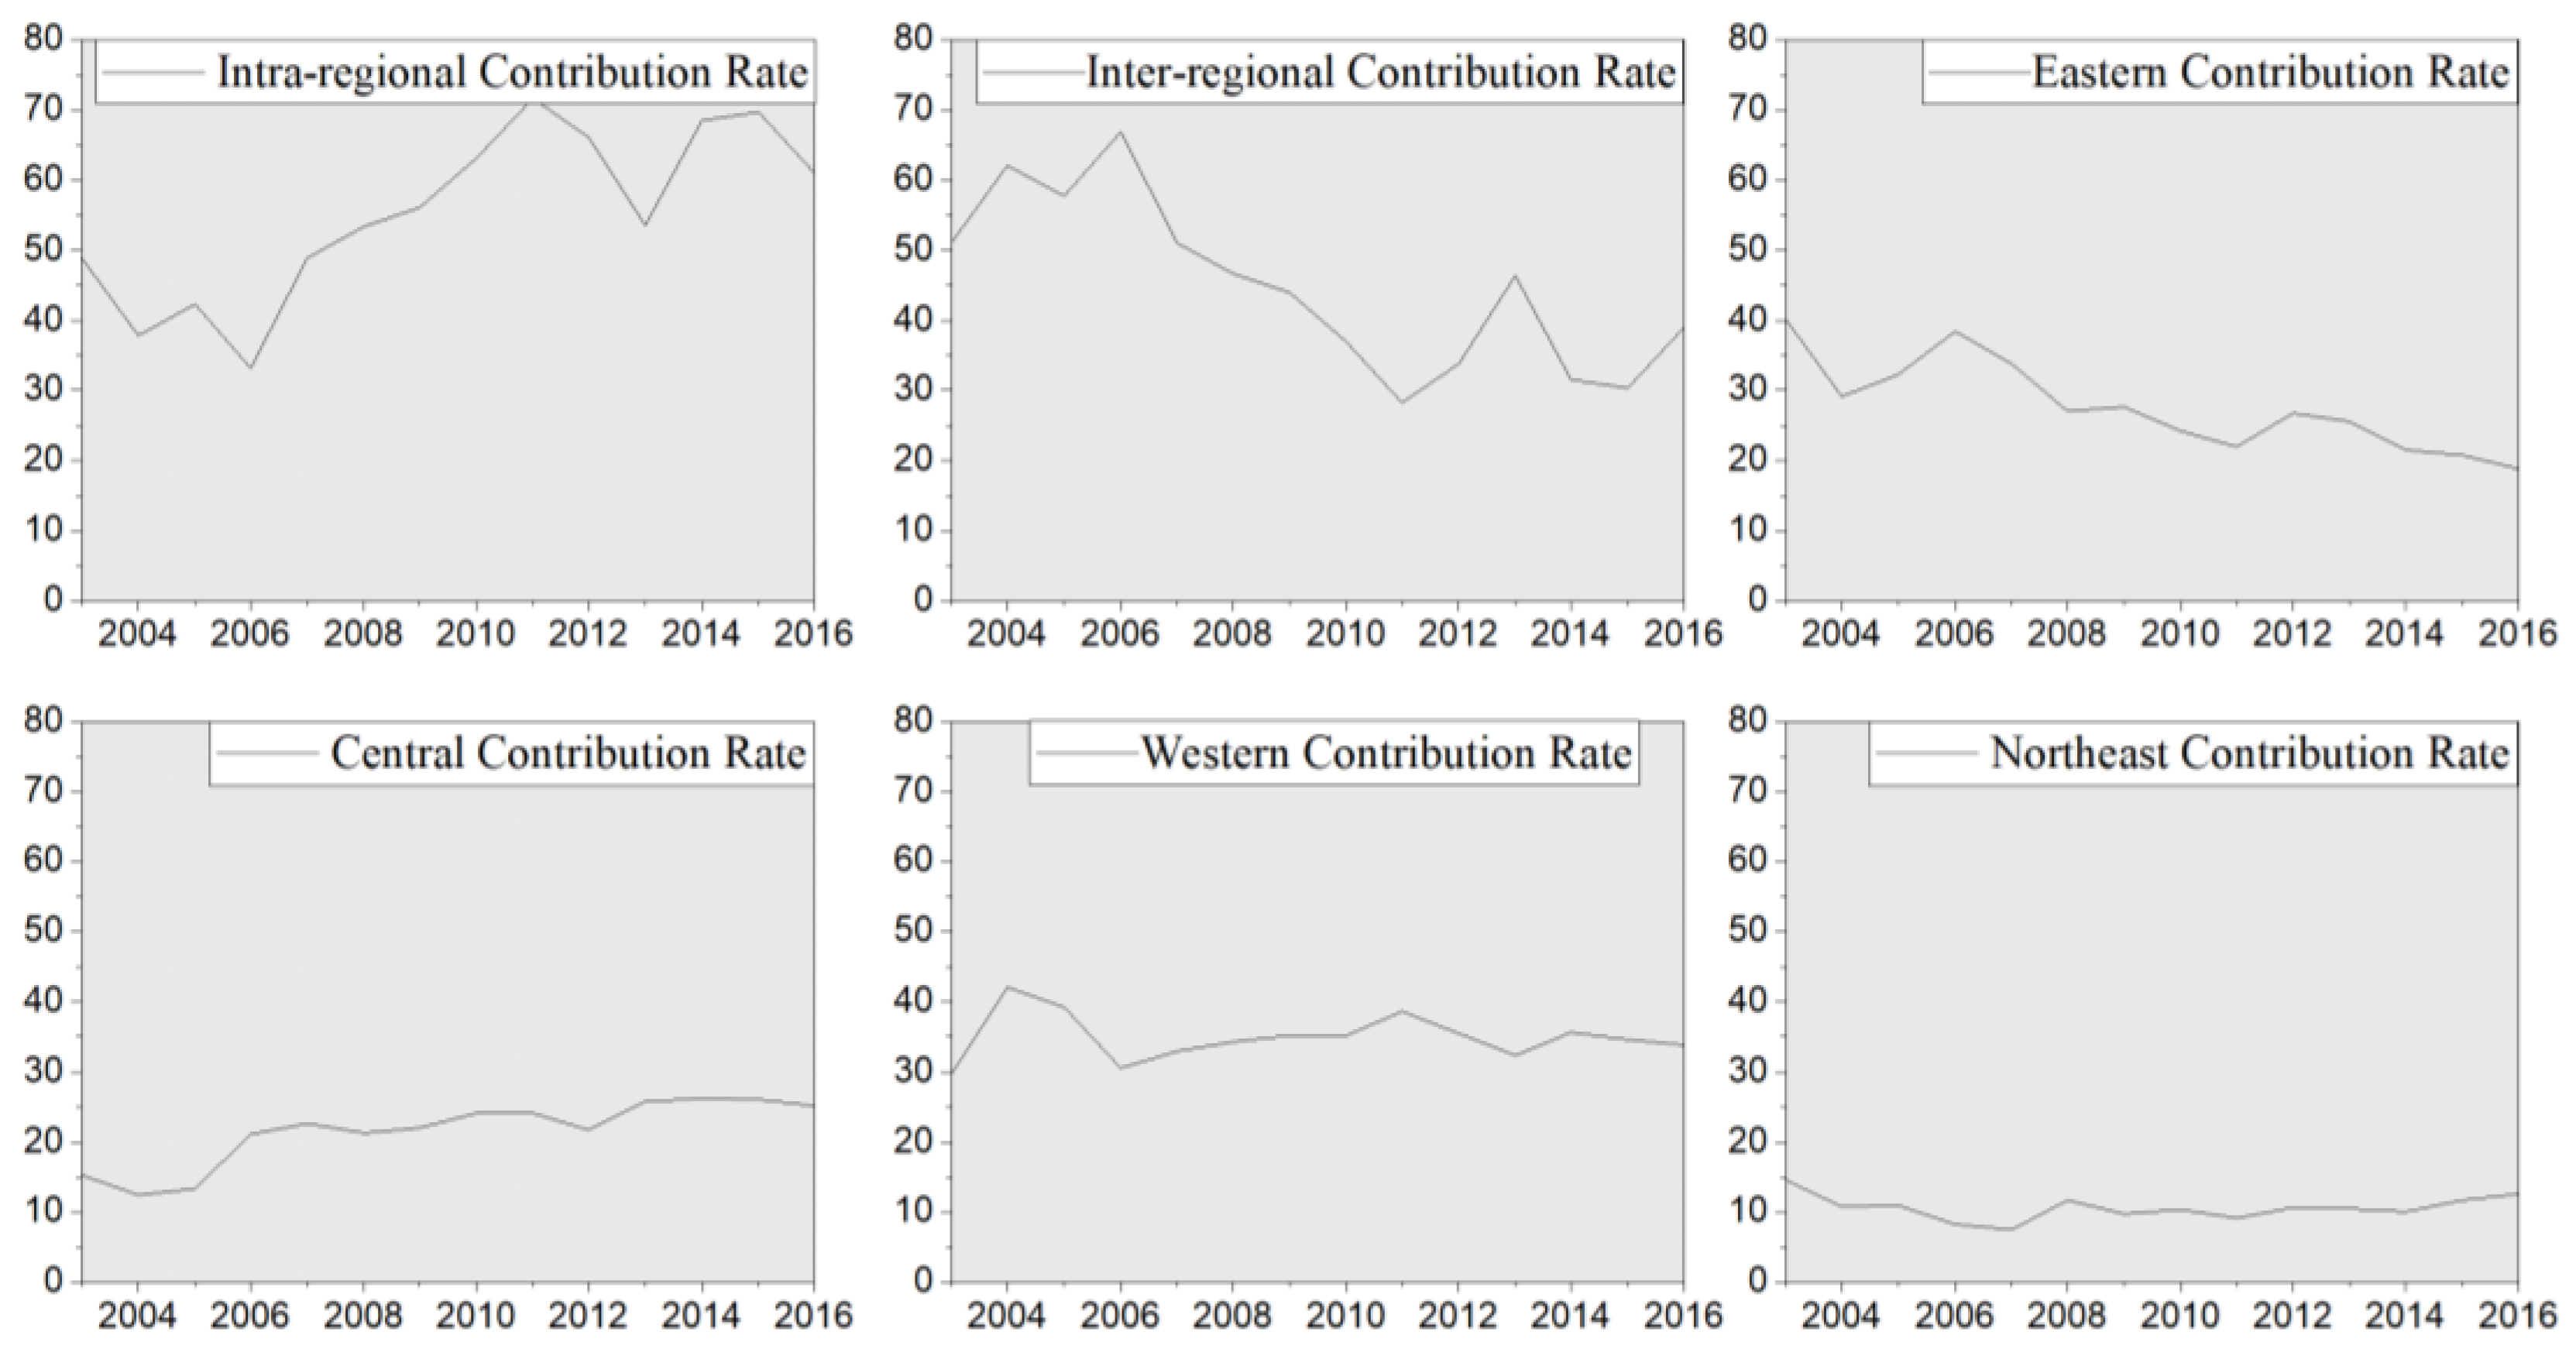
We used the Theil index decomposition method to further examine regional differences in UICE (Figure 7). From 2003–2016, intra-regional differences were consistently the main aspect which influenced the overall variation in UICE in China, explaining to a greater extent the overall variation, while differences between regions were a secondary aspect which influenced the overall variation. The contribution of variation within UICE to overall variation has been declining in the east and northeast regions, from 40.09% and 14.51% in 2003 to 18.79% and 12.57% in 2016, respectively, while the contribution of variation within UICE to overall variation has fluctuated up in the central and west regions, from 15.31% and 29.85% in 2003 to 25.11% and 33.84% respectively. Overall, intra-eastern variation was the main cause of overall UICE variation in China in 2003, while intra-western variation contributed the most to inter-regional variation after 2003.

5.4. The Relationship between UICE and Economic Development in China

We fitted national and regional urban GDP per capita and UICE in 2003 and 2016 (Figure 8). To facilitate the analysis of the changing pattern of UICE in the process of economic development and industrialization based on Chinnery’s stage of industrialization theory, we converted urban GDP per capita in China in 2003 and 2016 to 1970 US dollars based on the exchange rate and the US dollar deflator for that year. As we can see (Figure 8a), nationally, there is a logistic curve relationship between urban GDP per capita and UICE in China. At the early stage of industrialization (US$280–560 GDP per capita), UICE increases rapidly with the growth of GDP per capita; at the middle stage of industrialization (US$560–1120 GDP per capita), the increase rate of UICE slows down with the growth of GDP per capita; at the late stage of industrialization (US$1120–2100 GDP per capita), the increase rate of UICE decreases further and shows a steady change at the high-efficiency level. From Figure 8b–d, it can be seen that the eastern region had the slowest increase rate in UICE with the growth of GDP per capita, and gradually stabilized at a high-efficiency level. The central region had a faster increase rate in UICE with the growth of GDP per capita. The western region had the fastest increase rate in UICE with the growth of GDP per capita, which verifies the logistic trend relationship between them. The special characteristics of state-owned industrial economy in northeast China lead to a slower increase rate in UICE with per-capita GDP growth than in east, central and west regions.

5.5. Influencing Factors of UICE in China

We ran a Tobit panel regression in STATA 12.0 based on Equation (12), and the results are shown in Table 2.

5.5.1. Influencing Factors of China’s UICE

The factors that have a significant positive correlation with UICE at a national level are industrial agglomeration, local fiscal decentralization, level of economic development, technological progress, size of industrial enterprises, and industrial diversification. The higher the industrial agglomeration level, the higher the UICE, which is consistent with the hypothesis of the aforementioned paper and with the results of existing studies [52]. The knowledge spillover effect of industrial scale agglomeration will promote technological progress, which, in turn, will improve the allocation of industrial production factors and increase UICE. In addition, the process of industrial agglomeration will generate higher demands from residents for local environmental quality, forcing the government to adopt stricter environmental regulation policies, which, in turn, will force enterprises to improve UICE [20]. The higher the local fiscal expenditure, the higher the UICE. This is due to the regional development goals and performance evaluation of local governments, which often require a balance between economic growth and environmental protection, which is conducive to UICE enhancement. The higher the level of local technology, the higher the UICE. Technological progress provides a guarantee for industrial transformation and upgrading, and most studies show that technological progress can stimulate economic growth and improve energy utilization, thus reducing carbon emissions and improving carbon emission efficiency [15]. The higher the level of local economic development, the higher the UICE, which is consistent with the findings of the previous study. As well as with economic development, industrial structure upgrading and technological advancement, UICE shows a trend of concerted improvement alongside economic growth. Industry firm scale is significantly positively connected to UICE. The larger industrial enterprises are, the higher the level of human capital of enterprises and the higher the level of factor allocation, which makes UICE higher. The higher the proportion of capital- and technology-intensive industry output value, the higher UICE. These industries consume less resources and energy, allocate production factors more efficiently, and have obvious innovation effects, which help to promote UICE. The higher the level of industrial diversification agglomeration, the higher the UICE, which may be explained by the mutually beneficial complementarity of upstream and downstream industrial firms in terms of carbon reduction knowledge and technology, and the fact that such complementary knowledge is more easily exchanged between diversified firms or economic actors. The findings above contribute to the development of a new approach to carbon reduction and energy efficiency technologies for industry.
The factors with significant negative correlation with UICE are the industry structure, industrial opening-up, local fiscal decentralization, industrial technical advancement, and industrial ownership structure, in a declining sequence. The higher the share of secondary industry output, the lower the UICE, which is related to the fact that China is still in a stage of rapid industrialization and has a large share of resources and energy intensive industries. The structure of industrial ownership is inversely related to the UICE, which is consistent with the findings of Xu, Yang [53], in which state-owned enterprises generally suffer from many problems such as wasteful resources, low operational efficiency, and non-market-oriented behaviors. The higher the proportion of state-owned enterprises, the slower the industrial technological upgrading and the lower the UICE. There is a significant negative correlation between industrial opening-up and UICE, which is inconsistent with the Environmental Halo Hypothesis. This may be because foreign capital in China is more likely to enter high-energy and high-polluting industries, accelerating the scale of related industries, and foreign capital shows a stronger pull effect on the development of related upstream and downstream industries, but a weaker radiating effect on management and technology. Environmental regulation is significantly and negatively correlated with UICE, which may, since the cost of environmental pollution treatment by firms crowds out investments that would otherwise be spent on technological development, negatively impact the improvement of carbon efficiency of industrial firms.

5.5.2. Influencing Factors of UICE in Different Regions

The factors that are significantly and positively correlated with UICE in the east are, in order, local fiscal decentralization, environmental regulation, level of economic development, and industrial agglomeration. The factors that are significantly negatively correlated with UICE are the level of industrialization, industrial ownership structure, industrial openness to the outside world, and industrial technological progress. Compared with the whole country, industrial technological progress in the eastern region is significantly negatively correlated with UICE, which may be due to the higher UICE in the eastern region, for which further upgrading requires more refined patented technologies and requires enterprises to invest in a large number of highly-qualified talents and sufficient financial support; further, the current statistics on patented technologies are city-level data, which do not accurately reflect industrial-specific green patent data.
In the central region, the factors that are significantly positively correlated with UICE are, in descending order, local fiscal decentralization, industrial agglomeration, level of economic development, industrial structure, industrial technological progress, and industrial diversification. The factors that aresignificantly negatively correlated with UICE are the level of industrialization, industrial openness, industrial ownership, environmental regulation, and the size of industrial enterprises, in descending order. Compared to the whole country, the industrial structure of the central region shows a positive correlation with UICE. This is due to the fact that the central region is in a period of industrial transformation and upgrading, and the development of capital- and technology-intensive industries in the region is valued, which are more conducive to UICE than traditional high-pollution and high-emission industries. The direction of action of environmental regulation in the central region is different from that in the eastern region. This is because the level of socio-economic development in the central region is lower than that in the eastern region, the industrial structure has a higher proportion of resource and energy-based industries, and the technological level of industrial production is lower. The strengthening of environmental regulation will increase the pollution treatment costs of industrial enterprises, crowd out productive investment in industrial enterprises, and reduce the investment in technological research and development and innovation of enterprises; therefore, the enhancement of UICE is not utilized.
The factors that are significantly positively correlated with UICE in the West are local fiscal decentralization, industrial agglomeration, level of economic development, industrial technological progress, industrial structure, and industrial diversification. The factors that are significantly negatively correlated with UICE are the level of industrialization, industrial openness to the outside world, environmental regulation, the structure of industrial property rights, and the size of industrial enterprises. Compared to the national scale, the western region is in the middle stage of industrialization and the scale of industrial enterprises is expanding, making it necessary for enterprises to have more capital investment as well as technology, equipment, and management upgrading; however, at the same time, the level of enterprise management and operation may lag behind the scale expansion, which is not conducive to UICE. Affected by the industrial transfer of the eastern region, the proportion of capital and technology-intensive industries in the western region has gradually increased, and the industrial production technology has been improved, which promotes the development of regional UICE.
In the northeast, the factors that are significantly positively correlated with UICE are industrial concentration, local fiscal decentralization, level of economic development, size of industrial enterprises, industrial structure, and industrial diversification. The factors that are significantly negatively correlated with UICE are, in order, the level of industrialization, industrial technological progress, industrial ownership, and environmental regulation. Compared with the whole country, the proportion of local fiscal decentralization is higher in northeast China, and fiscal decentralization constitutes a constraint and incentive for local fiscal behavior, among which fiscal investment in science and technology, division of scientific and technological affairs, local taxation, and land finance have become the key to influence regional innovation and improve UICE. Northeast China is supported by the policy of northeast China’s revitalization, and local fiscal expenditure helps to promote UICE.

6. Conclusions and Policy Implications

6.1. Conclusions

This paper combines data on industrial development at the city level in China and micro data from the database of Chinese industrial enterprises, and constructs a UICE evaluation model based on a hybrid distance model (Epsilon-Based Measure (EBM)) under a production framework that considers economic inputs, capital inputs, energy inputs, economic outputs, and carbon emissions, and analyses the characteristics of the spatial evolution of UICE in China from 2003–2016 and the influencing factors of UICE based on the panel Tobit model. The research results show that:
(1)
UICE in China was driven by low efficiency in 2003, while, in 2016, it was dominated by medium and high efficiency, with a decreasing spatial pattern from “east—central—west—northeast.” UICE in China evolved in a “single core-horizontal expansion” pattern in 2003, and a “double core-vertical improvement” pattern in 2016. This indicates that UICE has significant positive spatial correlation properties, and the spatial correlation tends to increase.
(2)
The evolutionary pattern of China’s UICE model in 2003 can be summarized as a “single core—horizontal expansion” type, with low carbon emission and low efficiency types as the dominant core and a clear horizontal growth in industrial carbon emissions. The evolutionary pattern of UICE in 2016 can be summarized as a “dual core—vertical growth” type, with two cores of low carbon emission medium efficiency types and low carbon emission low efficiency types formed and showing a clear evolutionary characteristics of UICE’s vertical growth.
(3)
China’s UICE was initially at a low level of stability stage, and in 2016, it was in the process of evolving into a high-efficiency steady state, with the eastern and central regions forming a “trailing effect” and the western and northeastern regions forming a “leading effect.” Intra-regional differences have always been the main aspect which affects the overall difference in UICE in China from 2003 to 2016.
(4)
The relationship between economic development and UICE is a logistic curve. In the early stage of industrialization, UICE increases rapidly with the growth of GDP per capita; in the middle stage of industrialization, the improvement rate of UICE slows down with the growth in GDP per capita; in the late stage of industrialization, the improvement rate of UICE decreases further with the growth of GDP per capita and shows a steady change at the high efficiency level. From 2003 to 2016, intra-regional variation has consistently been the main aspect which influences the overall change in UICE in China, explaining it to a greater extent, while inter-regional variation has been a secondary aspect which influences the overall change.
(5)
In China, the factors that are significantly positively correlated with UICE are industrial agglomeration, local fiscal decentralization, level of economic development, technological progress, average size of industrial enterprises, and industrial diversification. Factors that are significantly negatively correlated with UICE are the level of industrialization, the share of output value of state-owned enterprises in total output value, industrial openness, and environmental regulation. The factors that influence UICE differ depending on the stage of industrialization. The impact of the level of economic development on UICE shows an “inverted U-shaped” change. The impact of industrial agglomeration on UICE is positive, and the positive impact tends to diminish as the level of agglomeration increases.

6.2. Policy Implications

According to the logistic curve relationship between economic development and UICE, industrial development and regional economic growth are important methods to promote UICE in the early- and mid-industrialization period; however, as industrialization progresses and economic development enters a “new normal” transition, technical advancement, especially the innovation and application of green technologies, is of great importance in promoting UICE. For the whole country, we should accelerate the greening and decarbonization of traditional industries and industrial industries, strengthen the constraints on energy consumption for environmental purposes, increase the efficiency of resource utilization, proactively promote the renovation of clean manufacturing, and promote the reduction, intensification, and development of greening of heavy industries. It is important to duide foreign investment into advanced manufacturing, energy conservation and environmental protection industries, high-tech industries, and other fields, encouraging foreign invested enterprises to increase green technology research and development, and exploring the establishment of international green and low-carbon technology innovation cooperation platforms. It is also important to improve local environmental protection laws and regulations, establish a sound mechanism for diversified participation in environmental regulation, enhance the capacity of environmental governance through the legal system, market incentives, voluntary participation, and other means, and establish a scientific and effective regionally-differentiated environmental regulatory system.
The eastern regions should focus on strengthening green technological innovation. To implement green technology innovation and research initiatives, a number of technological innovation centers should be built. It is important to accelerate the breakthrough of green and low carbon technology engineering and industrialization, and promote UICE. The central and western regions should accelerate the industrialization process, actively exploit the positive externalities of industrial agglomeration, and promote UICE. The northeast region should continue deepening the transformation of state-owned companies, strengthen the market operation and modern management, enhance the vitality of enterprises, and improve the efficiency of state capital allocation.

Author Contributions

Conceptualization, W.C. and X.L.; methodology, W.C.; software, W.C.; validation, D.W., X.L. and Y.M.; formal analysis, W.C.; investigation, X.L.; resources, X.L.; data curation, W.C.; writing—original draft preparation, W.C.; writing—review and editing, X.L.; visualization, W.C.; supervision, D.W.; project administration, X.L.; funding acquisition, X.L. All authors have read and agreed to the published version of the manuscript.

Funding

This work was partially supported by the National Natural Science Foundation of China (Grant No. 42071148).

Institutional Review Board Statement

Not applicable.

Informed Consent Statement

Not applicable.

Data Availability Statement

The data presented in this study are available on request from the corresponding author.

Acknowledgments

We thank the editors and the anonymous reviewers for their valuable comments and suggestions.

Conflicts of Interest

The authors declare no competing interest.

References

  1. Wang, Y.; Xu, X.; Zhu, Q. Carbon emission reduction decisions of supply chain members under cap-and-trade regulations: A differential game analysis. Comput. Ind. Eng. 2021, 162, 107711. [Google Scholar]
  2. Zhu, R.; Zhao, R.; Sun, J.; Xiao, L.; Jiao, S.; Chuai, X.; Zhang, L.; Yang, Q. Temporospatial pattern of carbon emission efficiency of China’s energy-intensive industries and its policy implications. J. Clean. Prod. 2021, 286, 125507. [Google Scholar] [CrossRef]
  3. Zhou, J.; Zhang, Z.; Xu, X.; Chang, D. Does the transformation of resource-dependent cities promote the realization of the carbon-peaking goal? An analysis based on typical resource-dependent city clusters in China. J. Clean. Prod. 2022, 365, 132731. [Google Scholar] [CrossRef]
  4. Li, X.F.; Peng, R.; Yang, M.X. Analysis of Industrial Carbon Emissions Assessment and Spatial Distribution. Adv. Mater. Res. 2014, 2745, 1073–1076. [Google Scholar] [CrossRef]
  5. Chen, L.; Xu, L.; Cai, Y.; Yang, Z. Spatiotemporal patterns of industrial carbon emissions at the city level. Resour. Conserv. Recycl. 2021, 169, 105499. [Google Scholar] [CrossRef]
  6. Outline of the 14th Five-Year Plan (2021–2025) for National Economic and Social Development and Vision 2035 of the People’s Republic of China, 2021. Available online: http://www.gov.cn/xinwen/2021-03/13/content_5592681.htm. (accessed on 11 December 2022).
  7. The 14th Five-Year Plan for Green Development of Industry. 2021. Available online: http://www.gov.cn/zhengce/zhengceku/2021-12/03/content_5655701.htm (accessed on 11 December 2022).
  8. Agras, J.; Chapman, D. A dynamic approach to the Environmental Kuznets Curve hypothesis. Ecol. Econ. 1999, 28, 267–277. [Google Scholar] [CrossRef]
  9. Gao, M.; Yang, H.; Xiao, Q.; Goh, H. A novel method for carbon emission forecasting based on Gompertz’s law and fractional grey model: Evidence from American industrial sector. Renew. Energy 2022, 181, 803–819. [Google Scholar] [CrossRef]
  10. Williams, J.H.; Jones, R.A.; Haley, B.; Kwok, G.; Hargreaves, J.; Farbes, J.; Torn, M.S. Carbon-Neutral Pathways for the United States. AGU Adv. 2021, 2, e2020AV000284. [Google Scholar] [CrossRef]
  11. Sueyoshi, T.; Goto, M. Environmental assessment for corporate sustainability by resource utilization and technology innovation: DEA radial measurement on Japanese industrial sectors. Energy Econ. 2014, 46, 295–307. [Google Scholar] [CrossRef]
  12. Jung, T.Y.; Park, T.S. Structural Change of the Manufacturing Sector in Korea: Measurement of Real Energy Intensity and CO2 Emissions. Mitig. Adapt. Strat. Glob. Chang. 2000, 5, 221–238. [Google Scholar] [CrossRef]
  13. Dai, S.; Qian, Y.; He, W.; Wang, C.; Shi, T. The spatial spillover effect of China’s carbon emissions trading policy on industrial carbon intensity: Evidence from a spatial difference-in-difference method. Struct. Change Econ. Dyn. 2022, 63, 139–149. [Google Scholar]
  14. Wang, Q.; Han, X.; Li, R. Does technical progress curb India’s carbon emissions? A novel approach of combining extended index decomposition analysis and production-theoretical decomposition analysis. J. Environ. Manag. 2022, 310, 114720. [Google Scholar] [CrossRef]
  15. Yu, X.N.; Yang, Z. The Impact of Digital Economy on Industrial Carbon Emission Efficiency: Evidence from Chinese Provincial Data. Math. Probl. Eng. 2022, 2022, 6583809. [Google Scholar] [CrossRef]
  16. Lei, H.J.; Zhang, Q.L.; Li, C.J.; Xi, B.D.; Xia, X.F. Factor Analysis on the Industrial Environmental Efficiency and Energy Utilization Efficiency of China by DEA Method. Appl. Mech. Mater. 2012, 209–211, 1620–1626. [Google Scholar] [CrossRef]
  17. Li, J.; Ding, J.; Zhang, Y.; Li, S. Study on spatial-temporal characteristics and influencing factors of urban environmental resource efficiency in the Yangtze River Basin of China. Front. Environ. Sci. 2022, 1552. [Google Scholar] [CrossRef]
  18. Zhou, R.; Li, S. A Study on the Development of Low-carbon Economy in Shandong Province-Based on Empirical Analysis on the Influence Factor of Carbon Emission. Energy Procedia 2011, 5, 2152–2159. [Google Scholar] [CrossRef] [Green Version]
  19. Lu, Q.; Yang, H.; Huang, X.; Chuai, X.; Wu, C. Multi-sectoral decomposition in decoupling industrial growth from carbon emissions in the developed Jiangsu Province, China. Energy 2015, 82, 414–425. [Google Scholar] [CrossRef]
  20. Xepapadeas, A. Chapter 23 Economic growth and the environment. In Handbook of Environmental Economics; Elsevier: Amsterdam, The Netherlands, 2005; Volume 3, pp. 1219–1271. [Google Scholar] [CrossRef]
  21. Zhang, H.; Feng, C.; Zhou, X. Going carbon-neutral in China: Does the low-carbon city pilot policy improve carbon emission efficiency? Sustain. Prod. Consum. 2022, 33, 312–329. [Google Scholar] [CrossRef]
  22. Cheng, Z.; Li, L.; Liu, J.; Zhang, H. Total-factor carbon emission efficiency of China′s provincial industrial sector and its dynamic evolution. Renew. Sustain. Energy Rev. 2018, 94, 330–339. [Google Scholar] [CrossRef]
  23. Jiang, H.; Yin, J.; Qiu, Y.; Zhang, B.; Ding, Y.; Xia, R. Industrial Carbon Emission Efficiency of Cities in the Pearl River Basin: Spatiotemporal Dynamics and Driving Forces. Land 2022, 11, 1129. [Google Scholar] [CrossRef]
  24. Wang, L.; Wang, H.; Cao, Z.; He, Y.; Dong, Z.; Wang, S. Can industrial intellectualization reduce carbon emissions?—Empirical evidence from the perspective of carbon total factor productivity in China. Technol. Forecast. Soc. Change 2022, 184, 121969. [Google Scholar] [CrossRef]
  25. Zhang, Y.; Wang, L.; Tang, Z.; Zhang, K.; Wang, T. Spatial effects of urban expansion on air pollution and eco-efficiency: Evidence from multisource remote sensing and statistical data in China. J. Clean. Prod. 2022, 367, 132973. [Google Scholar] [CrossRef]
  26. Sun, J.; Du, T.; Sun, W.; Na, H.; He, J.; Qiu, Z.; Yuan, Y.; Li, Y. An evaluation of greenhouse gas emission efficiency in China′s industry based on SFA. Sci. Total Environ. 2019, 690, 1190–1202. [Google Scholar] [CrossRef] [PubMed]
  27. Shi, Y.; Xu, Y. Evaluation of China’s pilot low-carbon city program: A perspective of industrial carbon emission efficiency. Atmos. Pollut. Res. 2022, 13, 101446. [Google Scholar] [CrossRef]
  28. Tang, L.; Xue, X.; Jia, M.; Jing, H.; Wang, T.; Zhen, R.; Huang, M.; Tian, J.; Guo, J.; Li, L.; et al. Iron and steel industry emissions and contribution to the air quality in China. Atmospheric Environ. 2020, 237, 117668. [Google Scholar] [CrossRef]
  29. Ju, Y.; Fujikawa, K. Revealing the impact of a projected emission trading scheme on the production technology upgrading in the cement industry in China: An LCA-RCOT model. Resour. Conserv. Recycl. X 2019, 4, 100019. [Google Scholar] [CrossRef]
  30. Lin, B.; Wang, M. Dynamic analysis of carbon dioxide emissions in China′s petroleum refining and coking industry. Sci. Total Environ. 2019, 671, 937–947. [Google Scholar] [CrossRef]
  31. Zhang, Z.; Schoengold, K. Carbon emissions control policies in China’s power generation sector. China Agric. Econ. Rev. 2011, 3. [Google Scholar] [CrossRef]
  32. Li, A.; Hu, M.; Sun, C.; Li, Z. Optimal CO2 abatement pathway with induced technological progress for chinese coal-fired power industry. Energy Sustain. Dev. 2017, 36, 55–63. [Google Scholar] [CrossRef]
  33. Garver, G.; Podhora, A. Transboundary environmental impact assessment as part of the North American Agreement on Environmental Cooperation. Impact Assess. Proj. Apprais. 2008, 26, 253–263. [Google Scholar] [CrossRef] [Green Version]
  34. Grossman, G.M.; Krueger, A.B. Environmental Impacts of a North American Free Trade Agreement. CEPR Discuss. Pap. 1992, 8, 223–250. [Google Scholar]
  35. Lu, Y.; Li, M. Industrial Carbon Emission Efficiency in the Yangtze River Economic Belt and Its Influencing Factors. Int. J. Des. Nat. Ecodynamics 2020, 15, 25–32. [Google Scholar] [CrossRef]
  36. Dong, Y.; Jin, G.; Deng, X. Dynamic interactive effects of urban land-use efficiency, industrial transformation, and carbon emissions. J. Clean. Prod. 2020, 270, 122547. [Google Scholar] [CrossRef]
  37. You, J.; Zhang, W. How heterogeneous technological progress promotes industrial structure upgrading and industrial carbon efficiency? Evidence from China’s industries. Energy 2022, 247, 123386. [Google Scholar] [CrossRef]
  38. Feng, R.; Lin, P.; Hou, C.; Jia, S. Study of the Effect of China’s Emissions Trading Scheme on Promoting Regional Industrial Carbon Emission Reduction. Front. Environ. Sci. 2022, 10, 947925. [Google Scholar] [CrossRef]
  39. Kaya, Y. Impact of Carbon Dioxide Emission Control on GNP Growth: Interpretation of Proposed Scenarios IPCC Energy and Industry Subgroup, Response Strategies Working Group. 1990. Available online: https://cir.nii.ac.jp/crid/1570291225678384256#citations_container (accessed on 15 December 2022).
  40. Yang, G.; Zhang, F.; Zhang, F.; Ma, D.; Gao, L.; Chen, Y.; Luo, Y.; Yang, Q. Spatiotemporal changes in efficiency and influencing factors of China’s industrial carbon emissions. Environ. Sci. Pollut. Res. 2021, 28, 36288–36302. [Google Scholar] [CrossRef]
  41. Wang, Z.; Zhao, Z.; Wang, C. Random forest analysis of factors affecting urban carbon emissions in cities within the Yangtze River Economic Belt. PLoS ONE 2021, 16, e0252337. [Google Scholar]
  42. Tone, K. A slacks-based measure of efficiency in data envelopment analysis. Eur. J. Oper. Res. 2001, 130, 498–509. [Google Scholar] [CrossRef] [Green Version]
  43. Tone, K.; Tsutsui, M. An epsilon-based measure of efficiency in DEA—A third pole of technical efficiency. Eur. J. Oper. Res. 2010, 207, 1554–1563. [Google Scholar] [CrossRef]
  44. Zhou, Z.; Cao, L.; Zhao, K.; Li, D.; Ding, C. Spatio-Temporal Effects of Multi-Dimensional Urbanization on Carbon Emission Efficiency: Analysis Based on Panel Data of 283 Cities in China. Int. J. Environ. Res. Public Health 2021, 18, 12712. [Google Scholar] [CrossRef]
  45. Chen, L.; Liu, Y.; Gao, Y.; Wang, J. Carbon Emission Trading Policy and Carbon Emission Efficiency: An Empirical Analysis of China’s Prefecture-Level Cities. Front. Energy Res. 2021, 844. [Google Scholar] [CrossRef]
  46. Tao, F.; Li, L.; Xia, X.H. Industry Efficiency and Total Factor Productivity Growth under Resources and Environmental Constraint in China. Sci. World J. 2012, 2012, 310407. [Google Scholar] [CrossRef] [PubMed] [Green Version]
  47. Shen, J.; Wei, Y.D.; Yang, Z. The impact of environmental regulations on the location of pollution-intensive industries in China. J. Clean. Prod. 2017, 148, 785–794. [Google Scholar] [CrossRef]
  48. Cai, H.; Liu, Q. Competition and Corporate Tax Avoidance: Evidence from Chinese Industrial Firms. Econ. J. 2009, 119, 764–795. [Google Scholar] [CrossRef]
  49. Wang, J.; Sun, K.; Ni, J.; Xie, D. Evaluation and Factor Analysis of Industrial Carbon Emission Efficiency Based on “Green-Technology Efficiency”—The Case of Yangtze River Basin, China. Land 2021, 10, 1408. [Google Scholar] [CrossRef]
  50. Gao, P.; Yue, S.; Chen, H. Carbon Emission Efficiency of China’s Industry Sectors: From the Perspective of Embodied Carbon Emissions. J. Clean. Prod. 2020, 283, 124655. [Google Scholar] [CrossRef]
  51. Li, Y.; Chiu, Y.-H.; Lin, T.-Y. Energy and Environmental Efficiency in Different Chinese Regions. Sustainability 2019, 11, 1216. [Google Scholar] [CrossRef] [Green Version]
  52. Cai, Y.; Hu, Z. Industrial agglomeration and industrial SO2 emissions in China’s 285 cities: Evidence from multiple agglomeration types. J. Clean. Prod. 2022, 353, 131675. [Google Scholar] [CrossRef]
  53. Xu, X.; Yang, G.; Tan, Y.; Zhuang, Q.; Tang, X.; Zhao, K.; Wang, S. Factors influencing industrial carbon emissions and strategies for carbon mitigation in the Yangtze River Delta of China. J. Clean. Prod. 2017, 142, 3607–3616. [Google Scholar] [CrossRef]
Figure 1. Theoretical framework of influencing factors of China’s UICE.
Land 12 00026 g001
Figure 2. Study Area. Note: made on the Chinese Ministry of Natural Resources Standard Map Service website GS (2019) 1823, no changes were made to the boundaries of the base map.
Land 12 00026 g002
Figure 3. Spatial distribution of China’s UICE in 2003 and 2016.
Land 12 00026 g003
Figure 4. Evolution of the UICE local spatial association pattern.
Land 12 00026 g004
Figure 5. The spatial evolution of the types of UICE in China in 2003 and 2016.
Land 12 00026 g005
Figure 6. Box chart of UICE for China’s regions in 2003 and 2016.
Land 12 00026 g006
Figure 7. The decomposition contribution rate of Theil Index of UICE in China’s different regions from 2003 to 2016.
Land 12 00026 g007
Figure 8. Fitting curves of UICE and per-capita GDP in China from 2003 to 2016.
Land 12 00026 g008
Table 1. Variable Explanation Table.
Variable NameCalculationUnitSymbol
Economic development levelGDP per capitaRmb/personUGP
Industrialization levelSecondary industry value added as a proportion of GDP%UIC
Environmental regulationWeighted value of industrial SO2, soot, and dust treatment rate in city%ER
Local fiscal decentralizationProportion of total fiscal expenditure in GDP%DLF
Industrial enterprise scaleAverage size of industrial enterprises10,000/eaISC
Industrial structureProportion of capital- and technology-intensive industrial output value in total industrial output value%ST
Industrial Technical advancementProportion of industrial patent applications in city’s patent applications%ITP
Industrial opening levelProportion of foreign-invested industrial output value in total industrial output value%OI
Industrial agglomerationIndustrial agglomeration using the city’s industrial location quotient/IA
Industrial diversificationHerfindahl coefficient/DIC
Industrial OwnershipShare of output of state-owned enterprises in total industrial output%IO
Table 2. Regression model results of influencing factors of urban industrial carbon efficiency.
NationalEastern RegionCentral RegionWestern RegionNortheast Region
UGP0.0999 ***
(18.44)
0.129 ***
(12.69)
0.131 ***
(15.30)
0.131 ***
(15.30)
0.0893 ***
(6.67)
UIC−0.443 ***
(−14.14)
−0.632 ***
(−9.35)
−0.590 ***
(−12.65)
−0.590 ***
(−12.65)
−0.378 ***
(−5.93)
ER−0.0293
(−1.81)
0.156 ***
(4.94)
−0.139 ***
(−6.44)
−0.139 ***
(−6.44)
−0.0454
(−1.12)
DLF0.201 ***
(6.89)
0.550 ***
(5.18)
0.608 ***
(9.55)
0.608 ***
(9.55)
0.162 *
(1.99)
ISC0.0277 ***
(5.58)
0.0168
(1.74)
−0.0327 ***
(−3.59)
−0.0327 ***
(−3.59)
0.0216
(1.93)
ST−0.00302
(−1.22)
0.00352
(0.67)
0.0267 ***
(6.69)
0.0267 ***
(6.69)
0.00898 *
(2.12)
ITP0.0307 *
(2.01)
−0.129 ***
(−4.38)
0.0470 *
(2.45)
0.0470 *
(2.45)
−0.160 **
(−3.23)
OI−0.0386
(−1.41)
−0.178 ***
(−4.40)
−0.273 ***
(−5.75)
−0.273 ***
(−5.75)
−0.00653
(−0.12)
IA0.186 ***
(19.29)
0.106 ***
(6.14)
0.230 ***
(16.29)
0.230 ***
(16.29)
0.232 ***
(11.29)
DIC0.00462 ***
(6.19)
−0.00113
(−0.87)
0.00520 ***
(5.88
0.00520 ***
(5.88)
0.00351 *
(2.28)
IO−0.247 ***
(−19.93)
−0.370 ***
(−11.96)
−0.171 ***
(−9.18)
−0.171 ***
(−9.18)
−0.123 ***
(−4.65)
cons−0.707 ***
(−18.82)
−0.851 ***
(−10.51)
−0.945 ***
(−17.53)
−0.945 ***
(−17.53)
−0.885 ***
(−11.89)
Note: *, ** and *** represent significant at the 10%, 5% and 1% levels respectively.
Disclaimer/Publisher’s Note: The statements, opinions and data contained in all publications are solely those of the individual author(s) and contributor(s) and not of MDPI and/or the editor(s). MDPI and/or the editor(s) disclaim responsibility for any injury to people or property resulting from any ideas, methods, instructions or products referred to in the content.