Article

Scrutinizing Urbanization in Kathmandu Using Google Earth Engine Together with Proximity-Based Scenario Modelling

1
Youth Alliance for Environment, Baluwatar, Kathmandu 44600, Nepal
2
Research and Development Centre, Durbar Marg, Kathmandu 44600, Nepal
3
Center for International Forestry Research (CIFOR), Bogor 16115, Indonesia
4
School of Ecosystem and Forest Science, University of Melbourne, Parkville, VIC 3010, Australia
*
Author to whom correspondence should be addressed.
Land 2023, 12(1), 25; https://doi.org/10.3390/land12010025
Submission received: 30 November 2022 / Revised: 18 December 2022 / Accepted: 19 December 2022 / Published: 22 December 2022

Abstract

:
‘Urbanization’ refers to the expansion of built-up areas caused by several factors. This study focuses on the urbanization process in Kathmandu, the capital of Nepal. Supervised classification was conducted in Google Earth Engine by using Landsat data for years 2001, 2011 and 2021. The random forest classifier with 250 trees was used for classification to generate land-cover map. A land-cover map of 2021 was used as base map in the InVEST tool for scenario modelling. An accuracy assessment with 20% of sample points was conducted with different metrics, such as overall accuracy, kappa coefficient, producer accuracy, and consumer accuracy. The results show an increment of built-up areas by around 67 km2 over 20 years in a centrifugal pattern from the core district, converting agricultural and forest land. ‘Forest’ is still dominant land-use class, with an area of 177.97 km2. Agricultural land was highly converted to urban area. The overall accuracy of this classification process ranged 0.96–1.00 for different years. The scenario modelling further elaborated an amiability of drastic shift in land-use classes to ‘built-up’, especially forest and agriculture, by around 33 km2 and 66 km2, respectively. This study recommends the consideration of ecological approaches during the planning process.

1. Introduction

Urbanization, from a demographic outlook, implies an increase in population concentration in urban areas, whereas environmental and geographical aspects are often linked to the development and increase in urban land use [1,2,3]. Urbanization influences the spatial disparity of the economy, mainly in poor, developing countries with limited industrial base [4]. With the shift from rural to urban, an agriculture-based economy is superseded by an industrial service-based economy [5]. Concomitantly, environmental impact owing to unorganized urbanization is colossal and impossible to overlook [6]. Urbanization, with its emphasis on technological innovation, trade, and higher emissions, thwarts achievement of a balanced environment, rather promoting diverse sources of pollution [7].
Over the years, urbanization in developing countries has grown; however, in the immature urban system of Nepal, urbanization is characterized as a concentration of production and economic activities, heavy exposure to pollution, and poorly functioning institutions and human resources for proper urban management [8,9]. The development of resilient infrastructure, technological innovations, and the sustainable management of urban areas are listed as global targets [10]. Countries must consent to development; however, different international agreements [11] often create an impasse in Nepal for conserving the environment and establishing sustainability. Understanding the pattern of urbanization, more specifically, the spatial changes in development and intensification of built-up areas, is an important consideration for effectively managing urbanization to cause minimal, negative environmental and economic impact.
Despite being among the least urbanized countries in the world, Nepal was ranked within the top ten fastest urbanizing countries, with a rate of 2.9% during 1990-2018 [12]. During the period of 2018–2050, Nepal is projected to have the second-highest urbanization rate in the world [12]. Kathmandu, the capital, accounts for the most urbanization owing to socio-economic processes such as fastest population growth fueled by internal migration [13]. The Kathmandu Valley is the hub, with an almost 97% level of urbanization [14]. The centralized development of infrastructure and a complicated and difficult system for private land-pooling has triggered unplanned urbanization in Kathmandu [15].
Urban land-management strategies developed by the Government of Nepal include land-use controls with infrastructural and environmental thresholds [14]. Land-use policy [16] is enshrined in an aegis document that identifies unmanaged urbanization as an ongoing challenge for the intensive and optimum utilization of land to address various social and economic issues. The classification of land use in zones and sub-zones as determined by the policy creates a prospect of the proper management of arable land, sustainable urbanization, healthy settlements, a balance between development and the environment, and promotion of a green belt [16]. An analysis of the pattern of urbanization would serve as a basis for scrutinizing the efficacy of policies during their execution. Despite the huge urbanization pattern in the Kathmandu district, only some studies have been conducted such as [13,17,18,19]; some focused on the impact of urbanization on water sources and climate [20,21,22]. An update of the spatiotemporal changes in urban areas and other land-use classes can help land-use planners better contemplate ecological approaches in the urban planning process.
Remotely sensed data is a convenient and important data source for land-cover classification and analysis of spatiotemporal changes [23]. Landsat, the longest continuous Earth imaging program, provides an image with a spatial resolution of 30 m and temporal resolution of 16 days alongside a historical image over 30 years [24]. The analysis of land-cover change over a long period requires a large set of data. For efficient classification, it is necessary to obtain cloud-free images through cloud masking, and several corrections, such as atmospheric and radiometric, are required to remove noise owing to sensors [25,26]. It is time-consuming and tedious to create an image composite with large sets of data, selection of cloud-free images and image pre-processing and normalization using traditional processing tools [27]. For our analysis of the trend in Kathmandu over 20 years, more than 100 Landsat images would be required. Google Earth Engine (GEE), a cloud-based computing platform that provides a vast catalogue of satellite imageries and geospatial datasets, has made the analysis of land change rapid and accurate [28]. Further, land cover is often associated with different ecosystem services and habitat quality. The scenario generator describes a possible future and reflects upon important changes that may be addressed to avoid unwanted damage to the services from each land-use class [29]. Integrated Valuation of Ecosystem Services and Trade-offs (InVEST) is an open-source tool that maps and valuates the services from natural sources and provides an environment for generating different future scenarios [29].
This study integrates convenient remote sensing methods to understand the change in land use of Kathmandu over years and to identify the pattern of urbanization. The effect of land-use change on environmental inequalities like air and water quality and climate have been demonstrated in different parts of the world [30,31,32]. It is necessary to clearly understand the dynamics of land use to formulate plans and policies for sustainable urban management. Moreover, each land-use class is associated with several ecological services. Thus, to effectively maximize the services alongside maintaining economic strength in the capital of Nepal, the analysis of land-use change, its pattern and future possibilities is necessary which can serve as a basis for the administration to effectively plan the urban city.
There are several studies on land cover change that use machine learning for spatial analysis. Different kinds of classifiers are used including support vector machine, K-nearest neighbours, single decision tree, etc. [33,34]. This study used random classifier owing to its better performance [35]. This study used supervised classification for land-use analysis. ‘Supervised classification’ is a human-guided technique wherein the spectral domain is segmented into regions that can be associated with groundcover classes of interest [36,37]. The main objective of this study is to (1) analyse land-cover change in Kathmandu over 20 years; (2) determine the extension of built-up areas; and (3) generate scenario-based land-use maps for future use.

2. Materials and Methods

2.1. Study Area

This study was conducted in Kathmandu district, the capital of Nepal: 27°27′ E–27°49′ E longitude and 85°10′ N–85°32′ N latitude in Bagmati Province (Figure 1) [18]. Covering a total area of 413.60 km2, Kathmandu stands at an elevation of 1400 m above sea level [38]. Kathmandu district has both sub-tropical and temperate climates and is profoundly influenced by the South Asian monsoon [39], which extends from June to September, with precipitation during these months providing around 80% of total annual precipitation [18]. However, the average annual precipitation of this district is recorded as around 1502 mm [40]. The average mean temperature is 19.3 °C, with a maximum annual average of 26 °C and a minimum annual average of 12.5 °C [40]. Owing to the varying climatic conditions, Kathmandu features a wide variety of vegetation, including temperate mountain oak forest, mixed blue pine forest, low-temperature oak forest, east Himalayan oak–laurel forest, chir pine, and broadleaved forest [41].
Kathmandu faces the enduring challenge of weakly regulated, often unplanned, and poorly managed development. The total population of the district is 2,017,532, with a density of 5108 per km2 [42]. The population is growing at the rate of 1.4% per year [42]; however, rural-urban migration adds to population pressures in the capital.

2.2. Data Used

This study used satellite imagery of Landsat 8 and Landsat 5 available as the image collection in the GEE platform and the boundary shapefile of the Kathmandu district (Table 1). The land-cover analysis consisted of pre-processing, normalization, training of the classifier, land-cover classification, and the detection of the change.

2.3. Data Processing

2.3.1. Image Pre-Processing

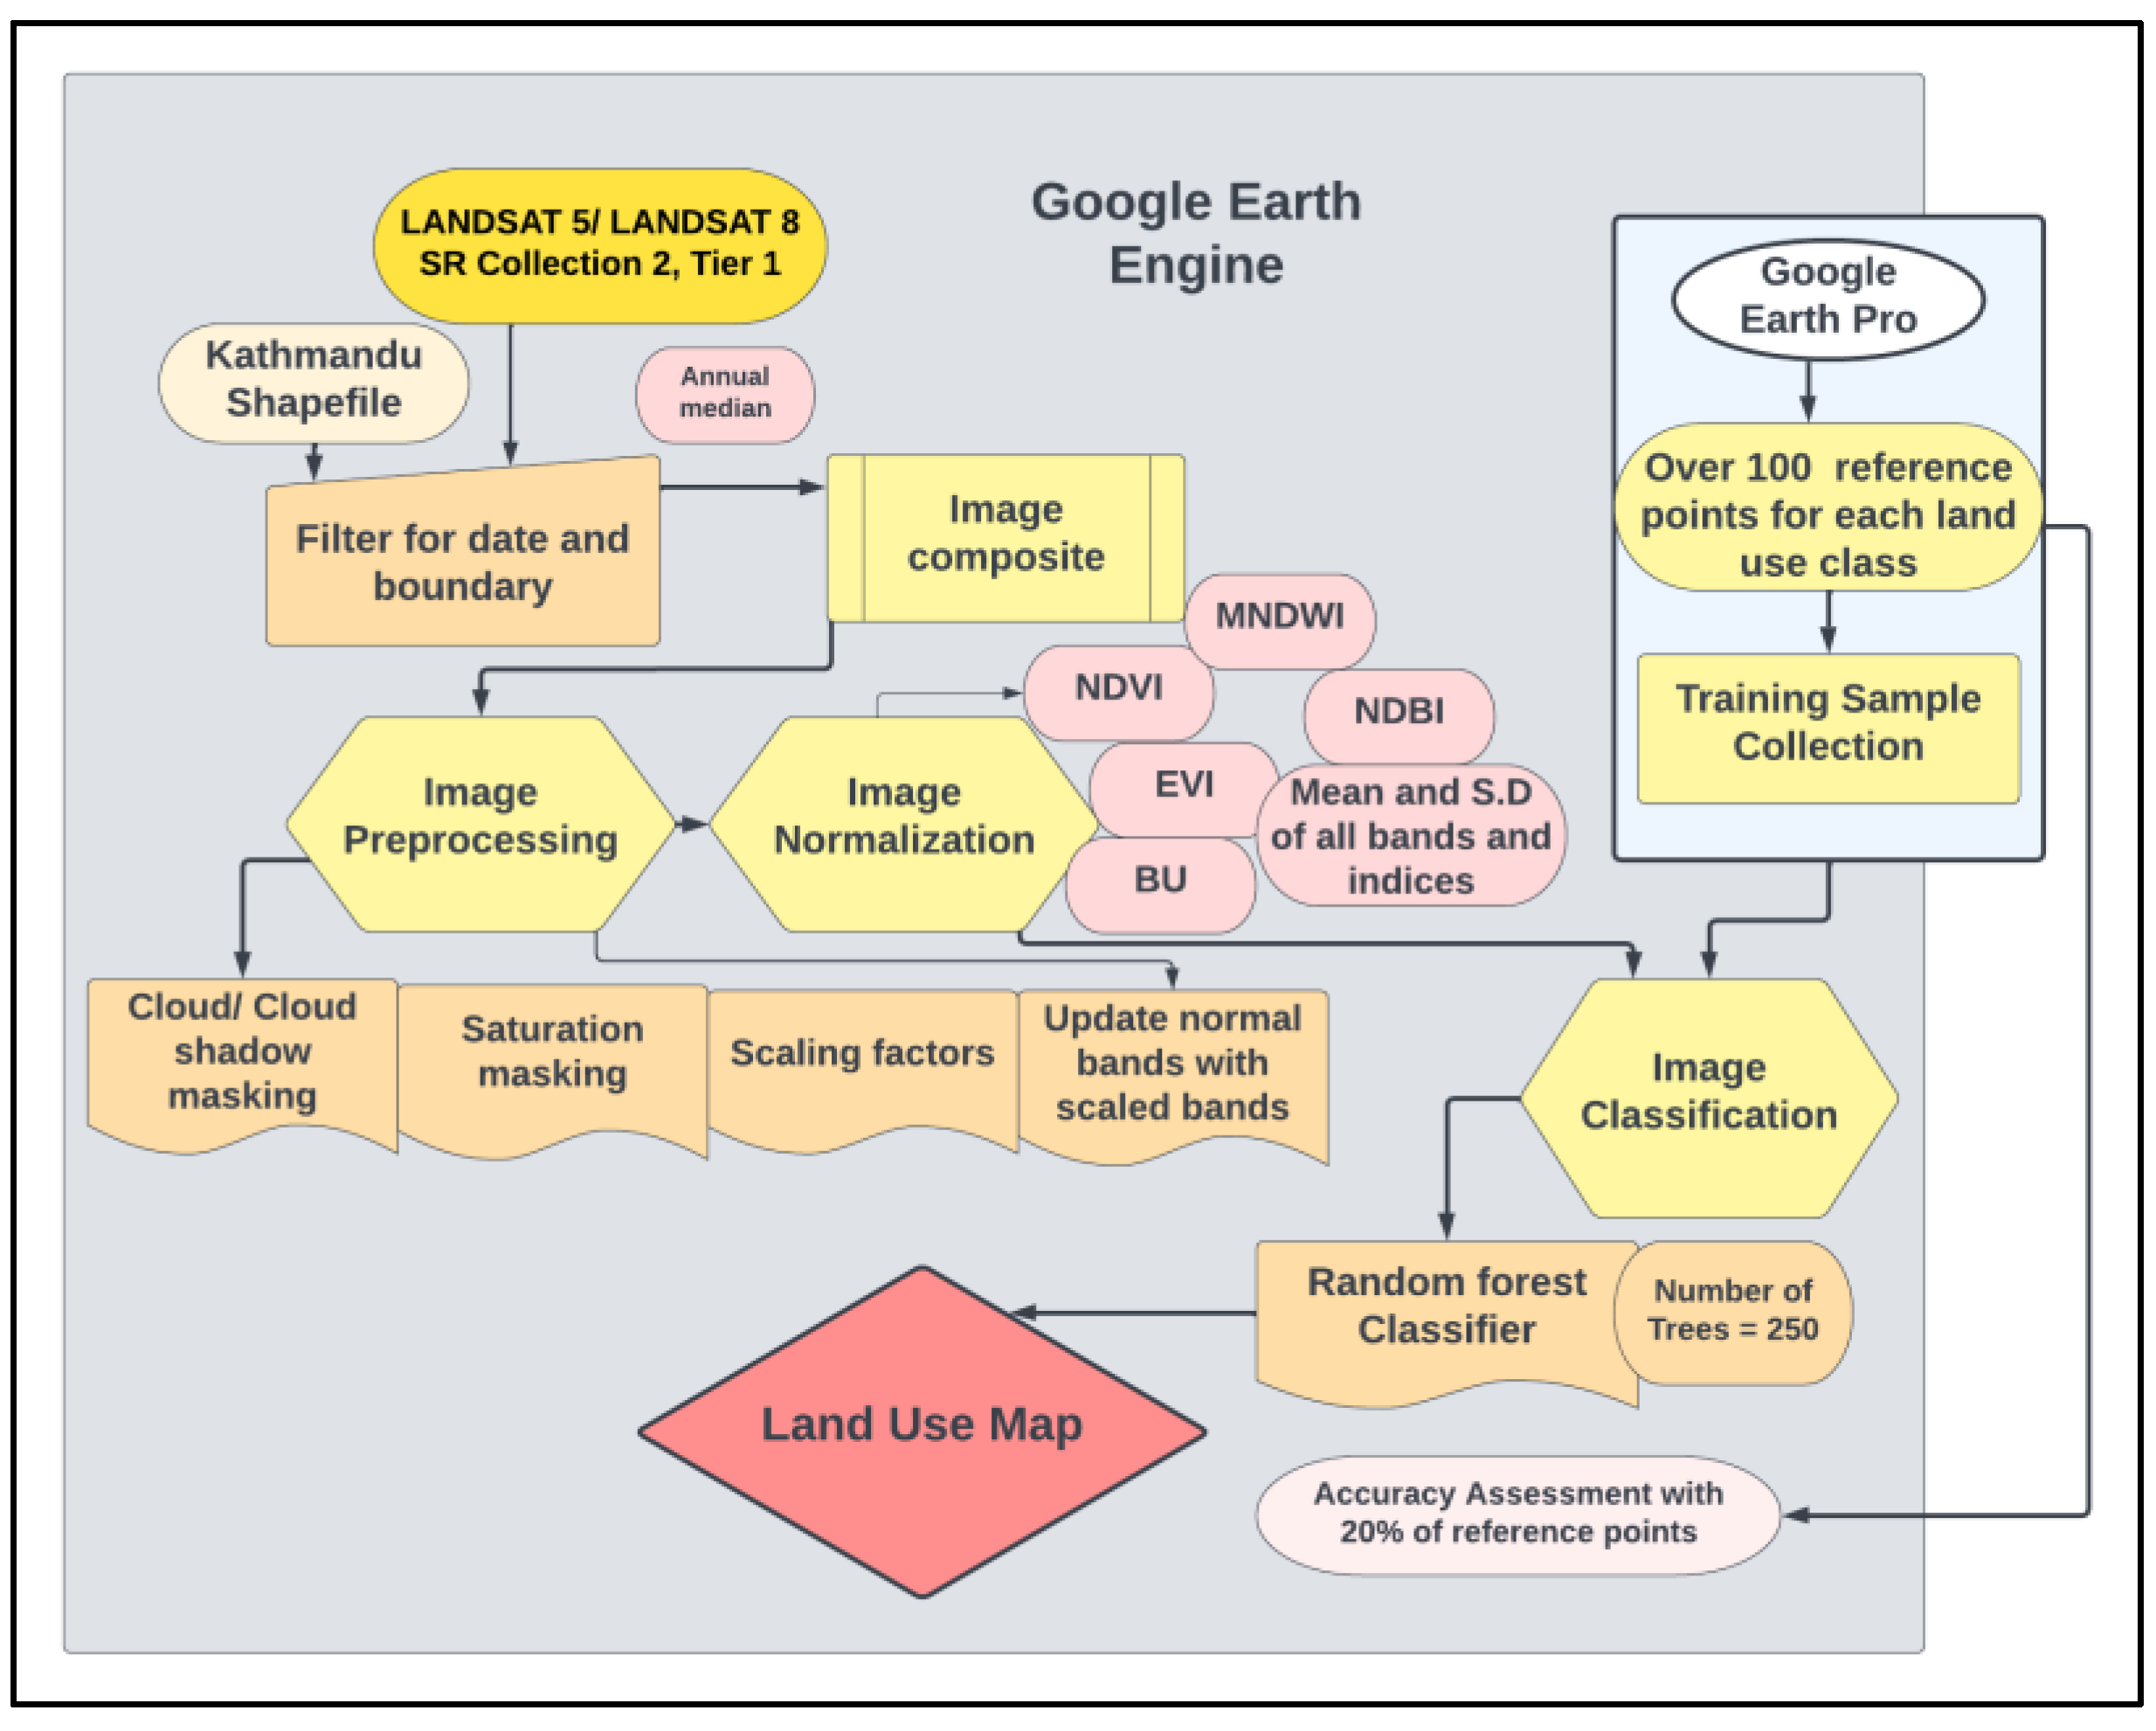
The GEE platform provides pre-processed Landsat data from the collection of USGS [43,46], which was used during this study. Landsat surface reflectance was used over the top of the atmosphere since it accounts for atmospheric effects, such as aerosol scattering and clouds. Landsat 5 from collection 2, Tier 1, and Landsat 8 from collection 2, Tier 1 was imported into the GEE platform, which was filtered for the dates (1 January to 31 December) for the years 2001, 2011 and 2021. A composite image was created with a median value of the yearly image and a composite was clipped to the region of interest (Kathmandu district). For each image to mask out the abnormalities, such as fill, dilated cloud, unused, cloud, and cloud shadow, a masking function with a QA mask and a saturation mask was executed. Thereafter, a scaling factor was applied to optical and thermal bands and the original bands were replaced by the scaled ones. To remove any atmospheric noise in the image and to visualize different land classes, data were normalized using different indices. The total number of images imported for each year to create a composite is presented in the Table 2.

2.3.2. Image Normalization

Different indices with respective formulas were used to intensify the pixels to enhance the vegetation, built-up areas, and water bodies (Table 3). The normalized difference vegetation index (NDVI) defines the greenness of the area by measuring the difference between near-infrared and visible red light [47]. The enhanced vegetation index (EVI) is an optimized index that quantifies vegetation greenness by correcting for atmospheric conditions and canopy background noise. Normalized difference built-up index (NDBI) emphasizes built-up areas using near-infrared and short-wave infrared light whereas built-up index (BU) is a modified index that represents built-up areas and is calculated as a difference between NDBI and NDVI. To enhance open-water features, modified normalized difference water index (MNDWI) was used that uses green and SWIR light [48].

2.3.3. Land-Cover Classes and Sample Data Collection

Based on previous studies, six land-cover categories were described: (1) Forest (all types of forest, plantation and natural, deciduous, and evergreen); (2) Agriculture; (3) Built-up areas; (4) Greenspace (shrubland and grassland); (5) Water (rivers, ponds, lakes); and (6) Bare land (exposed soil surfaces devoid of plants throughout the year). The sample points for training the classifier were collected using Google Earth Pro [45] because of the availability of historical imageries in high resolution. For each class, more than 100 reference points were randomly selected; however, the balance was made corresponding to the area covered by the class. A training data set consisting of 80% of randomly selected points was created, whereas the remaining 20% were used as testing points in accuracy assessment.

2.3.4. Random Forest Classification

Among different classifiers, a random forest classifier is supposed to be more effective in analysing all types of images even with stronger noise [49]. Therefore, we used a random forest algorithm to conduct a supervised classification of land cover. A random forest classifier contains a number of decision trees and takes the average to improve predictive accuracy [50]. The higher number of trees provides higher accuracy by reducing the chance of overfitting. A random forest classifier can handle large datasets and augments the model’s accuracy, so this classifier was used in this study. We used 250 decision trees to train the classifier.

2.3.5. Accuracy Assessment

Accuracy assessment provides the acceptability of the classification process. This study made use of 20% of reference points collected from Google Earth Pro [45] that was not used during the classification process. These points are called test points, which were used to calculate the overall accuracy, consumer and producer accuracy, and kappa coefficient. Kappa coefficient indicates interrater reliability, which in the classification process indicates the agreement between train and test data. Different values of kappa signify a different level of agreement (<0 = no agreement, 0–0.2 = slight, 0.2–0.41 = fair, 0.41–0.60 = moderate, 0.60–0.80 = substantial and 0.81–1.0 = perfect) [51,52].
Producer accuracy (PA) and Consumer accuracy (CA) were also assessed in this study; they provide the extent to which the producer and consumer can rely upon the results. The respective formulae for the accuracy metrics are provided below (Table 4).
The analysis processes were carried out by developing codes in the GEE platform (Figure 2).

2.4. Scenario Modelling in InVEST

This study used the Integrated Valuation of Ecosystem Services and Trade-offs (InVEST) software to generate a proximity-based scenario of land-use change at business-as-usual scenario (BAU). In the business-as-usual scenario, we assumed that the change in land use over past years will continue in the future. InVEST is an open-source tool developed by the Natural capital project [29]. It enables the decision maker to understand the importance of natural capital, to assess benefits and losses between different scenarios and to integrate conservation as well as human development [54]. InVEST provides a simple method to derive changes based on land suitability, transition possibility, and historical land-use changes [29]. The InVEST model combines several criteria that include the transition likelihood, percentage change in land use, land suitability factor, convertible classes, and number of conversion steps to generate future land-use map. Transition likelihood refers to the likelihood of number of pixels of one land-use type being changed to other land-use type.
Proximity-based scenario generator was used to create the future land-use map. This generator provides a set of contrasting land-use change maps in different spatial patterns. This model was used because in it, the user can determine the land-use type to be converted, the land-use type to be converted into and the pattern of the change based on proximity to the focal land use [29]. This tool requires prior determination of focal land use and convertible land-use classes. For the conversion of particular land-use class, two different scenarios, nearest to the edge and farthest from the edge, can be generated [29]. The nearest to edge scenario was the focus of this study, which means that the convertible land-use classes nearest to the focal land-use classes will be converted. In our case, the urban land use was set as the focal land use and the pixels near the urban area was subjected to the conversion. The scenario was selected based on the past land-use changes where the land uses near to the built-up areas were converted to urban areas. The scenario generator makes use of a base land-cover map, focal land-cover classes, convertible land-use classes, and the replacement codes. The land-use map of 2021 was used as the base map and five classes were added as focal and convertible land-use classes. A transition from forest land class to built-up areas was forecasted in several steps, whereas a change from agricultural land to built-up areas was assessed in a single step. Based on historical changes and observation from Google Earth, it was observed that the forest area was first converted to either agricultural land or green space before being converted into built-up areas, whereas agricultural land was directly converted to the urban land use. The scenario modelling was used to generate the future land-use map representing the condition after next 20 years. These scenario-based outputs can further be used to assess ecological services and habitat quality.

3. Results

3.1. Land-Cover Change over 20 Years

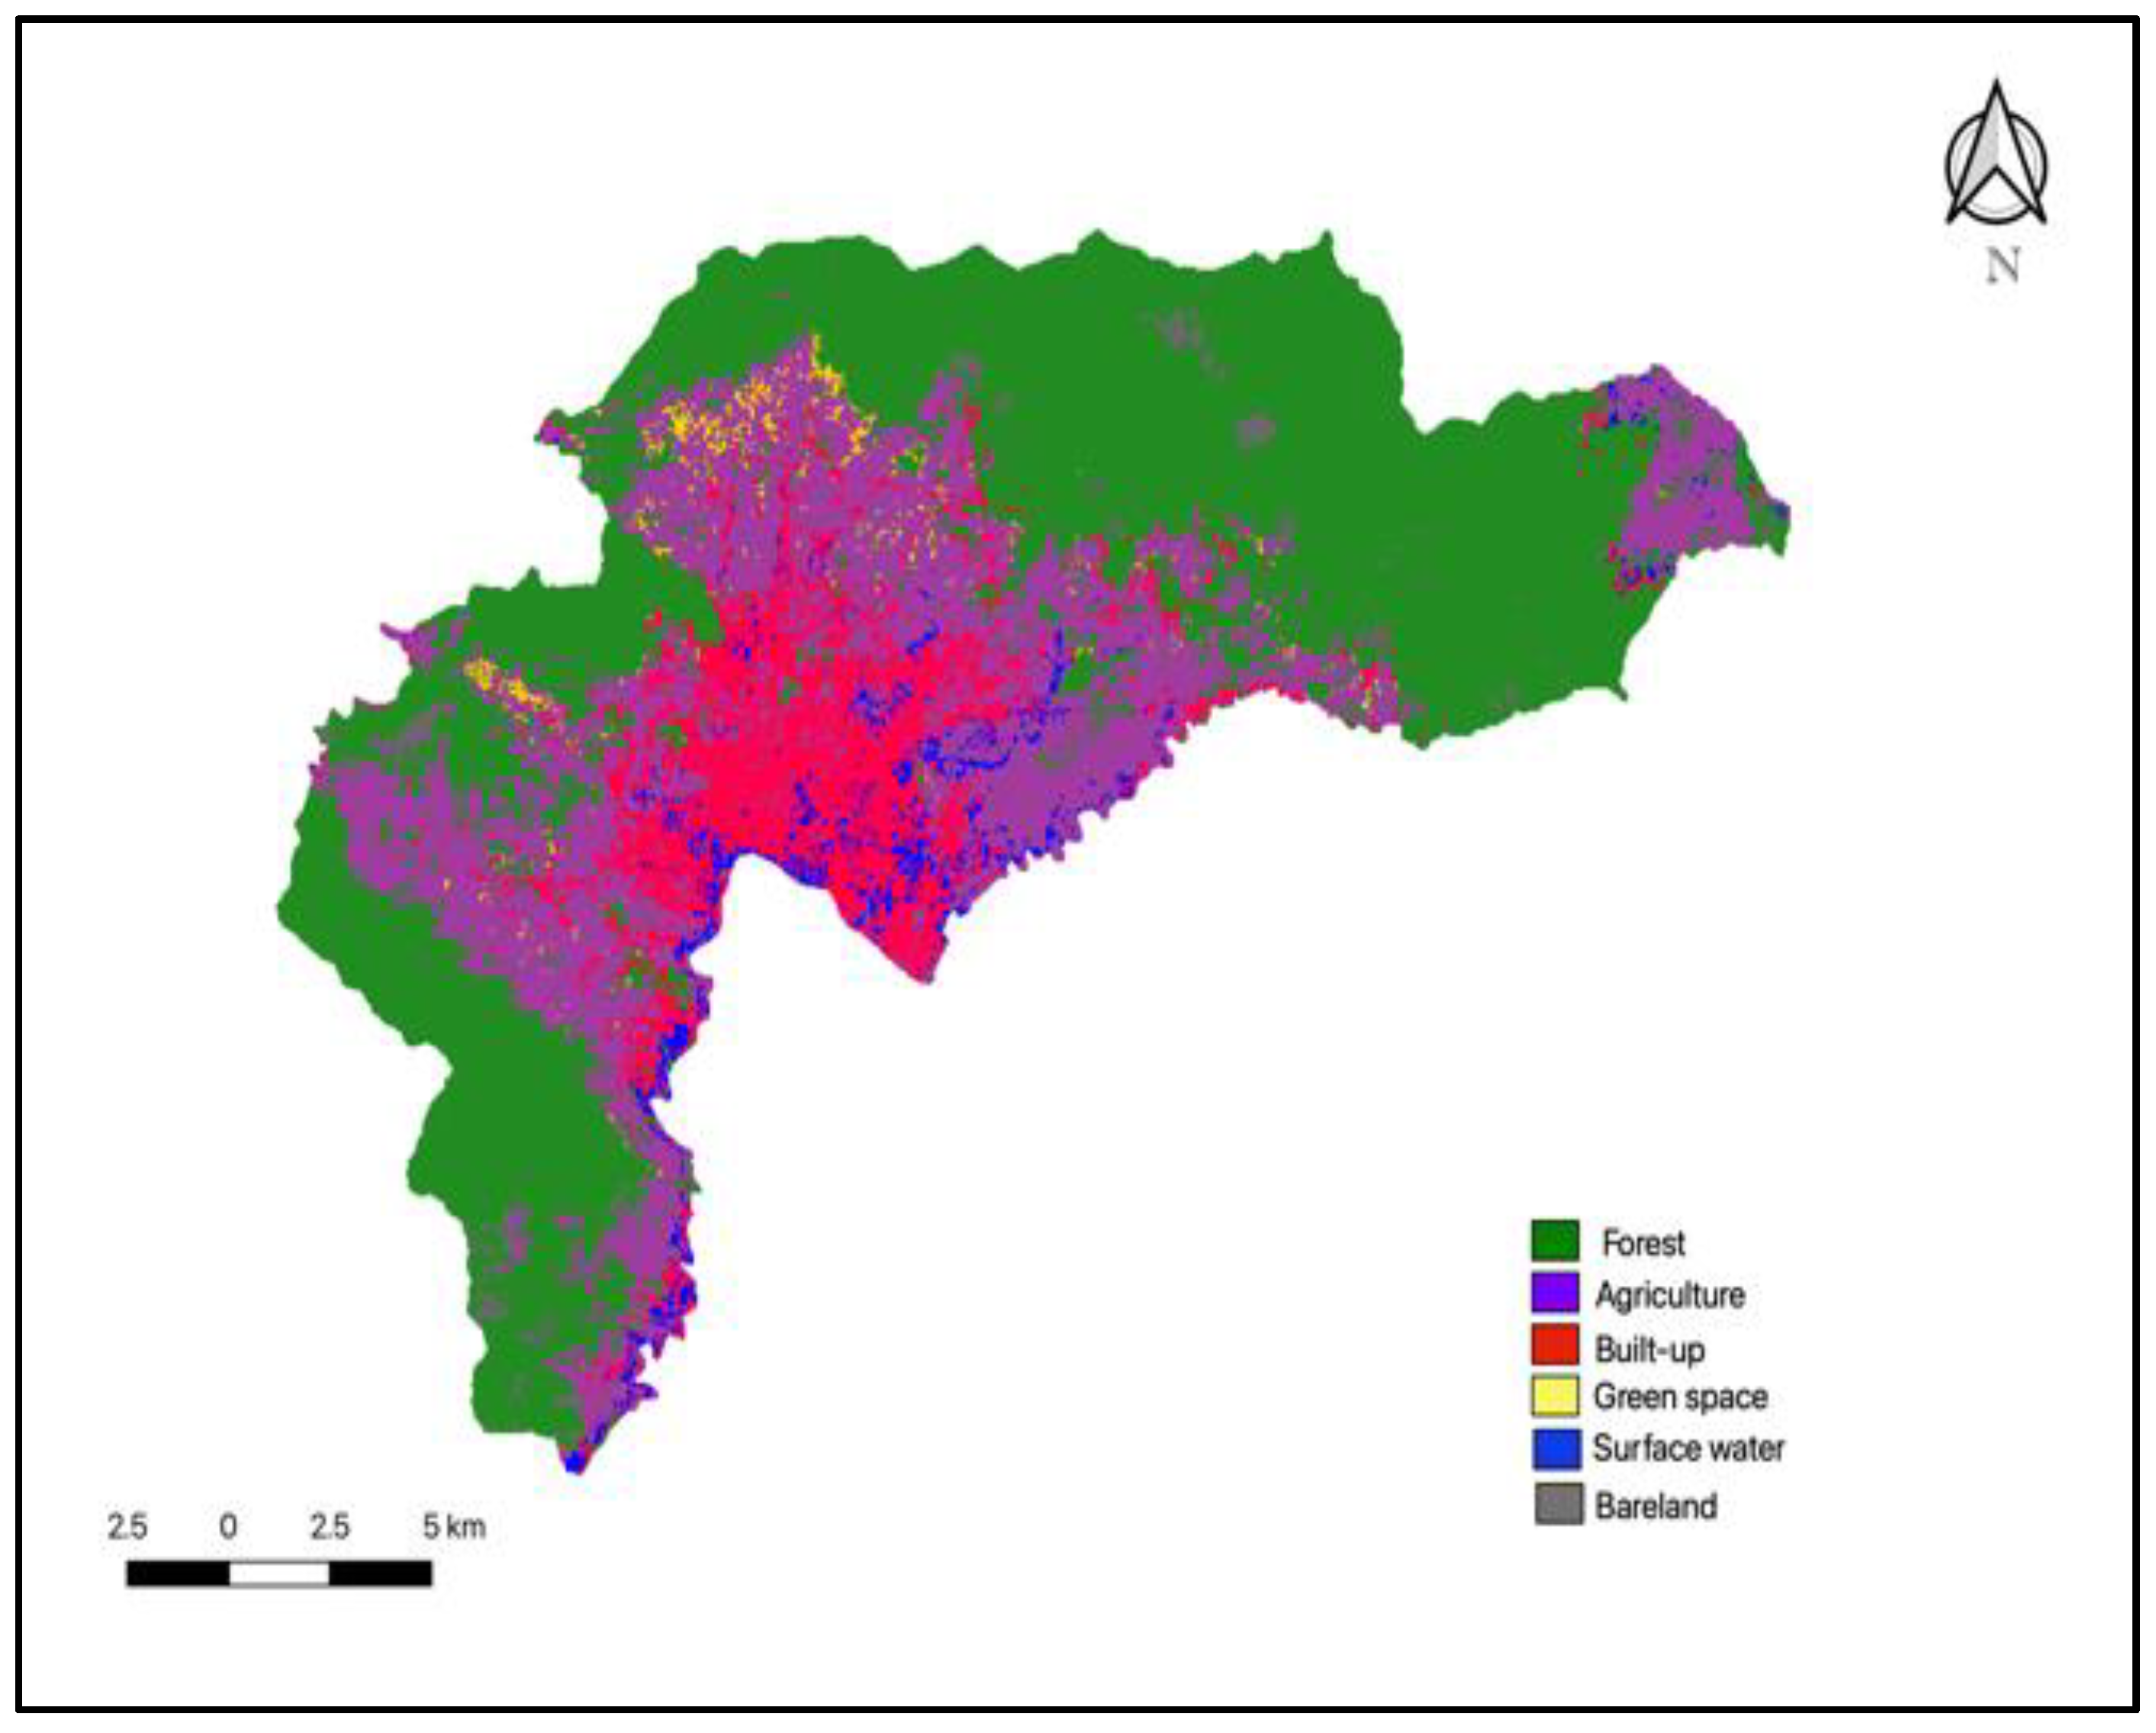
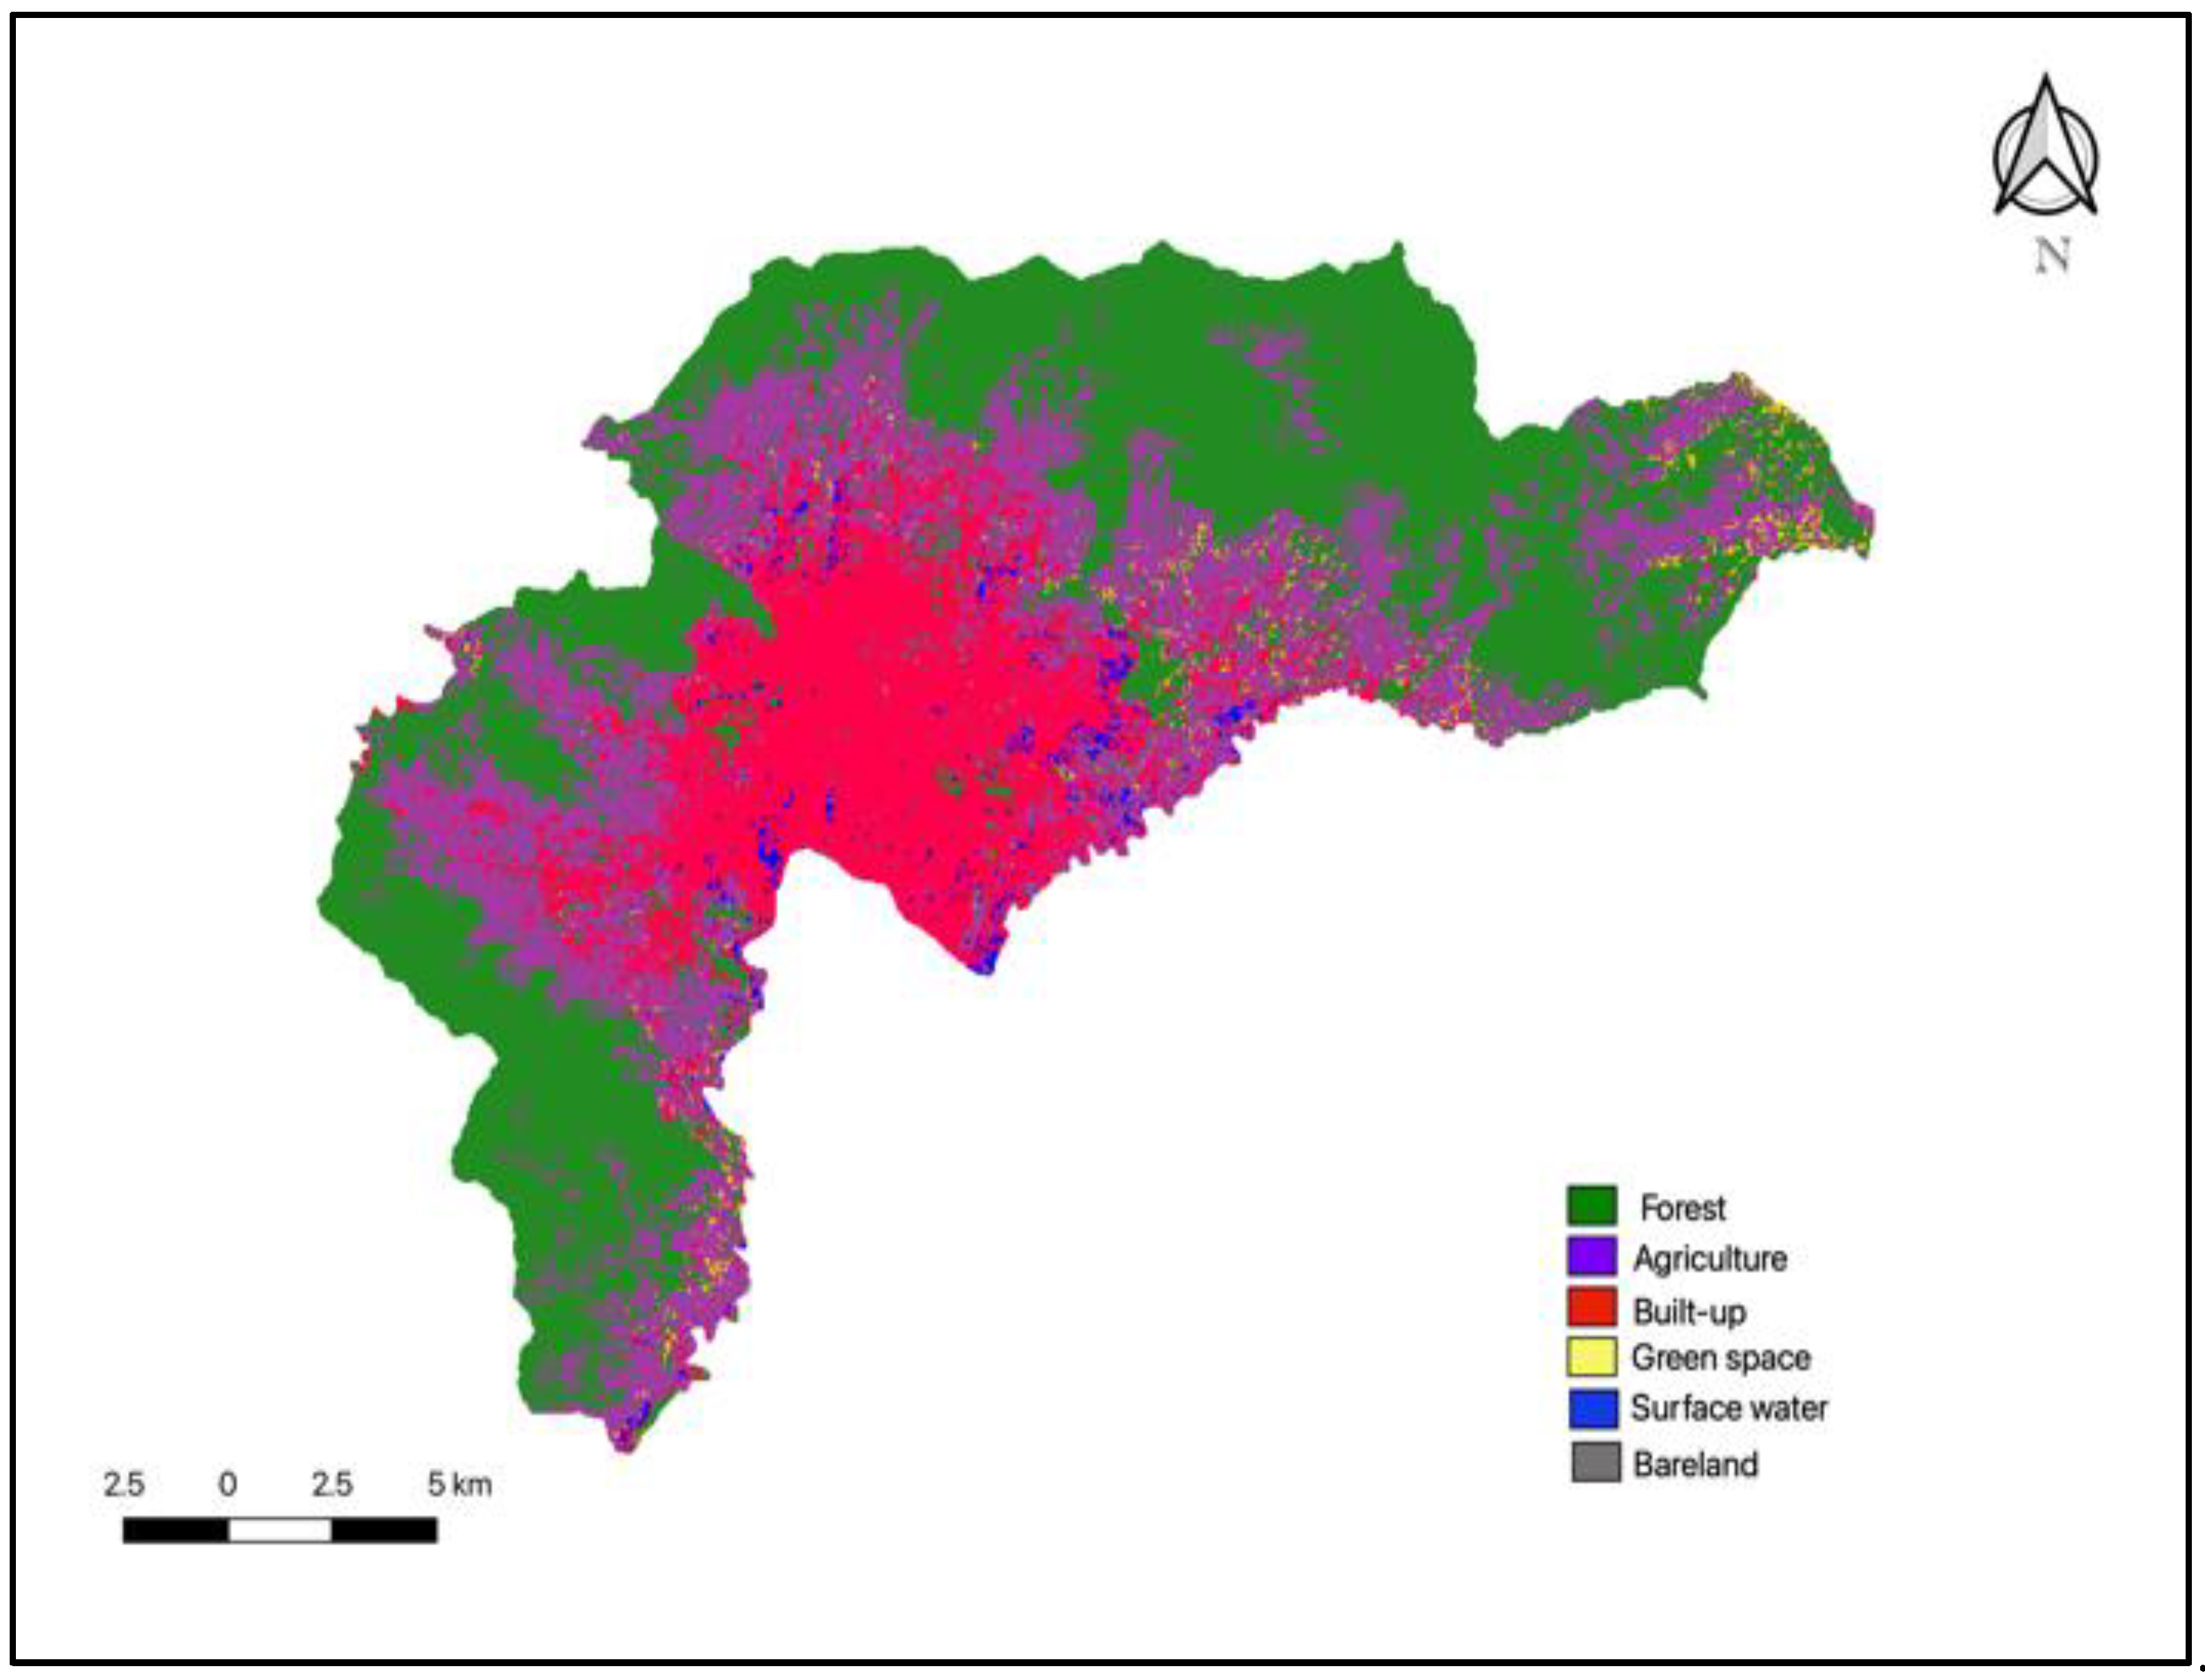
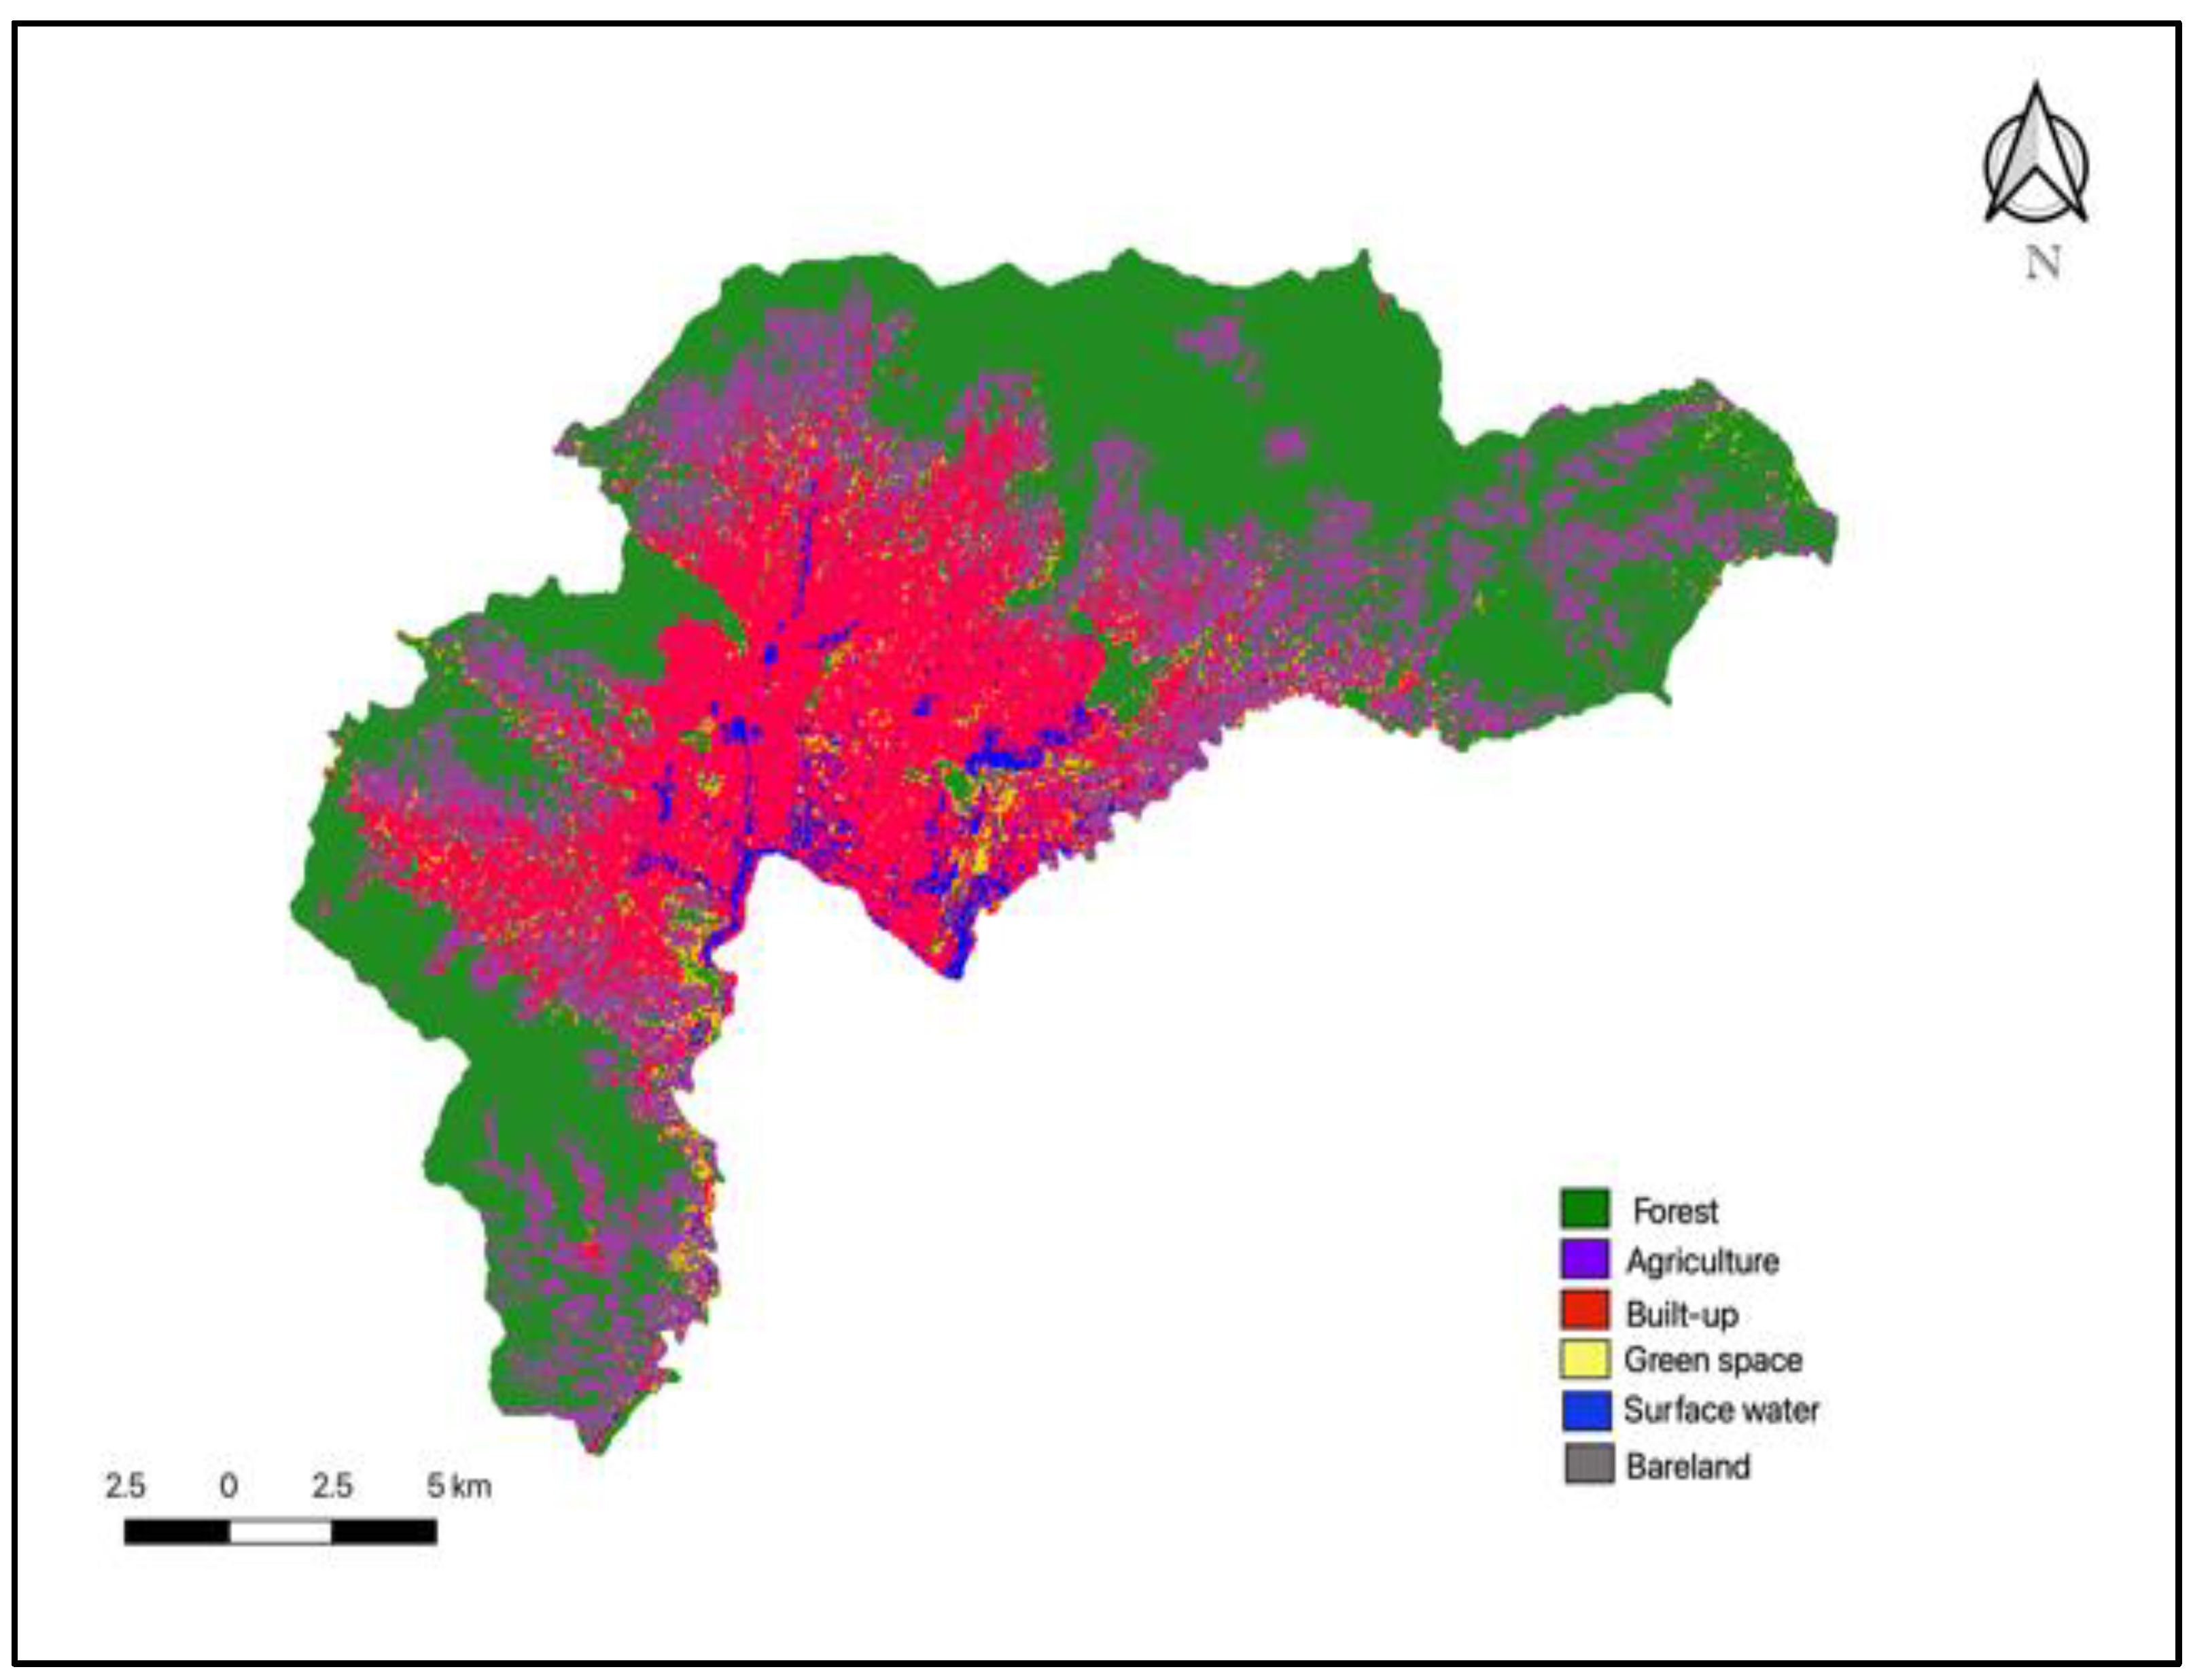
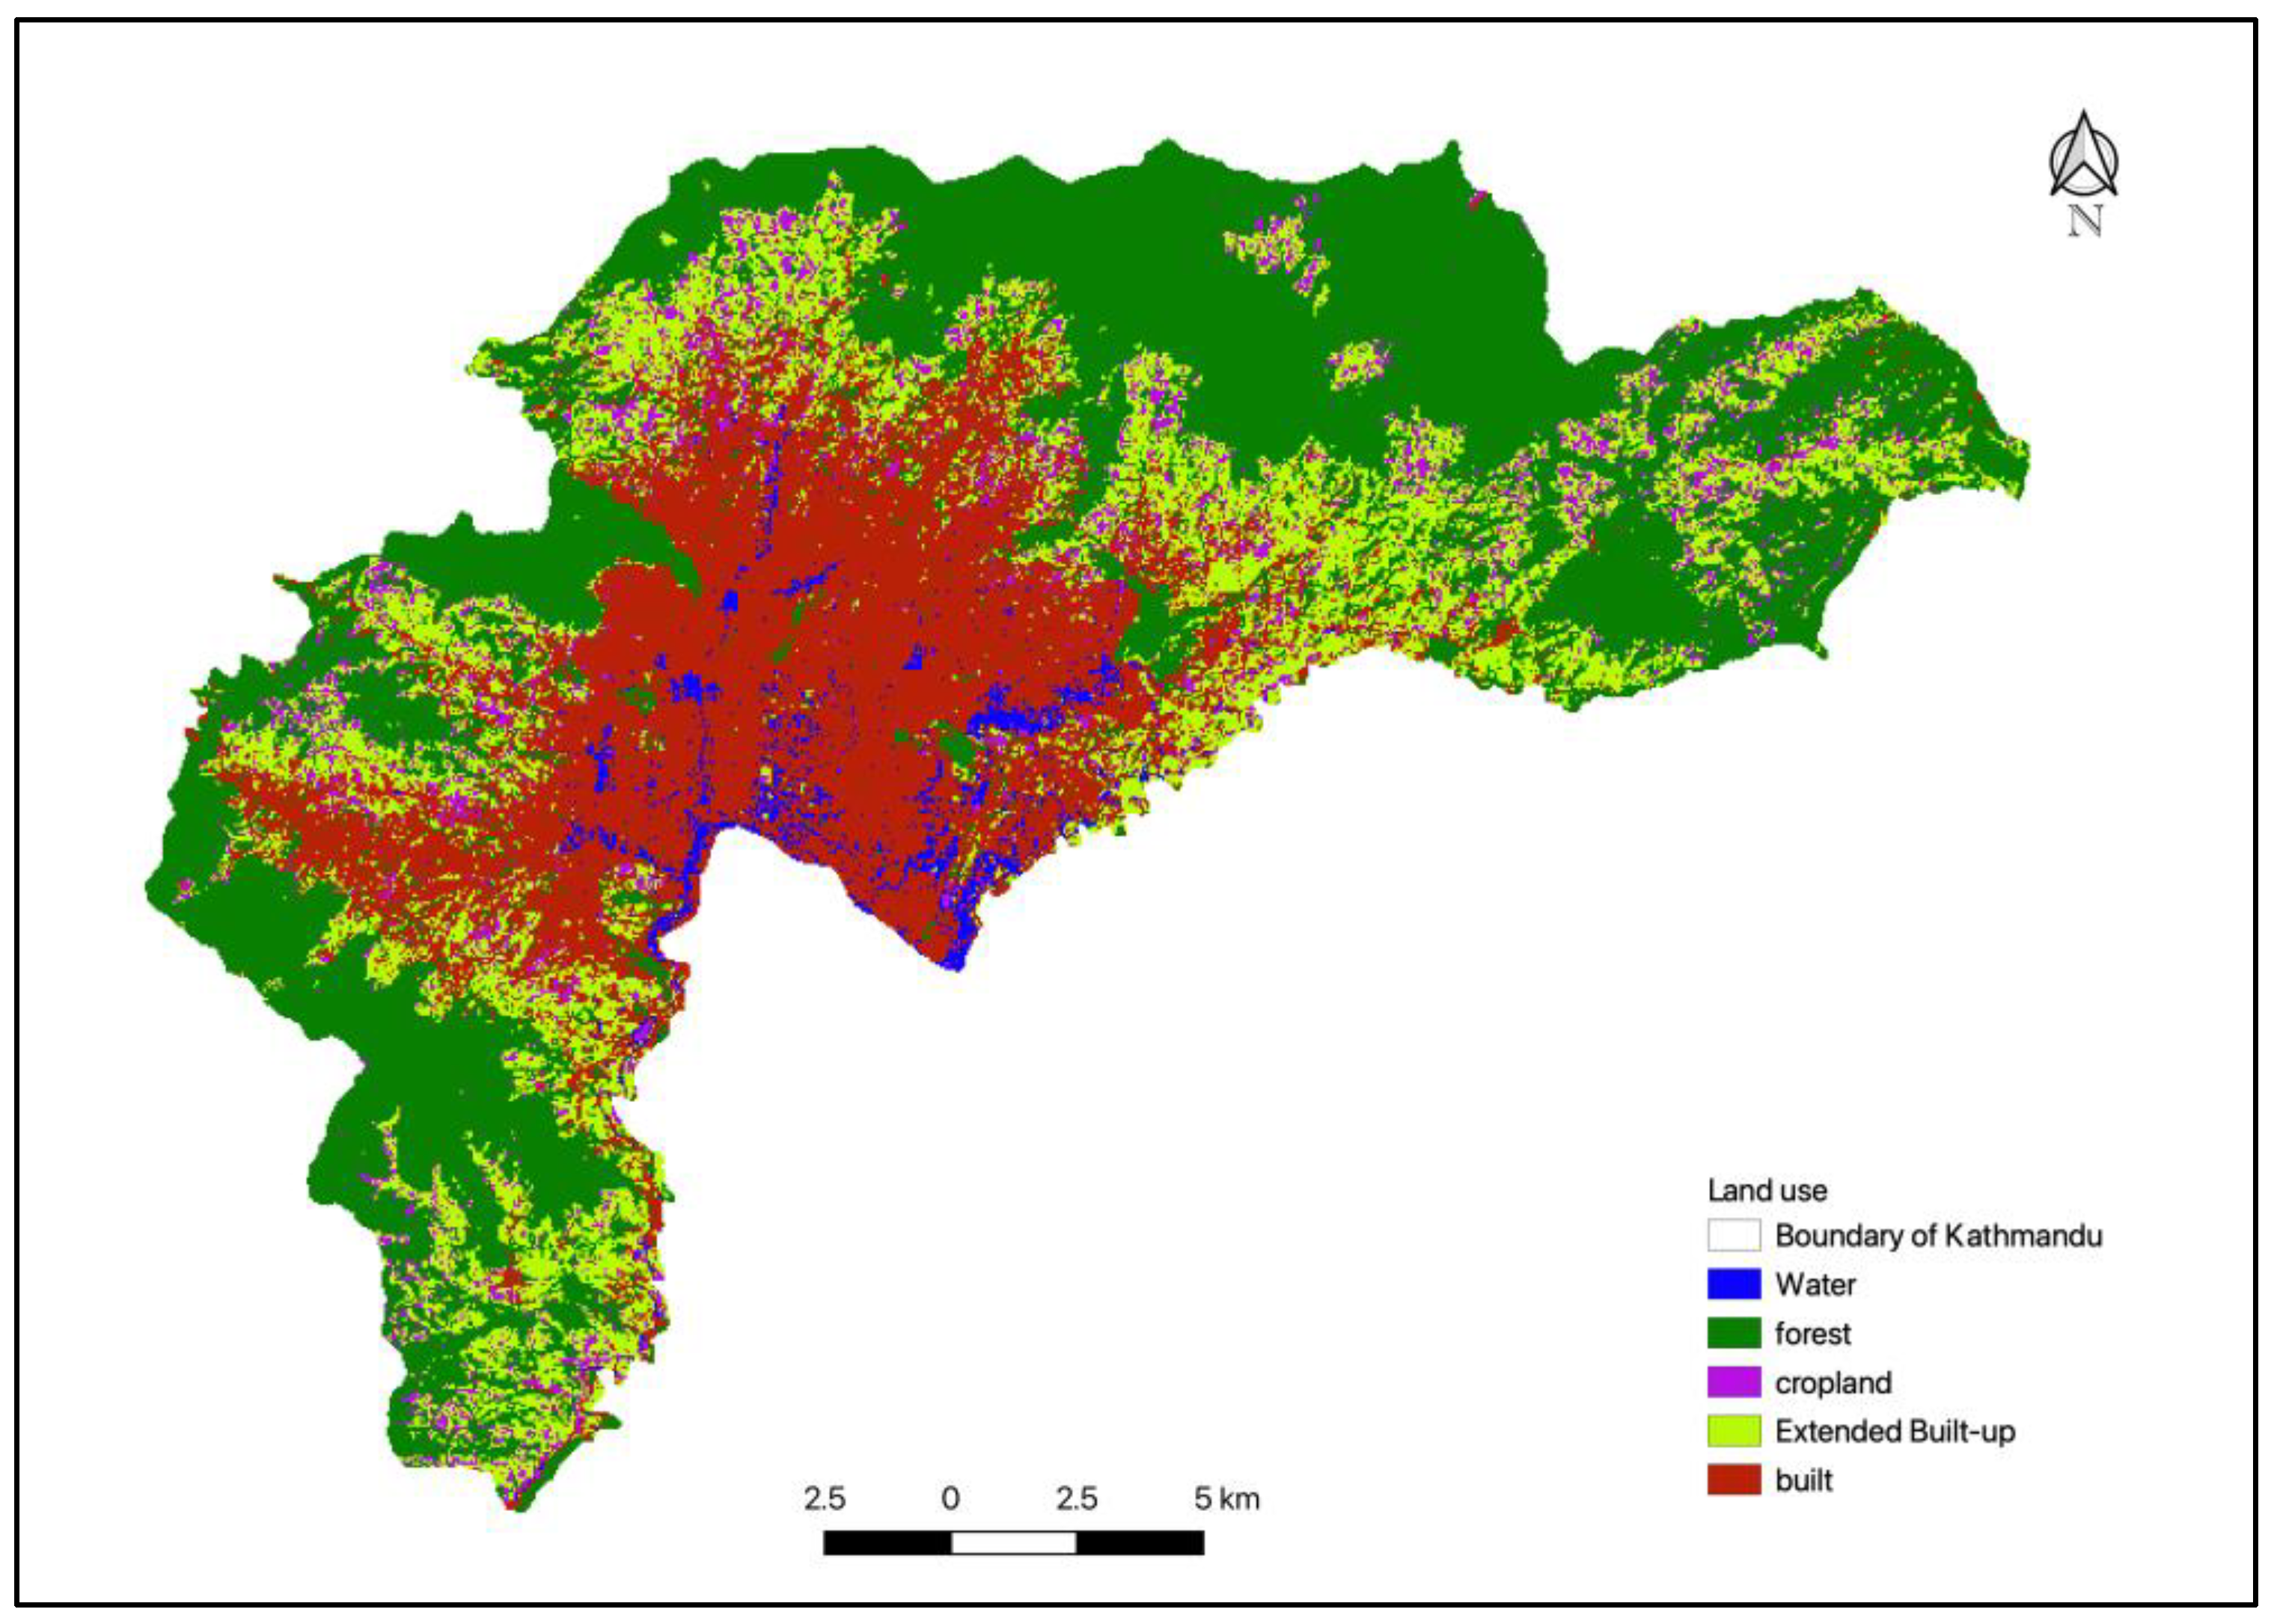
Over 20 years, Kathmandu has experienced a massive transition from a green ecosystem to concrete. Table 5 summarizes the transitions among different land uses over the years. The major change is seen in the built-up area, which includes all infrastructure, such as buildings, roads, highways. From 50.02 km2 in 2001 to 117.47 km2. in 2021, the built-up land has significantly expanded over other land uses. Even though the area of forest has declined from around 215 km2 in 2001 to 177.97 km2 in 2021, forest is still the most dominant land-use type in Kathmandu. From 2001 to 2011, forest showed a rapid decline of around 28 km2, but from 2011 to 2021 the decline reduced to 10 km2. Agriculture was the second dominant land-use type in Kathmandu in 2001 and 2011, but the built-up area has taken over, limiting agricultural area to around 101 km2 only. During 2011–2021, Kathmandu lost approximately 31 km2 of agricultural land. The area of green space (including shrubland) has increased over the years. These areas are usually prevalent at the junction between forest and agricultural land. The area of surface water bodies decreased in 2011, but has shown an increment in 2021.
The change in land cover can further be visualized from land-cover maps of three different years (Figure 3, Figure 4 and Figure 5).

Accuracy Assessment of the Classification

The accuracy of the classification is an important criterion that influences the acceptability of the classification. This study made use of overall accuracy, kappa coefficient, consumer and producer accuracy. The overall accuracy of this classification was 0.99 for the year 2021, 0.96 for 2011 and 1.00 for 2001 (Table 6). Similarly, the kappa coefficients were 0.99, 0.95 and 1.00 for years 2021, 2011 and 2001, respectively. The consumer accuracy ranged 0.94–1.00 and producer accuracy ranged 0.88–1.00 (Table 7). As per the different literatures, the accuracy of 85% or 0.85 and more is acceptable for land-use classification [55,56].

3.2. Geographic Trend of Urbanization

The outward extension of built-up areas from the core of the district (Figure 6) depicts the pattern of urbanization in Kathmandu. In 2001, built-up areas were confined to the core of the district, which by 2011 had expanded outwards, intruding on agricultural land. By 2021, urban area had shifted further outward to reach forest land. Different land uses have transitioned to built-up areas over the 20 years (Table 8). The highest transition is seen with agricultural land. During 2001–2011, 19.75% of agricultural land had been transformed into built-up area, whereas during 2011–2021, around 25% of total agricultural land was converted to built-up area. Only around 1–2% of forest had transitioned to built-up area, but considering the higher area covered by forest, even 1–2% is a significant value for transition. Green space also has had a significant percentage of transition to built-up area, most probably because these are located at the junction of forest and agricultural land and encroaching onto agricultural land has tended to encroach green space as well. However, the area covered by green space is minimal, implying a very limited area had undergone the transition to built-up area. Surface water and bare land experienced a minimum transition to built-up area, taking into account their total area and the percentage of transition.

3.3. Proximity-Based Scenario Modelling

After understanding the land-cover change, pattern of urbanization, and the transition to built-up area, proximity-based scenario modelling was conducted in InVEST [54]. Looking at the extension of built-up area over the years, the possibility of incursion into agricultural land, forests, and green spaces by built-up areas is higher for the future as well. If circumstances remain constant, then the built-up area may take over around 33.33 km2 of forest, 66.67 km2 of agricultural land, and 0.35 km2 of green space (Table 9, Figure 7). The transition from forest to built-up area may take several steps, such as forest fragmentation, conversion to agricultural land and then to built-up areas, whereas in the case of agricultural land, a direct conversion to built-up area occurs. The scenario modeling suggests an obligation to manage the expansion of built-up area to conserve remaining agricultural land and forest.

4. Discussion

The study shows the urbanization pattern in the Kathmandu district over 20 years. Urbanization in Kathmandu has been elucidated with both demographic and geographic slants by other studies [57,58]. A significant change, especially in the forest, agriculture, and built-up area land-use classes is reported by this study, which is also supported by other research [18,19,58]. Our study demonstrated a decline in forest and agricultural land over 20 years and an increase in built-up area, green space, and bare land. Further, this study analysed the conversion of agricultural land to built-up area, with built-up area taking over as the second-most dominant land-use class in 2021. The dominance of forest and agricultural land during 2001 and 2011 has been replaced by built-up area to a large extent. Forest, despite covering most of the area, is in a state of continuous decline, which has also been demonstrated by the studies of Rijal et al. [59] and Wang et al. [18]. During those years, built-up areas have doubled in area, posing a risk to natural ecosystems and biodiversity and increasing climate change risks. The unprecedented urbanization pattern at the cost of forest and agricultural land as reported in Kathmandu Valley [32] is seen all over Nepal [60,61] and throughout the world [62,63,64,65]. The geographical pattern of urbanization as observed in this study shows the outward movement of urban areas from the core of the city. Most agricultural land is converted into urban area; however, accounting for the larger area of forest, even the lower percentage of transition resulted in the conversion of larger areas of forest into urban areas. The highest conversion ratio of agricultural land to urban areas is also documented by Ishitiaque et al. [19] and Thapa [66]. The extensive urbanization is not only the case in Kathmandu but in different parts of the world. Similar observations have been recorded in the Europe, where built-up areas are expanding faster than population [67]. The rapid expansion of urban areas is also studied in Africa [68].
The prompt conversion of agricultural land is a challenge to food security, and it increases risks related to the impact of climate change [69,70], suggesting an obligation to ensure effective policy and governance. The warming of cities in United States has been linked to the urban expansion [71]. Further urbanization has caused severe water pollution in Europe, Southeast Asia, and North America [72].
Urbanization at the cost of forest and agricultural land in Kathmandu is linked by Shrestha [73] to policy failure and elite capture. The abrupt changes in the land use of Kathmandu have resulted in a fragmented and heterogeneous landscape that affects hydrological and socio-economic configurations [74,75]. The growth in built-up areas and population has increased the use of groundwater for domestic as well as industrial purposes, surpassing natural recharge and depleting groundwater, as reported by Gautam and Prajapati [76]. A static balance of the area of surface water bodies in Kathmandu is a possibility; however, this study has not focused on water quality, which is deteriorating to an incongruity level, as reported by different studies [77], a phenomenon directly or indirectly instigated by urbanization [78,79]. The low quality of running surface water bodies has also affected the quantity of drinking water [80].
Similarly, an increase in green space of double the area in 2021 than in 2011 is an opportunity to meet the 11th goal of sustainable development, which proclaims the accessibility of green space to every human [10]. The area of bare land shows an undulating pattern, with a decrease in 2011 and an increase in 2021. This could be because of the change in the land-use system by the real estate sector, in which real estate developers acquire land and leave it bare until the time is considered optimal for development, as observed by Uprety et al. [81].
Further, the scenario generated provides a vision of the way Kathmandu may look if proper attention is not directed to planned urban development. The modelling shows a likelihood of a transition of agricultural and forest land at maximum percentage to built-up areas. Similar projections have been made by Wang et al. [18] and Lamichhane and Shakya [82]. This scenario can be beneficial in determining the ecosystem services and valuation attached to the land use and plan to optimize the services from each land use. However, to stop further deterioration of natural resources, the expansion of the Kathmandu urban area needs to cease.
While the debate on urbanization is continuing, China and India have become leading countries in greening through land-use management [83]. The slow rate of expansion of built-up areas and an increase in agricultural growth in China has been documented by Ning et al. [84]. Food production in India and China has grown by over 35% since 2000 through proper land-use management and holding of around 82% of croplands in India and 42% of forest and 32% of croplands in China [83]. It is necessary to explore, and effectively and rapidly implement, similar land-use management strategies in Kathmandu in order to control haphazard urbanization with its continuing encroachment on green land. Further in-depth study on the urbanization process, its root causes, and social and economic factors associated with urbanization is recommended to enable policy makers to identify the priority area to make a change.

5. Conclusions

This study was planned to understand the urbanization pattern in Kathmandu district that would serve as a baseline for planning sustainable urban management. The main objective of this study was to analyse the land cover change in Kathmandu over 20 years, understand the trend of urbanization, and generate the future land-use map for the situation after next 20 years. This study made use of the Google Earth Engine platform for classification and InVEST tool for scenario modelling of land cover. Forest and agriculture were the dominant land-use classes 20 years ago, that is, in 2001, but by 2021, built-up areas have taken over most of the agricultural and forest land. The study discovered augmentation of urban areas at a higher level. Further, the urbanization pattern showed a centrifugal pattern; thus, the urban areas are expanding from the core of the district, intruding on other land-use classes. The transition matrix exhibited the highest transformation percentage from agricultural land and green space to built-up areas; however, even though a lower percentage of forest was observed to have undergone transition to built-up area, the larger area of forest accounts for the larger transformation. Further, the scenario generated in InVEST has produced a land-use map at business-as-usual scenario, which clearly shows the intrusion of urban land use over other land uses. Urbanization increases the risk of negative climate change impacts, changes the socio-economic configuration, and effects biodiversity and the value of ecosystem services. This study at the regional level and national levels assists urban planners to adjust ecological approaches during development activities in all types of areas prone to maximum urbanization. At a global level, this study provides an instance of using modern efficient techniques for understanding pattern of change over years to formulate plans and policies accordingly.

Author Contributions

Conceptualization, A.A.; methodology, A.A. and K.P.B.; software, A.A. and K.P.B.; validation, A.A.; formal analysis, A.A.; investigation, A.A.; resources, A.A.; data curation, A.A.; writing—original draft preparation, A.A. and K.P.B.; writing—review and editing, A.A., S.A. and H.B.; visualization, K.P.B.; supervision, H.B. All authors have read and agreed to the published version of the manuscript.

Funding

This research received no external funding.

Institutional Review Board Statement

Not applicable.

Informed Consent Statement

Not applicable.

Data Availability Statement

Data will be made available if requested.

Acknowledgments

The authors express sincere gratitude to Amul Acharya for his continuous support and guidance throughout data analysis procedure. Our special thanks goes to Robert Frederick Finlayson from CIFOR-ICRAF for helping us in refining our manuscript through editing and proofreading. We would also like to thank the Youth Alliance for Environment team for constant support during the research period.

Conflicts of Interest

The authors declare no conflict of interest.

References

  1. McGranahan, G. Urbanization. The International Encyclopedia of Social and Behavioral Sciences, 2nd ed.; Wright, J.D., Ed.; Elsevier: Oxford, UK, 2015; Volume 24, pp. 958–964. [Google Scholar]
  2. Beall, J.; Guha-Khasnobis, B.; Kanbur, R. Urbanization and Development: Multidisciplinary Perspectives; Oxford University Press: Oxford, UK, 2010. [Google Scholar]
  3. Bertinelli, L.; Black, D. Urbanization and growth. J. Urban. Eco. 2004, 56, 80–96. [Google Scholar] [CrossRef]
  4. Kuddus, A.; Tynan, E.; McBryde, E. Urbanization: A problem for the rich and the poor? Public Health Rev. 2020, 41, 1. [Google Scholar] [CrossRef]
  5. Di Clemente, R.; Strano, E.; Batty, M. Urbanization and economic complexity. Sci. Rep. 2021, 11, 3952. [Google Scholar] [CrossRef]
  6. Regmi, R.K. Urbanization and Related Environmental Issues of Metro Manila. J. Adv. Coll. Eng. Manag. 2018, 3, 79–92. [Google Scholar] [CrossRef] [Green Version]
  7. Amin, A.; Aziz, B.; Liu, X.-H. The relationship between urbanization, technology innovation, trade openness, and CO2 emissions: Evidence from a panel of Asian countries. Environ. Sci. Pollut. Res. 2020, 27, 35349–35363. [Google Scholar] [CrossRef]
  8. Henderson, V. Urbanization in Developing Countries. World Bank Res. Obs. 2002, 17, 89–112. [Google Scholar] [CrossRef]
  9. Basyal, G.K.; Khanal, N.R. Process and characteristics of urbanization in Nepal. Contrib. Nepal. Stud. 2001, 28, 187–225. Available online: http://himalaya.socanth.cam.ac.uk/collections/journals/contributions/pdf/CNAS_28_02_03.pdf (accessed on 1 September 2022).
  10. UN. Transforming Our World: The 2030 Agenda for Sustainable Development; UN General Assembly 21 October 2015, A/RES/70/1; UN: New York, NY, USA, 2015. [Google Scholar]
  11. UNFCCC. Adoption of the Paris Agreement, 21st Conference of the Parties; An official publication; United Nations Framework Convention on Climate Change: Paris, France, 2015; Available online: https://unfccc.int/resource/docs/2015/cop21/eng/l09r01.pdf (accessed on 1 September 2022).
  12. UN DESA. World Urbanization Prospects: 2018 Revision; United Nations Department of Economic and Social Affairs: New York, NY, USA, 2018. Available online: https://www.un.org/development/desa/publications/2018-revision-of-world-urbanization-prospects.html (accessed on 1 September 2022).
  13. Thapa, R.B.; Murayama, Y. Examining Spatiotemporal Urbanization Patterns in Kathmandu Valley, Nepal: Remote Sensing and Spatial Metrics Approaches. Remote. Sens. 2009, 1, 534–556. [Google Scholar] [CrossRef] [Green Version]
  14. MoUD. National Urban Development Strategy 2017; Ministry of Urban Development, Government of Nepal: Kathmandu, Nepal, 2017. Available online: https://www.moud.gov.np/storage/listies/July2019/NUDS_PART_A.pdf (accessed on 1 September 2022).
  15. Timsina, N.P.; Shrestha, A.; Poudel, D.P.; Upadhyaya, R. Trend of Urban Growth in Nepal with a Focus in Kathmandu Valley: A Review of Processes and Drivers of Change; The University of Edinburgh: Edinburgh, UK, 2020. [Google Scholar] [CrossRef]
  16. MoLRM. Land Use Policy, Government of Nepal; Ministry of Land Reform and Management Singhadurbar: Kathmandu, Nepal, 2015. Available online: https://molcpa.gov.np/downloadfile/land%20use%20policy__2015_1505895657_1536124080.pdf (accessed on 1 September 2022).
  17. Rimal, B. Application of remote sensing and GIS, land use/land cover change in Kathmandu Metropolitan city, Nepal. J. Theo. Appl. Infor. Tech. 2011, 23, 80–86. [Google Scholar]
  18. Wang, S.W.; Gebru, B.M.; Lamchin, M.; Kayastha, R.B.; Lee, W.-K. Land Use and Land Cover Change Detection and Prediction in the Kathmandu District of Nepal Using Remote Sensing and GIS. Sustainability 2020, 12, 3925. [Google Scholar] [CrossRef]
  19. Ishtiaque, A.; Shrestha, M.; Chhetri, N. Rapid Urban Growth in the Kathmandu Valley, Nepal: Monitoring Land Use Land Cover Dynamics of a Himalayan City with Landsat Imageries. Environments 2017, 4, 72. [Google Scholar] [CrossRef]
  20. Lamichhane, S.; Shakya, N.M. Integrated Assessment of Climate Change and Land Use Change Impacts on Hydrology in the Kathmandu Valley Watershed, Central Nepal. Water 2019, 11, 2059. [Google Scholar] [CrossRef] [Green Version]
  21. Pokhrel, B.K. Impact of Land Use Change on Flow and Sediment Yields in the Khokana Outlet of the Bagmati River, Kathmandu, Nepal. Hydrology 2018, 5, 22. [Google Scholar] [CrossRef] [Green Version]
  22. Sarif, O.; Rimal, B.; Stork, N.E. Assessment of Changes in Land Use/Land Cover and Land Surface Temperatures and Their Impact on Surface Urban Heat Island Phenomena in the Kathmandu Valley (1988–2018). ISPRS Int. J. Geo-Inf. 2020, 9, 726. [Google Scholar] [CrossRef]
  23. Anyamba, A.; Kline, E.K.; Collins, E. Remote Sensing. In International Encyclopedia of the Social and Behavioral Science; Elsevier: Amsterdam, The Netherlands, 2015; pp. 419–424. [Google Scholar]
  24. Acker, J.; Williams, L.; Ardanuy, C.P.; Miller, S.; Schueler, C.; Vachon, P.W.; Manore, M. Remote Sensing from Satellites. In Reference module in Earth Systems and Environmental Sciences; Elsevier: Amsterdam, The Netherlands, 2014. [Google Scholar] [CrossRef]
  25. Tan, K.C.; San Lim, H.; MatJafri, M.Z.; Abdullah, K. A comparison of radiometric correction techniques in the evaluation of the relationship between LST and NDVI in Landsat imagery. Environ. Monit. Assess. 2011, 184, 3813–3829. [Google Scholar] [CrossRef]
  26. Kobayashi, S.; Sanga-Ngoie, K. The integrated radiometric correction of optical remote sensing imageries. Int. J. Remote Sens. 2008, 29, 5957–5985. [Google Scholar] [CrossRef]
  27. Kumar, L.; Mutanga, O. Google Earth Engine Applications Since Inception: Usage, Trends, and Potential. Remote Sens. 2018, 10, 1509. [Google Scholar] [CrossRef] [Green Version]
  28. Gorelick, N.; Hancher, M.; Dixon, M.; Ilyushchenko, S.; Thau, D.; Moore, R. Google Earth Engine: Planetary-scale geospatial analysis for everyone. Remote Sens. Environ. 2017, 202, 18–27. [Google Scholar] [CrossRef]
  29. Sharp, R.; Tallis, H.T.; Ricketts, T.; Guerry, A.D.; Wood, S.A.; Chaplin-Kramer, R.; Nelson, E.; Ennaanay, D.; Wolny, S.; Olwero, N.; et al. InVEST +VERSION+ User’s Guide. The Natural Capital Project, Stanford University, University of Minnesota, The Nature Conservancy, and World Wildlife Fund. 2018. Available online: https://invest-userguide.readthedocs.io/_/downloads/en/3.5.0/pdf/ (accessed on 8 September 2022).
  30. Davids, J.C.; Rutten, M.M.; Shah, R.D.T.; Shah, D.N.; Devkota, N.; Izeboud, P.; Pandey, A.; van de Giesen, N. Quantifying the connections—Linkages between land-use and water in the Kathmandu Valley, Nepal. Environ. Monit. Assess. 2018, 190, 301. [Google Scholar] [CrossRef] [Green Version]
  31. Kozovits, A.R.; Bustamante, M. Land use change, air pollution and climate change—Vegetation response in Latin America. Dev. Environ. Sci. 2013, 13, 411–427. [Google Scholar] [CrossRef]
  32. Heald, C.L.; Spracklen, D.V. Land Use Change Impacts on Air Quality and Climate. J. Chem. Rev. 2015, 115, 4476–4496. [Google Scholar] [CrossRef] [Green Version]
  33. Taati, A.; Sarmadian, F.; Mousavi, A.; Pour, C.T.H.; Shahir, A.H.E. Land use classification using support vector machine and maximum likelihood algorithms by Landsat 5 TM images. Walailak J. Sci. Technol. (WJST) 2015, 12, 681–687. [Google Scholar] [CrossRef]
  34. Upadhyay, A.; Shetty, A.; Singh, S.K.; Siddiqui, Z. Land use and land cover classification of LISS-III satellite image using KNN and decision tree. In Proceedings of the 2016 3rd International Conference on Computing for Sustainable Global Development, New Delhi, India, 16–18 March 2016; pp. 1277–1280. [Google Scholar]
  35. Rodriguez-Galiano, V.F.; Ghimire, B.; Rogan, J.; Chica-Olmo, M.; Rigol-Sanchez, J.P. An assessment of the effectiveness of a random forest classifier for land-cover classification. ISPRS J. Photogramm. Remote Sens. 2012, 67, 93–104. [Google Scholar] [CrossRef]
  36. Richards, J.A. (Ed.) Supervised Classification Techniques. In Remote Sensing Digital Image Analysis; Springer: Cham, Switzerland, 2022; pp. 263–367. [Google Scholar] [CrossRef]
  37. Perumal, K.; Bhaskaran, K. Supervised Classification Performance of Multispectral Images. J. Comput. 2010, 2, 124–129. [Google Scholar] [CrossRef]
  38. Haack, B.N.; Rafter, A. Urban growth analysis and modeling in the Kathmandu Valley, Nepal. Habitat Int. 2006, 30, 1056–1065. [Google Scholar] [CrossRef]
  39. UN DESA. World Urbanization Prospects: 2014 Revision; United Nations Department of Economic and Social Affairs: New York, NY, USA, 2014; Available online: https://www.un.org/en/development/desa/publications/2014-revision-world-urbanization-prospects.html (accessed on 1 April 2022).
  40. DHM. Climate Normals, Department of Hydrology and Meteorology, Babarmahal, Kathmandu. 2022. Available online: https://dhm.gov.np/uploads/climatic/1805982474Climate%20Normal%201991-2020.pdf?fbclid=IwAR3dEwOkiY3e3z4Q6tGfBbmqy8aTkMZW46Z0hgGO8_XVPMTqBNhWnstXTTQ (accessed on 1 April 2022).
  41. Bhuju, U.R.; Shakya, P.R.; Basnet, T.B.; Shrestha, S. Nepal Biodiversity Resource Book: Protected Areas, Ramsar Sites, and World Heritage Sites; International Centre for Integrated Mountain Development (ICIMOD): Kathmandu, Nepal, 2007. [Google Scholar]
  42. CBS. Preliminary Report of Census 2021; Central Bureau of Statistics: Kathmandu, Nepal, 2021. Available online: https://censusnepal.cbs.gov.np/Home/Details?tpid=1 (accessed on 22 August 2022).
  43. US Geological Survey. Landsat Collection 2 level- 3 science products. 2022. Available online: https://www.usgs.gov/landsat-missions/landsat-collection-2 (accessed on 22 August 2022).
  44. Government of Nepal. Kathmandu District Boundary. National Spatial Data Center: Geoportal. Ministry of Land Management, Cooperatives and Poverty Alleviation, Survey Department. 2022. Available online: https://nationalgeoportal.gov.np/#/ (accessed on 15 July 2022).
  45. Google Earth. Kathmandu district, 277172° N, 853240° E, 1400 m. 2022. Available online: https://www.google.com/earth/index.html (accessed on 1 September 2022).
  46. Huang, H.; Chen, Y.; Clinton, N.; Wang, J.; Wang, X.; Liu, C.; Zhu, Z. Mapping major land cover dynamics in Beijing using all Landsat images in Google Earth Engine. Remote Sens. Environ. 2017, 202, 166–176. [Google Scholar] [CrossRef]
  47. Braun, M.; Herold, M. Mapping imperviousness using NDVI and linear spectral unmixing of ASTER data in the Cologne-Bonn region (Germany). In Remote Sensing for Environmental Monitoring, GIS Applications, and Geology, 3rd ed.; SPIE: St. Bellingham, WA, USA, 2004; Volume 5239, pp. 274–284. [Google Scholar]
  48. Singh, K.V.; Setia, R.; Sahoo, S.; Prasad, A.; Pateriya, B. Evaluation of NDWI and MNDWI for assessment of waterlogging by integrating digital elevation model and groundwater level. Geocarto Int. 2015, 30, 650–661. [Google Scholar] [CrossRef]
  49. Ge, G.; Shi, Z.; Zhu, Y.; Yang, X.; Hao, Y. Land use/cover classification in an arid desert-oasis mosaic landscape of China using remote sensed imagery: Performance assessment of four machine learning algorithms. Glob. Ecol. Conserv. 2020, 22, e00971. [Google Scholar] [CrossRef]
  50. Pal, M. Random forest classifier for remote sensing classification. Int. J. Remote Sens. 2005, 26, 217–222. [Google Scholar] [CrossRef]
  51. Maingi, J.K.; Kepner, S.E.; Edmonds, W.G. Accuracy Assessment of 1992 Landsat-MSS Derived Land Cover for the Upper San Pedro Watershed (US/Mexico); United States Environmental Protection Agency: Washington, DC, USA, 2002; p. 29. [Google Scholar]
  52. Manonmani, R.; Suganya, G.M.D. Remote sensing and GIS application in change detection study in urban zone using multi temporal satellite. Int. J. Geom. Geos. 2010, 1, 60–65. [Google Scholar]
  53. Congalton, R.G.; Green, K. Assessing the Accuracy of Remotely Sensed Data: Principles and Practices, 2nd ed.; Taylor and Francis Group, LLC: Abingdon, UK, 2009. [Google Scholar] [CrossRef]
  54. InVest. Integrated valuation of ecosystem services and tradeoffs. 2022. Available online: https://invest.readthedocs.io/en/latest/ (accessed on 10 October 2022).
  55. Anderson, J.R. A Land Use and Land Cover Classification System for Use with Remote Sensor Data; US Government Printing Office: Washington, DC, USA, 1976; Volume 964. Available online: https://pubs.usgs.gov/pp/0964/report.pdf (accessed on 12 September 2022).
  56. Campbell, J.B. Introduction to Remote Sensing, 3rd ed.; The Guilford Press: New York, NY, USA, 2002. [Google Scholar]
  57. Pradhan, P.K. Population Growth, Migration and Urbanisation. Environmental Consequences in Kathmandu Valley, Nepal. In Environmental Change and its Implications for Population Migration; Unruh, J.D., Krol, M.S., Kliot, N., Eds.; Springer: Dordrecht, Germany, 2004; pp. 177–179. [Google Scholar] [CrossRef]
  58. Khanal, N.; Uddin, K.; Matin, M.A.; Tenneson, K. Automatic Detection of Spatiotemporal Urban Expansion Patterns by Fusing OSM and Landsat Data in Kathmandu. Remote. Sens. 2019, 11, 2296. [Google Scholar] [CrossRef] [Green Version]
  59. Rijal, S.; Rimal, B.; Acharya, R.P.; Stork, N.E. Land use/land cover change and ecosystem services in the Bagmati River Basin, Nepal. Environ. Monit. Assess. 2021, 193, 651. [Google Scholar] [CrossRef]
  60. Paudel, B.; Zhang, Y.-L.; Li, S.-C.; Liu, L.-S.; Wu, X.; Khanal, N.R. Review of studies on land use and land cover change in Nepal. J. Mt. Sci. 2016, 13, 643–660. [Google Scholar] [CrossRef]
  61. Rimal, B.; Sloan, S.; Keshtkar, H.; Sharma, R.; Rijal, S.; Shrestha, U.B. Patterns of Historical and Future Urban Expansion in Nepal. Remote Sens. 2020, 12, 628. [Google Scholar] [CrossRef] [Green Version]
  62. Appiah, D.O.; Schröder, D.; Forkuo, E.K.; Bugri, J.T. Application of Geo-Information Techniques in Land Use and Land Cover Change Analysis in a Peri-Urban District of Ghana. ISPRS Int. J. Geo-Inf. 2015, 4, 1265–1289. [Google Scholar] [CrossRef] [Green Version]
  63. Yaakob, U.; Masron, T.; Masami, F. Ninety years of urbanization in Malaysia: A geographical investigation of its trends and characteristics. J. Rits. Soc. Sci. Hum. 2010, 4, 79–101. [Google Scholar]
  64. Halmy, M.W.A.; Gessler, P.E.; Hicke, J.A.; Salem, B.B. Land use/land cover change detection and prediction in the north-western coastal desert of Egypt using Markov-CA. Appl. Geogr. 2015, 63, 101–112. [Google Scholar] [CrossRef]
  65. Antrop, M. Landscape change and the urbanization process in Europe. Landsc. Urban Plan 2004, 67, 9–26. [Google Scholar] [CrossRef]
  66. Thapa, R.B. Spatial Process of Urbanization in Kathmandu Valley, Nepal. Ph. D. Dissertation, Graduate School of life and Environmental Sciences, The Univesrity of Tsukuba, Kathmandu Valley, Nepal, 2009. Available online: http://giswin.geo.tsukuba.ac.jp/sis/thesis/rbthapa.pdf (accessed on 1 September 2022).
  67. Schiavina, M.; Melchiorri, M.; Corbane, C.; Freire, S.; Batista e Silva, F. Built-up areas are expanding faster than population growth: Regional patterns and trajectories in Europe. J. Land Use Sci. 2022, 17, 591–608. [Google Scholar] [CrossRef]
  68. Xu, G.; Dong, T.; Cobbinah, P.B.; Jiao, L.; Sumari, N.S.; Chai, B.; Liu, Y. Urban expansion and form changes across African cities with a global outlook: Spatiotemporal analysis of urban land densities. J. Clean. Prod. 2019, 224, 802–810. [Google Scholar] [CrossRef]
  69. McCarthy, M.P.; Best, M.J.; Betts, R.A. Climate change in cities due to global warming and urban effects. Geophys. Res. Lett. 2010, 37, L09705. [Google Scholar] [CrossRef] [Green Version]
  70. Szabo, S. Urbanisation and Food Insecurity Risks: Assessing the Role of Human Development. Oxf. Dev. Stud. 2016, 44, 28–48. [Google Scholar] [CrossRef] [Green Version]
  71. Krayenhoff, E.S.; Moustaoui, M.; Broadbent, A.M.; Gupta, V.; Georgescu, M. Diurnal interaction between urban expansion, climate change and adaptation in US cities. Nat. Clim. Chang. 2018, 8, 1097–1103. [Google Scholar] [CrossRef]
  72. Strokal, M.; Bai, Z.; Franssen, W.; Hofstra, N.; Koelmans, A.A.; Ludwig, F.; Ma, L.; van Puijenbroek, P.; Spanier, J.E.; Vermeulen, L.C.; et al. Urbanization: An increasing source of multiple pollutants to rivers in the 21st century. npj Urban Sustain. 2021, 1, 24. [Google Scholar] [CrossRef]
  73. Shrestha, B.K. Housing provision in the Kathmandu Valley: Public agency and private sector initiation. Urbani izziv 2010, 21, 85–95. [Google Scholar] [CrossRef]
  74. Rana, S.; Marwasta, D. Urbanisation trends in developing countries: Comparative study of Yogyakarta City and Kathmandu Valley. J. Nat. Resour. Dev. 2015, 5, 29–36. [Google Scholar] [CrossRef] [Green Version]
  75. Shrestha, K.B.; Thapa, B.R.; Aihara, Y.; Shrestha, S.; Bhattarai, A.P.; Bista, N.; Kazama, F.; Shindo, J. Hidden Cost of Drinking Water Treatment and Its Relation with Socioeconomic Status in Nepalese Urban Context. Water 2018, 10, 607. [Google Scholar] [CrossRef] [Green Version]
  76. Gautam, D.; Prajapati, R.N. Drawdown and Dynamics of Groundwater Table in Kathmandu Valley, Nepal. Open Hydrol. J. 2014, 8, 17–26. [Google Scholar] [CrossRef]
  77. Mishra, B.K.; Regmi, R.K.; Masago, Y.; Fukushi, K.; Kumar, P.; Saraswat, C. Assessment of Bagmati river pollution in Kathmandu Valley: Scenario-based modeling and analysis for sustainable urban development. Sustain. Water Qual. Ecol. 2017, 9, 67–77. [Google Scholar] [CrossRef]
  78. Shrestha, R.A.; Huang, X.; Sillanpää, M. Effects of urbanization on water quality of the Bagmati river in Kathmandu valley. Nepal. Stud. Ori. Elec. 2011, 109, 141–150. [Google Scholar]
  79. Pal, K.B.; Pant, R.R.; Rimal, B.; Mishra, A.D. Comparative assessment of water quality in the Bagmati River basin, Nepal. ZOO-J. 2019, 5, 68–78. [Google Scholar] [CrossRef]
  80. Thapa, K.; Shrestha, S.M.; Rawal, D.S.; Pant, B.R. Quality of drinking water in Kathmandu valley, Nepal. Sustain. Water Resour. Manag. 2019, 5, 1995–2000. [Google Scholar] [CrossRef]
  81. Upreti, B.R.; Breu, T.; Ghale, Y. New Challenges in Land Use in Nepal: Reflections on the Booming Real-estate Sector in Chitwan and Kathmandu Valley. Scott. Geogr. J. 2017, 133, 69–82. [Google Scholar] [CrossRef]
  82. Lamichhane, S.; Shakya, N.M. Land Use Land Cover (LULC) Change Projection in Kathmandu Valley using the CLUE-S Model. J. Adv. Coll. Eng. Manag. 2021, 6, 221–233. [Google Scholar] [CrossRef]
  83. Chen, C.; Park, T.; Wang, X.; Piao, S.; Xu, B.; Chaturvedi, R.K.; Fuchs, R.; Brovkin, V.; Ciais, P.; Fensholt, R.; et al. China and India lead in greening of the world through land-use management. Nat. Sustain. 2019, 2, 122–129. [Google Scholar] [CrossRef]
  84. Ning, J.; Liu, J.; Kuang, W.; Xu, X.; Zhang, S.; Yan, C.; Li, R.; Wu, S.; Hu, Y.; Du, G.; et al. Spatiotemporal patterns and characteristics of land-use change in China during 2010–2015. J. Geogr. Sci. 2018, 28, 547–562. [Google Scholar] [CrossRef]
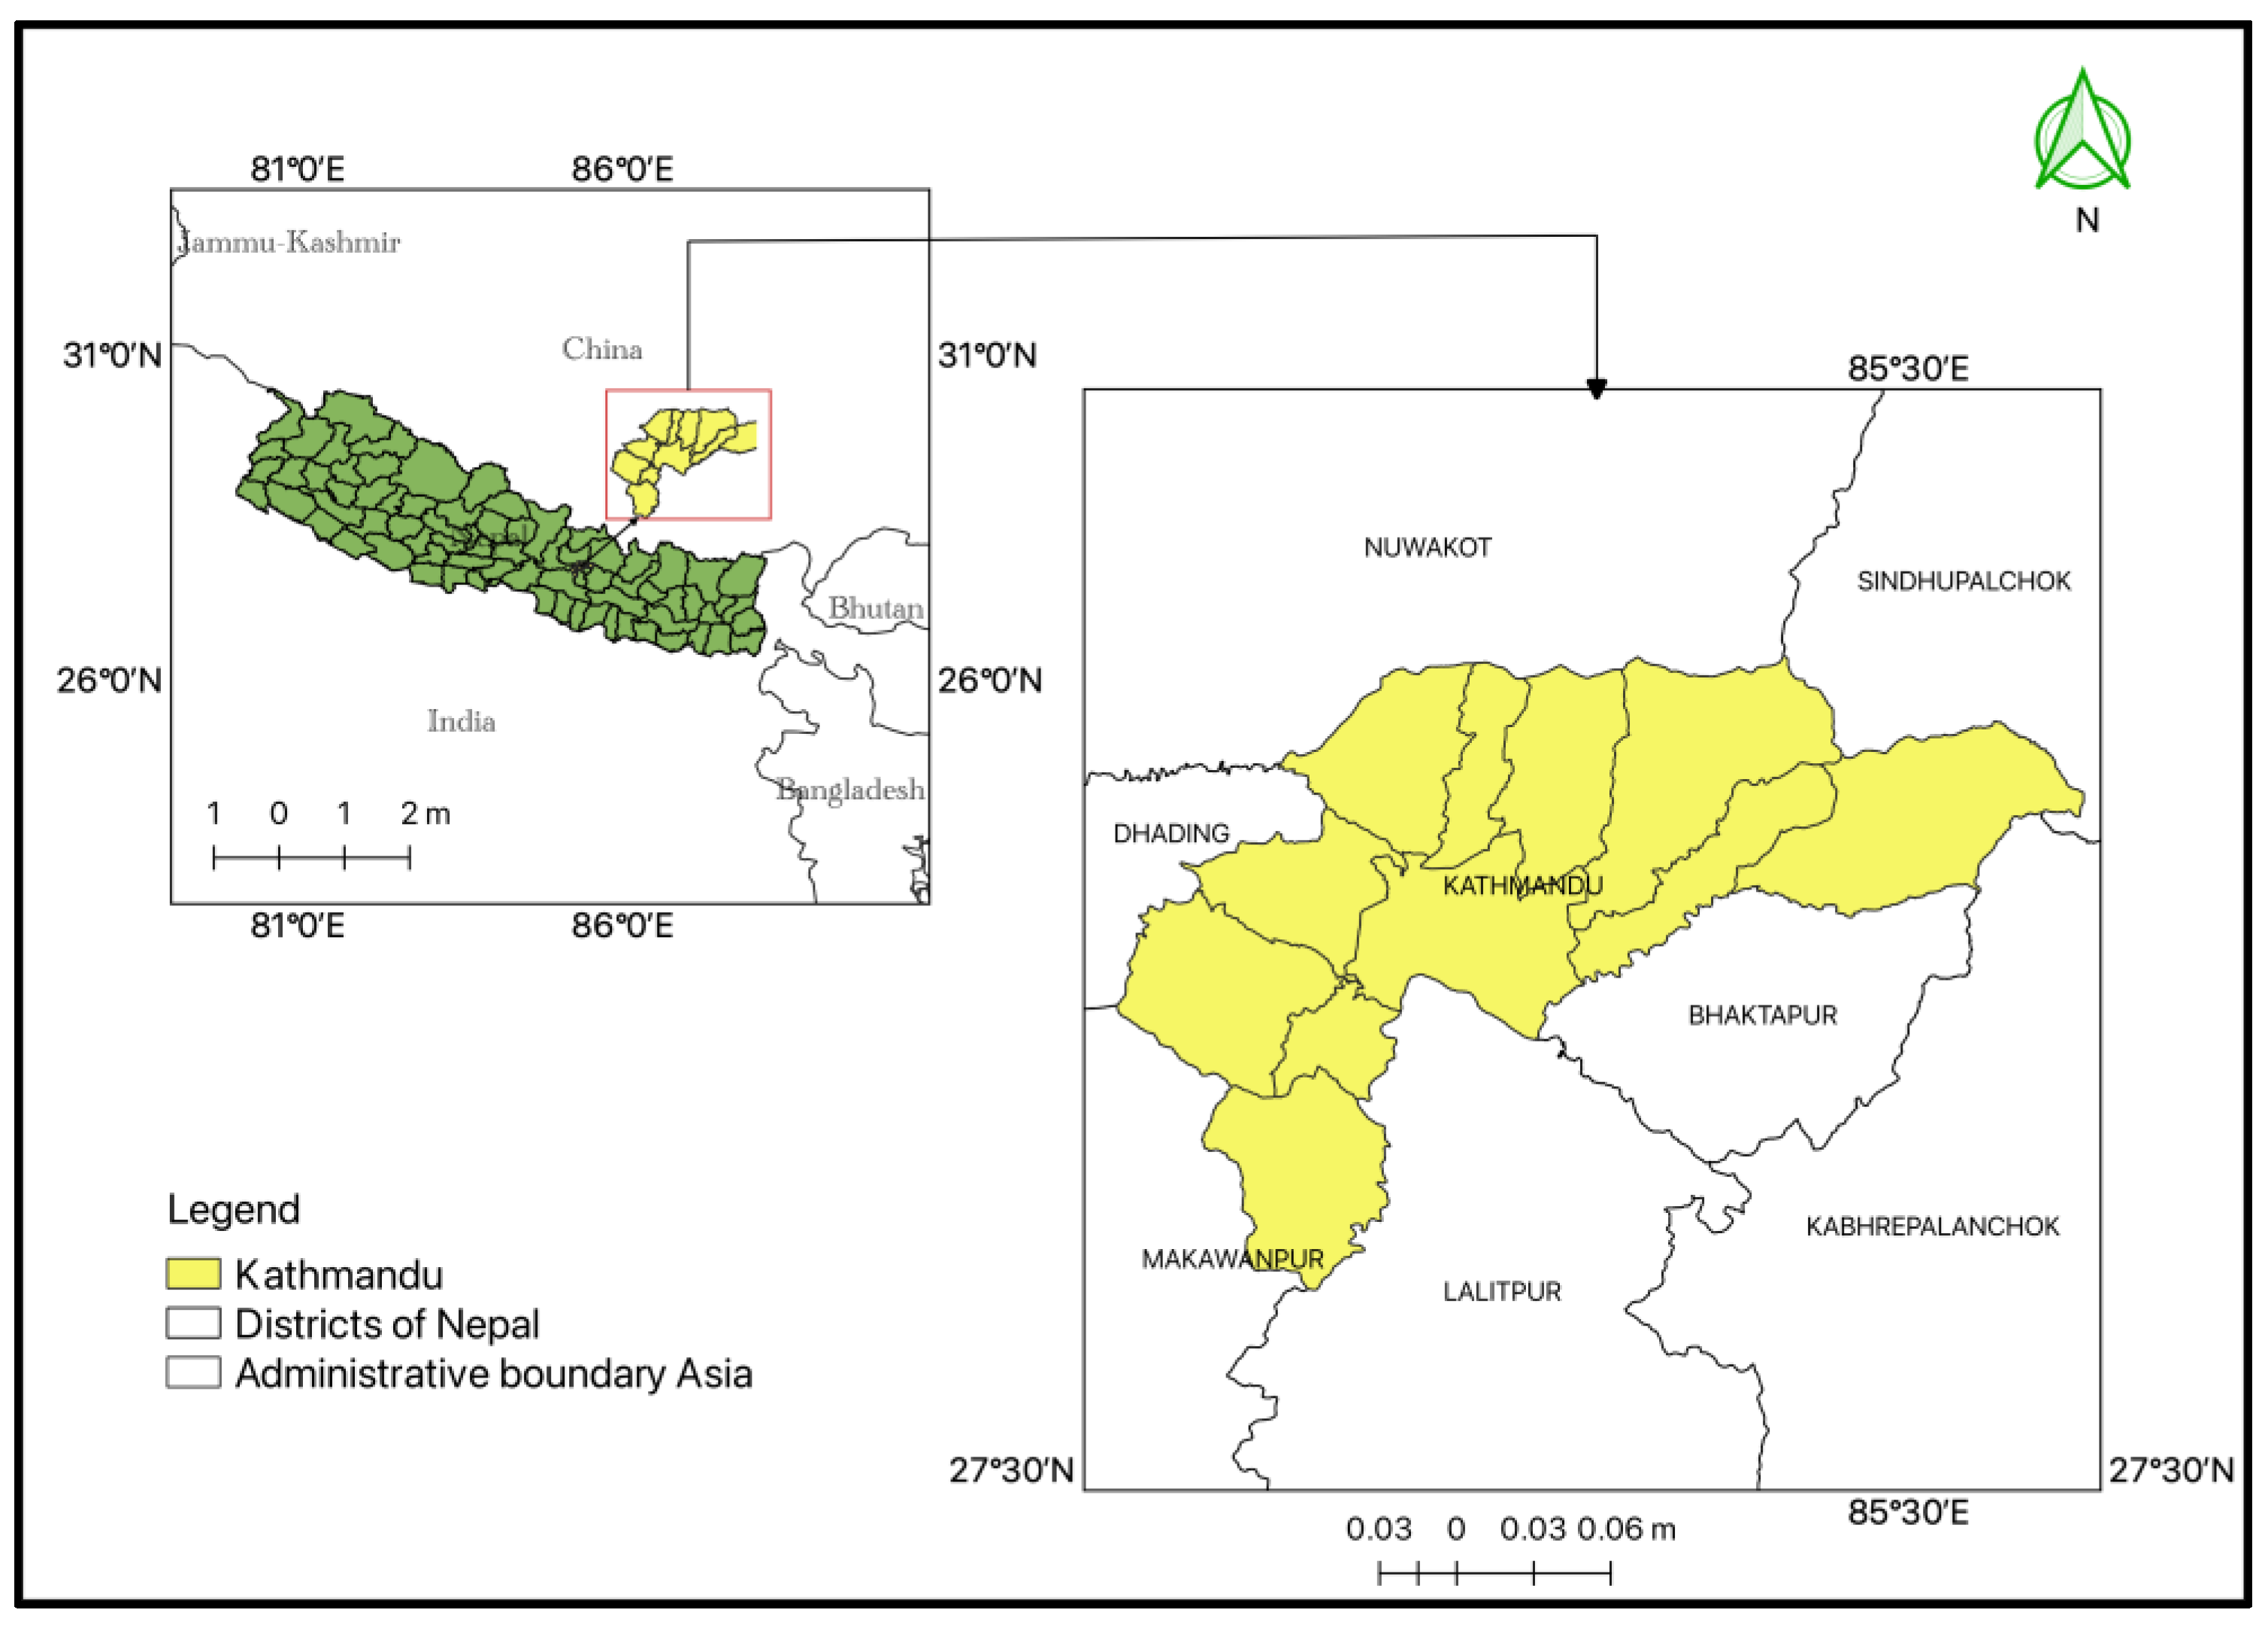
Figure 1. Map showing study area (Kathmandu district).
Land 12 00025 g001
Figure 2. Flow diagram showing methodology.
Land 12 00025 g002
Figure 3. Land cover map of year 2001.
Land 12 00025 g003
Figure 4. Land cover map for year 2011.
Land 12 00025 g004
Figure 5. Land cover map for year 2021.
Land 12 00025 g005
Figure 6. Extension of built-up area over 20 years in Kathmandu.
Land 12 00025 g006
Figure 7. Probable extension of built-up areas; generated through scenario modeling.
Land 12 00025 g007
Table 1. Data used for land-cover analysis.
DataSourceSpatial Resolution Date
LANDSAT 8 Surface Reflectance Collection 2 Tier 1 US Geological Survey (USGS) [43] 30 m 2021
LANDSAT 5 Surface Reflectance Collection 2 Tier 1USGS [43]30 m 2011
2001
Kathmandu district boundary (shape file)Government of Nepal, Survey Department [44] -2021
Reference pointsGoogle Earth Pro [45]15 cm–15 m2021
2011
2001
Table 2. Total number of images imported in Google Earth Engine for classification.
YearNumber of Images
202118
201115
20017
Table 3. Formulae to calculate indices.
Spectral IndicesFormula
Normalized Difference Vegetation Index (NDVI) N I R     R e d N I R   +   R e d
Enhanced vegetation index (EVI) 2.5 [ N I R     R e d { ( N I R   +   R e d     6 )     ( B l u e     7.5   +   1 ) } ]
Normalized difference built-up index (NDBI) S W I R     N I R S W I R   +   N I R
Built-up areas (BU) N D B I     N D V I
Modified normalized difference water index (MNDWI) G r e e n     S W I R G r e e n   +   S W I R
Table 4. Formulae for calculating accuracy metrics.
AccuracyFormulae
Overall accuracy N u m b e r   o f   c o r r e c t   c l a s s i f i e d   p i x e l s T o t a l   r e f e r e n c e   p o i n t s
Producer accuracy C o r r e c t   i m p e r v i o u s   s u r f a c e   p i x e l s T o t a   i m p e r v i o u s   p i x e l s
Consumer accuracy C o r r e c t   i m p e r v i o u s   s u r f a c e   p i x e l C o r r e c t   +   m i s c l a s s i f i e d   p i x e l
Kappa coefficient [53] i = 1 K nii     i = 1 K n i i ( G i C i ) n 2     i = 1 K n i i ( G i C i )
where
i = class number;
n = total number of classified pixels;
nii = number of correctly classified pixels in class i;
Ci = total number of classified pixels belonging to class i;
Gi = total number of actual data pixels of class i.
Table 5. Area covered by different land uses during years 2001, 2011 and 2021.
Land UseForest
(km2)
Agriculture
(km2)
Built-Up Area
(km2)
Green Space
(km2)
Surface Water Bodies
(km2)
Bare Land
(km2)
Year
2021177.97101.35117.478.524.653.60
2011187.33132.1484.694.824.480.14
2001215.95137.5050.021.105.683.31
Difference in 20 years−37.98−36.1567.457.42−1.030.29
Table 6. Overall accuracy and kappa coefficient of the classification.
Overall Training AccuracyKappa Coefficient
20210.990.99
20110.960.95
20011.001.00
Table 7. Consumer and producer accuracy of the classification.
YearAccuracyForestAgricultureBuilt-Up AreaGreen SpaceSurface WaterBare Land
2021CA0.9911111
PA111110.98
2011CA0.950.960.980.880.940.91
PA0.990.940.99111
2001CA111111
PA111111
Table 8. Transition from other land uses to built-up area.
Land Use2001–20112011–2021
Forest 1.20%1.86%
Agriculture19.71%25.80%
Green space10.27%7.77%
Surface water 0.08%0.05%
Bare land0.35%1.32%
Table 9. Land-use classes prone to transition to built-up area.
Land UseArea Prone to Transition
Forest 33.33 km2
Agriculture66.67 km2
Green space0.35 km2
Disclaimer/Publisher’s Note: The statements, opinions and data contained in all publications are solely those of the individual author(s) and contributor(s) and not of MDPI and/or the editor(s). MDPI and/or the editor(s) disclaim responsibility for any injury to people or property resulting from any ideas, methods, instructions or products referred to in the content.