

Assessing Changes in Land Use/Land Cover and Ecological Risk to Conserve Protected Areas in Urban–Rural Contexts


Abstract
1. Introduction
2. Methods
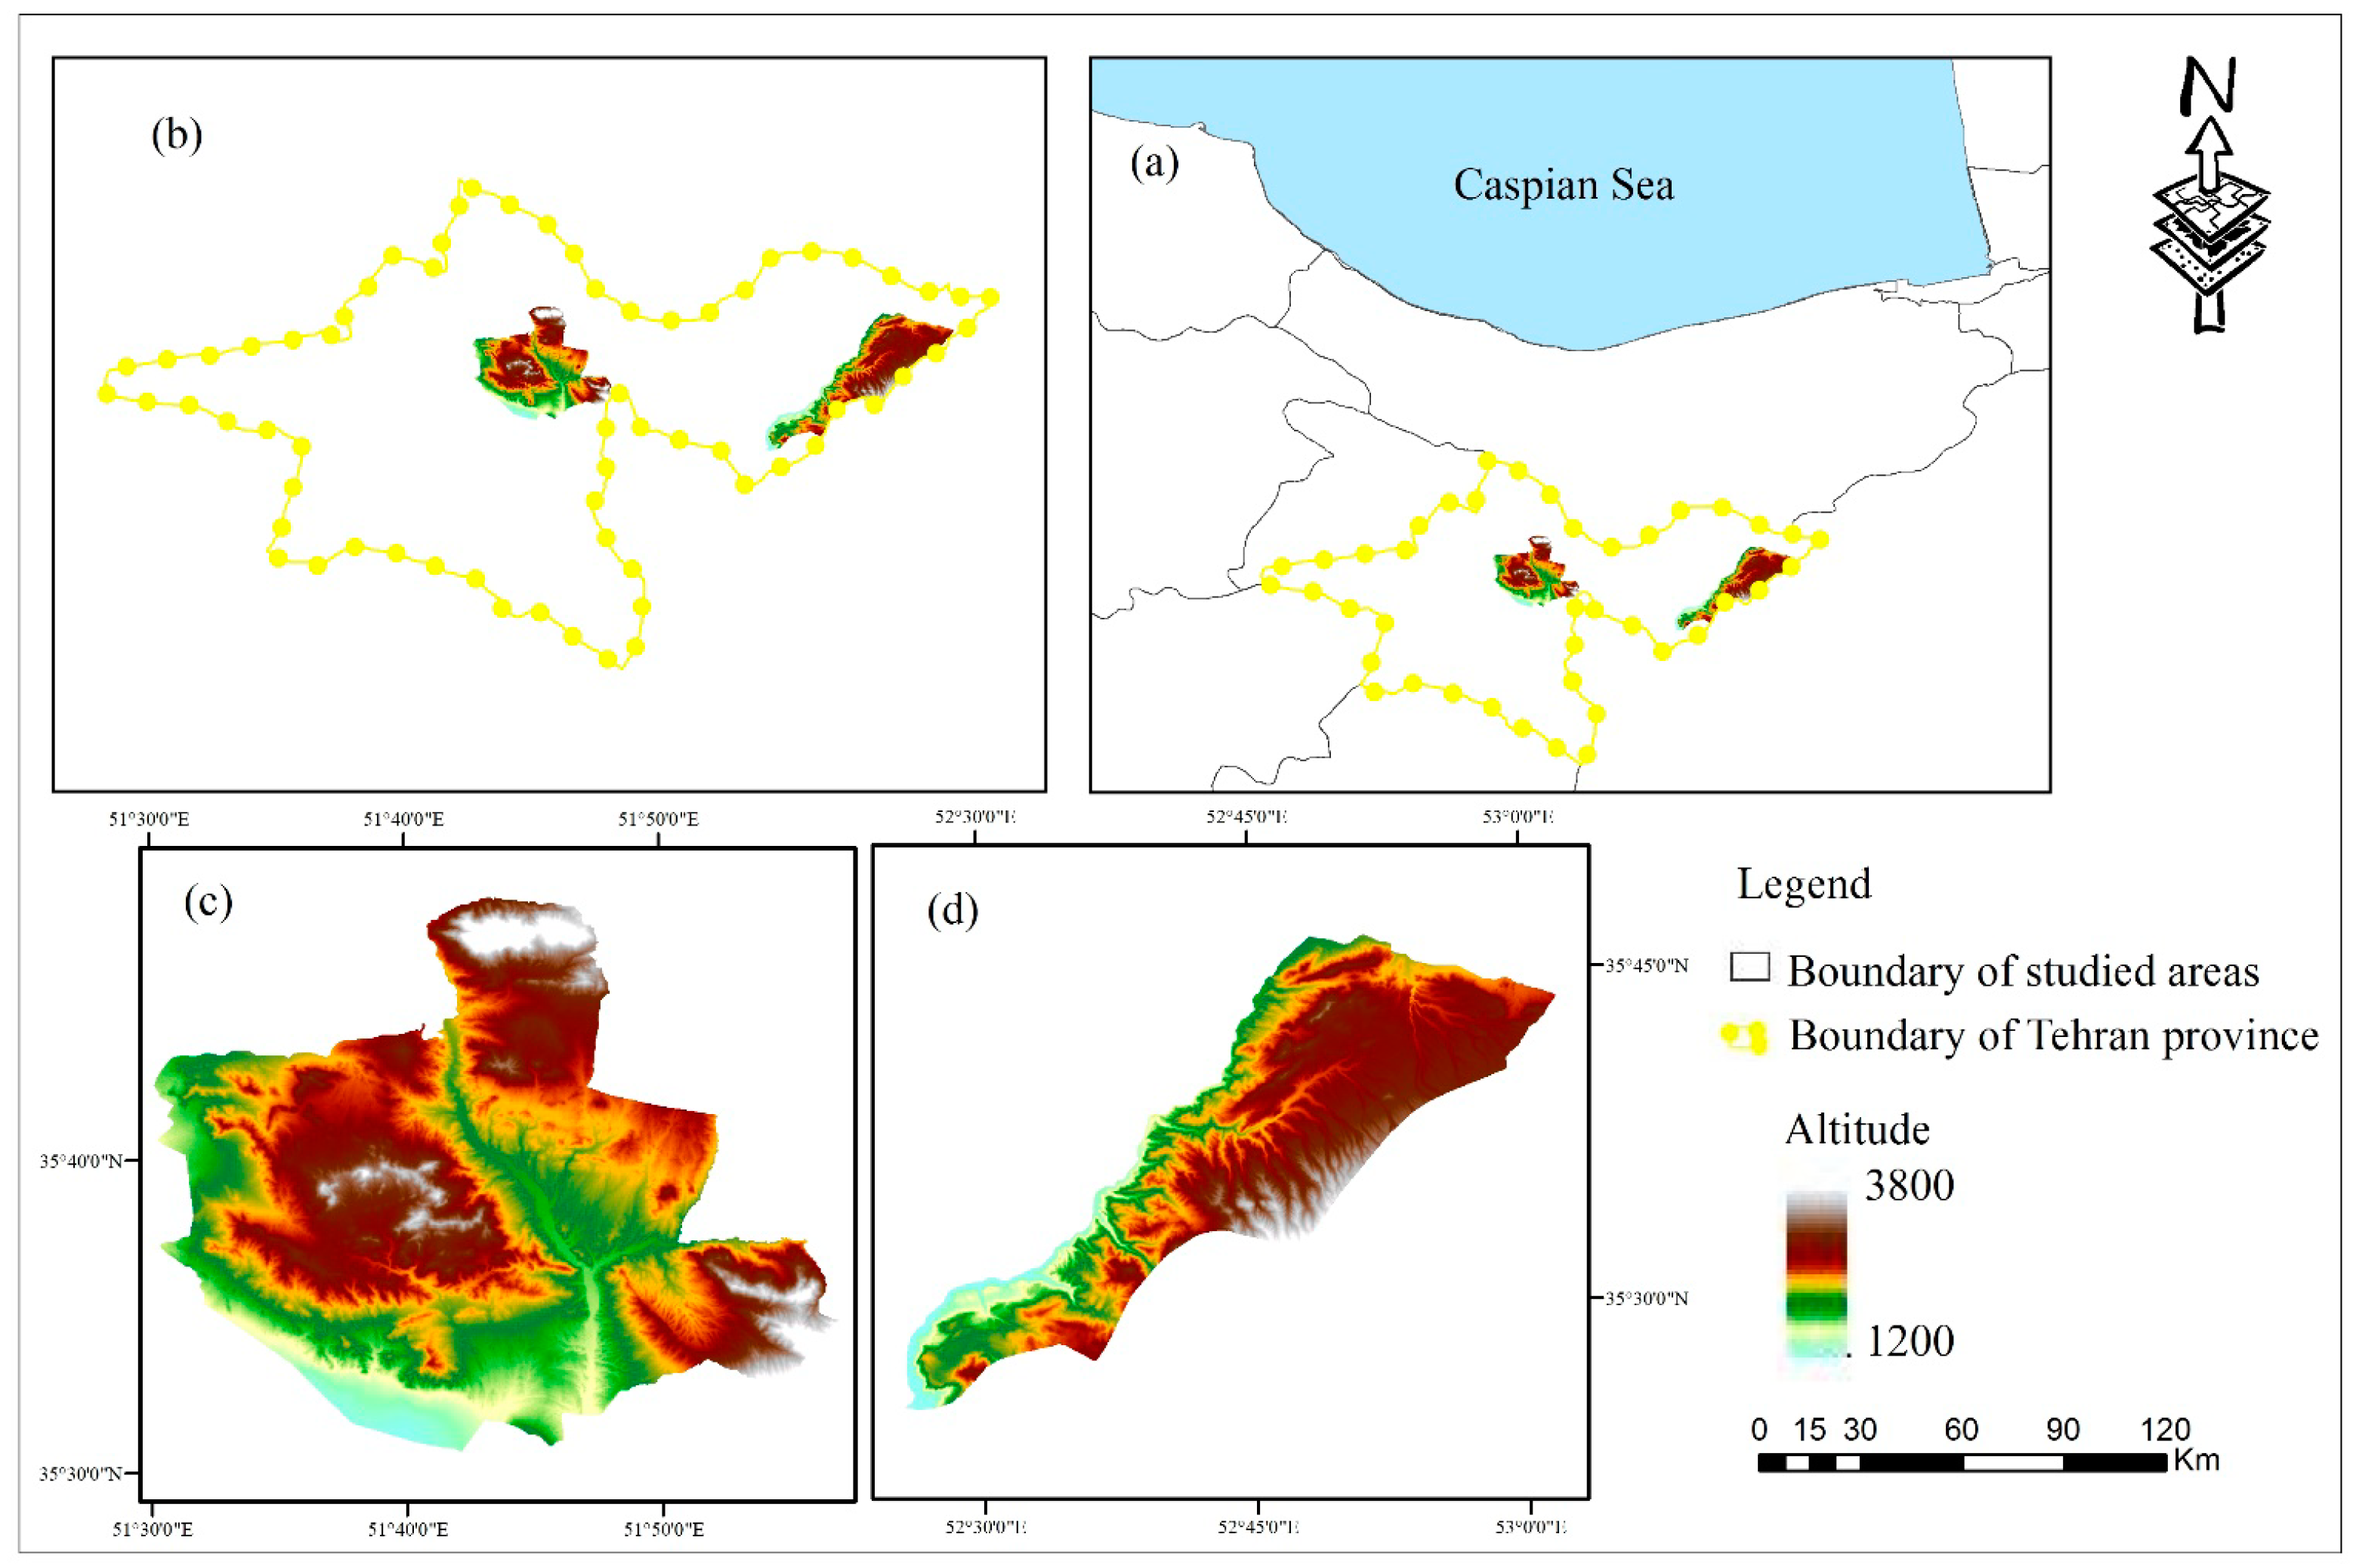
2.1. Study Areas
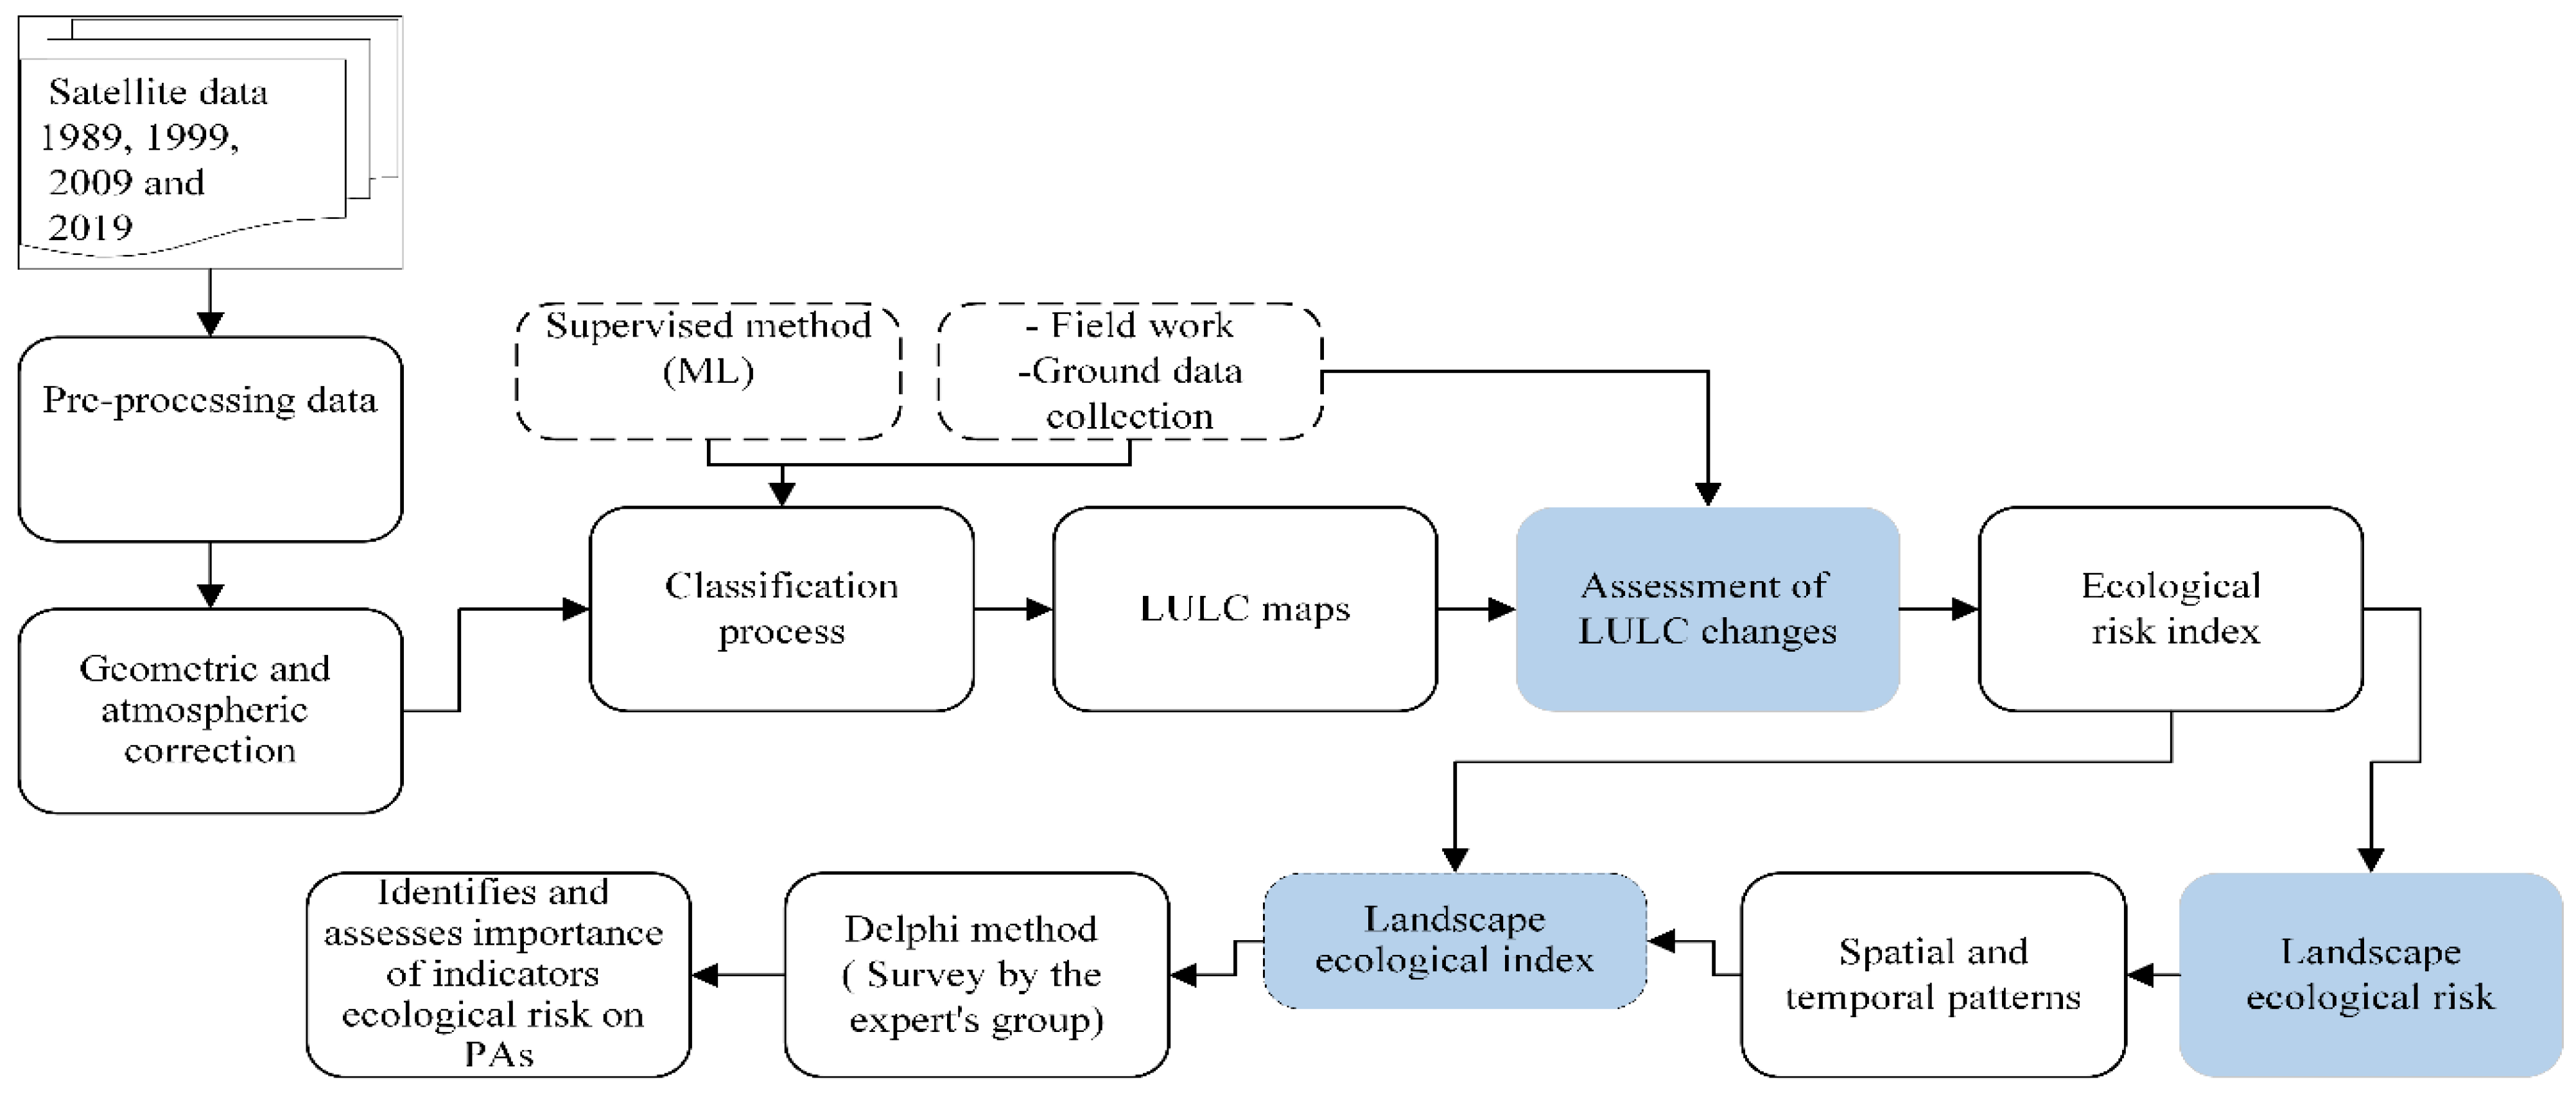
2.2. General Framework and Data
2.3. Data Collection and Classification of Satellite Data
2.4. Ecological Risk Index
2.5. Delphi Method
3. Results
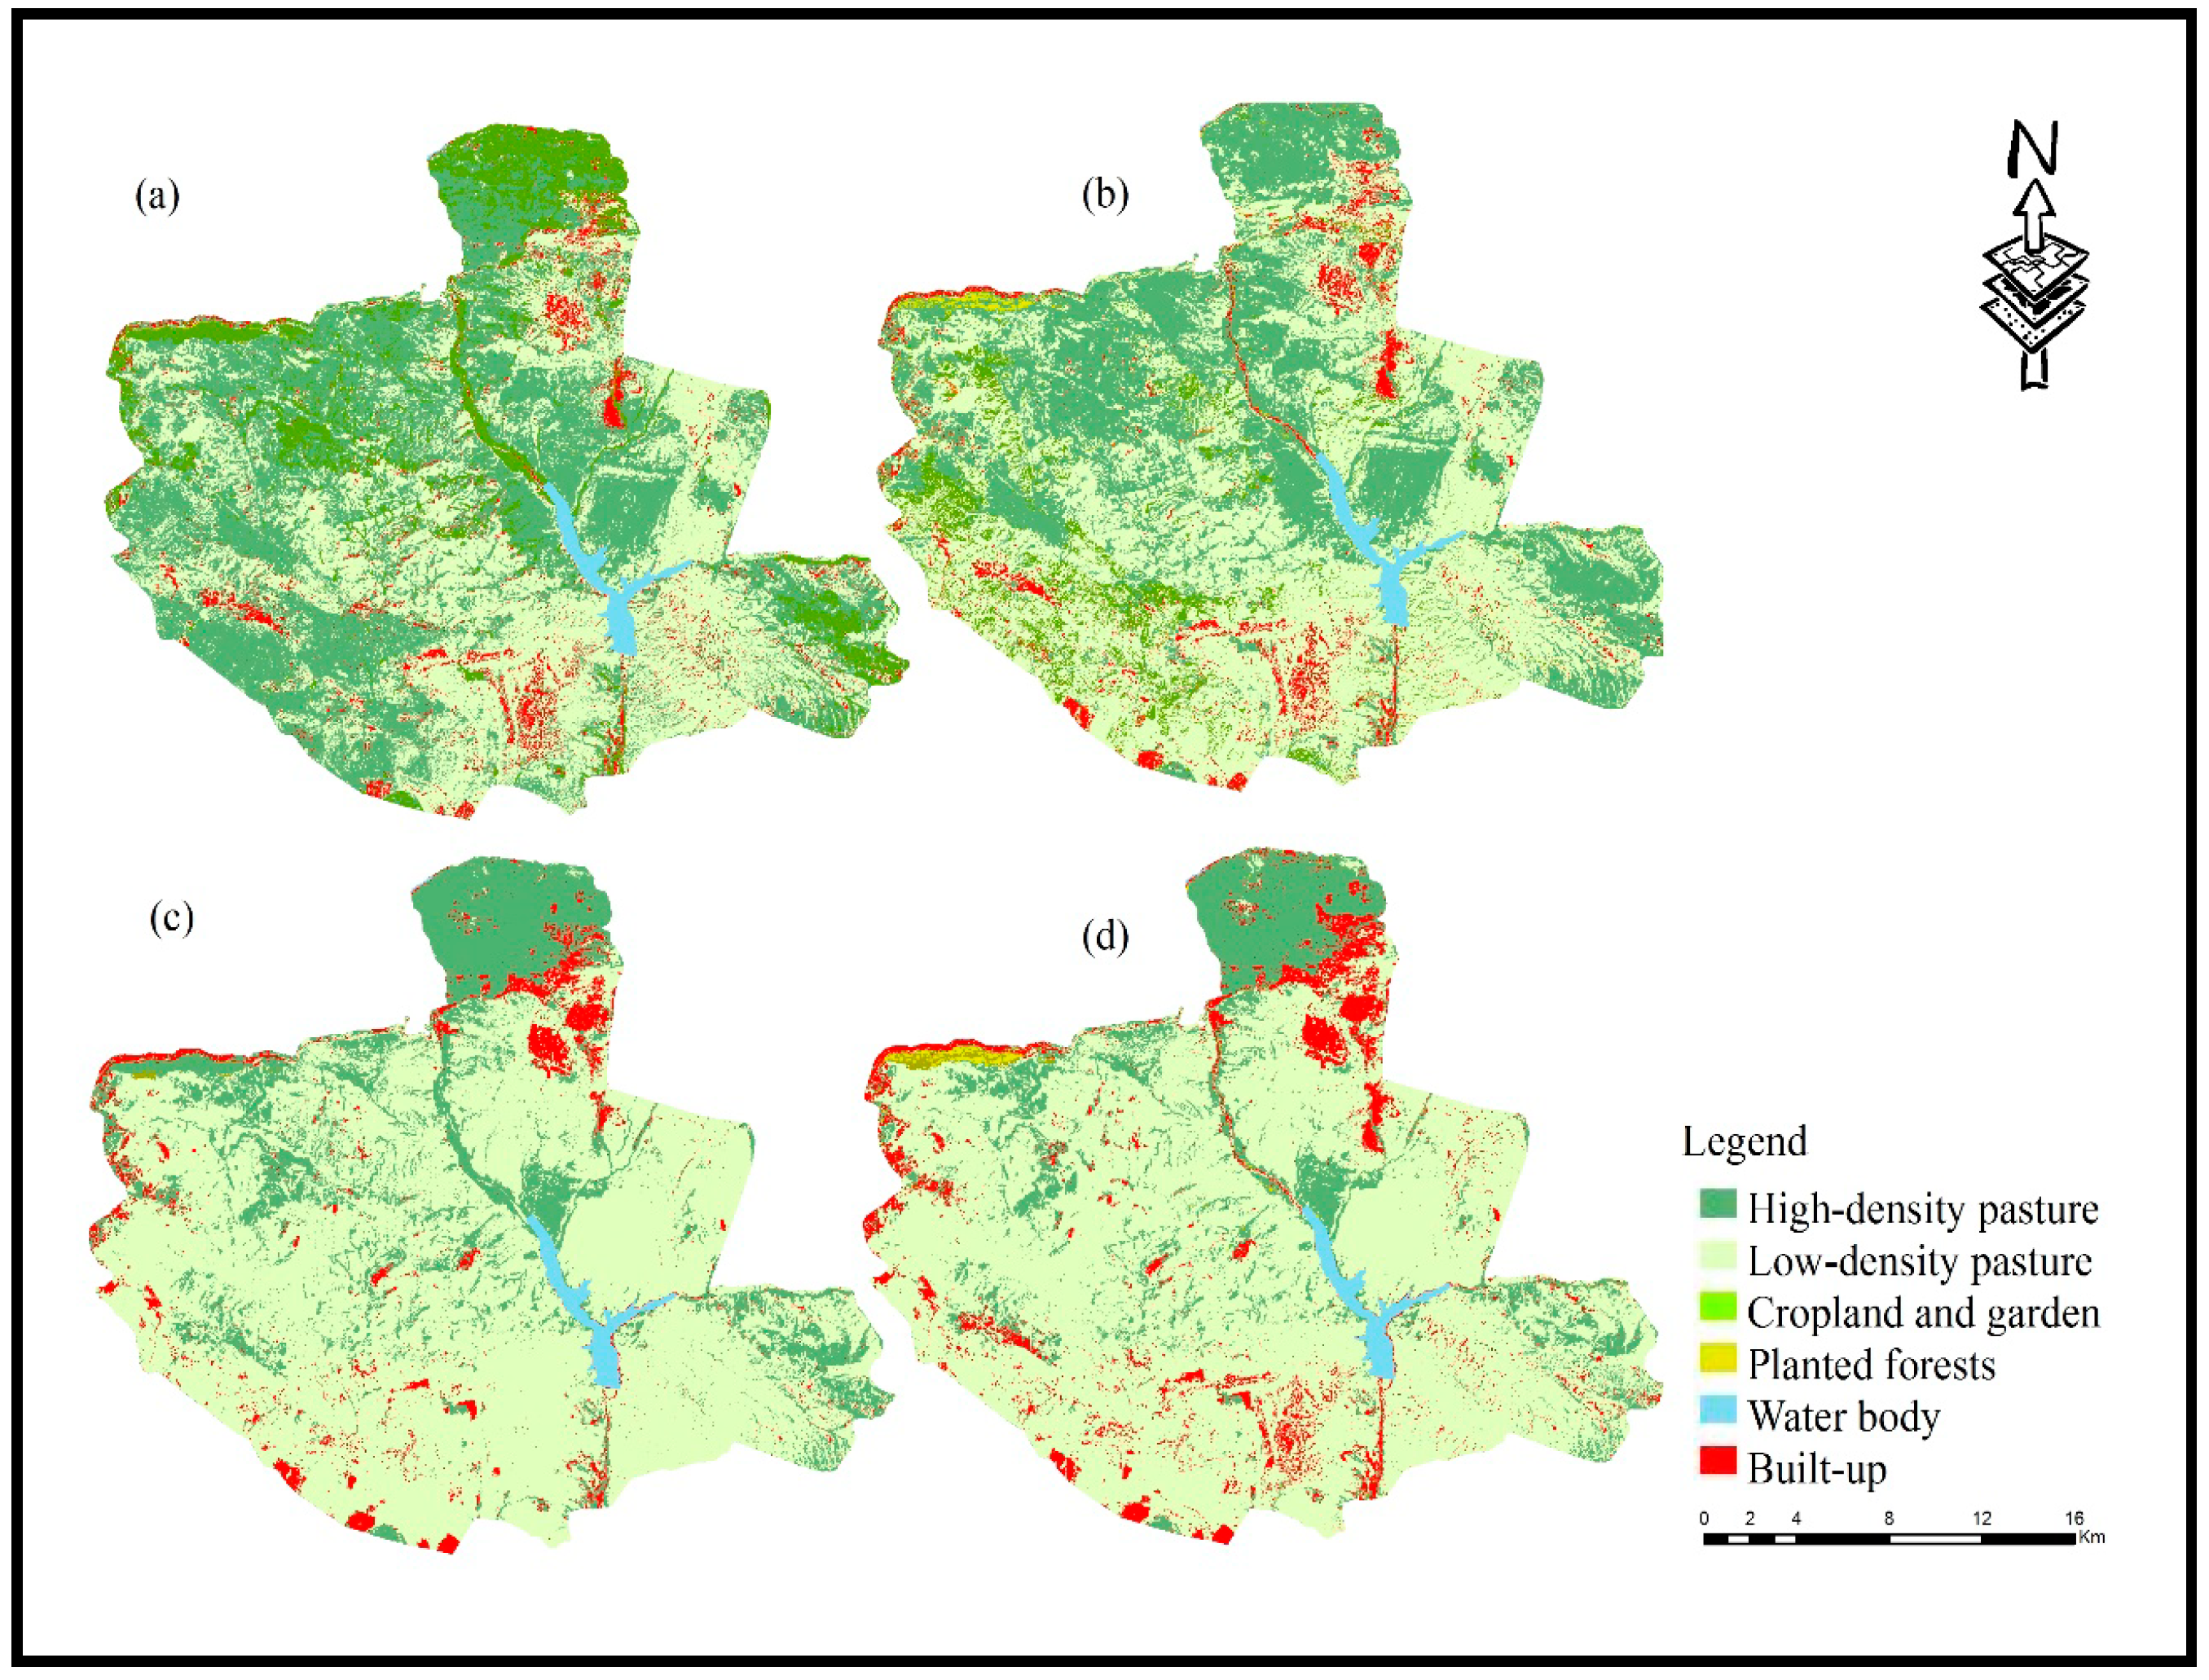
3.1. LULC Changes
3.2. Changes in the Landscape Indexes
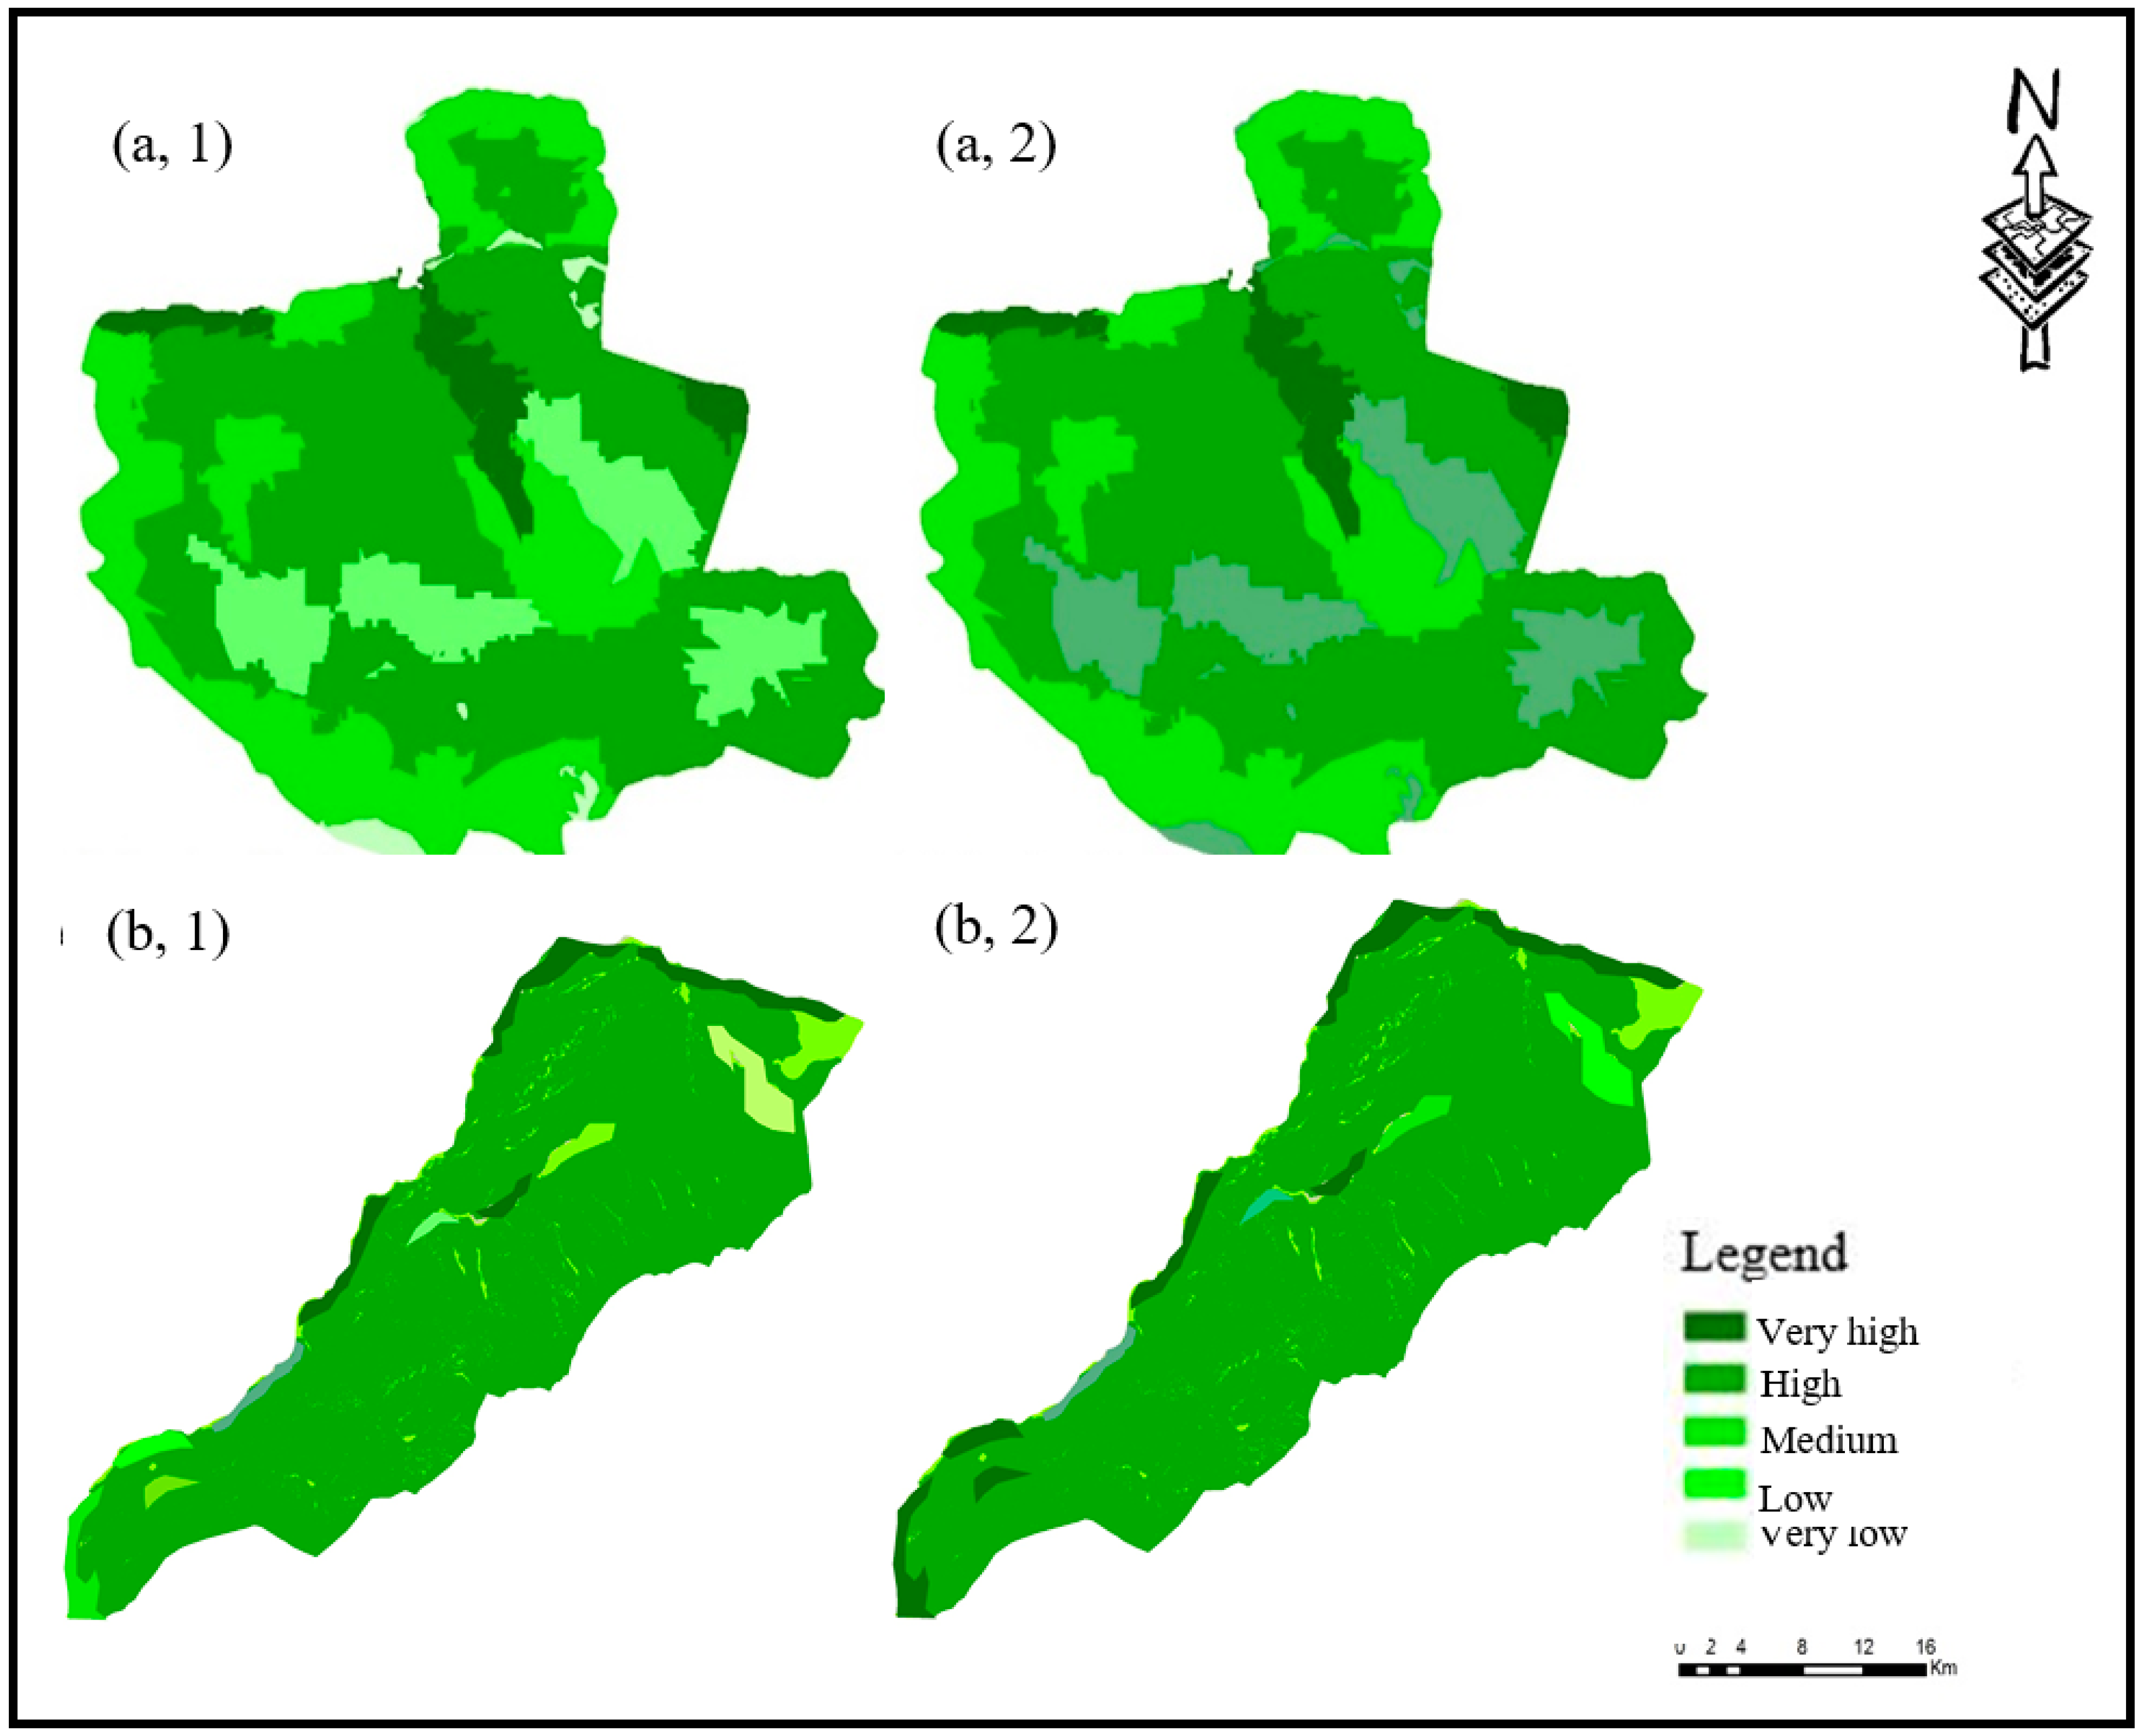
3.3. ER Index (ERI) Changes
3.4. Management Plans of PAs
3.5. ER Impacts
3.6. Assessment of Indicators Affected by ER
4. Discussion
5. Conclusions
Author Contributions
Funding
Institutional Review Board Statement
Informed Consent Statement
Data Availability Statement
Conflicts of Interest
References
- Sinha, S.; Chakraborty, S.; Goswami, S. Ecological footprint: An indicator of environmental sustainability of a surface coal mine. Environ. Dev. Sustain. 2016, 19, 807–824. [Google Scholar] [CrossRef]
- Lin, Y.Y.; Hu, X.S.; Zheng, X.X.; Hou, X.Y.; Zhang, Z.X.; Zhou, X.N. Spatial variations in the relationships between road network and landscape ecological risks in the highest forest coverage region of China. Ecol. Indic. 2019, 96, 392–403. [Google Scholar] [CrossRef]
- Bastakoti, R.C.; Bharati, L.; Bhattarai, U.; Wahid, S.M. Agriculture under changing climate conditions and adaptation options in the Koshi Basin. Clim. Dev. 2017, 9, 634–648. [Google Scholar] [CrossRef]
- Sobhani, P.; Esmaeilzadeh, H.; Mostafavi, H. Simulation and impact assessment of future land use and land cover changes in two protected areas in Tehran, Iran. Sustain. Cities Soc. 2021, 75, 103296. [Google Scholar] [CrossRef]
- Banko, G.; Wrbka, T.; Schmitzberger, I.; Zethner, G. Landscape Types as the Optimal Spatial Domain for Developing Landscape Indicators; Organization for Economic Co-operation and Development (OECD): Paris, France, 2003. [Google Scholar]
- Chen, X.; Vierling, L.; Deering, D. A simple and effective radiometric correction method to improve landscape change detection across sensors and across time. Remote Sens. Environ. 2005, 98, 63–79. [Google Scholar] [CrossRef]
- Matteucci, S.D.; Morello, J. Environmental consequences of exurban expansion in an agricultural area: The case of the Argentinian Pampas ecoregion. Urban Ecosyst. 2009, 12, 287–310. [Google Scholar] [CrossRef]
- Su, S.; Xiao, R.; Jiang, Z.; Zhang, Y. Characterizing landscape pattern and ecosystem service value changes for urbanization impacts at an eco-regional scale. Appl. Geogr. 2012, 34, 295–305. [Google Scholar] [CrossRef]
- Sobhani, P.; Esmaeilzadeh, H.; Barghjelveh, S.; Sadeghi, S.M.M.; Marcu, M.V. Habitat Integrity in Protected Areas Threatened by LULC Changes and Fragmentation: A Case Study in Tehran Province, Iran. Land 2021, 11, 6. [Google Scholar] [CrossRef]
- Jiang, M.Z.; Chen, H.Y.; Chen, Q.H. A method to analyze “sourceesink” structure of non-point source pollution based on remote sensing technology. Environ. Pollut. 2013, 182, 135–140. [Google Scholar]
- Fan, J.; Wang, Y.; Zhou, Z.; You, N.; Meng, J. Dynamic Ecological Risk Assessment and Management of Land Use in the Middle Reaches of the Heihe River Based on Landscape Patterns and Spatial Statistics. Sustainability 2016, 8, 536. [Google Scholar] [CrossRef]
- Chinnasamy, P. Inference of basin flood potential using nonlinear hysteresis effect of basin water storage: Case study of the Koshi basin. Water Policy 2016, 48, 1554–1565. [Google Scholar] [CrossRef]
- Sobhani, P.; Esmaeilzadeh, H.; Sadeghi, S.M.M.; Marcu, M.V.; Wolf, I.D. Evaluating Ecotourism Sustainability Indicators for Protected Areas in Tehran, Iran. Forests 2022, 13, 740. [Google Scholar] [CrossRef]
- Uddin, K.; Murthy, M.S.R.; Wahid, S.M.; Matin, M.A. Estimation of Soil Erosion Dynamics in the Koshi Basin Using GIS and Remote Sensing to Assess Priority Areas for Conservation. PLoS ONE 2016, 11, e0150494. [Google Scholar] [CrossRef] [PubMed]
- Zaitunah, A.; Samsuri, A.; Ahmad, A.G.; Safitri, R.A. Normalized difference vegetation index (ndvi) analysis for land cover types using Landsat 8 OLI in Besitang watershed, Indonesia. Earth Environ. Sci. 2018, 126, 012112. [Google Scholar] [CrossRef]
- Lu, P.; Qin, Y.; Li, Z.; Mondini, A.C.; Casagli, N. Landslide mapping from multi-sensor data through improved change detection-based Markov random field. Remote Sens. Environ. 2019, 231, 111235. [Google Scholar] [CrossRef]
- Güler, M.; Yomralıoğlu, T.; Reis, S.; Yomralioglu, T. Using landsat data to determine land use/land cover changes in Samsun, Turkey. Environ. Monit. Assess. 2006, 127, 155–167. [Google Scholar] [CrossRef]
- Zhang, J.; van Westen, C.J.; Tanyas, H.; Mavrouli, O.; Ge, Y.; Bajrachary, S.; Gurung, D.R.; Dhital, M.R.; Khanal, N.R. How size and trigger matter: Analyzing rainfall- and earthquake-triggered landslide inventories and their causal relation in the Koshi River basin, central Himalaya. Nat. Hazards Earth Syst. Sci. 2019, 19, 1789–1805. [Google Scholar] [CrossRef]
- Scariot, E.C.; Almeida, D.; Santos, J.E.D. Connectivity dynamics of araucaria forest and grassland surrounding Pass Fundo National Forest, southern Brazil. Nat. Conserv. 2015, 13, 54–59. [Google Scholar] [CrossRef]
- Jensen, J.R. Introductory Digital Image Processing: A Remote Sensing Perspective, 3rd ed.; Prentice Hall: Upper Saddle River, NJ, USA, 2004; Available online: https://www.amazon.com/Introductory-Digital-Image-Processing-3rd/dp/0131453610 (accessed on 25 May 2021).
- Terzioğlu, S.; Başkent, E.Z.; Kadıoğulları, A.I. Monitoring Forest structure at landscape level: A case study of Scots pine forest in NE Turkey. Environ. Monit. Assess. 2008, 152, 71–81. [Google Scholar] [CrossRef]
- Jones-Walters, L.; Čivić, K. European protected areas: Past, present and future. J. Nat. Conserv. 2013, 21, 122–124. [Google Scholar] [CrossRef]
- Chavez, P.S. Image-based atmospheric Corrections-Revisited and improved. Photogramm. Eng. Remote Sens. 1996, 62, 1025–1036. [Google Scholar]
- Aung, M.; Swe Kh Oo, T.; Moe KLeimgruber, P.; Allendorf, T.; Duncan, C.; Wemmer, C. The environmental history of Chatthin Wildlife Sanctuary, a protected area in Myanmar (Burma). J. Environ. Manag. 2004, 72, 205–216. [Google Scholar] [CrossRef] [PubMed]
- Sobhani, P.; Goshtasb, H.; Nezami, B.; Jahani, A. Evaluation of Promoting Conservation Hunting Areas: In the case Ha-medan Alvand No-Hunting Area. Int. J. Environ. Sci. Technol. 2018, 20, 145–159. [Google Scholar] [CrossRef]
- Wang, B.; Ding, M.; Li, S.; Liu, L.; Ai, J. Assessment of landscape ecological risk for a cross-border basin: A case study of the Koshi River Basin, central Himalayas. Ecol. Indic. 2020, 117, 106621. [Google Scholar] [CrossRef]
- Mousavi, H.; Ranjbar, A.; Haseli, M. Monitoring and Trending of Landuse Changes in Abarkooh Basin using Satellite Images (1976–2014). J. Geogr. Data (SEPEHR) 2014, 25, 129–146. [Google Scholar]
- Nepal, P.; Khanal, N.R.; Zhang, Y.; Paudel, B.; Liu, L. Land use policies in Nepal: An overview. Land Degrad. Dev. 2020, 31, 2203–2212. [Google Scholar] [CrossRef]
- Zhang, M.; Zhang, C.; Al Kafy, A.A.; Tan, S. Simulating the Relationship between Land Use/Cover Change and Urban Thermal Environment Using Machine Learning Algorithms in Wuhan City, China. Land 2022, 11, 14. [Google Scholar] [CrossRef]
- Depietri, Y. The social–ecological dimension of vulnerability and risk to natural hazards. Sustain. Sci. 2019, 15, 587–604. [Google Scholar] [CrossRef]
- Peng, J.; Liu, Y.X.; Pan, Y.J.; Zhao, Z.Q.; Song, Z.Q.; Wang, Y.L. Study on the correlation between ER due to natural disaster and landscape pattern-process: Review and prospect. Adv. Earth Sci. 2014, 29, 1186–1196. [Google Scholar]
- Tuholske, C.; Tane, Z.; Lopez-Carr, D.; Roberts, D.; Cassels, S. Thirty years of land use/cover change in the caribbean: Assessing the relationship between urbanization and mangrove loss in roatan, Honduras. Appl. Geogr. 2017, 88, 84–93. [Google Scholar] [CrossRef]
- Zhang, J.-Q.; Liu, R.; Deng, W.; Khanal, N.; Gurung, D.R.; Murthy, M.S.R.; Wahid, S. Characteristics of landslide in Koshi River Basin, Central Himalaya. J. Mt. Sci. 2016, 13, 1711–1722. [Google Scholar] [CrossRef]
- Sandhage-Hofmann, A. Rangeland Management. Reference Module in Earth Systems and Environmental Sciences; Elsevier: Amsterdam, The Netherlands, 2017. [Google Scholar]
- Xu, W.; Wang, J.; Sijia, M.Z. Construction of landscape ecological network based on landscape ER assessment in a large-scale opencast coal mine area. J. Clean. Prod. 2021, 286, 125523. [Google Scholar] [CrossRef]
- Ke, X.; Gui, S.; Huang, H.; Zhang, H.; Wang, C.; Guo, W. Ecological risk assessment and source identification for heavy metals in surface sediment from the Liaohe River protected area, China. Chemosphere 2017, 175, 473–481. [Google Scholar] [CrossRef] [PubMed]
- Li, Y.; Huang, S. Landscape ER Responses to Land Use Change in the Luanhe River Basin, China. Sustainability 2015, 7, 16631–16652. [Google Scholar] [CrossRef]
- Küchler, A.W.; Zonneveld, I.S. Vegetation Mapping; Kluwer Academic Publishers: Dordrecht, The Netherlands, 1988; p. 365. [Google Scholar]
- Tariq, A.; Shu, H.; Siddiqui, S.; Imran, M.; Farhan, M. Monitoring Land Use and Land Cover Changes Using Geospatial Techniques, A Case Study of Fateh Jang, Attock, Pakistan. Geogr. Environ. Sustain. 2021, 14, 41–52. [Google Scholar] [CrossRef]
- Department of the Environment of Iran-GIS. GIS & Remote Sensing Section. GIS Reports of Iran’s PAs; Environment of Tehran Province Press: Tehran, Iran, 2020. [Google Scholar]
- Department of the Environment of Iran. Jajrud Collection Management Plan (Review); Visan Consulting Engineering Company; Environment of Tehran Province Press: Tehran, Iran, 2012. [Google Scholar]
- Department of the Environment of Iran. Reports of Iran’s PAs; Publish of Department of the Environment of Iran: Tehran, Iran, 2020. [Google Scholar]
- Jin, X.; Jin, Y.; Mao, X. Ecological risk assessment of cities on the Tibetan Plateau based on land use/land cover changes—Case study of Delingha City. Ecol. Indic. 2019, 101, 185–191. [Google Scholar] [CrossRef]
- Kennedy, H.P. Enhancing Delphi research: Methods and results. J. Adv. Nurs. 2004, 45, 504–511. [Google Scholar] [CrossRef]
- Rimal, B.; Sharma, R.; Kunwar, R.; Keshtkar, H.; Stork, N.E.; Rijal, S.; Rahman, S.A.; Baral, H. Effects of land use and land cover change on ecosystem services in the Koshi River Basin, Eastern Nepal. Ecosyst. Serv. 2019, 38, 100963. [Google Scholar] [CrossRef]
- Sandhu, H.; Sandhu, S. Poverty, development, and Himalayan ecosystems. Ambio 2014, 44, 297–307. [Google Scholar] [CrossRef]
- Cook, K.L.; Andermann, C.; Gimbert, F.; Adhikari, B.R.; Hovius, N. Glacial Lake outburst floods as drivers of fluvial erosion in the Himalaya. Science 2018, 362, 53–57. [Google Scholar] [CrossRef]
- Tuladhar, F.M.; Diwakar, K.C. Role of supraglacial lakes in recession of Himalayan glaciers: A case study of Dudh Koshi basin, Nepal. J. Appl. Geod. 2018, 12, 199–207. [Google Scholar] [CrossRef]
- Xiang, Y.; Yao, T.; Gao, Y.; Zhang, G.; Wang, W.; Tian, L. Retreat rates of debris-covered and debris-free glaciers in the Koshi River Basin, central Himalayas, from 1975 to 2010. Environ. Earth Sci. 2018, 77, 285. [Google Scholar] [CrossRef]
- Malekmohammadi, B.; Blouchi, L.R. Ecological risk assessment of wetland ecosystems using Multi Criteria Decision Making and Geographic Information System. Ecol. Indic. 2014, 41, 133–144. [Google Scholar] [CrossRef]
- Shi, H.; Yang, Z.P.; Han, F.; Shi, T.G.; Li, D. Assessing Landscape Ecological Risk for a World Natural Heritage Site: A Case Study of Bayanbulak in China. Pol. J. Environ. Stud. 2015, 24, 269–283. [Google Scholar] [CrossRef] [PubMed]
- Bocchiola, D.; Brunetti, L.; Soncini, A.; Polinelli, F.; Gianinetto, M. Impact of climate change on agricultural productivity and food security in the Himalayas: A case study in Nepal. Agric. Syst. 2019, 171, 113–125. [Google Scholar] [CrossRef]
- Cui, L.; Zhao, Y.; Liu, J.; Han, L.; Ao, Y.; Yin, S. Landscape ER assessment in Qinling. Geol. J. 2018, 53, 343–351. [Google Scholar] [CrossRef]
- Zhang, W.; Chang, W.J.; Zhu, Z.C.; Hui, Z. Landscape ER assessment of Chinese coastal cities based on land use change. Appl. Geogr. 2020, 117, 102174. [Google Scholar] [CrossRef]
- Ojaghi, S.; Khazaei, S. Improved detection of object-oriented changes in high spatial power images based on stochastic forest method in optimal feature space. J. Geogr. Inf. 2016, 26, 117–127. [Google Scholar]
- Bruner, A.G.; Gullison, R.E.; Rice, R.E.; da Fonseca, G.A.B. Effectiveness of Parks in Protecting Tropical Biodiversity. Science 2001, 291, 125–128. [Google Scholar] [CrossRef]
- Zhang, F.; Yu, S.; Jiang, A.; Wang, D. ER assessment due to land use/cover changes (LULC) in jinghe county, xinjiang, China from 1989 to 2014 based on landscape patterns and spatial statistics. Environ. Earth Sci. 2018, 77, 491. [Google Scholar] [CrossRef]
- Xie, H.; Wang, P.; Huang, H. Ecological Risk Assessment of Land Use Change in the Poyang Lake Eco-economic Zone, China. Int. J. Environ. Res. Public Health 2013, 10, 328–346. [Google Scholar] [CrossRef]
- Zeng, H.; Liu, G.J. Analysis of regional ER based on landscape structure. China Environ. Sci. 1999, 19, 454–457. [Google Scholar] [CrossRef]
- Li, Z.; Jiang, W.; Wang, W.; Chen, Z.; Ling, Z.; Lv, J. Ecological risk assessment of the wetlands in Beijing-Tianjin-Hebei urban agglomeration. Ecol. Indic. 2020, 117, 106677. [Google Scholar] [CrossRef]
- Xu, J.; Kang, J. Comparison of Ecological Risk among Different Urban Patterns Based on System Dynamics Modeling of Urban Development. J. Urban Plan. Dev. 2017, 143. [Google Scholar] [CrossRef]
- Fang, X.D.; Hou, X.Y.; Li, X.W.; Hou, W.; Nakaoka, M.; Yu, X.B. Ecological connectivity between land and sea: A review. Ecol. Res. 2018, 33, 51–61. [Google Scholar] [CrossRef]
- Peng, J.; Wang, Y.; Zhang, Y.; Wu, J.; Li, W.; Li, Y. Evaluating the effectiveness of landscape metrics in quantifying spatial patterns. Ecol. Indic. 2010, 10, 217–223. [Google Scholar] [CrossRef]
- Gong, J.; Yang, J.; Tang, W. Spatially Explicit Landscape-Level Ecological Risks Induced by Land Use and Land Cover Change in a National Ecologically Representative Region in China. Int. J. Environ. Res. Public Health 2015, 12, 14192–14215. [Google Scholar] [CrossRef] [PubMed]
- Yi, L.; Zhang, Z.; Zhao, X.; Liu, B.; Wang, X.; Zuo, L. Spatio-temporal process of unused land resources in China and its ecological effects. In Proceedings of the 2013 IEEE International Geoscience and Remote Sensing Symposium-IGARSS, Melbourne, VIC, Australia, 21–26 July 2013; pp. 2665–2668. [Google Scholar] [CrossRef]
- Huber, D.J.; Huber, J.; Hersser, F.; Hِllbacher, E.; Stern, T. Two experts, three opinions: Volatile organic compounds’ testing methods and regulative systems. Eur. J. Wood Wood Prod. 2018, 76, 5–12. [Google Scholar] [CrossRef]
- Brady, S.R. Utilizing and Adapting the Delphi Method for Use in Qualitative Research. Int. J. Qual. Methods 2015, 14, 1–6. [Google Scholar] [CrossRef]
- Stern, T.; Heil, G.; Ledl, C.; Schwarzbauer, P. Identifying innovation barriers using a Delphi method approach: The case of technical lignin in the wood-based panel industry. Int. Wood Prod. J. 2012, 3, 116–123. [Google Scholar] [CrossRef]
- Sutterlüty, A.; Hesser, F.; Schwarzbauer, P.; Schuster, K.C.; Windsperger, A.; Stern, T. A Delphi Approach to Understanding Varying Expert Viewpoints in Sustainability Communication: The Case of Water Footprints of Bio-Based Fiber Resources. J. Ind. Ecol. 2016, 21, 412–422. [Google Scholar] [CrossRef]
- Wu, J.; Zhu, Q.; Qiao, N.; Wang, Z.; Sha, W.; Luo, K.; Feng, Z. Ecological risk assessment of coal mine area based on “source-sink” landscape theory–A case study of Pingshuo mining area. J. Cleaner Product. 2021, 295, 126371. [Google Scholar] [CrossRef]
- Roudgarmi, P.; Mahdiraji, M.T.A. Current Challenges of Laws for Preservation of Forest and Rangeland, Iran. Land Use Policy 2020, 99, 105002. [Google Scholar] [CrossRef]
- De la Rosa-Velázquez, M.I.; Espinoza-Tenorio, A.; Díaz-Perera, M.Á.; Ortega-Argueta, A.; Ramos-Reyes, R.; Espejel, I. De-velopment stressors are stronger than protected area management: A case of the Pantanos de Centla Biosphere Reserve, Mexico. Land Use Policy 2017, 67, 340–351. [Google Scholar] [CrossRef]
- Jiang, L.; Yu, L. Analyzing land use intensity changes within and outside protected areas using ESA CCI-LC datasets. Glob. Ecol. Conserv. 2019, 20, e00789. [Google Scholar] [CrossRef]
- Ghazvini, S.A.M.; Timothy, D.J.; Sarmento, J. Environmental concerns and attitudes of tourists towards national park uses and services. J. Outdoor Recreat. Tour. 2020, 31, 100296. [Google Scholar] [CrossRef]
- Xu, J.; Melick, D.R. Rethinking the Effectiveness of Public Protected Areas in Southwestern China. Conserv. Biol. 2007, 21, 318–328. [Google Scholar] [CrossRef]
- Sadegh-Oghli, R.; Jahani, A.; Alizadeh-Shabani, A.; Goshtasb, H. Quantifying the landscape fragmentation as an indicator for assessing wildlife habitat: In the case Jajroud PA. Land Use Plan. 2019, 11, 57–78. Available online: http://www.aejournal.ir/article_90054.html (accessed on 12 June 2021).
- Department of the Environment of Tehran Province. Reports of Tehran’s PAs; Environment of Tehran Province Press: Tehran, Iran, 2019. [Google Scholar]
- Zhao, H.-L.; Zhao, X.-Y.; Zhou, R.-L.; Zhang, T.-H.; Drake, S. Desertification processes due to heavy grazing in sandy rangeland, Inner Mongolia. J. Arid. Environ. 2005, 62, 309–319. [Google Scholar] [CrossRef]
- Zhang, Q. The Dilemma of Conserving Rangeland by Means of Development: Exploring Ecological Resettlement in a Pastoral Township of Inner Mongolia. Nomad- Peoples 2012, 16, 88–115. [Google Scholar] [CrossRef]
- Wang, G.; Yu, Q.; Yang, D.; Zhang, Q.B.; Yue, D.P.; Liu, J.H. Hierarchical ecological network structure based on complex network analysis. Trans. Chin. Soc. Agric. Mach. 2019, 50, 258–266. [Google Scholar]
- Haghverdi, F.; Jahani, A.; Zebardast, L.; Makhdom, M.; Goshtasb, H. Quantification of wildlife habitat disintegration using landscape ecology approach (case study: Lar National Park and Virgin PA). J. Animal Environ. 2018, 10, 23–34. [Google Scholar]
- Cuenca, P.; Arriagada, R.; Echeverría, C. How much deforestation do protected areas avoid in tropical Andean landscapes? Environ. Sci. Policy 2016, 56, 56–66. [Google Scholar] [CrossRef]
- Leberger, R.; Rosa, I.M.; Guerra, C.A.; Wolf, F.; Pereira, H.M. Global patterns of forest loss across IUCN categories of protected areas. Biol. Conserv. 2019, 241, 108299. [Google Scholar] [CrossRef]
- Dai, L.; Wang, Y.; Lewis, B.J.; Xu, D.; Zhou, L.; Gu, X.; Jiang, L. The trend of land-use sustainability around the Changbai Mountain Biosphere Reserve in northeastern China: 1977–2007. Int. J. Sustain. Dev. World Ecol. 2011, 19, 369–377. [Google Scholar] [CrossRef]
- Garland, L. Ecological Risk Assessment (Chapter 6); European Environment Agency Press: Copenhagen, Denmark, 2016. Available online: https://www.eea.europa.eu/publications/GH-07-97-595-EN-C2/chapter6h.html (accessed on 12 June 2021).


| Dimensions | Variables | Indicators | References |
|---|---|---|---|
| Physical–environmental | Habitat | Habitat integrity | [11,26,35,43,44,45,46,47,48,49,50,51,52,53,54] |
| Unique habitat | |||
| Source-sink dynamics | |||
| Biodiversity | Biodiversity | ||
| Ecosystem | Natural ecosystem | ||
| Ecosystem functions (flow of matters, energy and information, etc.) | |||
| Environment | Environmental pollutions | ||
| Wildlife species | Extinction of valuable biological species | ||
| Vegetation | Vegetation density (such as high-density pasture, low-density pasture, forest, agricultural land, and orchards) | ||
| Overgrazing of livestock | |||
| Climate | Climate change | ||
| Natural resources | Reservoirs of groundwater aquifers and surface water | ||
| Soil erosion (sedimentation and soil fertility) | |||
| Landscape | Landscape structure (such as patches, corridors and matrix) | ||
| Landscape fragmentation | |||
| Landscape vulnerability | |||
| Ecological flows (genetic information) | |||
| Edge effects (due to isolation habitats) | |||
| Environmental hazards | Abrupt environmental crises (such as storms, floods, earthquakes, etc.) | ||
| Socio-cultural | Tourism attractions | Tourism attractions (natural, historical and cultural, man-made attractions) | |
| Educational services | Educational programs | ||
| Density | Population density (tourists, visitors, local communities) | ||
| Satisfaction | Social satisfaction | ||
| Security | Food security | ||
| Infrastructures | Illegal infrastructure | ||
| Health | Human health | ||
| Economic–institutional | Institutional elements | Control and monitoring | |
| Rules and regulations | Legal restrictions | ||
| Constructions | Illegal build up | ||
| Employment | Employment opportunities | ||
| Income | Income of communities | ||
| Prices | Prices of estate and commodities | ||
| Plans and projects | Illegal plans and projects | ||
| Agricultural | Cultivated lands | ||
| Tourism | Tourism activities |
| Index | Symbol | Computation | Ecological Meaning of Index | |
|---|---|---|---|---|
| Landscape fragmentation | Fi | Fi is employed to elucidate the fragmentation degree of the landscape which transitions from continuous whole patches to complex discontinuous patches caused by natural or human disturbances. As the value increases, the landscape ecosystem’s stability will decrease. In the equation, ni is the number of patches of landscape type i, and Ai is the area of landscape type i. | ||
| Landscape separation | Si | In a landscape type, Si indicates how well patches are separated from one another. As values increase, the spatial distribution of the landscape type i becomes more complex, and the separation degree is higher. This equation describes the number of patches of the landscape type i by ni and the total area of type i by A. | ||
| Landscape fractal dimension | FDi | The value range of FDi is 1–2. The larger the value, the more complex the shape of the landscape patches. When FDi < 1.5, the patch shape is relatively simple; when FDi = 1.5, the patch is in a Brownian random motion state, with poor stability; when FDi > 1.5, the patch shape is complex. In the equation, Pi is the perimeter of the landscape type i. | ||
| Landscape disturbance | Di | Di identifies the level of interference between different landscapes based on the level of human exploitation. a + b + c equals one, where a + b + c represents the weight. | ||
| Landscape vulnerability | Vi | Jajrud PA | 6- Water body 5- Cropland and garden 4- High-density pasture 3- Low-densitypasture 2- Planted forests 1- Built-up | Depending on the type of landscape, Vi reflects how sensitive it is to disturbance from external factors. The degree of succession is determined by the stage of the landscape ecosystem. In the present study, landscape types are categorized according to land use/land cover and vulnerability (from high to low), based on previous research and the characteristics of the study areas. |
| Kavdeh wildlife refuge | 5- Water body 4- Cropland and garden 3- High-density pasture 2- Low-density pasture 1- Built-up | |||
| Category | Science Field | Round 1 | Round 2 | Round 3 |
|---|---|---|---|---|
| Academics and employees of the Department of Environment | Environmental engineering | 5 | 5 | 4 |
| Biodiversity | 9 | 8 | 7 | |
| Zoology | 7 | 7 | 8 | |
| Biology | 5 | 5 | 5 | |
| Landscape designing and planning | 6 | 5 | 5 | |
| Geography | 3 | 3 | 3 | |
| Total | 35 | 33 | 32 |
| The Cases of Study | Year | Prepared LULC Map |
|---|---|---|
| Overall Accuracy | ||
| Jajrud | 1989 | 0.87 |
| 1999 | 0.92 | |
| 2009 | 0.85 | |
| 2019 | 0.97 | |
| Kavdeh | 1989 | 0.92 |
| 1999 | 0.84 | |
| 2009 | 0.91 | |
| 2019 | 0.96 |
| Jajrud | ||||||||||
|---|---|---|---|---|---|---|---|---|---|---|
| Year | 1989 | 1999 | 2009 | 2019 | Variation 1989–2019 | |||||
| LULC | Area | Area | Area | Area | Area | |||||
| ha | % | ha | % | ha | % | ha | % | ha | % | |
| Built-up | 7895 | 10.43 | 7997 | 10.56 | 8386 | 11.08 | 9048 | 11.95 | 1153 | 1.52 |
| Water body | 676 | 0.88 | 682 | 0.9 | 698 | 0.92 | 715 | 0.94 | 39 | 0.06 |
| Cropland and garden | 1724 | 2.27 | 1738 | 2.28 | 1744 | 2.30 | 1753 | 2.31 | 29 | 0.04 |
| High-density pasture | 29,241 | 38.64 | 29,212 | 38.60 | 29,150 | 38.52 | 28,540 | 37.71 | −701 | −0.93 |
| Low-density pasture | 34,380 | 45.43 | 34,298 | 45.32 | 33,998 | 44.92 | 33,938 | 44.85 | −442 | −0.58 |
| Planted forests | 1754 | 2.31 | 1743 | 2.30 | 1694 | 2.23 | 1676 | 2.21 | −78 | −0.1 |
| Sum total | 75,670 | 100 | 75,670 | 100 | 75,670 | 100 | 75,670 | 100 | --- | --- |
| Kavdeh | ||||||||||
| Built-up | 45 | 0.05 | 52 | 0.06 | 61 | 0.07 | 75 | 0.09 | 30 | 0.04 |
| Water body | 538 | 0.69 | 542 | 0.70 | 547 | 0.71 | 552 | 0.71 | 14 | 0.02 |
| Cropland and garden | 1647 | 2.14 | 1923 | 2.50 | 2154 | 2.80 | 2606 | 3.38 | 959 | 1.24 |
| High-density pasture | 22,603 | 29.39 | 22,512 | 29.27 | 22,335 | 29.04 | 21,955 | 28.55 | 648 | −0.84 |
| Low-density pasture | 52,066 | 67.70 | 51,870 | 67.45 | 51,802 | 67.36 | 51,711 | 67.24 | 355 | −0.46 |
| Sum total | 76,900 | 100 | 76,900 | 100 | 76,900 | 100 | 76,900 | 100 | --- | --- |
| Jajrud | |||||||||
| LULC | Year | Area (ha) | Area (%) | Patches | Fi | Si | FDi | Di | Vi |
| Built-up | 1989 | 7895 | 10.43 | 1205 | 1.628 | 0.487 | 1.48 | 0.3488 | 0.0562 |
| 1999 | 7997 | 10.56 | 1150 | 1.621 | 0.470 | 1.42 | 0.3482 | 0.0554 | |
| 2009 | 8386 | 11.08 | 1108 | 1.588 | 0.462 | 1.36 | 0.3461 | 0.0548 | |
| 2019 | 9048 | 11.95 | 1095 | 1.566 | 0.456 | 1.22 | 0.3455 | 0.0532 | |
| Water body | 1989 | 676 | 0.88 | 95 | 0.351 | 0.097 | 1.36 | 0.2155 | 0.0468 |
| 1999 | 682 | 0.9 | 87 | 0.338 | 0.085 | 1.32 | 0.2152 | 0.0457 | |
| 2009 | 698 | 0.92 | 85 | 0.322 | 0.078 | 1.23 | 0.2148 | 0.0438 | |
| 2019 | 715 | 0.94 | 72 | 0.315 | 0.062 | 1.21 | 0.2147 | 0.0426 | |
| Cropland and garden | 1989 | 1724 | 2.27 | 456 | 0.590 | 0.1848 | 1.45 | 0.1857 | 0.0321 |
| 1999 | 1738 | 2.28 | 434 | 0.582 | 0.1832 | 1.37 | 0.1713 | 0.0318 | |
| 2009 | 1744 | 2.30 | 423 | 0.578 | 0.1825 | 1.35 | 0.1686 | 0.0308 | |
| 2019 | 1753 | 2.31 | 412 | 0.562 | 0.1805 | 1.29 | 0.1542 | 0.0297 | |
| High-density pasture | 1989 | 29,241 | 38.64 | 1561 | 0.068 | 1.2751 | 1.63 | 0.6452 | 0.0675 |
| 1999 | 29,212 | 38.60 | 1587 | 0.075 | 1.2768 | 1.68 | 0.6502 | 0.0682 | |
| 2009 | 29,150 | 38.52 | 1595 | 0.084 | 1.2792 | 1.72 | 0.6521 | 0.0691 | |
| 2019 | 28,540 | 37.71 | 1621 | 0.092 | 1.2804 | 1.78 | 0.6538 | 0.0698 | |
| Low-density pasture | 1989 | 34,380 | 45.43 | 1365 | 0.349 | 0.9765 | 1.52 | 0.4562 | 0.0171 |
| 1999 | 34,298 | 45.32 | 1385 | 0.356 | 0.9782 | 1.64 | 0.4567 | 0.0176 | |
| 2009 | 33,998 | 44.92 | 1414 | 0.367 | 0.9820 | 1.67 | 0.4572 | 0.0182 | |
| 2019 | 33,938 | 44.85 | 1450 | 0.378 | 0.9851 | 1.73 | 0.4580 | 0.0185 | |
| Planted forests | 1989 | 1754 | 2.31 | 1342 | 0.165 | 0.1796 | 1.56 | 0.3253 | 0.0254 |
| 1999 | 1743 | 2.30 | 1351 | 0.170 | 0.1806 | 1.58 | 0.3268 | 0.0261 | |
| 2009 | 1694 | 2.23 | 1368 | 0.176 | 0.1822 | 1.66 | 0.3272 | 0.0268 | |
| 2019 | 1676 | 2.21 | 1375 | 0.188 | 0.1842 | 1.67 | 0.3288 | 0.0270 | |
| Kavdeh | |||||||||
| LULC | Year | Area (ha) | Area (%) | Patches | Fi | Si | FDi | Di | Vi |
| Built-up | 1989 | 45 | 0.05 | 145 | 0.3455 | 0.9871 | 1.48 | 0.2956 | 0.0456 |
| 1999 | 52 | 0.06 | 136 | 0.3423 | 0.9862 | 1.32 | 0.2942 | 0.0450 | |
| 2009 | 61 | 0.07 | 128 | 0.3415 | 0.9850 | 1.26 | 0.2935 | 0.0442 | |
| 2019 | 75 | 0.09 | 138 | 0.3402 | 0.9846 | 1.18 | 0.2918 | 0.0438 | |
| Water body | 1989 | 538 | 0.69 | 82 | 0.326 | 0.085 | 1.28 | 0.2235 | 0.0432 |
| 1999 | 542 | 0.70 | 75 | 0.318 | 0.072 | 1.22 | 0.2231 | 0.0427 | |
| 2009 | 547 | 0.71 | 63 | 0.308 | 0.066 | 1.18 | 0.2225 | 0.0422 | |
| 2019 | 552 | 0.71 | 55 | 0.295 | 0.057 | 1.14 | 0.2217 | 0.0416 | |
| Cropland and garden | 1989 | 1647 | 2.14 | 78 | 0.346 | 0.165 | 1.55 | 0.1745 | 0.0351 |
| 1999 | 1923 | 2.50 | 64 | 0.332 | 0.154 | 1.42 | 0.1742 | 0.0346 | |
| 2009 | 2154 | 2.80 | 56 | 0.327 | 0.145 | 1.37 | 0.1736 | 0.0332 | |
| 2019 | 2606 | 3.38 | 45 | 0.314 | 0.138 | 1.25 | 0.1728 | 0.0325 | |
| High-density pasture | 1989 | 22,603 | 29.39 | 163 | 0.5975 | 3.2476 | 1.66 | 0.4475 | 0.0163 |
| 1999 | 22,512 | 29.27 | 167 | 0.5982 | 3.2488 | 1.71 | 0.4482 | 0.0172 | |
| 2009 | 22,335 | 29.04 | 168 | 0.6721 | 3.2515 | 1.75 | 0.4498 | 0.0182 | |
| 2019 | 21,955 | 28.55 | 174 | 0.6708 | 3.2541 | 1.78 | 0.4512 | 0.0185 | |
| Low-density pasture | 1989 | 52,066 | 67.70 | 125 | 0.3132 | 1.1526 | 1.23 | 0.1826 | 0.0232 |
| 1999 | 51,870 | 67.45 | 128 | 0.3137 | 1.1538 | 1.28 | 0.1832 | 0.0238 | |
| 2009 | 51,802 | 67.36 | 133 | 0.3145 | 1.1542 | 1.34 | 0.1838 | 0.0244 | |
| 2019 | 51,711 | 67.24 | 142 | 0.3152 | 1.1548 | 1.43 | 0.1845 | 0.0254 | |
| Studied Areas | Year | Ecological Risk Grade (%) | ||||
|---|---|---|---|---|---|---|
| Very High | High | Medium | Low | Very Low | ||
| Jajrud | 1989 | 8.03 | 27.23 | 32.92 | 23.01 | 9.32 |
| 1999 | 8.32 | 27.45 | 32.78 | 22.78 | 9.25 | |
| 2009 | 8.21 | 28.59 | 31.82 | 22.76 | 8.38 | |
| 2019 | 8.58 | 28.81 | 31.58 | 22.64 | 8.23 | |
| 1989–1999 | 0.29 | 0.22 | −0.14 | −0.23 | −0.07 | |
| 2009–2019 | 0.37 | 0.28 | −0.24 | −0.12 | −0.15 | |
| Kavdeh | 1989 | 7.76 | 27.45 | 32.91 | 22.41 | 8.64 |
| 1999 | 7.98 | 27.64 | 33.03 | 22.50 | 8.49 | |
| 2009 | 7.96 | 28.46 | 32.10 | 22.19 | 8.64 | |
| 2019 | 8.23 | 28.64 | 32.25 | 22.24 | 8.40 | |
| 1989–1999 | 0.22 | 0.19 | 0.12 | 0.09 | −0.15 | |
| 2009–2019 | 0.27 | 0.18 | 0.15 | 0.05 | −0.24 | |
| Zones | Area | Developmental Approach | Protective Approach | ||
|---|---|---|---|---|---|
| ha | % | ha | % | ||
| Strict Nature Reserve | 11,311 | - | 11,311 | 15 | |
| Protected zone | 25,693 | - | 25,693 | 34 | |
| Extensive use zone | 753 | 753 | 1 | - | - |
| Intensive use zone | 20 | 20 | 1 | - | - |
| Recovery zone | 14,576 | - | 14,576 | 19 | |
| Special use zone | 2 | 2 | 1 | - | - |
| Buffer zone | 7785 | - | 7785 | 10 | |
| Multiple use zone | 9449 | 9449 | 11 | - | - |
| Common protection zone | 6081 | - | 6081 | 8 | |
| Sum total | 75,670 | 10,224 | 14 | 65,446 | 86 |
| Characteristics | Frequency (N) N = 35 | Percentage |
|---|---|---|
| Gender Male Female | ||
| 23 | 66 | |
| 12 | 34 | |
| Age Less than 30 years’ old 30–40 years’ old 40–50 years’ old 50+ years old | ||
| 2 | 5.71 | |
| 18 | 51.35 | |
| 11 | 31.28 | |
| 4 | 11.40 | |
| Education Bachelor’s degree M.Sc. degree Ph.D. degree | ||
| 6 | 17.14 | |
| 12 | 34.28 | |
| 17 | 48.57 | |
| Work status Academics Employees of the Department of Environment | ||
| 25 | 71.42 | |
| 10 | 28.57 | |
| Scientific field | ||
| Environmental engineering Biodiversity Zoology Biology Landscape designing and planning Geography | 7 | 20 |
| 8 | 23 | |
| 7 | 20 | |
| 7 | 20 | |
| 4 | 11 | |
| 2 | 6 |
| Dimensions | Variables | Indicators | Jajrud | Kavdeh | ||
|---|---|---|---|---|---|---|
| Average | Value | Average | Value | |||
| Physical– environmental | Habitat | Loss of habitat integrity | 3.35 | 4.66 | 3.11 | 4.32 |
| Reduction of unique habitats | 3.30 | 3.18 | ||||
| Disturbance of source-sink dynamics | 3.15 | 2.89 | ||||
| Biodiversity | Loss of biodiversity | 3.45 | 3.36 | |||
| Ecosystem | Destruction of natural ecosystem | 2.56 | 2.48 | |||
| Disturbance of ecosystem functions (flow of matters, energy, information, etc.) | 3.88 | 3.72 | ||||
| Reduction of ecosystem services | 3.05 | 2.92 | ||||
| Environment | Increase in environmental pollutions level | 2.88 | 2.52 | |||
| Wildlife species | Disturbance of species’ diet | 3.54 | 2.94 | |||
| Increase in species’ migration level | 2.95 | 2.87 | ||||
| Disturbance of behavioral patterns | 2.77 | 2.56 | ||||
| Decrease in resilience level and biological capacity of species | 3.84 | 3.22 | ||||
| Increase in extinction level of valuable biological species | 3.66 | 3.45 | ||||
| Vegetation | Decrease in vegetation density level (such as high-density pasture, low-density pasture, forest, agricultural land, and gardens) | 2.55 | 2.26 | |||
| Growth of overgrazing of livestock | 2.32 | 2.24 | ||||
| Increase in plant pests and diseases | 1.28 | 1.12 | ||||
| Climate | Increase in climate change degree | 1.92 | 1.72 | |||
| Natural resources | Reduction of the groundwater aquifers and surface water reservoirs | 3.34 | 2.97 | |||
| Increase in soil erosion level (sedimentation and soil fertility) | 3.15 | 3.03 | ||||
| Reduction of landscape and environmental desirability | 3.92 | 3.55 | ||||
| Landscape | Decrease in landscape heterogeneity level | 3.38 | 2.94 | |||
| Reduction of aesthetic quality of landscape | 2.24 | 1.98 | ||||
| Disturbance of landscape structure (such as patches, corridors, and matrix) | 4.55 | 4.31 | ||||
| Increase in landscape fragmentation level | 4.68 | 4.12 | ||||
| Increase in landscape vulnerability level | 4.18 | 3.98 | ||||
| Reduction of ecological connectivity (among habitats) | 4.23 | 4.30 | ||||
| Disturbance of ecological flows (genetic information) | 4.32 | 4.18 | ||||
| Growth of edge effects (due to isolation habitats) | 3.68 | 3.32 | ||||
| Disturbance of patterns and spatial elements’ structure (size, shape, number, type, composition, etc.) | 4.46 | 4.25 | ||||
| Environmental hazards | Growth of abrupt environmental crises (such as storm, flood earthquake, etc.) | 2.66 | 2.58 | |||
| Socio-cultural | Tourism attractions | Growth of tourism attractions (natural, historical and cultural, man-made attractions) | 2.59 | 2.68 | 2.46 | 2.56 |
| Educational services | Increase in educational programs level | 2.18 | 2.06 | |||
| Density | Decrease in population density level (tourists, visitors, local communities) | 2.22 | 2.10 | |||
| Satisfaction | Decrease in social satisfaction level | 2.44 | 2.66 | |||
| Security | Reduction of food security | 2.88 | 2.50 | |||
| Infrastructures | Growth of illegal infrastructures | 2.95 | 2.71 | |||
| Health | Decrease in human’s health level | 2.82 | 2.68 | |||
| Economic– institutional | Institutional elements | Growth of control and monitoring systems | 2.81 | 2.36 | 2.7 | 2.45 |
| Rules and regulations | Increase in legal restrictions level | 2.63 | 2.58 | |||
| Constructions | Growth of illegal build up | 3.24 | 2.83 | |||
| Employment | Reduction of employment opportunities | 2.92 | 2.77 | |||
| Reduction of employment level in different sectors (agriculture, industries, mines, services, etc.) | 2.86 | 2.63 | ||||
| Income | Decrease in communities’ income volume | 3.10 | 2.92 | |||
| Prices | Growth of estate and commodities prices | 2.94 | 2.90 | |||
| Plans and projects | Growth of illegal plans and projects | 2.83 | 2.28 | |||
| Agricultural | Decrease in cultivated lands volume | 2.94 | 2.86 | |||
| Tourism | Reduction of tourism activities | 2.74 | 3.03 | |||
| Decrease of tourists’ number | 2.35 | 2.45 | ||||
Disclaimer/Publisher’s Note: The statements, opinions and data contained in all publications are solely those of the individual author(s) and contributor(s) and not of MDPI and/or the editor(s). MDPI and/or the editor(s) disclaim responsibility for any injury to people or property resulting from any ideas, methods, instructions or products referred to in the content. |
© 2023 by the authors. Licensee MDPI, Basel, Switzerland. This article is an open access article distributed under the terms and conditions of the Creative Commons Attribution (CC BY) license (https://creativecommons.org/licenses/by/4.0/).
Share and Cite
Wolf, I.D.; Sobhani, P.; Esmaeilzadeh, H. Assessing Changes in Land Use/Land Cover and Ecological Risk to Conserve Protected Areas in Urban–Rural Contexts. Land 2023, 12, 231. https://doi.org/10.3390/land12010231
Wolf ID, Sobhani P, Esmaeilzadeh H. Assessing Changes in Land Use/Land Cover and Ecological Risk to Conserve Protected Areas in Urban–Rural Contexts. Land. 2023; 12(1):231. https://doi.org/10.3390/land12010231
Chicago/Turabian StyleWolf, Isabelle D., Parvaneh Sobhani, and Hassan Esmaeilzadeh. 2023. "Assessing Changes in Land Use/Land Cover and Ecological Risk to Conserve Protected Areas in Urban–Rural Contexts" Land 12, no. 1: 231. https://doi.org/10.3390/land12010231
APA StyleWolf, I. D., Sobhani, P., & Esmaeilzadeh, H. (2023). Assessing Changes in Land Use/Land Cover and Ecological Risk to Conserve Protected Areas in Urban–Rural Contexts. Land, 12(1), 231. https://doi.org/10.3390/land12010231