Article

Valuating Multifunctionality of Land Use for Sustainable Development: Framework, Method, and Application

1
College of Urban and Environmental Sciences, Peking University, Beijing 100871, China
2
Center for Urban Future Research, Peking University, Beijing 100871, China
3
Key Laboratory of Territorial Spatial Planning and Development-Protection, Ministry of Natural Resources, Beijing 100871, China
*
Authors to whom correspondence should be addressed.
Land 2023, 12(1), 222; https://doi.org/10.3390/land12010222
Submission received: 26 December 2022 / Revised: 8 January 2023 / Accepted: 9 January 2023 / Published: 10 January 2023

Abstract

:
The concept of land use functions (LUFs) has been widely employed to study and manage sustainable development. However, its employment is barely based on actual land uses. Difficulties in the accessibility of data and comparability of results also hinder the wide application of contemporary LUF frameworks on sustainability analysis. To fill these gaps, this study improves the LUF framework in which the monetary value of economic, social, and environmental LUF is evaluated using land use data. This framework is then used to examine how different LUFs relate to each other in Shandong, China. Results show that, at the township level, monetary values of economic and social functions are positively correlated, but are both negatively correlated with environmental function. All three functions grew between 2009 and 2018 in Shandong. Results also suggest that a focus on quantitative trade-offs of these three LUFs is insufficient; rather, their spatial balance also requires attention.

1. Introduction

Since the publication of the influential Brundtland Report in 1987, academic engagement with sustainable development has rapidly proliferated over the past decades. This proliferation is particularly observed after the proposition of 17 sustainable development goals in the United Nations’ 2030 Agenda for Sustainable Development, released in 2015 [1]. As one of the major drivers for environmental changes and carriers of economic, social, and environmental functions [2], land use is crucial in the increasingly important sustainable development management. However, land use itself is not a sufficient indicator to understand in an integral way the economic, social, and environmental functional changes in a certain region [3], not to mention the assessment and management of sustainable development. A critical issue is that different land uses can provide various kinds and quantities of economic, social, and environmental functions, which is pivotal to assessing the contributions of different land uses to the wellbeing of residents. The land use function framework which links the economic, social, and environmental functions with land use directly was raised to solve this problem. Land use functions (LUFs) refer to the goods and services provided by various land uses to satisfy people’s economic, social, and environmental demands [3]. The goods and services can be identified and assessed based on land use and statistical data, with the consideration that different land uses have heterogenous types and intensities of functions. Related studies have emerged in recent years and become one of the frontiers in land system science [4,5,6].
Although the concept of LUF is similar with ecosystem services and landscape functions to some extent, they still differ from each other both in definitions and applications. Since the pathbreaking work of Costanza et al. [7], ecosystem services have gradually become one of the most important research fields in environmental management. In related studies, the ecosystem services are often divided into four categories, i.e., provisional, regulating, supporting, and cultural services [7,8]. Landscape functions have a definition close to ecosystem services but differ on the emphasis on the composite nature of landscapes and stresses the provision of multiple ecosystem services within a certain landscape [9,10,11]. Either ecosystem services or landscape functions mainly focus on goods and services provided by natural or semi-natural land uses, with little considerations on urban regions or artificial landscapes [12,13]. Comparatively, rooted in agricultural multifunctionality research, LUF stresses different dimensions of functions including both socioeconomic and environmental aspects that every kind of land use may generate, and usually concentrates on the functional changes with dynamic land uses [3,14]. These emphases of LUF are tightly related with the two main premises of LUF framework: first, it regards land use and its changes as one of the major pressures of sustainability; and second, it believes that only by considering economic, social, and environmental issues equally can we achieve sustainable development [15]. Therefore, the LUF framework is more suitable for investigating sustainability issues than frameworks of ecosystem services and landscape functions, which apparently lay more emphasis on ecological elements.
Land use multifunctionality is one of the most important terms in the LUF framework, and can help understand and achieve sustainable development. Multifunctionality indicates the diversity and abundance of various functions. It can be identified at different spatial scales such as region-, landscape-, or grid-level [16,17]. Some scholars regard multifunctionality as the aggregative result of several diverse monofunctional units at lower scales [11], but actually even a certain type of land use or landscape can have multiple functions [18]. For example, agricultural lands could not only provide agricultural goods but also various other kinds of outputs including jobs provision, wildlife protection, and rural landscape preservation etc. [19]. Hence, different functions of the three pillars i.e., economic, social, and environmental dimensions of sustainable development could be adequately identified on every specific land use, facilitating clearer analysis of their trade-offs [3]. Therefore, land use multifunctionality is thought of as one of the feasible means to increasing sustainability and achieving sustainable development [20].
However, there are still several obstacles for sufficiently applying an LUF framework on sustainable development management. First, although the LUF tends to explicitly connect actual land uses with functions spatially [15], most studies on multifunctionality deviate from the scale of land use but are conducted at much more macro-level units [21], such as the whole nation, province, prefecture-level city, and county scales [14,22]. This phenomenon raises a problematic issue that the evaluation of LUFs in most studies is based on socioeconomic statistical data and limited to the administrative regions. For example, many studies take the gross agricultural outputs of the study area (i.e., counties, cities, and provinces etc.) or its variants as the critical indicator, when assessing the agricultural production function regardless of the quantities and distribution of related land uses [14,23]. This processing method actually disconnects the functions with the land use premises, which weakens the strengths of the LUF framework. The land use functions are thereby degraded to regional functions. Second, methods of quantification on LUFs in existing studies are usually indicator-based [21,24,25]. Unfortunately, there are no widely acknowledged and used indicator systems yet, neither on the selection of indicators nor on the weight setting of the indicators aspect. Indicator systems are usually created for specific regions, thereby neglecting the heterogenous development stages and realities of different places, which determines that most indicator systems cannot be easily transplanted among different study areas. Furthermore, indicator-based evaluation of LUFs tends to quantify functions in the form of standardized results [11,26,27], making research based on different study cases difficult to be compared with each other. This defect will impede our understandings on sustainable development and its management. Third, most current studies focusing on land use multifunctionality assessment are actually based on “land cover” rather than “land use” data [21,28]. The land cover which is usually originated from remote sensing not always reflects people’s actual intention to use the land, possibly misguiding the identification of functions on different land parcels [29]. Even though land cover data could be converted to land use maps supplemented by observations or inferred from landscape structure in some circumstances, it is still inadequate to equate the identification results with land use data from census neither on the accuracy nor on the classification details [30,31]. The disregard for how people exploit land cover in reality will cause harm to land use functions and sustainability management.
To address the gaps mentioned above, this study will stress the importance of land use in land use function analysis, and establish a method of quantifying and mapping land use functional values that can support temporal and spatial comparisons. The method is then applied on Shandong Province in China as a case study. In recent years, the Chinese government has proposed ecological civilization construction strategy that stresses the importance of environmental protection. In addition, “production-living-ecology” framework is established in China for regional land planning, which roughly correspond with the three pillars of sustainable development [32]. Given this background, Shandong Province in China is selected as the case study due to its rapid urbanization and various conflicts between humans and the environment.
The rest of this paper is organized as follows. Section 2 introduces the framework for valuation on the land use multifunctionality. Section 3 presents the detailed procedure of calculation and analysis methods. Results of the study, including evaluation results of LUFs, typological analysis of townships, and factors influencing land use functional values are provided in Section 4. In the final section, conclusions and policy implications are provided.

2. Framework for Valuing Multifunctionality

As mentioned above, land uses are often changed to meet people’s various and dynamic needs [20,33]. For example, cultivated lands provide people with food whereas construction lands can meet residence, transport, and employment demands. Meanwhile, the establishment of natural reserves is intended for protecting the basic environment for human survival. Human needs are definitely diversified, but early research tends to focus on the supply of eco-services from land use [34]. Scholars, especially ecologists, stress the unintended consequences of land use on global or regional environment to increase the public awareness on the importance of environment protection [2]. With the emerging discussions on sustainable development and its widely acknowledged three pillars, the assessment of economic and social functions of land use are similarly increasing. To evaluate the multifunctionality of land uses, we must first identify human needs and respective LUFs. In the Sustainability Impact Assessment: Tools for Environmental, Social and Economic Effects of Multifunctional Land Use in European Regions (SENSOR) project, nine LUFs were identified and then classified into three dimensions i.e., social (provision of work, human health and recreation, and cultural), economical (residential and land independent production, land based production, and transport), and environmental (provision of abiotic resources, support and provision of biotic resources, and maintenance of ecosystem processes), which is in line with connotations of sustainable development [3]. This classification denies the previous opposition between human needs and ecology protection, and regards the environmental functions of land use as the basis of human survival [23,35]. Thus, considering that nature preservation also aims to meet human needs, the “trade-off” should be made (in other words, conflicts happen) among the three pillars of sustainable development and more specific functions, rather than between human needs, realization, and environment protection [36].
As to the specific settings of quantitation on LUFs, in response to the three flaws described in the previous section, several improvements are made in this study. First, the tendency of disconnection between LUFs and actual land uses in existing studies is tackled by explicitly linking them with each other. As mentioned in the previous section, the actual land uses are the physical carriers of LUFs, which indicates that every LUF has to correspond to at least one type of land use. This corresponding relation will at least have two aspects of meanings: on the one hand, the linkage between LUF and land use gives various functions geographical information, enhancing our understandings on spatial characteristics of LUFs; on the other hand, by locating LUFs on specific land uses, the intensity of functions on different types and locations of land use that is critical for multifunctionality assessment and policy making can be identified and quantified. Therefore, as shown in Table 1, this study recognizes 10 LUFs (i.e., agricultural production, manufacturing and construction production, commercial and service production, transport for production, transport for living, residential, life services, provision of work, ecosystem cultural, and ecosystem regulating and supporting) and classifies them into three dimensions, namely, economic, social, and environmental aspects. Every LUF corresponds with one or several kinds of land use.
The second aspect of improvement to the framework is the approach to assessing LUFs. As aforementioned, substantial studies on LUF quantitation select a bulk of indicators and aggregate them to produce a normalized final score for every LUF in study areas. Although this method can clearly compare scores among regions in the study area, neither the low comparability among different regions and dimensions nor the miscellaneous weights determination processes of various indicators can promote its wide application. When it comes to policy stipulation and implementation, the normalized scores of LUFs cannot leave a deep impression on policy-makers directly, which might harm their trade-offs among different LUFs. For these problems, monetary valuation has been increasingly adopted as a feasible solution. Since the pathbreaking work of Costanza et al. [7], the monetary valuation approach has been mainly applied in the estimation of ecosystem services and has considerably contributed to policy making. In practice, the monetary valuation of economic and social functions of land use must be more direct and easier than that of ecosystem services. However, few studies have applied such a method. By monetary assessment, valuation of different years, regions, and dimensions can be compared directly, and the trade-off process and its outcomes made clearer. The gross domestic product (GDP) is commonly used to reflect the economic development of a certain region, and scholars have proposed the gross ecosystem product (GEP) to reflect the environmental functions [37]. Considering the three pillars of sustainable development, “gross social product” (GSP) can be raised to measure the total functional value of the social dimension compared with the GDP and GEP. In this way, the value of economic, social, and environmental functions in a certain area can be calculated in the same unit and thereby be compared directly.
The third improvement of the framework in this study is that the importance of land use data is especially stressed. Compared with land cover data mainly obtained by remote sensing, land use data has several explicit advantages. On the theoretical aspect, land uses are carriers of LUFs, which reflect people’s intentions to exploit land, while land cover does not contain such information. In the practical aspect, policies usually act on relatively stable land uses obtained by land survey or census data rather than the quite dynamic land covers. Moreover, since the land cover data is mainly interpreted based on remote sensing images, different studies usually have distinct classifications on land covers which hampers cross-regional and -temporal comparison, and the quality of data is highly constrained by the quality of images. Comparatively, land uses are commonly monitored and surveyed by official departments, indicating that long run land use data is much more accurate and detailed than land cover data, and its classification is generally cohesive among different regions and periods of time. Therefore, the evaluation of LUFs, based on actual land uses, could ameliorate the problem of low comparability mentioned above, which can substantially support the analysis of sustainable development and subsequent decision making of local governments [15,38].
With the abovementioned three aspects of improvements, the framework of LUF evaluation in this study is shown in Figure 1. To calculate the values of each dimension, a land use–LUF value matrix is needed. Every land use should correspond to at least one of the 10 recognized LUFs, and have varying values among different functions; and vice versa, for a certain LUF, the value also varies with different land uses. By constructing the functional value matrix, the contributions of each unit land use to certain LUF can be clearly identified, enabling different land uses to be more comparable according to their functions. The monetary functional value per unit area of each land use corresponding with certain LUFs can be determined by using various methods. Section 3 discusses such methods as applied to the case of Shandong Province in China. Assuming that there are I types of functions on J kinds of land uses in region R, then the total value of LUFs in R area can be calculated by the following formula:
V R = i = 1 I j = 1 J v i j A r e a j
where VR is the total functional value; vij is the functional value per unit area of i LUF on j land use; and Areaj is the area of j land use in R region. The values of each dimension and function can also be obtained by using this formula.

3. Data and Methods

3.1. Study Area

Located in the eastern coastal region, Shandong is one of the most developed provinces in China (Figure 2). During the study period (2009–2018), Shandong was comprised of 17 prefecture-level cities in the area of 158,000 km2. In 2020, the gross domestic production (GDP) of Shandong reached 7312.9 billion yuan, with the proportion of three industries being 7.3:39.1:53.6 [39]. Population was recorded at 101.5 million with 63.1% of which lived in urban areas in 2020. From the scope of land use structure, Shandong lacks ecological lands compared with the high proportion of production and living spaces, which might be detrimental to sustainable development of the economy, society, and environment. As to the social economic background, with an industrial structure dominated by heavy chemical sectors and an extensive resource utilization mode, Shandong is one of the largest sources of waste gas emission and wastewater discharge among all the provinces of China. Furthermore, the total population of Shandong has increased by more than 5 million and the urbanization rate has risen by more than 10% during the past decade. These facts have brought heavy burden to the environment, making Shandong Province an apt representative regarding sustainable development issues for China and developing countries. Thus, to examine the developed method of estimating LUFs in Shandong would be an ideal case, as well as to investigate the relationship between different dimensions of LUFs in rapidly developing and urbanizing areas.

3.2. Data

In estimating the functional values of land use in Shandong, this study mainly uses the data of the second national land use survey (dierci quanguo tudi liyong diaocha) finished in 2009 and its subsequent land use change survey (tudi liyong biangeng diaocha) in 2018. Although, the third national land use survey was conducted in 2019, it adopted a new system of land classification and thus the data are not comparable with previous surveys. Therefore, the study period ended in 2018 when the latest comparable data were available. According to the land use change survey of 2018, the agricultural land (including farmland, orchard, forestry, and pastures etc.) covers 72.5% of the entire land area of Shandong, and the remaining is for construction (18.5%) and unutilized (9.0%, majorly ecological including watery areas, saline-alkali soil, and sand etc.). The socioeconomic data such as the added value of each sector and per capita housing expenditure is mainly obtained from the Shandong Statistical Yearbook (in 2010 and 2019). The major procedures of data processing and analysis were divided into two parts in this study, i.e., the estimation of functional values and the analysis of influencing factors of LUFs. The flowchart is presented as Figure 3.

3.3. Estimation of Functional Values

The calculation of the land use functional value should consider feasibility and accuracy simultaneously. Apparently, applying the same functional value per unit area of certain land use regardless of location is inappropriate, since it can obscure the differences of land use intensity in different regions that in turn causes incomparable results. However, statistical data availability will become a tough problem if the functional value is computed at an excessively micro scale. Therefore, this study assumes that certain functional values per unit area for certain land use are homogenous in the same prefectural city, and heterogenous among cities. Moreover, given that this study estimates the land use functional values of Shandong in 2009 and 2018 and intends to interpret the changes, the values between the two years must be comparable. Thus, the GDP (Gross Domestic Production) deflator is used to adjust the economic functional values, while the CPI (Consumer Price Index) is used to adjust social and environmental ones.
The economic functions are divided into agricultural production, manufacturing and construction production, commercial and service production, and transport for production. The estimated value per unit area of each economic function on every land use is derived from the GDP. For agricultural production, the values are obtained by dividing the added values of farming, forestry, husbandry, and fishery sectors with respective to land use areas. Given that no data are available for specific areas of facility agricultural land by different functions, we divide the total area into farming, animal husbandry, and fishery functions with proportions of 6:3:1, in this study. This ratio setting has considered the fact that Shandong is the largest producer and exporter of vegetables in China, which requires substantial facility agricultural lands for building greenhouses to grow vegetables. Moreover, the added value of seawater aquatic products should be deducted from the value of fishery because the sea is not included in the land use survey. For the manufacturing and construction production function, since there are no further specific divisions in the land use survey, we refer to prior studies [40,41], consider the reality of Shandong Province, and then assign a functional intensity weight of 10:10:3:1 for mining land, cities, towns, and villages, respectively. Same weightings are also given, except for the mining land in commercial and service production function. The total functional value is the GDP of secondary and tertiary industries, respectively. As to the transport for production, we estimate the total value based on GDP and the input–output table of China due to the lack of related data. According to the input–output table, transport input accounts for approximately 5% of the total intermediate inputs. Thus, this study takes 5% of the GDP as the total value of transport for production.
Social functions include residential, life services, work provision, ecosystem cultural, and transport for living. The total value of the residential function is calculated by the population and average expenditure on residence. Given that the residence density varies significantly between urban and rural areas, their residential functional values are calculated separately. The functional value per unit area is the quotient of the total value divided by the corresponding land use area. Life services functions are further classified into public services and commercial life services. The total value of the former is indicated by the general public budget expenditure of every city, while that of the latter is represented by 15% of the added value of tertiary sectors, with reference to prior studies [40]. Similar to the calculation of the production value, the functional intensity weight with ratio 10:3:1:1 is given to cities, towns, villages, and scenic and other special use land. For work provision, the value in urban and rural areas are separately estimated by using a shadow cost method. In certain areas, the amount of compensation that the government would pay for residents if all lost their jobs is regarded as the total functional value. Given that compensation for job loss has no standards in rural areas unlike in urban areas, the compensation is substituted with the quotient of the urban unemployment insurance benefit divided by the urban–rural income ratio. The value of transport function for living is set as 5% of the total social functional value, except for the ecosystem cultural functional value, with reference to the calculation of transport function for production.
Since the estimation of environmental functional and the ecosystem cultural functional values is not the key content of this study, with the method developed by Xie et al. [42] that has been widely used, we use the ecosystem service value equivalent table, as shown in Appendix A, for estimating these two kinds of values. The equivalent value factor per unit ecosystem area equals the net agricultural income per unit cultivated land area in Shandong, which is calculated as 1.54 yuan/m2 in 2009 and 2.22 yuan/m2 in 2018, based on the statistics in Shandong Statistical Yearbook.
With all calculating methods mentioned above, Appendix B presents an example of the land use–land use function value matrix (Dongying City in 2009). After the determination of the matrix, the LUFs can be located in specific land uses on the map. However, it is quite arduous to analyze the distributive pattern and influencing factors of LUFs on a land use scale in a province. Therefore, the LUF values are calculated and analyzed at township level in this study.

3.4. Model and Variables Specification

The pooled ordinary least squares regression is used to quantitatively interpret the distribution of LUF values based on the observations in 2009 and 2018. The pooled model can simply detect the independent effects on the dependent variable of explanatory factors under the hypothesis that the coefficients of factors are homogenous across individuals in varying time and space [43]. Using this model that regards all townships as homogenous is appropriate given that this study intends to find the general distributing rules of LUF value in the abovementioned two years.
Numerous studies have already revealed that the LUFs are correlated with physical factors and socioeconomic activities [44,45,46]. Therefore, two groups of independent variables are introduced in the econometric model. The first group comprises natural geographical factors, including average slope, average annual precipitation, mean annual temperature of each township, and distance to sea. Topography represented by average slope determines the spatial pattern of landscape and human activities, while the other variables are indicators of regional climate which may influence the value of LUFs [46,47]. The average slope is calculated based on the Shuttle Radar Topographic Mission (SRTM) DEM data, and the precipitation and temperature data are obtained by spatial interpolation of the meteorological stations data from China Meteorological Administration. The other group is related to the socioeconomic aspect, containing distance to prefecture and county center, distance to national highway, average population density, whether the township is urban (with the urban construction land area as more than 80% of total construction land), and GDP per capita (logarithm form) and public expenditure per capita of the county (logarithm form). Distances to different administrative centers and highway reflect the geographical location, which mainly affect spatial suitability and rationality of different functions and have been proven critical to economic and social functions of land uses [45]. Urbanization and regional development (represented by GDP per capita) may cause environmental degradation on the one hand, but on the other hand it can change LUFs by altering people’s various needs [48,49]. Public expenditure per capital reflects the monetary inputs from local governments on economic, social, and environmental functions. The WorldPop population density data with 100 m resolution (www.worldpop.org) is used to derive the average population density of townships in Shandong (using the data in 2010 and 2015 as proxies for that in 2009 and 2018). Other socioeconomic data is from the Shandong Statistical Yearbook or calculated based on the National Fundamental Geographic Information Database. Table 2 shows the descriptive statistics of the independent variables.

4. Empirical Results

4.1. Evaluation Results of Multiple Functional Values

Table 3 shows the total land use functional value of Shandong in 2009, calculated by the aforementioned method, as 7.71 trillion yuan. The economic, social, and environmental functional values are 3.60, 0.88, and 3.22 trillion yuan, accounting for 46.7%, 11.4%, and 41.8%, respectively. By 2018, the total value has climbed to 13.67 trillion yuan, and the corresponding shares of the three parts have changed to 57.7%, 15.3%, and 27.1%, respectively. In 2018, the values of manufacturing and construction production and commercial and service production exceed the quarter of the total functional value. For social dimension, life services function is the most prominent function of total value, followed by work provision and residential functions.
As to the functional value change of Shandong from 2009 to 2018, the absolute functional values of all three dimensions have increased. The economic functional value has risen the most while the rise of environmental functional value is much subtler. Although the proportion of environmental functional value dropped from 41.8% in 2009 to 27.1% in 2018, there is no proof to claim that the development of Shandong province during the decade was unsustainable. For developing countries and regions, a higher growth speed in economic and social functional value is acceptable as long as the environmental functions are not damaged. The environmental function is more like a restrictive indicator whose decline indicates unsustainability rather than a prospective indicator that governments have to improve.
Socioeconomic functions mainly concentrate in urban areas and county towns while environmental functions are mainly located in water and mountainous areas, and this spatial pattern did not have significant changes from 2009 to 2018, as exhibited in Figure 4. In general, townships with high environmental functional value density usually have lower economic functional value density and vice versa. The distributions of economic and social functional value densities are highly similar in Shandong. Comparatively, townships with the highest environmental functional value densities are located in major water and mountainous areas, including the Yellow River and its delta, Nansihu Lake and its surrounding areas, and middle and eastern mountainous regions. From 2009 to 2018, almost every township shows an increase in total value density and its spatial pattern is highly similar to that of economic and social ones. This trend demonstrates that the increase of total land use functional value is mainly contributed by economic growth and social constructions. Comparatively, townships with declining or static environmental functional values are relatively more than the other two dimensions, mainly in areas near city centers. Nonetheless, this decline is compensated for by the functional value growth in water and mountainous areas, resulting in a slight increase of environmental functional value of the entire Shandong province. Thus, when judging the changes of regional LUFs, the scale of analysis is fairly important. Trade-offs exist not only among different functions but also among different areas. The acceptable extent that the environmental functional value declines in one region and increases in another is a critical question in related policy making.
We further examine the relationships among the three dimensions of functions. Figure 5 shows that the economic and environmental functional values present the strongest negative linear relationship, with an R-squared of 0.979, indicating that at the township scale, the economic development may commonly be against environmental protection. A positive correlation exists between economic and social functional values. The reason is that most land use that have economic functions also have certain social functions such as work provision and life services, which also determines the negative relationship between social and environmental functional values. However, the relationship of social aspect with the other two appears to vary more than that between economic and environmental dimensions. Townships with more economic or less environmental functional values might have variant proportions of social functional value, while those with lower economic or higher environmental proportions tend to always have a smaller share. Thus, the positive relationship between economic and social functional values is relatively weak, though the environmental dimension is always against both of the other two aspects.
The relationship between the three dimensions of LUFs can provide insights on the analysis of sustainable development. The above scatter plots indicate the reasonableness to combine economic and social aspects into a socioeconomic dimension for sustainable development analysis. This combination has realistic implications. Economic growth and social welfare should be juxtaposed with environmental protection in the context of sustainable development [50]. Among the three dimensions of LUFs, the environmental functions preserve a life supporting system, which is a basic human need. Without a secure environment for people, regardless of how much economic and social functions play a role, the development is not sustainable. However, unlike the economic and social functional values, the environmental functional value shows no significant changes if the land use sustains. For the former two functions, the values can be improved by more efficient utility of land, but environmental function cannot be improved much unless the land use is altered. Thus, the environmental functional value must be relatively stable in a certain region if the land use does not significantly change. From this scope, the analysis of the development of socioeconomic conditions and environment sustainability is the core of sustainable development measurement.

4.2. Classification of Townships and Evolution

To further probe the spatial distributive characteristics of the land use functional value, we classified the townships into several types according to the functional value densities of the three dimensions of land use. Economic and social functional values are added together to acquire the socioeconomic functional value. Based on the socioeconomic and environmental functional value densities of each township and the overall density of the entire province, four types of townships can be identified, namely, low value (both densities are below overall level), environmental-dominated (only the environmental functional value density is above the overall level), socioeconomic-dominated (only the socioeconomic functional value density is above the overall level), and high value townships (both densities are above the overall level). Figure 6 shows the spatial pattern of these four types of townships in 2009 and 2018. Low-value townships are the most common type, mainly distributed far from the prefectural city centers. Environmental-dominated townships are mainly located in the Yellow River Delta, Nansihu Lake, and eastern mountainous areas where the environmental functional value is high. Almost all socioeconomic dominated townships are distributed in urban areas and county towns with surrounding high-value townships.
From 2009 to 2018, the general spatial pattern of the four types shows no significant changes, but the type transfer matrix can still provide several insights in sustainable development (Table 4). In general, the type of township is fairly stable with only 78 townships transferred among the total of 1898, accounting for only 4.1%. The low- and high-value townships decreased from 979 and 97 to 961 and 88, respectively, while that of environmental-dominated and socioeconomic-dominated values increased from 352 and 470 to 356 and 493, respectively. This change reflects that the functional zoning is becoming clearer with more townships tending to have superior positions in only one of the environmental and socioeconomic aspects rather than in both. Thus, the trade-offs for more sustainable development might occur among different townships, with several in pursuit of intensive socioeconomic functions while others secure the environment.

4.3. Factors Influencing Functional Values

The pooled ordinary least squares regression model is employed to further examine the distribution of different functional value based on the data of 2009 and 2018. Given the significant heteroscedasticity identified by the White test, the robust estimation is used for its elimination. The regression results are provided in Table 5.
As illustrated by the scatter plots, factors that influence the distribution of economic and social functional values are similar (Models 1–4). Apart from the mean annual temperature, all selected natural geographical factors are tightly related to the value density of economic and social functions at the township level. In general, places with more suitable living conditions tend to have high socioeconomic functional value densities. A steep terrain usually means less suitable construction land, which is negatively related with socioeconomic functions. A proper distance to the sea (functional value density reaching the peak at approximately 200 km) and a milder climate have opposite effects. Meanwhile, distance to the county center, urbanization of the township, population density, and attributes of respective counties are significantly interrelated to the socioeconomic functional value density. Distance to the prefecture center and to the national highway have no effects on the spatial pattern.
By comparison, the above factors are connected with environmental functional value density in a different way (Models 5–6), which again confirms the conflicting relationship between socioeconomic and environmental functions. Noticeably, the R squares of these two models are much lower than those of other models. One of the possible causes is that compared with cities and towns where economic and social functions concentrate in, the distribution of rivers, lakes, mountains, and forests where environmental function aggregates is relatively random with the selected variables, and not quite easy to be influenced by human activities. The coefficients of independent variables show that high value densities are commonly found in coastal and mild areas, very flat terrain such as the Yellow River Delta, and mountainous areas such as Mount Tai. With regards to socioeconomic factors, both the distance to the prefectures and counties are positively related to the functional value density, which differs from Models 1–4. This result indicates that for environmental functions, governments tend to arrange the spatial distributions and trade-offs of sustainable development at both prefecture and county levels. In line with the effects of distance, higher population density (which means more human activities) also relates with lower environmental functional value density. The environmental functions are positively related to higher GDP per capita of the counties, but show no clear relations with the public expenditure per capita. The insignificant coefficients of public expenditure per capita in Models 5–6, combined with significant ones in Models 1–4, reveal that governments emphasize on raising economic and social functions rather than environmental ones through public expenditure.

5. Conclusions and Policy Implications

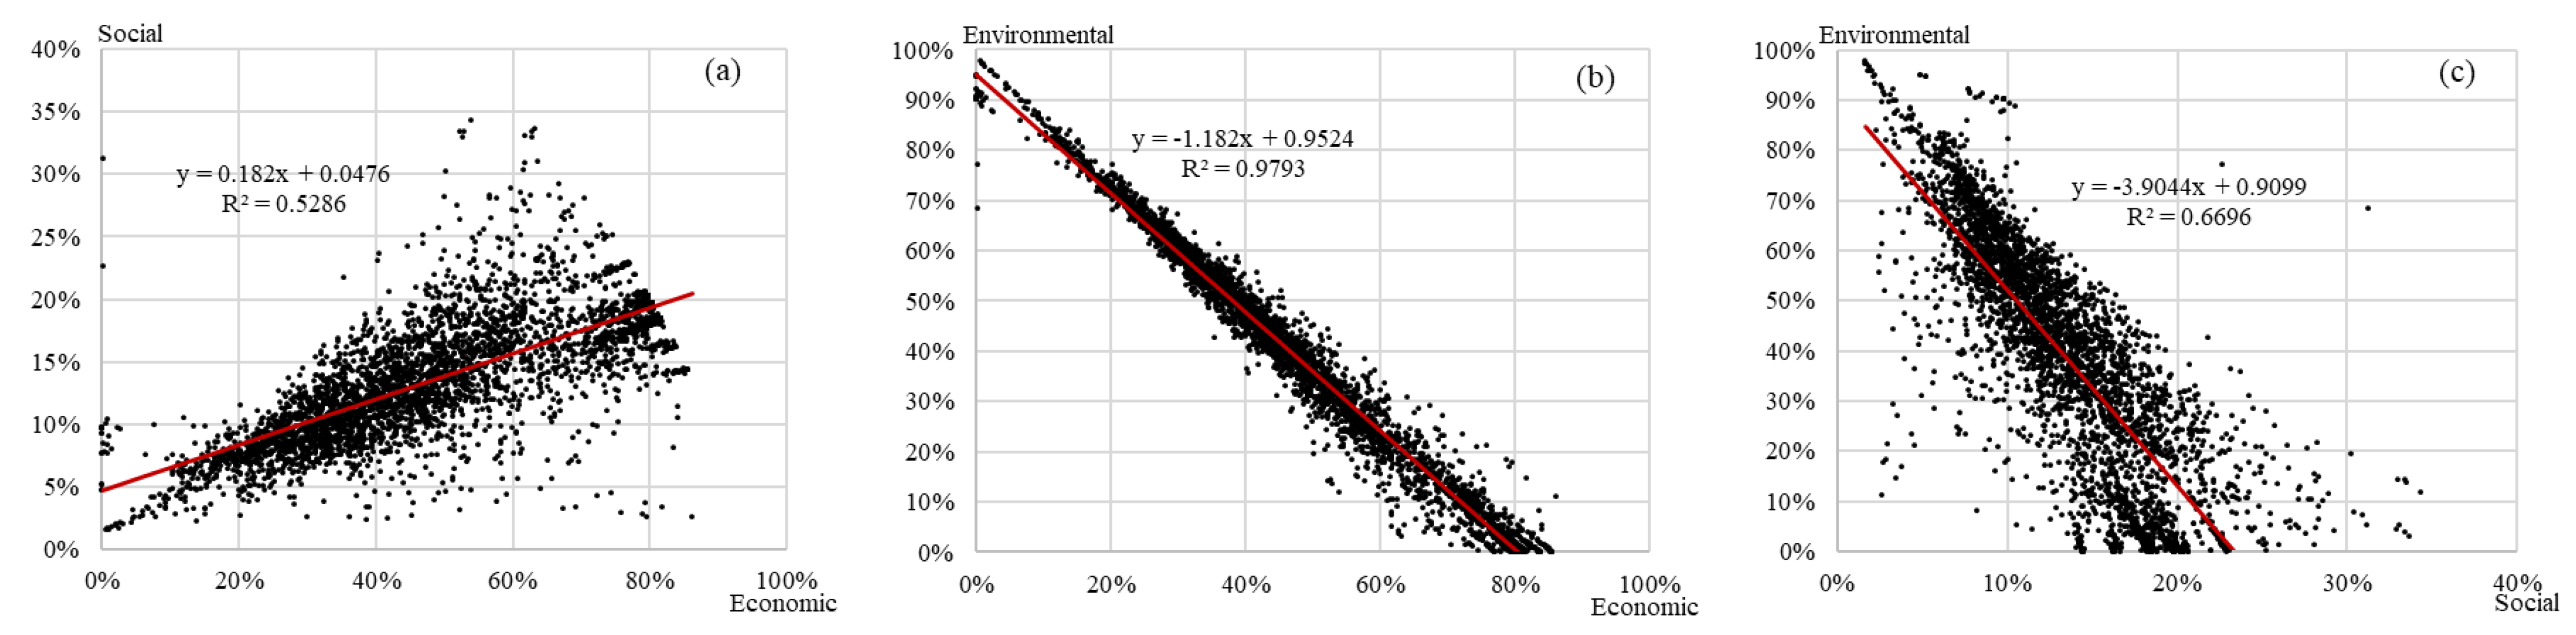
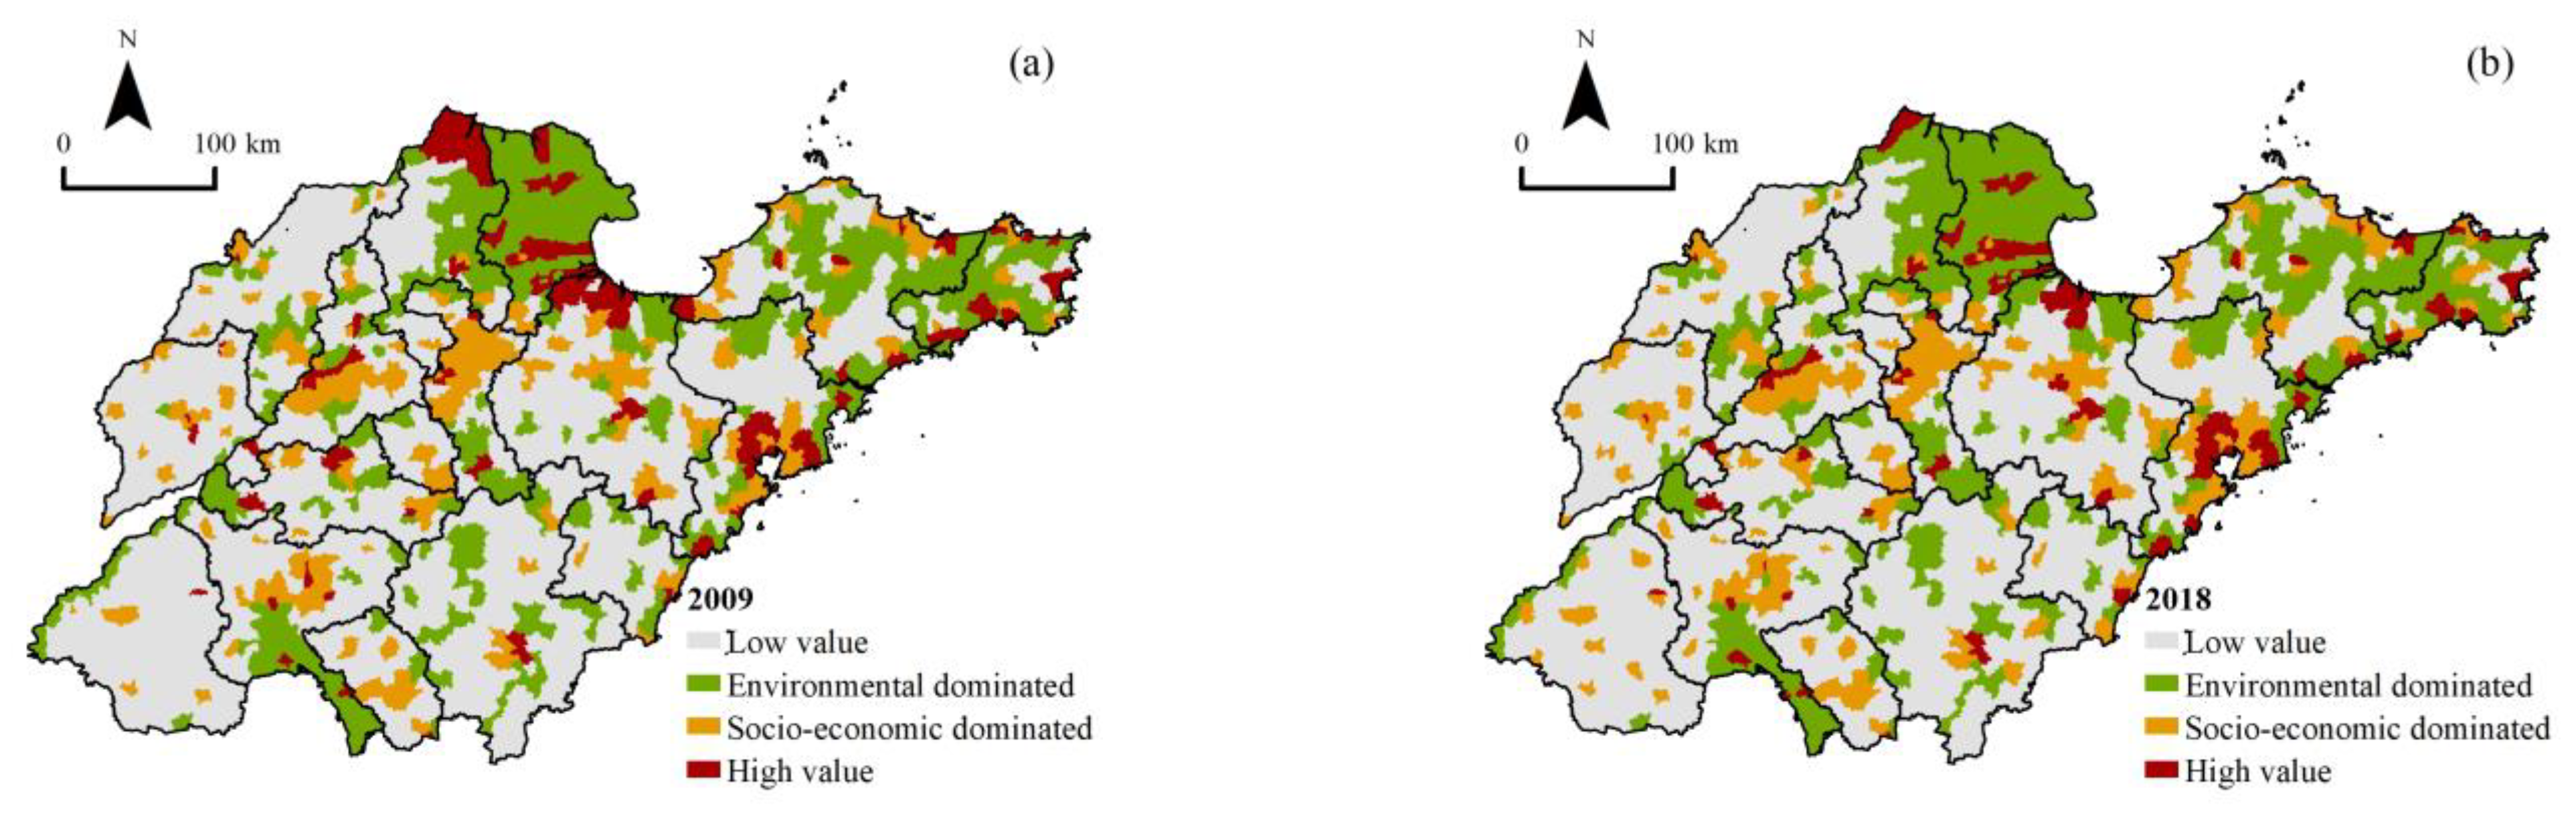
This article has established a framework of monetary valuation on land use multifunctionalities from the scope of sustainable development, and specifically taking Shandong province as an example for analysis. Consistent with the three pillars of sustainable development, 10 identified LUFs are grouped into three dimensions, namely, economic, social, and environmental. By employing the second national land use survey data and related socioeconomic statistics of Shandong, the land use functional value is calculated at the township level. Empirical results show the good practicality of the LUF valuation method established in this study. First, from 2009 to 2018, all the three dimensions of total functional value increased in Shandong province, with large increases in economic and social aspects and a relatively smaller one in environmental value. This finding suggests that Shandong province, as a whole has, experienced sustainable development in the 10 years because the socioeconomic functions have considerably developed without the decline, even with a subtle increase of environmental functions. Second, classification results and changes reveal a clear trend of functional zoning at the township level. During the rapid urbanization of this decade, more socioeconomic functions have agglomerated in urban areas and county towns, and environmental functions increased in major ecological sources and near suburban areas. Third, the econometric models reconfirm the abovementioned findings, which indicate spatial conflicts of socioeconomic and environmental functions at a township level, and thus governments must pay more attention and funds on environmental protection.
The method of monetary valuation on land use multifunctionality raised in this paper has solved the three aforementioned aspects of the problem with contemporary LUF assessment studies to some extent. In light of the theory of land use multifunctionality, this method identifies different LUFs and links them with land use, which is aligned with the contemporary trend of increasing heterogeneity of land utilization. Analysis based on multiple LUFs, in relation to land use, can remedy the neglect on land utilization efficiency that is a critical issue in sustainable development. By analyzing the monetary results that can be compared across years, regions, and functions, local governments have more capacity to dynamically monitor changes of LUFs and make related policies for achieving their synergies and tradeoffs. Results obtained by the methods raised by this article are also proved reliable by comparing with prior studies employed with other function valuating methods. For example, the socioeconomic functions show negative relationships with environmental function, as indicated by prior studies [22,23]. However, comparing to the existing methods, considering only the land use data and several common socioeconomic statistics, the monetary valuation framework avoids the complicated procedure of data collection and calculations in previous methods, thereby improving its practicality for local governments. Furthermore, this method is also flexible to use, according to local conditions. For example, although the ratio for dividing total facility agricultural land into different uses was set as 6:3:1 for farming, animal husbandry, and fishery in this study, it can be easily changed in LUF assessment, according to real life scenarios, when applying the method elsewhere. This flexibility can also help this method become more easily and widely employed.
Based on the conclusions drawn in this study, we further discuss the policy implications for sustainable development in rapidly urbanizing societies. According to the results of LUF monetary valuation in 2009 and 2018, as mentioned above, the value of economic and social functions has experienced a significant growth during the period while the growth of environmental functions is much slower. This phenomenon indicates that local governments should pay more attention to environmental protection during the rapid urbanization period, for sustainable development. This goal might be achieved in at least two ways, according the analysis of this article. One of the possible ways is to improve the land use efficiency and promote the intensive use of inefficient land. For example, with the continuous outflow of rural populations, the rural homestead lands in most Chinese rural areas keep stable, even increase, which causes the intensity of living functions on rural homestead lands getting weaker and weaker. If the unused homestead land can be consolidated, both the agricultural production and environmental functions will be elevated while maintaining social functions [51], thereby raising the overall land use intensity. Another possible way is to make trade-offs of different LUFs not only among different dimensions of functions but also on their spatial arrangement. In this study, townships in Shandong Province have shown a clear trend of functional zoning during 2009 to 2018, which to some extent helps Shandong maintain an overall sustainable development. This phenomenon indicates that spatial zoning of three aspects of LUFs might be a feasible way to enhance the overall land use intensity and thereby the total functional value.
However, caveats still remain in this study. As previous studies argued, the LUF assessment is only limited to sustainability issues sensitive to land use [15]. Functions that have weak correlations with land use or are hard to reflect on land use cannot be adequately included in the LUF valuation. This disadvantage may somewhat hinder several aspects of sustainability analysis. For example, those sustainable development goals related to institutional aspects such as SDG 5 (gender equality) and SDG 16 (peace, justice, and strong institutions) of the 2030 Agenda for Sustainable Development cannot be properly investigated with the LUF framework, which requires other approaches for supplements. Moreover, the method of equivalence factor is used in this study for the valuation of environmental functions of land use according to Xie et al. [42], which may oversimplify the composition of environmental functions when applying the method on a relatively micro scale and thereby underestimate the overall monetary value. Further research based on more detailed auxiliary data and corresponding methods such as measurement of gross ecosystem production (GEP) can possibly help strengthen our understandings on the LUF and sustainability analysis.

Author Contributions

Conceptualization, R.P. and T.L.; methodology, R.P.; software, R.P.; validation, R.P., T.L. and G.C.; formal analysis, R.P.; investigation, R.P.; resources, T.L. and G.C.; data curation, R.P.; writing—original draft preparation, R.P.; writing—review and editing, T.L. and G.C.; visualization, R.P.; supervision, T.L. and G.C.; project administration, G.C.; funding acquisition, T.L. and G.C. All authors have read and agreed to the published version of the manuscript.

Funding

This research was funded by the National Key Research and Development Program of China, grant number 2018YFD1100803.

Informed Consent Statement

Not applicable.

Data Availability Statement

The data are not publicly available due to requests from local land management authority.

Conflicts of Interest

The authors declare no conflict of interest.

Appendix A

Table A1. The equivalent coefficients of ecosystem cultural and environmental functional value supplied by per unit area of different land use. Adapted from Xie et al., 2017 [42].
Land UseEcosystem RegulatingEcosystem SupportingEcosystem Cultural
Gas RegulationClimate RegulationWaste TreatmentWater RegulationSoil RetentionNutrient CyclingBiodiversity
Irrigable land, dryland0.670.360.100.271.030.120.130.06
Paddy field1.110.570.172.720.010.190.210.09
Fruit orchard, tea orchard, other orchard, forest land, shrub land, other woodland1.915.711.673.742.320.182.120.93
Natural pasture, artificial pasture, other grassland1.213.191.052.341.470.111.340.59
Swampland, inland flat, tidal flat1.903.603.6024.232.310.187.874.73
Sand, saline land, bare land0.070.050.210.120.080.010.070.03
Lake, river, pond, reservoir, ditch, hydraulic construction land0.772.295.55102.240.930.072.551.89

Appendix B

Table A2. Land use–land use function value matrix. (Taking Dongying City in 2009 as an example; unit: yuan/m2).
Land Use FunctionsEconomicSocialEnvironmental
Land Use Agricultural ProductionManufacturing and Construction ProductionCommercial and Service ProductionTransport for ProductionResidentialLife ServicesProvision of WorkTransport for LivingEcosystem CulturalEcosystem Regulating and Supporting
Irrigable land, dryland1.77 0.33 0.094.12
Paddy field1.77 0.33 0.147.65
Fruit orchard, tea orchard, other orchard1.77 0.33 1.4227.09
Natural pasture, artificial pasture25.52 0.9116.44
Other grassland 0.9116.44
Forest land, shrub land, other woodland0.31 1.4227.09
Facility agricultural land8.75 0.33
Cities 391.32217.99 11.9481.919.69
Towns 117.4065.40 11.9424.579.69
Villages 39.1321.80 1.838.190.33
Mining land 391.32
Railway land, airport land, road land, harbor and wharf land, rural road land 63.76 7.45
Pipeline transportation land 63.76
Lake, river, pond, reservoir0.29 2.90175.71
Ditch, hydraulic construction land 2.90175.71
Swampland, inland flat, tidal flat 7.2667.10
Sand, saline land, bare land 0.050.91
Scenic and other special use land 8.19

References

  1. United Nations. Transforming Our World: The 2030 Agenda for Sustainable Development; United Nations: New York, NY, USA, 2015.
  2. Foley, J.A.; DeFries, R.; Asner, G.P.; Barford, C.; Bonan, G.; Carpenter, S.R.; Chapin, F.S.; Coe, M.T.; Daily, G.C.; Gibbs, H.K.; et al. Global Consequences of Land Use. Science 2005, 309, 570–574. [Google Scholar] [CrossRef] [Green Version]
  3. Pérez-Soba, M.; Petit, S.; Jones, L.; Bertrand, N.; Briquel, V.; Omodei-Zorini, L.; Contini, C.; Helming, K.; Farrington, J.; Mossello, M.T. Land Use Functions—A Multifunctionality Approach to Assess the Impact of Land Use Changes on Land Use Sustainability. In Sustainability Impact Assessment of Land Use Changes; Helming, K., Pérez-Soba, M., Tabbush, P., Eds.; Springer: Berlin/Heidelberg, Germany, 2008; pp. 375–404. [Google Scholar]
  4. Fan, Y.; Gan, L.; Hong, C.; Jessup, L.H.; Jin, X.; Pijanowski, B.C.; Sun, Y.; Lv, L. Spatial Identification and Determinants of Trade-Offs among Multiple Land Use Functions in Jiangsu Province, China. Sci. Total Environ. 2021, 772, 145022. [Google Scholar] [CrossRef]
  5. Li, Q.; Zhou, Y.; Xu, T.; Wang, L.; Zuo, Q.; Liu, J.; Su, X.; He, N.; Wu, Z. Trade-Offs/Synergies in Land-Use Function Changes in Central China from 2000 to 2015. Chin. Geogr. Sci. 2021, 31, 711–726. [Google Scholar] [CrossRef]
  6. Ma, W.; Jiang, G.; Li, W.; Zhou, T.; Zhang, R. Multifunctionality Assessment of the Land Use System in Rural Residential Areas: Confronting Land Use Supply with Rural Sustainability Demand. J. Environ. Manag. 2019, 231, 73–85. [Google Scholar] [CrossRef]
  7. Costanza, R.; D’Arge, R.; de Groot, R.; Farber, S.; Grasso, M.; Hannon, B.; Limburg, K.; Naeem, S.; O’Neill, R.V.; Paruelo, J.; et al. The Value of the World’s Ecosystem Services and Natural Capital. Nature 1997, 387, 253–260. [Google Scholar] [CrossRef]
  8. Millennium Ecosystem Assessment. Ecosystems and Human Well-Being: Synthesis; Island Press: Washington, DC, USA, 2005. [Google Scholar]
  9. De Groot, R. Function-Analysis and Valuation as a Tool to Assess Land Use Conflicts in Planning for Sustainable, Multi-Functional Landscapes. Landsc. Urban Plan. 2006, 75, 175–186. [Google Scholar] [CrossRef]
  10. Křováková, K.; Semerádová, S.; Mudrochová, M.; Skaloš, J. Landscape Functions and Their Change—A Review on Methodological Approaches. Ecol. Eng. 2015, 75, 378–383. [Google Scholar] [CrossRef]
  11. Stürck, J.; Verburg, P.H. Multifunctionality at What Scale? A Landscape Multifunctionality Assessment for the European Union under Conditions of Land Use Change. Landsc. Ecol. 2017, 32, 481–500. [Google Scholar] [CrossRef] [Green Version]
  12. Englund, O.; Berndes, G.; Cederberg, C. How to Analyse Ecosystem Services in Landscapes—A Systematic Review. Ecol. Indic. 2017, 73, 492–504. [Google Scholar] [CrossRef]
  13. Portman, M.E. Ecosystem Services in Practice: Challenges to Real World Implementation of Ecosystem Services across Multiple Landscapes—A Critical Review. Appl. Geogr. 2013, 45, 185–192. [Google Scholar] [CrossRef]
  14. Gao, Y.; Li, H.; Song, Y. Interaction Relationship between Urbanization and Land Use Multifunctionality: Evidence from Han River Basin, China. Land 2021, 10, 938. [Google Scholar] [CrossRef]
  15. Schößer, B.; Helming, K.; Wiggering, H. Assessing Land Use Change Impacts—A Comparison of the Sensor Land Use Function Approach with Other Frameworks. J. Land Use Sci. 2010, 5, 159–178. [Google Scholar] [CrossRef]
  16. Li, J.; Zhang, H.; Xu, E. Quantifying Production-Living-Ecology Functions with Spatial Detail Using Big Data Fusion and Mining Approaches: A Case Study of a Typical Karst Region in Southwest China. Ecol. Indic. 2022, 142, 109210. [Google Scholar] [CrossRef]
  17. Mastrangelo, M.E.; Weyland, F.; Villarino, S.H.; Barral, M.P.; Nahuelhual, L.; Laterra, P. Concepts and Methods for Landscape Multifunctionality and a Unifying Framework Based on Ecosystem Services. Landsc. Ecol. 2014, 29, 345–358. [Google Scholar] [CrossRef]
  18. Vejre, H.; Abildtrup, J.; Andersen, E.; Andersen, P.S.; Brandt, J.; Busck, A.; Dalgaard, T.; Hasler, B.; Huusom, H.; Kristensen, L.S.; et al. Multifunctional Agriculture and Multifunctional Landscapes—Land Use as an Interface. In Multifunctional Land Use: Meeting Future Demands for Landscape Goods and Services; Mander, Ü., Wiggering, H., Helming, K., Eds.; Springer: Berlin/Heidelberg, Germany, 2007; pp. 93–104. ISBN 978-3-540-36763-5. [Google Scholar]
  19. Kallas, Z.; Gómez-Limón, J.A.; Hurlé, J.B. Decomposing the Value of Agricultural Multifunctionality: Combining Contingent Valuation and the Analytical Hierarchy Process. J. Agric. Econ. 2007, 58, 218–241. [Google Scholar] [CrossRef]
  20. Wiggering, H.; Müller, K.; Werner, A.; Helming, K. The Concept of Multifunctionality in Sustainable Land Development. In Sustainable Development of Multifunctional Landscapes; Helming, K., Wiggering, H., Eds.; Springer Berlin Heidelberg: Berlin/Heidelberg, Germany, 2003; pp. 3–18. [Google Scholar]
  21. Liu, C.; Xu, Y.; Huang, A.; Liu, Y.; Wang, H.; Lu, L.; Sun, P.; Zheng, W. Spatial Identification of Land Use Multifunctionality at Grid Scale in Farming-Pastoral Area: A Case Study of Zhangjiakou City, China. Habitat Int. 2018, 76, 48–61. [Google Scholar] [CrossRef]
  22. Zhang, Y.; Long, H.; Tu, S.; Ge, D.; Ma, L.; Wang, L. Spatial Identification of Land Use Functions and Their Tradeoffs/Synergies in China: Implications for Sustainable Land Management. Ecol. Indic. 2019, 107, 105550. [Google Scholar] [CrossRef]
  23. Zou, L.; Liu, Y.; Yang, J.; Yang, S.; Wang, Y.; Zhi, C.; Hu, X. Quantitative Identification and Spatial Analysis of Land Use Ecological-Production-Living Functions in Rural Areas on China’s Southeast Coast. Habitat Int. 2020, 100, 102182. [Google Scholar] [CrossRef]
  24. Andersen, P.S.; Vejre, H.; Dalgaard, T.; Brandt, J. An Indicator-Based Method for Quantifying Farm Multifunctionality. Ecol. Indic. 2013, 25, 166–179. [Google Scholar] [CrossRef]
  25. Yu, Z.; Xu, E.; Zhang, H.; Shang, E. Spatio-Temporal Coordination and Conflict of Production-Living-Ecology Land Functions in the Beijing-Tianjin-Hebei Region, China. Land 2020, 9, 170. [Google Scholar] [CrossRef]
  26. Paracchini, M.L.; Pacini, C.; Jones, M.L.M.; Pérez-Soba, M. An Aggregation Framework to Link Indicators Associated with Multifunctional Land Use to the Stakeholder Evaluation of Policy Options. Ecol. Indic. 2011, 11, 71–80. [Google Scholar] [CrossRef]
  27. Xue, M.; Wang, H.; Wei, Y.; Ma, C.; Yin, Y. Spatial Characteristics of Land Use Multifunctionality and Their Trade-off/Synergy in Urumqi, China: Implication for Land Space Zoning Management. Sustainability 2022, 14, 9285. [Google Scholar] [CrossRef]
  28. Sun, X.; Yu, C.; Wang, J.; Wang, M. The Intensity Analysis of Production Living Ecological Land in Shandong Province, China. Sustainability 2020, 12, 8326. [Google Scholar] [CrossRef]
  29. Verburg, P.H.; Neumann, K.; Nol, L. Challenges in Using Land Use and Land Cover Data for Global Change Studies. Glob. Chang. Biol. 2011, 17, 974–989. [Google Scholar] [CrossRef] [Green Version]
  30. Dewan, A.M.; Yamaguchi, Y. Land Use and Land Cover Change in Greater Dhaka, Bangladesh: Using Remote Sensing to Promote Sustainable Urbanization. Appl. Geogr. 2009, 29, 390–401. [Google Scholar] [CrossRef]
  31. Verburg, P.H.; van de Steeg, J.; Veldkamp, A.; Willemen, L. From Land Cover Change to Land Function Dynamics: A Major Challenge to Improve Land Characterization. J. Environ. Manag. 2009, 90, 1327–1335. [Google Scholar] [CrossRef]
  32. Zhang, H.; Xu, E.; Zhu, H. Ecological-Living-Productive Land Classification System in China. J. Resour. Ecol. 2017, 8, 121–128. [Google Scholar] [CrossRef]
  33. DeFries, R.S.; Foley, J.A.; Asner, G.P. Land-Use Choices: Balancing Human Needs and Ecosystem Function. Front. Ecol. Environ. 2004, 2, 249–257. [Google Scholar] [CrossRef]
  34. Burkhard, B.; Kroll, F.; Nedkov, S.; Müller, F. Mapping Ecosystem Service Supply, Demand and Budgets. Ecol. Indic. 2012, 21, 17–29. [Google Scholar] [CrossRef]
  35. DeFries, R.; Hansen, A.; Turner, B.L.; Reid, R.; Liu, J. Land Use Change around Protected Areas: Management to Balance Human Needs and Ecological Function. Ecol. Appl. 2007, 17, 1031–1038. [Google Scholar] [CrossRef]
  36. Purvis, B.; Mao, Y.; Robinson, D. Three Pillars of Sustainability: In Search of Conceptual Origins. Sustain. Sci. 2019, 14, 681–695. [Google Scholar] [CrossRef] [Green Version]
  37. Ouyang, Z.; Song, C.; Zheng, H.; Polasky, S.; Xiao, Y.; Bateman, I.J.; Liu, J.; Ruckelshaus, M.; Shi, F.; Xiao, Y.; et al. Using Gross Ecosystem Product (GEP) to Value Nature in Decision Making. Proc. Natl. Acad. Sci. USA 2020, 117, 14593–14601. [Google Scholar] [CrossRef] [PubMed]
  38. Padró, R.; La Rota-Aguilera, M.J.; Giocoli, A.; Cirera, J.; Coll, F.; Pons, M.; Pino, J.; Pili, S.; Serrano, T.; Villalba, G.; et al. Assessing the Sustainability of Contrasting Land Use Scenarios through the Socioecological Integrated Analysis (SIA) of the Metropolitan Green Infrastructure in Barcelona. Landsc. Urban Plan. 2020, 203, 103905. [Google Scholar] [CrossRef] [PubMed]
  39. Shandong Provincial Bureau of Statistics; Shandong Survey Headquarters of National Bureau of Statistics (Eds.) Shandong Statistical Yearbook 2021; China Statistics Press: Beijing, China, 2021. [Google Scholar]
  40. Liu, J.; Liu, Y.; Li, Y. Classification Evaluation and Spatial-Temporal Analysis of “Production-Living-Ecological” Spaces in China. Acta Geogr. Sin. 2017, 72, 1290–1304. [Google Scholar] [CrossRef]
  41. Wang, A.; Liao, X.; Tong, Z.; Du, W.; Zhang, J.; Liu, X.; Liu, M. Spatial-Temporal Dynamic Evaluation of the Ecosystem Service Value from the Perspective of “Production-Living-Ecological” Spaces: A Case Study in Dongliao River Basin, China. J. Clean. Prod. 2022, 333, 130218. [Google Scholar] [CrossRef]
  42. Xie, G.; Zhang, C.; Zhen, L.; Zhang, L. Dynamic Changes in the Value of China’s Ecosystem Services. Ecosyst. Serv. 2017, 26, 146–154. [Google Scholar] [CrossRef]
  43. Hong, T.C.; Santhapparaj, A.S. Skilled Labor Immigration and External Trade in Malaysia: A Pooled Data Analysis. Perspect. Glob. Dev. Technol. 2006, 5, 351–366. [Google Scholar] [CrossRef]
  44. Feng, Q.; Zhao, W.; Fu, B.; Ding, J.; Wang, S. Ecosystem Service Trade-Offs and Their Influencing Factors: A Case Study in the Loess Plateau of China. Sci. Total Environ. 2017, 607–608, 1250–1263. [Google Scholar] [CrossRef]
  45. Liu, C.; Xu, Y.; Lu, X.; Han, J. Trade-Offs and Driving Forces of Land Use Functions in Ecologically Fragile Areas of Northern Hebei Province: Spatiotemporal Analysis. Land Use Policy 2021, 104, 105387. [Google Scholar] [CrossRef]
  46. Zhu, C.; Dong, B.; Li, S.; Lin, Y.; Shahtahmassebi, A.; You, S.; Zhang, J.; Gan, M.; Yang, L.; Wang, K. Identifying the Trade-Offs and Synergies among Land Use Functions and Their Influencing Factors from a Geospatial Perspective: A Case Study in Hangzhou, China. J. Clean. Prod. 2021, 314, 128026. [Google Scholar] [CrossRef]
  47. Meybeck, M.; Green, P.; Vörösmarty, C. A New Typology for Mountains and Other Relief Classes. Mt. Res. Dev. 2001, 21, 34–45. [Google Scholar] [CrossRef] [Green Version]
  48. Long, H.; Ge, D.; Zhang, Y.; Tu, S.; Qu, Y.; Ma, L. Changing Man-Land Interrelations in China’s Farming Area under Urbanization and Its Implications for Food Security. J. Environ. Manag. 2018, 209, 440–451. [Google Scholar] [CrossRef] [PubMed]
  49. Van der Sluis, T.; Pedroli, B.; Kristensen, S.B.P.; Lavinia Cosor, G.; Pavlis, E. Changing Land Use Intensity in Europe—Recent Processes in Selected Case Studies. Land Use Policy 2016, 57, 777–785. [Google Scholar] [CrossRef]
  50. Parris, T.M.; Kates, R.W. Characterizing and Measuring Sustainable Development. Annu. Rev. Environ. Resour. 2003, 28, 559–586. [Google Scholar] [CrossRef]
  51. Jiang, Y.; Long, H.; Ives, C.D.; Deng, W.; Chen, K.; Zhang, Y. Modes and Practices of Rural Vitalisation Promoted by Land Consolidation in a Rapidly Urbanising China: A Perspective of Multifunctionality. Habitat Int. 2022, 121, 102514. [Google Scholar] [CrossRef]
Figure 1. Evaluation framework of land use functional value.
Land 12 00222 g001
Figure 2. Location and topology of Shandong Province.
Land 12 00222 g002
Figure 3. Flowchart of the study.
Land 12 00222 g003
Figure 4. Distributive pattern of the land use functional value density and the change from 2009 to 2018. (ad): The value density in 2009 classified by quantiles; (eh): The value density in 2018 classified by quantiles; (il): The value density changes from 2009 to 2018, with “major rise” for the first quarter, “medium rise” for the second quarter, and “minor rise” for the rest risen townships.
Land 12 00222 g004
Figure 5. Relationship of three dimensions of land use functional values. (a): Relationship between social and economic functions; (b): Relationship between environmental and economic functions; (c): Relationship between environmental and social functions. The red lines are linear fit lines.
Land 12 00222 g005
Figure 6. The sustainable development classification of townships in 2009 (a) and 2018 (b).
Land 12 00222 g006
Table 1. LUFs and corresponding land uses in the second national land use survey of China.
DimensionsLand Use FunctionsCorrespondent Land Uses
EconomicAgricultural productionFarming productionIrrigable land, dryland, paddy field, fruit orchard, tea orchard, other orchard, facility agricultural land
Forestry productionForest land, shrub land, other woodland
Husbandry productionNatural pasture, artificial pasture, facility agricultural land
Fishery productionLake, river, pond, reservoir, facility agricultural land
Manufacturing and construction productionMining land, cities, towns, villages
Commercial and service productionCities, towns, villages
Transport for productionRailway land, airport land, road land, pipeline transportation land, harbor and wharf land, rural road land
SocialResidentialCities, towns, villages
Life servicesPublic servicesCities, towns, villages, scenic and other special use land
Commercial life servicesCities, towns, villages
Provision of workProvision of work in urban areaCities, towns
Provision of work in rural areaVillages, irrigable land, dryland, paddy field, fruit orchard, tea orchard, other orchard, facility agricultural land
Transport for livingRailway land, airport land, road land, harbor and wharf land, rural road land
Ecosystem culturalIrrigable land, dryland, paddy field, fruit orchard, tea orchard, other orchard, natural pasture, artificial pasture, other grassland, forest land, shrub land, other woodland, lake, river, pond, reservoir, ditch, inland flat, tidal flat, hydraulic construction land, sand, swampland, saline land, bare land
EnvironmentalEcosystem regulating and supportingIrrigable land, dryland, paddy field, fruit orchard, tea orchard, other orchard, natural pasture, artificial pasture, other grassland, forest land, shrub land, other woodland, lake, river, pond, reservoir, ditch, inland flat, tidal flat, hydraulic construction land, sand, swampland, saline land, bare land
Table 2. Descriptive statistics of independent variables.
VariablesDescriptionMeanStd. Dev.Min.Max.
Slopeaverage slope of township (degree)6.082.71021.90
DSeadistance to sea (10 km)12.6810.38038.65
Preaverage annual precipitation of township (mm)694.0782.14446.921061.95
Tempmean annual temperature of township (°C)13.750.918.7917.30
DCitydistance to prefecture center (10 km)3.862.67015.67
DCountydistance to county center (10 km)0.940.8406.06
DHwaydistance to national highway or above (10 km)0.430.7506.69
Urban2009whether the township is urban area in 2009 (1 = yes)0.120.3201
Urban2018whether the township is urban area in 2018 (1 = yes)0.120.3301
Popden2010average population density in 2010 (100 persons/km2)17.9038.090287.50
Popden2015average population density in 2015 (100 persons/km2)19.8248.960375.68
Lgrevpc2009logarithm of public expenditure per capita of the county in 2009 (yuan)7.650.506.689.14
Lgrevpc2018logarithm of public expenditure per capita of the county in 2018 (yuan)8.760.505.8910.39
Lggdppc2009logarithm of GDP per capita of the county in 2009 (yuan)10.480.659.1312.31
Lggdppc2018logarithm of GDP per capita of the county in 2018 (yuan)11.110.639.9712.86
Table 3. Land use functional value (unit: trillion yuan) and share of Shandong Province.
DimensionsLand Use Functions20092018Change
ValueShare (%)ValueShare (%)Value Share (%)
EconomicAgricultural production0.273.470.443.220.17−0.25
Manufacturing and construction production1.9324.993.4625.331.540.34
Commercial and service production1.2416.043.6026.352.3710.31
Transport for production0.172.240.382.760.200.52
Subtotal3.6046.747.8857.664.2810.92
SocialResidential0.151.940.332.440.180.51
Life services0.476.041.208.750.732.71
Provision of work0.131.690.352.560.220.87
Transport for living0.040.480.090.690.060.20
Ecosystem cultural0.101.290.110.830.01−0.46
Subtotal0.8811.442.0915.271.213.83
EnvironmentalEcosystem regulating and supporting3.2241.823.7027.070.48−14.75
Total7.7110013.6710011.450
Table 4. Type transfer matrix of townships from 2009 to 2018.
2018Low ValueEnvironmental-DominatedSocioeconomic-DominatedHigh Value
2009
Low value94212200
Environmental-dominated933616
Socioeconomic-dominated1004600
High value08782
Table 5. Regression results of the econometric models.
Model 1Model 2Model 3Model 4Model 5Model 6
DenEconDenEconDenSocDenSocDenEnvDenEnv
Slope−1.79 ***−2.40 ***−0.47 ***−0.61 ***−0.81 ***−4.52 ***
(−3.87)(−5.22)(−4.40)(−5.68)(−4.90)(−5.55)
sqSlope 0.22 ***
(5.16)
DSea1.19 ***4.21 ***0.37 ***1.05 ***−0.26 ***−0.23 ***
(5.51)(6.70)(7.21)(7.20)(−6.10)(−5.34)
sqDSea −0.10 *** −0.02 ***
(−5.96) (−6.09)
Pre0.05 ***0.04 **0.02 ***0.02 ***0.02 ***0.02 ***
(2.80)(2.02)(5.17)(4.37)(3.70)(4.43)
Temp−0.170.09−0.15−0.092.10 ***−4.51
(−0.11)(0.05)(−0.40)(−0.23)(3.58)(−1.06)
sqTemp 0.24
(1.53)
Dcity0.120.240.060.080.42 **0.45 **
(0.21)(0.40)(0.44)(0.64)(2.17)(2.30)
Dcounty−13.55 ***−12.92 ***−3.47 ***−3.33 ***2.36 ***2.25 ***
(−8.68)(−8.40)(−9.59)(−9.34)(3.18)(3.13)
Dhway−1.790.50−0.460.051.14 **0.34
(−1.28)(0.35)(−1.49)(0.17)(2.03)(0.63)
Urban284.25 ***285.27 ***64.65 ***64.88 ***−1.91−1.78
(16.51)(16.71)(18.01)(18.24)(−1.46)(−1.40)
Popden2.68 ***2.70 ***0.68 ***0.68 ***−0.09 ***−0.09 ***
(19.65)(20.29)(20.86)(21.55)(−11.05)(−10.63)
Lgrevpc33.22 ***37.13 ***11.28 ***12.16 ***0.560.32
(8.33)(9.34)(11.14)(11.86)(1.38)(0.77)
Lggdppc32.42 ***28.71 ***5.14 ***4.31 ***4.25 ***4.49 ***
(6.41)(5.91)(4.36)(3.77)(5.01)(5.30)
Constant−623.76 ***−619.66 ***−152.80 ***−151.87 ***−65.40 ***−11.68
(−12.63)(−12.65)(−13.16)(−13.23)(−4.63)(−0.36)
Observations379637963796379637963796
R-squared0.8160.8170.8150.8170.1930.229
Note: Robust t-statistics in parentheses; *** p < 0.01, ** p < 0.05.
Disclaimer/Publisher’s Note: The statements, opinions and data contained in all publications are solely those of the individual author(s) and contributor(s) and not of MDPI and/or the editor(s). MDPI and/or the editor(s) disclaim responsibility for any injury to people or property resulting from any ideas, methods, instructions or products referred to in the content.

