Abstract
Over the preceding decades, climate change has affected precipitation, the most common factor triggering landslides. The aim of this study is to highlight this impact by examining the precipitation trends in the Chania regional unit, Greece, with the help of the precipitation time series provided by 21 local meteorological stations covering a period from 1955 to 2020. The analysis also focuses on the extreme precipitation events of February 2019, where the monthly cumulated precipitation amount reached 1225 mm, one of the highest ever recorded in Greece. Moreover, an inventory of past and recent landslides was created and the intensity–duration landslide precipitation thresholds were evaluated. Daily simulations of precipitation from three state-of-the-art regional climate models were used to analyze precipitation patterns under two representative concentration pathways (RCPs), 4.5 and 8.5, for the period 2030–2060. The application of the estimated precipitation thresholds on the daily future precipitation projections revealed an increase in the following decades of the precipitation events that can activate a landslide and, therefore, highlighted the climate change impact. Moreover, the mean annual precipitation of the preceding 10 years was evaluated and used along with local hydro-geological data and the recent landslide inventory, providing approximately a 5% more effective landslide susceptibility map compared with the relative maps produced by using the mean annual precipitation evaluated for the control period (1976–2005) and for the preceding 30 years. Thus, landslide susceptibility emerges as a dynamic process and the landslide susceptibility map needs to be regularly updated due to the significant and ongoing changes in precipitation because of climate change.
1. Introduction
Due to climate change, the weather patterns around the world have changed dramatically, causing extreme precipitation events in some regions and prolonged drought periods in others [1]. These changes significantly affect the landslide mechanism since precipitation is the most common triggering factor [2,3]. Especially for Greece, precipitation has proved to be not just the main activation factor [4,5,6] but also responsible for the activation of more than 90% of the recorded landslides [7].
In a landslide susceptibility assessment (LSA) with a multicriteria decision analysis method, hydrological and geomorphological data are identified as the most critical landslide causal factors and are usually combined in a geographical information system (GIS) to create a relevant susceptibility map [8]. In this framework, usually, the mean annual precipitation (MAP) of the study region is used as a causal factor to correlate precipitation with other landslide causal factors. For example, the GEOspatial global LANdslide Database (GEOLAND) [8] includes more than 25 relative research studies that use the MAP as a causal factor. In most of these cases, the MAP is the average value of long time series (e.g., 1950–2016 in [9]) and sometimes refers to a past period (e.g., 1950–1974 in [10]). In some of these cases, the produced susceptibility maps are being validated by using an inventory of landslides that occurred during the same period as the precipitation time series or a similar one.
However, radical changes in the meteorological patterns due to climate change can render the MAP partially outdated and the relevant LSA sometimes less effective in identifying recent landslide events. There is a negative trend in the MAP recorded in several Mediterranean areas [11,12], while a higher occurrence of extreme precipitation events is projected in many subregions of the Mediterranean, such as Sobral de Monte Agraco and Santa Marta de Penaguiao in Portugal [13] and Athens, Greece [14]. On the basis of precipitation measurements for over a century in Athens, Maheras [15] provided evidence that extreme precipitation events are increasing despite a decline in total precipitation. Despite the reduced MAP, an increasing trend in landslide events has also been recorded in Europe and has been attributed to the increasing frequency of extreme precipitation events [16]. Apart from increased frequency, the high intensity of extreme precipitation events is also sometimes correlated with landslide activation [17,18] Therefore, changes in the intensity of the landslide events due to climate change are a critical parameter that need to be further examined.
The Chania regional unit is in the western part of Crete Island, Greece, and has notable economic and cultural activity. During the last few years, many extreme precipitation events have occurred in Chania, activating a series of devastating landslide events. Some examples of such events are the storms Chioni and Oceanis (as named by the National Observatory of Athens (NOA)), which occurred in February 2019 [19]. Their intensity was so high that the average monthly cumulated precipitation recorded at the Askyfou meteorological station (1255 mm) was the highest ever recorded at that location and one of the highest ever in Greece [19]. The resulting landslides caused many fatalities, and there was considerable damage to the local infrastructure [20,21,22].
The aim of this study is to examine the impacts of climate change, and the related changes in precipitation, on the susceptibility to landslides on a regional basis. The Chania regional unit was selected as a case study because of the abundance of meteorological, geological, and geotechnical data, as well as a rich landslide inventory data set. Chania is of great geomorphological interest as it combines an extensive coastline with plains and mountains of low and high altitudes. Due to its complex landscape and geological structure, it is expected to provide useful indications for the relative impact of climate change on the landslide phenomenon for many regions, especially in the Mediterranean area.
2. Study Area
The Chania regional unit is the western regional unit of Crete (Figure 1), the largest island of Greece and the fifth largest in the Mediterranean Sea [17]. The capital of the regional unit is the homonymous, Chania city. According to the 2021 census of the Hellenic Statistical Authority (ELSTAT), although overall, the population of Greece has decreased, the population of the Chania regional unit has increased [23]. This population growth, with the resulting necessity for authorities to urgently identify new residential regions with low susceptibility to landslides, highlights the value of an effective and updated LSA of that area.
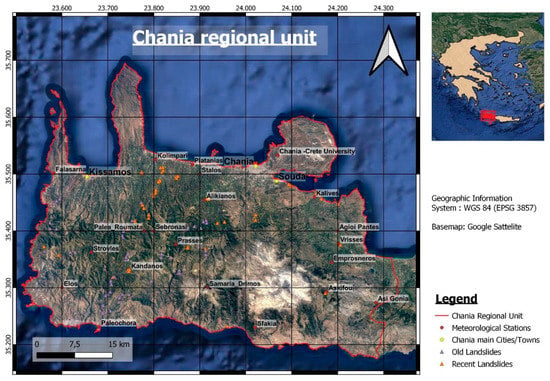
Figure 1.
Spatial distribution of the meteorological stations used during this research study.
2.1. Geomorphology
The geomorphology of the examined area is mainly divided into three zones: the mountainous zone, with an elevation of 800 m to 2453 m; the semi-mountainous zone, with an elevation of 400 m to 800 m; and the lowland zone, with an elevation of less than 400 m. The mountainous zone covers the central and southern parts of Chania, and the steep slopes on its south reach the sea (Libyan Sea). The highest mountainous range is the Lefka Ori, in the southeast, with a maximum elevation of 2453 m. It is one of the highest mountains in Crete, and in Greece in general. The lowland zone is located between the northern part of Chania (reaching the Aegean Sea) and the central part. The semi-mountainous zones lie between the mountainous zone and the lowland zone in the central part of Chania and between the main mountain masses in the south. In the northern part of Chania are three peninsulas, over 10 km long. Two of them, the Gramvousa and the Rodopos peninsulas, are in the western part of Chania, while the Acrotiri peninsula is in the eastern part. The hydrographic network is rather dense, with large and small rivers that end either in the Aegean Sea in the north or in the Libyan Sea in the south. In Chania is also located the Kournas lake, the only natural lake on Crete Island. Moreover, the long gorges across the area indicate the intense geological activity of the past. Among the most impressive gorges are the Samaria gorge, which is in the south and is 18 km long; the Agia Irini gorge, which is in the south and is 7.5 km long; the Imbros gorge, which is in the south and is 7 km long; and the Therissos gorge, which is in the north and is 6 km long. Considering that, as per local research studies, the elevation and the unfavorable angles and aspects of the slopes are among the most critical causal factors of landslides [8], a significant part of the landslide activity is expected to be identified in the central and southern parts of the area.
2.2. Climate
Chania has a temperate Mediterranean climate, characterized by warm to hot dry summers and mild to cool wet winters. The precipitation events are unevenly distributed across the year and usually occur from mid-autumn to mid-spring [11]. A great number of landslide events are activated during this period as the augmented precipitation leads to fluctuations in groundwater levels and the subsequent instability of slopes [24]. During summer, precipitation events are rare but when they occur, they usually produce a substantial amount of water in a short duration [11]. Because of the high intensity–duration (ID) ratio of these events, the local ID threshold can be exceeded, activating a series of landslide events.
2.3. Geology
Crete Island is characterized by an extremely complicated geological structure with intensive tectonic fragmentation. Geological formations from four geotectonic zones (Pindos, Tripoli, Phyllite–Quartzite series, and Ionian) participate in the geological structure of the western part of the Crete prefecture. In detail, the study area is composed of:
- Fine-grained to coarse-grained, loose quaternary formations (clayey sandy materials, unconsolidated clay material, and carbonate and phyllitic rubble), as well as weathered products of older formations, mainly along the northern coastline and at the south of the Chania city.
- Neogene sediments (thick-bedded to unbedded marly limestones; clayey–marly formations with silt and sand intercalations; conglomerates and rubbles from Tripoli and Pindos zone formations, strongly consolidated with calcific cement).
- Sediments of the Pindos zone (allochthonous series), flysch (sandstones; calcareous sandstones; and shales, i.e., thin, lenticular conglomerate intercalations, were locally observed), and limestones (carbonates), mainly in the southeast of the Chania prefecture.
- Sediments of the Tripoli zone (Tripoli zone tectonic nappe), flysch (shales and sandstones alternating with small intercalations of calcareous turbidites), limestones, dolomites, and dolomitic limestones. The lower part of the Tripoli zone consists of the Tripolion carbonates, which are mainly exposed to the Acrotiri peninsula and at the center of the examined area.
- Phyllite–Quartzite series, which lies overthrusted on the Ionian formations (Phyllite–Quartzite series tectonic nappe). It is strongly folded and foliated. It consists of ortho and para rocks metamorphosed into HP-LT conditions during upper Oligocene–lower Miocene.
- Sediments of the Ionia zone (Autochthonous series). In Crete, it is known as the Plattenkalk unit and occupies the lower part. Stratigraphically, the age fluctuates from upper Carboniferous–lower Permian up to Eocene. It consists of schists, recrystallized limestones, dolomites, evaporites, and quartzites. Plattenkalk limestones dominate the region of the Lefka Ori mountain, on the southeast of the examined area.
For this study, a unified geological map of the study area was created by combining geological maps of the Hellenic Survey of Geology and Mineral Exploration (HSGME) provided at a scale of 1:50.000 (Figure S1 ).
The Mediterranean basin is also a place of frequent earthquake activity as the tectonic plate of Africa subducts underneath the Eurasian tectonic plate. As a result, the whole Crete Island is an area of high seismic activity, which is also correlated with the activation of landslide events [25]. In Chania, two main active faults are identified, in the western part [26].
2.4. Human Activity
Human activity in the study area has also rendered it susceptible to landslides. A characteristic example is the rather dense road network that spatially covers almost the whole area and consists of a main roadway in the north, some roadways along the north–south direction, and many local primary and secondary roads. Another example is that large parts of the area, mainly the lowland zone, are subjected to heavy irrigation during agricultural reasons, which causes seasonal fluctuations in the aquifers.
Extensive tectonic fragmentation and repeated thrusts, intense morphological relief with steep slopes, a dense drainage network with deep valleys, extensive human activities, a relatively dense road network, and arable–pasture areas are some of the characteristics of the study area particularly prone to landslide phenomena.
3. Data and Methodology
During this research study, to investigate the potential correlation of precipitation changes with the landslide phenomenon, meteorological data obtained from 21 meteorological stations were used either individually or in combination with other data, as follows:
- Individually, to evaluate the relative precipitation trends,
- With landslide inventory, to determine the landslide precipitation thresholds,
- With regional climate models (RCMs), to evaluate the landslide events expected in the future,
- With local hydro-geomorphological data to create landslide susceptibility maps (LSMs) and evaluate the impact of climate change on landslide mechanism.
Figure 2 illustrates the steps of the methodology followed. The results in each step are illustrated in a pink rectangle, while the arrows illustrate the direction of the following process.
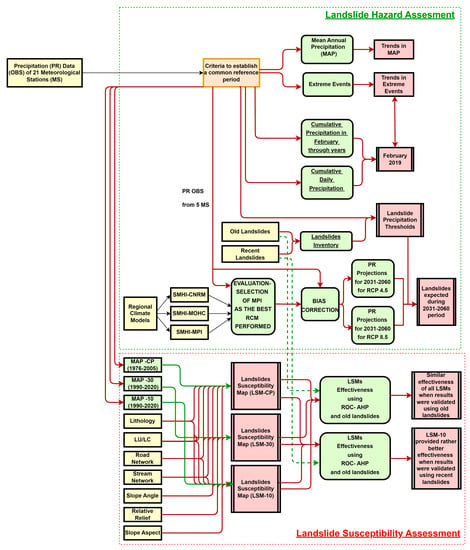
Figure 2.
Methodology Flowchart.
3.1. Meteorological Data
3.1.1. Precipitation Data
The effect of the changes in precipitation on the landslide mechanism was analyzed in various stages. The MAP is usually used as a causal factor to determine the landslide susceptibility of a region (e.g., more than 25 research studies are included in the [8] geodatabase).
So, local precipitation time series were analyzed to estimate the possible trends in the mean annual precipitation (MAP). These time series concern daily precipitation data from 21 meteorological stations and were obtained either by NOA, through the meteo platform [27], or by other organizations or institutions, such as the Crete University and the Crete regional unit, through the hydroscope project [28]. However, since the precipitation measurements are from different databases, they refer to different time periods (Table S1). Therefore, according to the requirements of each analysis that followed, specific criteria were applied to establish a common and suitable reference period, according to data availability. These criteria are further analyzed in the following paragraphs, along with each data analysis that was performed.
Subsequently, the available time series were used to examine the way that extreme precipitation events are correlated with the activation and intensity of recent landslide events. In that direction, the selected extreme precipitation events of February 2019 were analyzed and compared with the rest of the events that had occurred in that region over the years. To determine the precipitation thresholds of the local landslides, the precipitation events were also used along with a landslide inventory, which can be used in the frame of an early warning system. The final stage of the precipitation analysis included the use of these time series for the evaluation and bias correction of simulations by regional climate models (RCMs) applied to identify possible trends in landslide occurrence in the future.
3.1.2. Precipitation Trends
Following good practices suggested by the literature for identifying possible trends in the MAP [29,30], only the meteorological stations that provided time series for at least 10 consecutive years (the Askifou, Chania, Emprosneros, Kalives, Kandanos, Palea Roumata, Paleochora, Prasses, Samaria, and Strovles stations) were selected during this stage of analysis. Analysis revealed that the relevant MAP in eight of these stations had decreased over the years, while in two of them, there had been no significant change (Table S2).
For instance, Figure 3 shows the relative graph for the Strovles meteorological station, where the blue bars represent the MAP (in mm) recorded every year from 1976 to 2019 (Figures S2–S10 for the rest of the stations). The blue dotted line shows the total precipitation trend over the years, and the graph also illustrates the relative equation.

Figure 3.
Total annual precipitation as per the Strovles meteorological station from 1976 to 2019.
The meteorological stations used at this stage are uniformly distributed, sufficiently covering the study area, considering a buffer with a radius of 15 km around each station (Figure S11).
Moreover, boxplots diagrams presenting the mean monthly precipitation (MMP) were created for the meteorological stations of Askifou, Kalives, Kandanos, Palea Roumata, and Strovles as these stations provide data for at least 30 years. In this analysis, the precipitation data were processed each month. Thus, the availability of precipitation data of 30 years was considered as most suitable. As an example, Figure 4 presents the boxplots of the Askifou meteorological station (Figures S12–S15 for the rest of the stations). In these boxplots, the boxes include the most common values of the MMP. The top and the bottom edges represent the quartile (1/4) values and their centers the median value. According to the median and the quartile values, the boxes (whiskers) are designed so that their edges represent the normal maximum and minimum values. Each value that exceeds the normal maximum and minimum values is characterized as an outlier value and represents an extreme event.
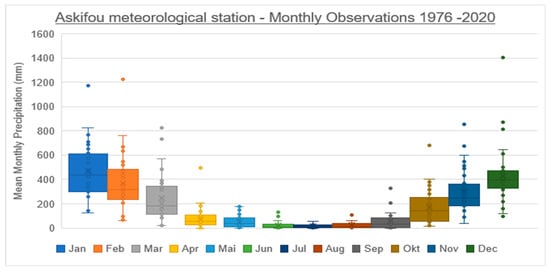
Figure 4.
Boxplots of the mean monthly precipitation (total precipitation per month) of the Askifou station from 1976 to 2020.
As can be observed from these diagrams, most of the precipitation was recorded from mid-autumn to mid-spring, in agreement with the findings of Zerefos [11] for East Mediterranean. Most of the extreme precipitation events were also recorded during this period. Most of the recent landslide events recorded in this area by the authorities (Table S3) also occurred in this period, showing the strong correlation between the extreme precipitation events and the activation mechanism of landslides.
3.1.3. Extreme Precipitation Events of February 2019
As previously described, the extreme precipitation events that occurred in February 2019 activated a great number of landslide events, which caused many fatalities and destroyed critical infrastructure in the study area. To investigate the intensity of this phenomenon, we compared the cumulative precipitation recorded in this month with the relative precipitation of the previous years. Figure 5 illustrates the cumulative precipitation recorded in February from 1976 to 2019 at the Strovles meteorological station. It is observed that the cumulative precipitation in February 2019 was considerably higher than the relative precipitation in same period in other years. The rest of the examined stations (Askifou, Chania, Emprosneros, Kandanos, Paleochora, and Samaria; Table S1) that provided data for February 2019 and for at least 10 years presented similar results (Figures S16–S21).
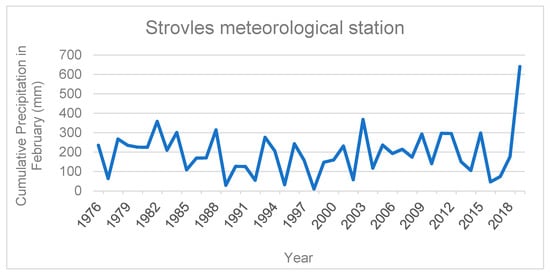
Figure 5.
Cumulative precipitation in February from 1976 to 2019 at the Strovles meteorological station.
In addition to the cumulative amount of precipitation, it is also significant to investigate the relative distribution of precipitation during this month.
Figure 6 illustrates the daily precipitation during February 2019 recorded at the Agioi Pantes meteorological station. The main precipitation events were recorded in two short time periods: 13–17 February 2019 and 23–26 February 2019. The sum of the precipitation in these two periods corresponds to 86.88% of the total precipitation recorded during the whole of February. The rest of the examined stations presented similar results (Figures S22–S37; Table S4).

Figure 6.
Cumulative daily precipitation in February 2019 recorded at the Agioi Pantes meteorological station.
This rather high percentage, combined with the huge monthly cumulated precipitation and the short time period that the phenomena lasted, shows the high intensity of the phenomenon and is in accordance with the large number of landslides that occurred during this period, their catastrophic results, and their extended spatial distribution over the whole regional unit. Hence, the intensity of the precipitation emerges as a critical parameter for activating landslides. Note that the analysis does not include any vulnerability index (such as census data, cadastral data, essential facilities analyzed in [31]) and therefore does not include risk modeling.
3.2. Landslide Inventory
The landslide inventory consists of two parts: the first one includes 60 landslides recorded from 1960 to 2010, while the second one includes 62 landslides recorded in 2019 and 2020 (Figure 1). This distinction was made to examine the effectiveness of the most common methods concerning past and recent landslide events. The data from the first part were derived from previously documented events, while the data for the second part were derived from technical reports of the Hellenic Survey of Geology and Mineral Exploration (HSGME) [32,33,34], remote sensing techniques [35], and field surveys. Figure 7A–F illustrate characteristic examples of the recent landslide events contained in the HSGME (formerly the Institute of Geology and Mineral Exploration, or IGME) technical reports.
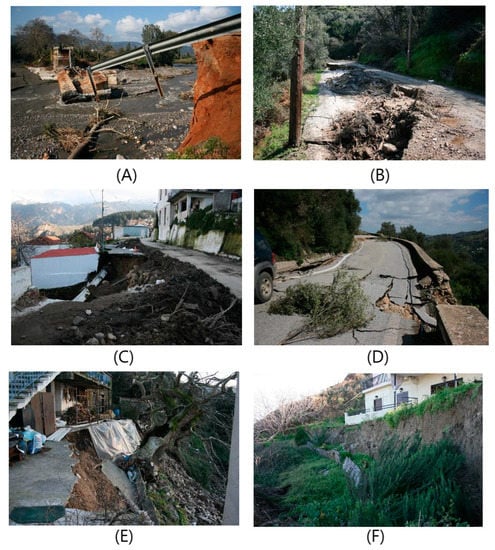
Figure 7.
Impact of main landslide events: (A) an old bridge over Keritis river damaged by mud flow, (B) road embankment failure along the secondary road net to Giannikiana, (C) rotational slide due to excessive precipitation events along the Chania–Omalos provincial road, Lakki village, (D) the stability of the road net to Fotakado affected by rotational slide, (E) the local road net and houses in Platanes village, Palea Roumata, affected by mud flow, and (F) translation slide in the weathered mantle of Neogene formations in Kato Stalos village [36,37].
The main types of landslides encountered [38,39,40] are translational slides, rotational slides, earth slides, and earth flows. A translational slide dominates along the contact of sandstone and argillaceous phases of flysch, while a rotational slide is observed in the fine Neogene sentiments. Earth slides and earth flows triggered by heavy rainfalls are manifested in the contemporary geological deposits (Quaternary). Rockfalls are rarer (mainly in limestone formations) and occur in mid-high altitudes. Simple statistical methods were used for the first evaluation and quantitative expression of the engineering geological data related to the lithology and structure of the affected materials. The most critical landslide-prone geological formations in terms of lithology and structure are flysch, schists (phyllites, quartzites, shales, and schists), and ophiolites.
4. Results and Discussion
Two different approaches were used to study the landslide phenomenon: a) the hazard assessment approach, during which the precipitation thresholds and the future precipitation projections were evaluated and b) the susceptibility assessment approach during which the landslide susceptibility maps were generated. It is critical to evaluate the precipitation thresholds of landslides as their application in the projected precipitation values, derived by the regional climate models (RCMs), can provide indications about the landslide events that are going to be activated in the future. On the other hand, landslide susceptibility assessment is also very critical as it leads to the generation of the landslide susceptibility maps which can be a very useful tool for addressing landslides by the local authorities. It is significant to note that these two approaches are distinct and are not connected. The different steps followed by each of these different approaches are illustrated in Figure 2.
4.1. Landslide Hazard Assessment
During the hazard assessment the precipitation thresholds that can trigger a landslide at the examined area, were evaluated. Additionally, regional climate models were used to evaluate the precipitation projections from 2031–2060 and subsequently to evaluate the frequency that the aforementioned thresholds are going to be exceeded in the future.
4.1.1. Precipitation Thresholds
Precipitation thresholds can be distinguished on the basis of either the extent of the study area or the process that is followed. On the basis of the extent of the study area, the thresholds can be global, regional (e.g., thresholds of a country/prefecture), or local (e.g., thresholds of a local area) [41]. On the basis of the process followed, they can be distinguished into physical and empirical ones. The physical thresholds “integrate slope physical-hydrological modelling and stability analyses,” while the empirical ones, which are the most widespread, use past precipitation data and landslide inventories [42]. Among the most frequent empirical landslide thresholds that have been evaluated for Greece are the daily precipitation thresholds [43] and the intensity–duration (ID) [44] precipitation thresholds.
Daily Precipitation Thresholds
Studying different areas in Greece, Gournelos [43] found that landslides can be reactivated if the daily precipitation exceeds the threshold of 30 mm (regional threshold). According to Nastos and Zerefos [45], an event is characterized as an extreme precipitation event if precipitation of 30 mm or more is recorded during it. So, changes in the frequency of the extreme precipitation events in the study area are expected to lead to changes in the occurrence of landslides.
With the aim to identify such changes in the Chania regional unit, we compared the frequency of extreme precipitation events (days of extreme events/total days) over 5 years, from 2015 to 2020, with the relative frequency of the whole available period (Table S4). During this process, only the stations that provided data for at least the period from 2010 to 2020 were used. In four of the eight (50%) stations (Emprosneros, Falasarna, Kandanos, and Strovles), the recorded extreme precipitation events had increased, whereas in the rest of the meteorological stations (Askifou, Chania Technical University, Paleochora, and Samaria), they had remained almost the same. Moreover, the increase in the number of extreme precipitation events recorded by the Kandanos meteorological station was found to be significantly high (76%). The frequency of the extreme precipitation events from 2015 to 2020 was also compared with the relevant extreme precipitation events from 2010 to 2020, leading to relative results.
The increase in the extreme precipitation events despite the overall decline in the MAP, as evaluated during this study, agrees with the findings of Zerefos [11] regarding the MAP and the trends in extreme precipitation events in Greece.
Intensity–Duration (ID) Thresholds
Intensity–duration (ID) thresholds are the most common empirical precipitation landslide thresholds used in the literature [46,47,48]. During this research, the methodology introduced by Guzzetti [41] was followed. According to this methodology, the general form of the intensity–duration (ID) thresholds is:
where I is the intensity of the precipitation event (mm/hour); D is the duration that the precipitation lasted (hours); and a, b, and c are the constants to be evaluated for each threshold. Their most common values are c = 0, 4 < a < 176.40, and −1.50 < b < −0.19.
I = c + a* Db
To determine a and b, first, the ID diagram is designed, illustrating on the basis of the available meteorological data and the landslide inventory the precipitation events that did and did not trigger a landslide in the past. Subsequently, the ID curve is designed empirically according to the ID diagram, to include the lower band of the precipitation events that triggered the landslide events. Hence, the constants a and b are evaluated from the shape of the designed curve [44]. In this study, the local intensity–duration (ID) precipitation thresholds for each meteorological station were determined and the relative results are illustrated in Table 1.

Table 1.
Equations of ID thresholds.
In Table 1, RI stands for the reliability index [49] used to evaluate the efficacy of the method, determined by the following equation:
As indicated in Table 1, at all the meteorological stations of the Chania region except for the Askifou station, the parameter “a” ranges from 6.11 to 12.85 and the parameter “b” ranges from −0.72 to −0.55, values that are close to the general relative threshold that Guzzetti [41] suggested for central and southern Europe (I = 8.67*D−0. 61). Moreover, the Alikianos threshold is close to the threshold that Lainas [44] suggested for the Ilia regional unit, Greece (I = 12.714*D−0.554). The Askifou landslide threshold (I = 19.81*D−0.45) is relatively close to the relative threshold suggested by Corominas [50] for the mountainous area of Pyrenees, in Spain (I = 17.96*D−0.59). The reason is that both regions are mountainous regions in the Mediterranean area and ID thresholds are highly correlated with the climate and the elevation of a region [41]. Moreover, Askifou has by far the highest elevation among all the stations that have been used for evaluating the thresholds (Table S1).
Figure 8 presents the ID diagram for the Elos Chanion meteorological station (Figures S38–S45 for the rest of the meteorological stations). In this figure, the x-axis presents the duration that the precipitation event lasted in days, the y-axis presents the intensity (I) of the precipitation event in mm/days, the black line illustrates the landslide threshold, the blue dots show the precipitation events, and the orange cubes show the landslide events.
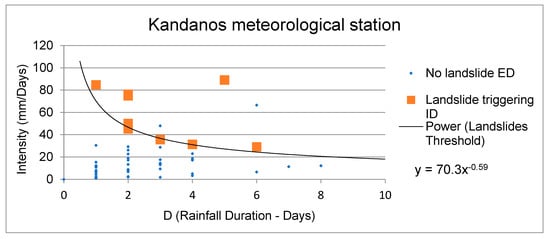
Figure 8.
Intensity–duration (ID) diagram for the Kandanos meteorological station according to observations (meteorological data).
4.1.2. Regional Climate Models
Near- and distant-future projections of precipitation using state-of-the-art regional climate models (RCMs), developed within the initiative of the coordinated regional climate downscaling experiment (CORDEX), have been extracted for the area of interest. The future precipitation simulations have been analyzed under the two intergovernmental panel on climate change (IPCC) emission representative concentration pathway (RCP) scenarios: the intermediate climate change mitigation scenario RCP4.5 and the non-mitigation business-as-usual scenario, with high emissions, RCP8.5.
The first period, from 1975 to 2004, refers to the current climate (control period), whereas the future periods are 10-year periods from 2031 onward (2031–2040, 2041–2050, and 2051–2060). Future simulations from RCMs were extracted for the Chania regional unit at an almost 12 km horizontal resolution.
Only five of the available meteorological stations (Askifou, Kalives, Kandanos, Palea Roumata, and Strovles) have provided precipitation data for 30 years or more and are therefore suitable for evaluating the RCM simulations during the control period (Table S1). Their spatial distribution provides sufficient spatial coverage of the examined area, as a range (buffer) of 17.5 km from these stations contains more than 80% of the extent of the regional unit and 99% of the landslide inventory (Figure S46).
Evaluation of Regional Climate Models (RCMs)
To determine the most suitable RCM, the observational precipitation (OBS PR) data from ground meteorological stations were compared with precipitation simulations extracted from the closest RCM grid point to the station’s latitude and longitude. The OBS PR data are the mean values of the total monthly precipitation of five meteorological stations (Askifou, Kalives, Kandanos, Palea Roumata, and Strovles) with available precipitation measurements for at least 30 years for the period 1975–2004 (control period) in western Crete. Accordingly, the projections from the three RCMs refer to the simulation data derived from the RCA4 regional climate model of the Swedish Meteorological and Hydrological Institute (SMHI) driven by three different global climate models: (1) the CNRM-CM5 of the Météo France Institute, (2) the HadGEM-ES of the Met Office Hadley Centre (hereafter MOHC), and (3) the MPI-ESM-LR of the Max Planck Institute (hereafter MPI) for Meteorology. These three simulations are basically the SMHI regional climate model with boundary conditions from the three global climate models (CNRM, MOHC, and MPI), which makes the combined modeling systems diverse enough to be considered as different models. Figure 9 presents a comparison between the precipitation observations and the respective precipitation simulations derived from the three RCMs for the Kalives meteorological station (diagrams for Askifou, Kandanos, P.Roumata, and Strovles in Figures S47–S50). Figure 9 shows that the MPI RCM provides the best results for the Chania area; accordingly, data from this model was selected for the future analysis.

Figure 9.
Mean monthly precipitation observations (OBS) and precipitation simulations by RCMs (MPI, CNRM, and MOHC) at Kalives.
To decrease the deviation between the OBS and the MPI simulations of precipitation, a bias correction method was also applied using the delta change factor method [51,52]. Thus, the precipitation MPI projections used in the subsequent future analysis were the BIAS-corrected data derived after the application of the selected BIAS-corrected method. For the BIAS correction process, the daily observations from the five selected meteorological stations, and the corresponding projections from the MPI RCM for the control period 1976–2005, were used following the equation of the delta change factor method [53].
Precipitation Projections from 2031 to 2060
Consequently, the bias-corrected PR projected from the MPI model was used to analyze precipitation projections for the period of 2031 to 2060 in areas close to the meteorological stations of Askifou, Kalives, Kandanos, Palea Roumata, and Strovles under the RCP4.5 and RCP8.5 emission scenarios. In Figure 10, Figure 11 and Figure 12, the projections of the precipitation values are presented as boxplots for the Strovles meteorological station. Figure 10 presents the average monthly precipitation according to RCP4.5, and Figure 11 presents the same according to RCP8.5. Figure 12 presents the February values using the boxplots of the observation data from 1976 to 2020 and the boxplot for the projections according to RCP4.5 and RCP8.5 for the period from 2031 to 2060 (the relative boxplots for the rest of the stations are presented in Figures S51–S62). The RCM boxplots show that the precipitation for the 2031–2060 period is expected to be the highest during the months of January, February, November, and December, as also indicated by the observational data in Strovles.
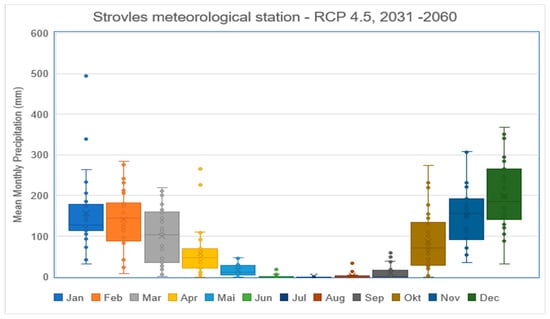
Figure 10.
Mean monthly precipitation for 2031–2060 according to RCP4.5 at the Strovles meteorological station.
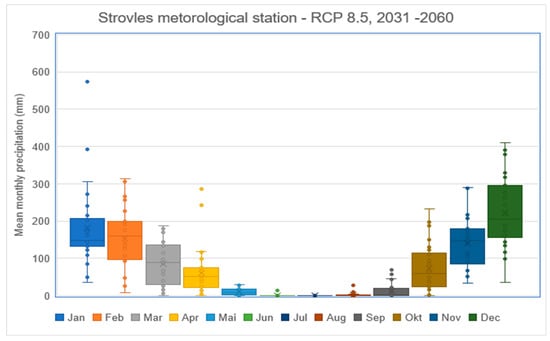
Figure 11.
Average monthly precipitation for 2031–2060 according to RCP8.5 at the Strovles meteorological station.
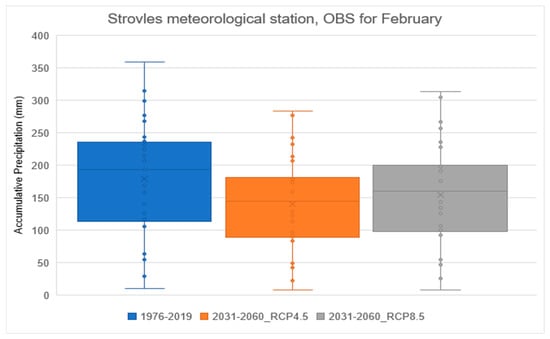
Figure 12.
February precipitation data for 2031–2060 according to OBS, RCP4.5, and RCP8.5 at the Strovles meteorological station.
RCMs and Landslide Thresholds
Subsequently, the RCM projections were used to calculate the times when the ID thresholds are going to be exceeded. Figure 13 presents the ID diagram for 2031–2060 according to the RCP8.5 emission scenario for the Kandanos meteorological station (Figures S63–S67 for the rest of the meteorological stations). The y-axis illustrates the intensity of the precipitation (in mm), and the x-axis shows the relative precipitation duration (in days). The black line illustrates the relative landslide threshold that has been calculated from the meteorological data for the control period (1976–2005).
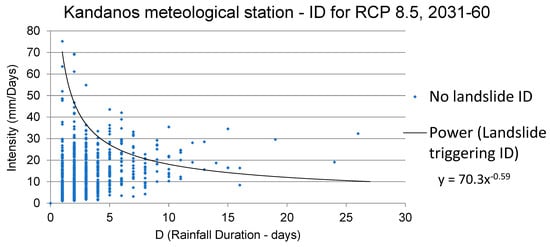
Figure 13.
ID diagram according to the RCP8.5 emission scenario for 2031–2060 at the Kandanos meteorological station.
Table 2 presents the time periods when the precipitation values exceeded the ID for the control period (observation data for 1976–2005) and for the future period (according to RCP4.5 and RCP8.5 for 2031–2060). The Kalives and Palea Roumata meteorological stations did not provide precipitation data for 2019 and 2020 (Table S1) where the landslides mentioned in the landslide inventory occurred. Therefore, the ID cannot be determined for Kalives and Roumata meteorological stations. In the Changes (%) column, the negative sign is used to show that a reduction is expected in the future.

Table 2.
Number of times the ID thresholds are exceeded in the control and future periods.
As Table 2 illustrates, in the future, at the Askifou meteorological station, the local threshold is expected to be exceeded less frequently. However, at Kandanos and Strovles meteorological stations, the relative local threshold is expected to be exceeded more frequently. Especially at Kandanos, the augmentation is quite significant (134.78%). This result is explained because as shown before, Askifou, unlike Kandanos and Strovles, is expected to be less affected by the climate crisis (Tables S2 and S5).
4.2. Landslide Susceptibility Assessment (LSA)
The landslide susceptibility assessment (LSA) of an area is used to evaluate the subregions of the area that are at low, medium, or high risk of landslides. To evaluate the landslide susceptibility of Chania, the analytical hierarchy process (AHP) was used because it is an effective method that can provide direct results.
4.2.1. Landslides` Causal Factors
To recognize the most critical causal factors of landslides in Chania, experts with great academic backgrounds and knowledge of the hydrological and geomorphological characteristics of the examined area were selected. AHP was applied, and according to the experts’ judgment [8] and the relevant contribution, the weight of each factor was determined (Tables S6–S9). Table 3 summarizes the results.

Table 3.
Determining the final weights of the causal factors.
The consistency ratio (CR) index (Equations S1 and S2) was calculated to be 0.04824. This value is smaller than 0.1, which shows that the experts’ judgment was unbiased, and the evaluated weights of Table 3 should be accepted [54]. Subsequently, every factor was further analyzed in subcategories (classes) and a relative process was followed to attribute weights to the subclasses of each causal factor (Table 4).

Table 4.
Landslide weigh rating adopted in this study for the causal factors and their subclasses.
4.2.2. Landslide Susceptibility Map
For each causal factor, a relative distinct landslide susceptibility map (LSM) was created. These maps, illustrated in Figure 14A–H, are important as, in addition to contributing to the synthesis of the final LSM, they provide a direct and clear indication about how each subregion in the study area is affected by each causal factor. As previously described, no vulnerability index is included in these maps and therefore each LSM illustrates only the relative landslide susceptibility and not the landslide risk of the examined area.

Figure 14.
LS Maps for individual causal factors for landslides in the Chania regional unit, Greece: (A) lithology, (B) land use/land cover, (C) proximity of roads, (D) proximity of streams, (E) the relative relief, (F) slope angle, (G) slope aspect, and (H) mean annual precipitation for the preceding 10 years (MAP-10).
For evaluating how precipitation activates the landslide mechanism, the mean annual precipitation was applied corresponding to the preceding 10 years (2010–2020, MAP-10, Figure 14H), the control period (1976–2005, MAP-CP, Figure S68), and the preceding 30 years (1990–2020, MAP-30, Figure S69). These distinct calculations were used to evaluate which of these periods would provide better results about the past and recent landslide evsuppents. In Figure 14A–G, for each causal factor, the red, yellow, and green (RdYlGn) color classes were selected. The regions illustrated with red color are the most susceptible to landslides due to the effect of this factor, while those illustrated with green color are the least susceptible. The landslide susceptibility of the regions illustrated with intermediate colors is determined according to the position of each color in comparison to the RdYlGn color classes. Accordingly, for precipitation (Figure 14H), the blue color classes were selected, where the regions most susceptible to landslides are illustrated with deeper-blue colors, while the regions less susceptible to landslides are shown with light-blue colors.
Subsequently, the distinct LSM of the landslide causal factors were overlaid, according to their corresponding weight (Table 3), in a GIS environment by applying the weighted linear combination (WLC) method. The result of this process is the total landslide susceptibility map (LSM) of Chania, illustrated in Figure 15. In Figure 15, the RdYlGn color classes were again used to illustrate with a red–green depiction color range the relative range of the subregions’ susceptibility. Figure 15 also illustrates the two parts of the landslide inventory (past and recent). Accordingly, by using MAP-30 and MAP-CP, the relative total LSMs (LSM-30, Figure S70; LSM-CP, Figure S71) of the study area were created.
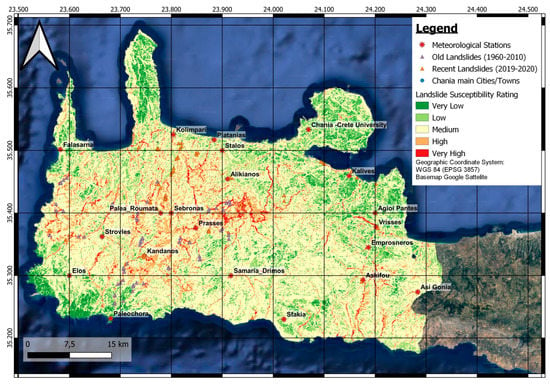
Figure 15.
Total landslide susceptibility map (LSM) for the Chania regional unit using MAP-10.
The area under the curve (AUC) for the receiver operating characteristic (ROC) was used to evaluate the effectiveness of the applied method [25] for all the created LSMs (LSM-10, LSM-30, and LSM-CP) by using distinctly past and recent landslides from the landslide inventory. As illustrated in Figure 16, all the LSMs provided similar and quite satisfactory results when only the past landslides were used for evaluating the effectiveness of the method (81.9% for LSM-10, 82.8% for LSM-30, and 83.1% for LSM-CP). However, as illustrated in Figure 17, when the recent landslides were used for evaluating the effectiveness, LSM-10 provided significantly better results (84.1%) compared with LSM-30 (79.8%) and LSM-CP (78.7%). Since the MAP was the only causal factor changed during the landslide susceptibility assessment (LSA), this result shows that MAP-10 provides significantly better results, as it incorporates the relevant changes in precipitation due to climate change.
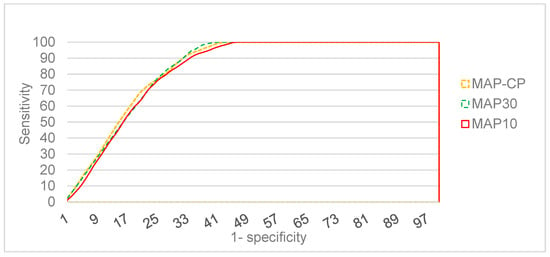
Figure 16.
Area under the curve for evaluating the efficacy of the LSM by using past landslides.
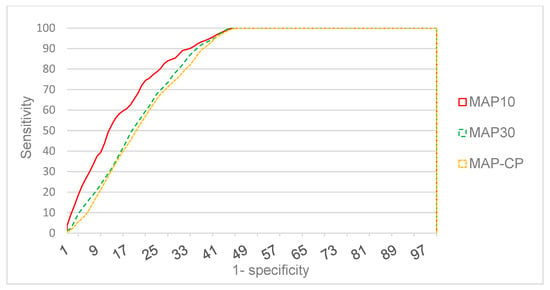
Figure 17.
Area under the curve for evaluating the efficacy of the LSM by using recent landslides.
It is worthwhile mentioning that this is the first attempt to correlate landslide susceptibility with the precipitation changes due to climate change. The use of vulnerability indices to form relative risk maps and their correlation with climate change is proposed as a future work as it is expected to contribute significantly to identifying and monitoring the most critical landslides in the examined area.
5. Conclusions
This research examines the impact of the climate crisis on the landslide phenomenon, through its relative impact on the precipitation, which is by far the most common causal factor of landslides. This analysis was made on a regional basis, focusing on the Chania prefecture, Greece. Within this framework, the trends in the mean annual precipitation (MAP) and the extreme precipitation events that can activate a landslide were analyzed and the relative local precipitation thresholds were evaluated. For this purpose, meteorological data of 21 local meteorological stations, which in some cases provided data for over 30 years, were used to create a rather dense meteorological network. We found that, in the areas monitored by the majority of these meteorological stations, the MAP has decreased over the years, while extreme precipitation events that can activate a landslide have either increased or remained almost the same. These findings are in accordance with the relative results of other scientific studies conducted for southern Europe and other Mediterranean regions [12,13,18]. These findings indicate an expected increase in the number of landslide events in the future in Chania.
Furthermore, three state-of-the-art regional climate models (RCMs) were used to analyze the precipitation projections for the period from 2031 to 2060 under two intergovernmental panel on climate change (IPCC) emission representative concentration pathway (RCP) scenarios: RCP4.5 and RCP8.5. The RCMs showed that even in the years from 2031 to 2060, the precipitation is expected to be the highest from November to February, as also revealed by the analysis of the observation precipitation data.
Moreover, for the Chania regional unit, the intensity–duration (ID) thresholds were determined for the first time. A strong correlation emerged with the relative landslide thresholds that concern either the wider area (northern Europe) or areas with climate similarities (such as Achaia, Greece, and Pyrenees, Spain). These findings ratify that Chania can provide useful indications for the relative impact of the climate change on the landslide phenomenon for the Mediterranean area. These thresholds were used along with the future precipitation projections of the selected RCM for the period 2030–2060 to identify the most critical areas in the future.
A complete landslide susceptibility assessment was performed for the study area. Toward this goal, the landslide causal factors were identified and their contribution (weight) to landslide mechanism were evaluated. Precipitation was evaluated as the mean annual precipitation (MAP) of the control period (1976–2005), the MAP of the last 30 years (1990–2020), and the MAP of the last 10 years (2010–2020). Therefore, three relative landslide susceptibility maps (LSMs) were produced: LSM-CP, LSM-30, and LSM-10. All the LSMs were found to provide satisfactory and similar results when an inventory of old landslides is used for validation. However, LSM-10 was found to provide better results compared with the other LSMs when recent landslides were used for validation. The significantly better results of LSM-10 compared with the results of LSM-CP and LSM-30 (almost 5%) show not only how important it is to incorporate the precipitation changes in landslide assessment but also how huge and rapid these changes are. In addition, as proved during this study, over the next decades, climate crisis is expected to seriously affect Chania, increasing the number and the intensity of the extreme precipitation events, which in turn will cause a series of potentially catastrophic and fatal landside events. An accurate and effective LSM will help the local authorities to take the necessary and focused precautionary measures and mitigate in advance the possible consequences of expected landslides. Moreover, an accurate and effective LSM can be vital for the local communities as an early warning system. The continuously evolving and intense character of climate change renders landslide susceptibility assessment a dynamic process that must be regularly updated. Note that, in this study, only landslide susceptibility was performed and not risk modeling.
Supplementary Materials
The following supporting information can be downloaded at: https://www.mdpi.com/article/10.3390/land12010154/s1, Figures S1–S71; Tables S1–S9; Equations S1–S2.
Author Contributions
Conceptualization, C.N. and C.L.; Data curation, C.N., D.S.T. and G.K.; Formal analysis, C.N. and D.S.T.; Investigation, C.N. and D.S.T.; Methodology, C.N., C.L. and C.G.; Project administration, C.L.; Resources, C.N., D.S.T. and G.K.; Software, C.N.; Supervision, C.L.; Validation, C.N. and C.L.; Visualization, C.N. and C.G.; Writing—original draft, C.N.; Writing—review and editing, G.K. and C.L. All authors have read and agreed to the published version of the manuscript.
Funding
This research received no external funding.
Institutional Review Board Statement
Not applicable.
Informed Consent Statement
Not applicable.
Data Availability Statement
The data used to support the findings of this study are available from the corresponding author upon reasonable request.
Acknowledgments
We would like to thank the Hellenic Survey of Geology and Mineral Exploration (HSGME) for the provided geotechnical reports, and the National Observatory of Athens (NOA) and all the participants of the hydroscope project for the open access meteorological data that were used during this research study.
Conflicts of Interest
The authors declare no conflict of interest.
References
- Scoccimarro, E.; Navarra, A. Precipitation and Temperature Extremes in a Changing Climate. In Hydrometeorological Extreme Events and Public Health; Matthies-Wiesler, F., Quevauviller, P., Eds.; Wiley: Hoboken, NJ, USA, 2022; pp. 3–25. [Google Scholar]
- Polemio, M.; Petrucci, O. Rainfall as a Landslide Triggering Factor an Overview of Recent International Research. In Landslides in Research, Theory and Practice; Bromhead, E., Dixon, N., Ibsen, M.-L., Eds.; Thomas Telford Ltd.: London, UK, 2000. [Google Scholar]
- Remaître, A.; Malet, J.P.; Cepeda, J. Landslides and Debris Flows Triggered by Rainfall: The Barcelonnette Basin Case Study, South French Alps. In Proceedings of the International Conference ‘Mountain Risks: Bringing Science to Society’, Firenze, Italy, 26–26 November 2010; pp. 24–26. [Google Scholar]
- Koukis, G.; Ziourkas, C. Landslide Movements in the Greek Territory, a Statistical Approach. Miner. Wealth 1989, 58, 39–57. [Google Scholar]
- Koukis, G.; Sabatakakis, N.; Nikolau, N.; Loupasakis, C. Landslide Hazard Zonation in Greece. In Landslides; Sassa, K., Fukuoka, H., Wang, F., Wang, G., Eds.; Springer: Berlin/Heidelberg, Germany, 2005; pp. 291–296. [Google Scholar]
- Papanikolaou, D.; Diakakis, M. Changes in the Intensity and Distribution of Natural Disasters; Climate Change Impacts Study Committee—Bank of Greece: Athens, Greece, 2011. [Google Scholar]
- Koukis, G.; Tsiambaos, G.; Sabatakakis, N. Landslide Movements in Greece: Engineering Geological Characteristics and Environmental Consequences. In Proceedings of the International Symposium Engineering Geology and the Environment, Athens, Greece, 23–27 June 1997; pp. 789–792. [Google Scholar]
- Nefros, C.; Loupasakis, C. Introducing a Geospatial Database and GIS Techniques as a Decision-Making Tool for Multicriteria Decision Analysis Methods in Landslides Susceptibility Assessment. Bull. Geol. Soc. Greece 2022, 59, 68–103. [Google Scholar] [CrossRef]
- Achu, A.L.; Reghunath, R. Application of Analytical Hierarchy Process (AHP) for Landslide Susceptibility Mapping: A Study from Southern Western Ghats, Kerala, India. In Proceedings of the 3rd Disaster, Risk and Vulnerability Conference (DRVC 2017), Kerala, India, 29–31 March 2017; p. 33. [Google Scholar]
- Chalkias, C.; Ferentinou, M.; Polykretis, C. GIS Supported Landslide Susceptibility Modeling at Regional Scale: An Expert-Based Fuzzy Weighting Method. ISPRS Int. J. Geoinf. 2014, 3, 523–539. [Google Scholar] [CrossRef]
- Zerefos, C.; Repapis, C.; Giannakopoulos, C.; Kapsomenakis, J.; Papanikolaou, D.; Papanikolaou, M.; Poulos, S.; Vrekoussis, M.; Philandras, C.; Tselioudis, G. The Climate of the Eastern Mediterranean and Greece: Past, Present and Future. In The Environmental, Economic and Social Impacts of Climate Change in Greece; Bank of Greece: Athens, Greece, 2011; pp. 1–126. [Google Scholar]
- Varlas, G.; Stefanidis, K.; Papaioannou, G.; Panagopoulos, Y.; Pytharoulis, I.; Katsafados, P.; Papadopoulos, A.; Dimitriou, E. Unravelling Precipitation Trends in Greece since 1950s Using ERA5 Climate Reanalysis Data. Climate 2022, 10, 12. [Google Scholar] [CrossRef]
- Araújo, J.R.; Ramos, A.M.; Soares, P.M.M.; Melo, R.; Oliveira, S.C.; Trigo, R.M. Impact of Extreme Rainfall Events on Landslide Activity in Portugal under Climate Change Scenarios. Landslides 2022, 19, 2279–2293. [Google Scholar] [CrossRef]
- Founda, D.; Giannakopoulos, C.; Pierros, F.; Kostopoulou, E.; Petrakis, M.; Zerefos, C. Precipitation Regime in Athens (Greece) in the Past, Recent and Future Climate. In Proceedings of the EGU General Assembly Conference Abstracts, Vienna, Austria, 19–24 April 2009; p. 7616. [Google Scholar]
- Maheras, P.; Tolika, K.; Anagnostopoulou, C.; Vafiadis, M.; Patrikas, I.; Flocas, H. On the Relationships between Circulation Types and Changes in Rainfall Variability in Greece. Int. J. Climatol. 2004, 24, 1695–1712. [Google Scholar] [CrossRef]
- Haque, U.; Blum, P.; da Silva, P.F.; Andersen, P.; Pilz, J.; Chalov, S.R.; Malet, J.-P.; Auflič, M.J.; Andres, N.; Poyiadji, E.; et al. Fatal Landslides in Europe. Landslides 2016, 13, 1545–1554. [Google Scholar] [CrossRef]
- Argyriou, A.V.; Polykretis, C.; Teeuw, R.M.; Papadopoulos, N. Geoinformatic Analysis of Rainfall-Triggered Landslides in Crete (Greece) Based on Spatial Detection and Hazard Mapping. Sustainability 2022, 14, 3956. [Google Scholar] [CrossRef]
- Roccati, A.; Paliaga, G.; Luino, F.; Faccini, F.; Turconi, L. Rainfall Threshold for Shallow Landslides Initiation and Analysis of Long-Term Rainfall Trends in a Mediterranean Area. Atmosphere 2020, 11, 1367. [Google Scholar] [CrossRef]
- Lagouvardos, K.; Dafis, S.; Giannaros, C.; Karagiannidis, A.; Kotroni, V. Investigating the Role of Extreme Synoptic Patterns and Complex Topography During Two Heavy Rainfall Events in Crete in February 2019. Climate 2020, 8, 87. [Google Scholar] [CrossRef]
- Pashos, P.; Koinakis, I. Identification of Landslide Events in Regions of Platania Municipality, Chania Regional Unit; Geological Technical Report T-3001 Complementary to “T-2981”; Hellenic Survey of Geology and Mineral Exploration (HSGME): Rethymno, Greece, 2019. [Google Scholar]
- Pashos, P.; Koinakis, I. Identification of Landslide Events in Regions of Chania Municipality, Chania Regional Unit; Geological Technical Report T-2981; Hellenic Survey of Geology and Mineral Exploration (HSGME): Rethymno, Greece, 2019. [Google Scholar]
- Konstantopoulou, G.; Spanou, A. Delimitation of the Regions Affected by the 2019 Landslide Events in Platanias Municipality, Chania Regional Unit; Technical Report T-3069; Hellenic Survey of Geology and Mineral Exploration (HSGME): Rethymno, Greece, 2020. [Google Scholar]
- Kotzamanis, B.; Pappas, V. Greece, an Early Analysis of the Provisional Results of 2021 Census. 2022. Available online: http://doi.org/10.6084/m9.figshare.20769589.v3 (accessed on 10 November 2022). [CrossRef]
- Hong, Y.-M.; Wan, S. Forecasting Groundwater Level Fluctuations for Rainfall-Induced Landslide. Nat. Hazards 2011, 57, 167–184. [Google Scholar] [CrossRef]
- Kouli, M.; Loupasakis, C.; Soupios, P.; Rozos, D.; Vallianatos, F. Landslide Susceptibility Mapping by Comparing the WLC and WofE Multi-Criteria Methods in the West Crete Island, Greece. Environ. Earth Sci. 2014, 72, 5197–5219. [Google Scholar] [CrossRef]
- Ganas, A.; Oikonomou, I.A.; Tsimi, C. NOAfaults: A Digital Database for Active Faults in Greece. Bull. Geol. Soc. Greece 2013, 47, 518. [Google Scholar] [CrossRef]
- Lagouvardos, K.; Kotroni, V.; Bezes, A.; Koletsis, I.; Kopania, T.; Lykoudis, S.; Mazarakis, N.; Papagiannaki, K.; Vougioukas, S. The Automatic Weather Stations NOANN Network of the National Observatory of Athens: Operation and Database. Geosci. Data J. 2017, 4, 4–16. [Google Scholar] [CrossRef]
- Sakellariou, A.; Koutsoyiannis, D.; Tolikas, D. HYDROSCOPE: Experience from a Distributed Database System for Hydrometeorological Data; Blain, W.R., Katsifarakis, K.L., Eds.; Computational Mechanics Publications: Southampton, UK, 1994. [Google Scholar]
- Groisman, P.Y.; Knight, R.W.; Zolina, O.G. Recent Trends in Regional and Global Intense Precipitation Patterns. Clim. Vulnerability 2013, 5, 25–55. [Google Scholar]
- Xu, Z.X.; Takeuchi, K.; Ishidaira, H. Long-Term Trends of Annual Temperature and Precipitation Time Series in Japan. J. Hydrosci. Hydraul. Eng. 2002, 20, 11–26. [Google Scholar]
- Van Westen, C.J.; Castellanos, E.; Kuriakose, S.L. Spatial Data for Landslide Susceptibility, Hazard, and Vulnerability Assessment: An Overview. Eng. Geol. 2008, 102, 112–131. [Google Scholar] [CrossRef]
- Zourbakis, E.; Papanikolaou, K. Identification of Landslide Events at the North Road Axis of Crete—Region of Stalos, Chania Regional Unit; Geological Technical Report T-2962; Hellenic Survey of Geology and Mineral Exploration (HSGME): Rethymno, Greece, 2019. [Google Scholar]
- Zourbakis, E.; Papanikolaou, K. Rockfall Events and the Impending Dangers—Region of Ammoudari, Askifou, Sfakia Municipality, Chania Regional Unit; Geological Technical Report T-2968; Hellenic Survey of Geology and Mineral Exploration (HSGME): Rethymno, Greece, 2019. [Google Scholar]
- Koinakis, I.; Zourbakis, E. Identification of Landslide Events—Region of Kalamos, Palaiochora, Kandanos—Selino Municipality, Chania Regional Unit; Geological Technical Report T-2986; Hellenic Survey of Geology and Mineral Exploration (HSGME): Rethymno, Greece, 2019. [Google Scholar]
- Nefros, C.; Alatza, S.; Loupasakis, C.; Kontoes, C. Persistent Scatterer Interferometry (PSI) Analysis for Landslide Detection and Mapping. The Case of Chania Prefecture, Crete Island, Greece 2022; Special Publication BGSG No 10. In Proceedings of the 16th International Congress of the Geological Society of Greece, Patra, Greece, 17–19 October 2022; p. 778. [Google Scholar]
- Pashos, P.; Koinakis, I. Identification of Landslide Events in Regions of Platania Municipality, Chania Regional Unit; Geological Technical Report T-2980; Hellenic Survey of Geology and Mineral Exploration (HSGME): Rethymno, Greece, 2019. [Google Scholar]
- Michalakis, I.; Zourbakis, E. Identification of Landslide Events—Region of Kouroupiana and Straton Village, Kan-Danos Municipality, Chania Regional Unit; Geological Technical Report T-3064; Hellenic Survey of Geology and Mineral Exploration (HSGME): Rethymno, Greece, 2020. [Google Scholar]
- Varnes, D.J. Slope Movement Types and Processes. Spec. Rep. 1978, 176, 11–33. [Google Scholar]
- Varnes, D.J. Landslide Hazard Zonation: A Review of Principles and Practice; UNESCO: Paris, France, 1984; ISBN 9231018957. [Google Scholar]
- Cruden, D.M.; Cruden, D.M.; Varnes, D.J. 1996, Landslide Types and Processes, Transportation Research Board, US National Academy of Sciences. Spec. Rep. 1993, 247, 36–75. [Google Scholar]
- Guzzetti, F.; Peruccacci, S.; Rossi, M.; Stark, C.P. Rainfall Thresholds for the Initiation of Landslides in Central and Southern Europe. Meteorol. Atmos. Phys. 2007, 98, 239–267. [Google Scholar] [CrossRef]
- Bordoni, M.; Corradini, B.; Lucchelli, L.; Valentino, R.; Bittelli, M.; Vivaldi, V.; Meisina, C. Empirical and Physically Based Thresholds for the Occurrence of Shallow Landslides in a Prone Area of Northern Italian Apennines. Water 2019, 11, 2653. [Google Scholar] [CrossRef]
- Gournelos, T.; Nastos, P.T.; Chalkias, D.; Tsagas, D.; Theodorou, D. LANDSLIDE MOVEMENTS RELATED TO PRECIPITATION. ANALYSIS OF A STATISTICAL SAMPLE FROM THE GREEK AREA. Bull. Geol. Soc. Greece 2017, 43, 1335. [Google Scholar] [CrossRef]
- Lainas, S.; Sabatakakis, N.; Koukis, G. Rainfall Thresholds for Possible Landslide Initiation in Wildfire-Affected Areas of Western Greece. Bull. Eng. Geol. Environ. 2016, 75, 883–896. [Google Scholar] [CrossRef]
- Nastos, P.T.; Zerefos, C.S. Decadal Changes in Extreme Daily Precipitation in Greece. Adv. Geosci. 2008, 16, 55–62. [Google Scholar] [CrossRef]
- Cannon, S.H.; Gartner, J.E. Wildfire-Related Debris Flow from a Hazards Perspective. In Debris-Flow Hazards and Related Phenomena; Springer: Berlin/Heidelberg, Germany, 2005; pp. 363–385. [Google Scholar]
- Guzzetti, F.; Peruccacci, S.; Rossi, M.; Stark, C.P. The Rainfall Intensity–Duration Control of Shallow Landslides and Debris Flows: An Update. Landslides 2008, 5, 3–17. [Google Scholar] [CrossRef]
- Bolley, S.; Oliaro, P. Analisi Dei Debris Flows in Alcuni Bacini Campione Dell’Alta Val Susa. Geoing. Ambient. Mineraria Marzo 1999, 69–74. [Google Scholar]
- Althuwaynee, O.F.; Asikoglu, O.; Eris, E. Threshold Contour Production of Rainfall Intensity That Induces Landslides in Susceptible Regions of Northern Turkey. Landslides 2018, 15, 1541–1560. [Google Scholar] [CrossRef]
- Corominas, J.; Ayala, F.J.; Cendrero, A.; Chacon, J.; Diaz de Teran, J.; Gonzales, A.; Moja, J.; Vilaplana, J. ECCE Final Report: Impacts on Natural Hazard of Climatic Origin; Ministry for the Ecological Transition and the Demographic Challenge: Madrid, Spain, 2005; Volume 12, pp. 529–557.
- Tabor, K.; Williams, J.W. Globally Downscaled Climate Projections for Assessing the Conservation Impacts of Climate Change. Ecol. Appl. 2010, 20, 554–565. [Google Scholar] [CrossRef]
- Varotsos, K.V.; Tombrou, M.; Giannakopoulos, C. Statistical Estimations of the Number of Future Ozone Exceedances Due to Climate Change in Europe. J. Geophys. Res. Atmos. 2013, 118, 6080–6099. [Google Scholar] [CrossRef]
- Beyer, R.; Krapp, M.; Manica, A. An Empirical Evaluation of Bias Correction Methods for Palaeoclimate Simulations. Clim. Past 2020, 16, 1493–1508. [Google Scholar] [CrossRef]
- Vijith, H.; Dodge-Wan, D. Modelling Terrain Erosion Susceptibility of Logged and Regenerated Forested Region in Northern Borneo through the Analytical Hierarchy Process (AHP) and GIS Techniques. Geoenviron. Disasters 2019, 6, 8. [Google Scholar] [CrossRef]
Disclaimer/Publisher’s Note: The statements, opinions and data contained in all publications are solely those of the individual author(s) and contributor(s) and not of MDPI and/or the editor(s). MDPI and/or the editor(s) disclaim responsibility for any injury to people or property resulting from any ideas, methods, instructions or products referred to in the content. |
© 2023 by the authors. Licensee MDPI, Basel, Switzerland. This article is an open access article distributed under the terms and conditions of the Creative Commons Attribution (CC BY) license (https://creativecommons.org/licenses/by/4.0/).