Abstract
Wind erosion is a major natural disaster worldwide, and it is a key problem in western Rajasthan in India. The Analytical Hierarchy Process (AHP), the Geographic Information System (GIS), and remote sensing satellite images are effective tools for modeling and risk assessment of land degradation. The present study aimed to assess and model the land degradation vulnerable (LDV) zones based on the AHP and geospatial techniques in the Luni River basin in Rajasthan, India. This study was carried out by examining important thematic layers, such as vegetation parameters (normalized difference vegetation index and land use/land cover), a terrain parameter (slope), climatic parameters (mean annual rainfall and land surface temperature), and soil parameters (soil organic carbon, soil erosion, soil texture, and soil depth), using the Analytical Hierarchical Process (AHP) and geospatial techniques in the Luni River basin in Rajasthan, India. The weights derived for the thematic layers using AHP were as follows: NDVI (0.27) > MAR (0.22) > LST (0.15) > soil erosion (0.12) > slope (0.08) > LULC (0.06) > SOC (0.04) > soil texture (0.03) > soil depth (0.02). The result indicates that nearly 21.4 % of the total area is prone to very high degradation risks; 12.3% is prone to high risks; and 16%, 24.3%, and 26% are prone to moderate, low, and very low risks, respectively. The validation of LDV was carried out using high-resolution Google Earth images and field photographs. Additionally, the Receiver Operating Characteristic (ROC) curve found an area under the curve (AUC) value of 82%, approving the prediction accuracy of the AHP technique in the study area. This study contributes by providing a better understanding of land degradation neutrality and sustainable soil and water management practices in the river basin.
1. Introduction
Land is an essential part of the supportive ecosystem of the Earth. Humans and animals are dependent on the ecosystem services, such as food, fiber, and shelter, provided by this natural resource [1]. Resource degradation is one of the hottest topics of research at present due to its alarming threat to biodiversity [2]. Land degradation is nothing but the unsustainable over-exploitation of resources resulting in decreasing productivity and capabilities to provide a set of ecosystem services [3,4]. The international forum United Nations Convention to Combat Desertification (UNCCD) reports the degradation of land resources to be a challenging concern [5,6]. Moreover, increasing food demand, anthropogenic activities, and changing climatic scenarios altogether put immense pressure on land resources, leading to degradation [7,8].
The agriculture system is a major pillar of global food security, but its productivity is currently threatened by various land degradation mechanisms, which are triggered by anthropogenic activities and climate change [9,10]. The frequency of extreme events caused by climate change is increasing the susceptibility of agricultural soils to degrading processes [11]. Globally, about 24% (about 3500 Mha) of the land area is affected by land degradation [12]. The severity of land degradation in India has been reported to be 94 Mha due to water erosion, 9 Mha due to wind erosion, 14 Mha due to waterlogging, 6 Mha due to salinity/alkalinity, and 16 Mha due to soil acidity [11,13,14]. Considering the increasing severity of degradation, India is working to restore about 26 Mha of degraded land by 2030 in accordance with the Bonn Challenge and United Nations’ activities [15]. Rajasthan state in western India has a hot arid climate with low rainfall and high wind speed [16], comprising about 62% of the hot arid region of the country. Agro-climatic zones, such as the arid western plains (Barmer and part of Jodhpur) and the hyper-arid partially irrigated zones (Bikaner, Jaisalmer, and Churu), are the most highly prone areas to wind-erosion-assisted land degradation due to their climatic characteristics and sandy terrain [17,18]. About 76% of the area of hot arid Rajasthan has wind erosion problems, where soil erodes at a high rate of 1.3 t ha−1 to 83.3 t ha−1 [19].
Assessments of land degradation vulnerability play critical roles in prioritization and planning for degradation neutrality and conservation policies [20]. Various important factors, such as topography, climate, soil, and land use patterns, need to be determined for the land degradation modeling and assessment of an area. Several techniques have been developed for the evaluation of land degradation, but geospatial techniques have replaced the time-consuming and costly traditional survey, especially in places that are difficult to assess [21]. High-resolution satellite imageries are capable of providing reliable and consistent insights into land degradation types, their rate, and resulting adverse impacts in a cost-effective manner [22,23,24,25,26].
Land degradation is satisfactorily studied using numerous methods, such as machine learning models [27,28], GIS-assisted spatial analyses [29], time-series and trend-based analyses [30], universal soil loss and risk assessment models [31], and MEDALUS [32,33]. One of the most feasible options for assessing and mapping degraded land is the integration of the multi-criterion decision analysis (MCDA) method with geospatial techniques. This allows the complex problem to be broken down into sections followed by a solution and then the integration of each section to obtain the final result/solution. The Analytical Hierarchical Process (AHP), first developed by Saaty (1980), is one of the MCDA methods used in the mapping of degradation vulnerability [34,35,36,37]. AHP is a well-structured and widely accepted decision-making technique. Many researchers have used AHP and geospatial techniques for assessing and mapping land degradation vulnerability [12,38].
Much research has been carried out on various land degradation, such as water erosion and gully erosion, but limited research has been carried out on the identification of wind-erosion-prone areas using AHP and geospatial techniques, particularly in the arid climate of Rajasthan, India. This study area is highly vulnerable to wind erosion due to its climate, soil, and geology. Despite this, no research has been carried out in this region to evaluate and develop a land degradation vulnerability map. Therefore, an integrated approach of AHP and GIS has immense potential to accurately estimate the wind-erosion-prone areas and identification of most priority areas for suitable erosion control measures. Hence, the objectives of the present study were as follows: (i) to characterize the vegetative, soil, climatic, and terrain parameters of the basin and (ii) to identify the area’s most vulnerable to land degradation using AHP along with RS and GIS techniques. The results of the present study help to provide important information for soil and water management practices, land use plans, and environmental sustainability for the study area.
2. Materials and Methods
2.1. Study Area
Luni, the largest river basin in Rajasthan (India), is located between latitude 24°30′ N to 27°10′ N and longitude 70°49′ E to 75°04′ E (Figure 1). Geographically, it is located adjacent to the western part of the Aravalli Range and occupies an area of 68,939 km2. The basin covers the districts of Ajmer, Jodhpur, Nagaur, Barmer, Jalore, and Sirohi in part and the district of Pali in full. The elevation ranges from −5 to 1613 m from the mean sea level (MSL), with a decreasing gradient from the northern to the southern part of the basin. In this basin, rainfall occurs mostly from June to September (>90%), and it ranges from as high as ~1000 mm in the southern and eastern parts to as low as ~234 mm in the western part of the basin [39]. The annual maximum potential evapotranspiration in the river basin is 1850 mm, and it is the highest (260 mm) in May and the lowest (77 mm) in December [39]. The study area, with the characteristics of low rainfall, high temperatures, and low relative humidity, has an arid to hyper-arid climate [40].
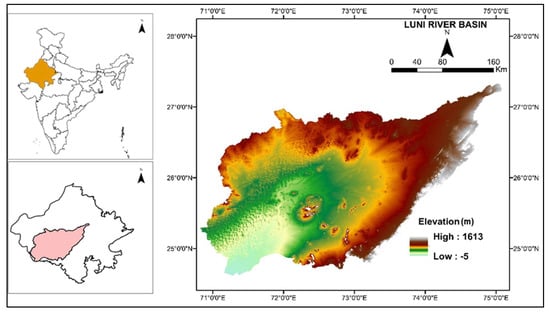
Figure 1.
Location map of Luni River basin.
2.2. Data Acquisition
In the present study, nine input layers were used to identify the area most vulnerable to land degradation, namely, the normalized difference vegetation index (NDVI) from a moderate-resolution imaging spectroradiometer (MODIS), land surface temperature (LST) from MODIS, mean annual rainfall from the Climate Hazards Group Infrared Precipitation with Station data (CHIRPS), land use/land cover (LULC), slope, soil texture, soil erosion, soil depth, and soil organic carbon. The United States Geological Survey (USGS) website was used to download the shuttle radar topography mission (SRTM) DEM data (https://earthexplorer.usgs.gov (accessed on 29 June 2022)). A land use/land cover (LULC) map was downloaded from ESRI [41]. MODIS NDVI, MODIS LST, and CHIRPS rainfall were downloaded for the 21-year period of 2001–2021 using Google Earth Engine (GEE). Land degradation, particularly wind erosion and desertification, cannot be assessed during a short period of time, such as a few years or less; it should be evaluated over a long period of time [42]. So, we used long-term mean data (21 years) to evaluate land degradation vulnerability. Soil organic carbon data were downloaded from SoilGrids (https://soilgrids.org/ (accessed on 25 June 2022)). Additionally, data on soil texture, soil erosion, and soil depth were collected at a scale of 1:250,000 from the ICAR-National Bureau of Soil Survey and Land Use Planning (NBSS&LUP), Nagpur. All thematic layers were converted to the WGS 1984 datum and Universal Transverse Mercator (UTM) 43N coordinate system. Table 1 provides an overview of various datasets and their specifications.

Table 1.
Specifications of various datasets used in the present study.
2.3. Data Processing
2.3.1. Terrain Parameters
The downloaded SRTM DEM was reprojected to the UTM coordinate system (43N) and filled in ArcGIS 10.8. A slope map of the basin was then generated using the filled DEM.
2.3.2. Climatic Parameters
Land degradation is caused by interactions between soil, climate, and land-use patterns. In the present study, CHRIPS-based rainfall products (https://developers.google.com/earth-engine/datasets/catalog/UCSB-CHG_CHIRPS_DAILY (accessed on 22 April 2022) at a spatial resolution of 5 km were downloaded for the period of 2001 to 2021 using GEE. The total annual rainfall was computed by calculating the sum of all images for the respective year. These twenty years of annual rainfall data were used for the computation of the long-term mean annual rainfall. The data were reprojected to the UTM 43N coordinate system in ArcGIS 10.8. The downloaded rainfall data were resampled to a 30 m cell size by using the bilinear interpolation method. The bilinear interpolation technique is the most widely used interpolation technique for resampling raster images [35,38,43]. The thematic layer of rainfall was categorized into five subclasses, namely, 234–401, 401–524, 524–685, 685–941, and 941–1654 mm, using the natural break method in ArcGIS. We used the natural break method based on previous research that used it for various hazard mapping applications, such as [44,45,46,47].
In this study, MODIS global LST data (MOD11A2) (https://developers.google.com/earth-engine/datasets/catalog/MODIS_006_MOD11A2 accessed on 23 April 2022) were downloaded for 2001 to 2021 using GEE. The mean annual LST was computed by calculating the mean of all images of the respective year. These mean annual data of all years were used for the computation of long-term (21 years) mean LST. Using Equation (1), data were converted to degrees Celsius (°C):
The datasets were subsequently reprojected and resampled in the ArcGIS environment. The thematic layer was divided into five subclasses, namely, 27–34, 34–36, 36–37, 37–39, and 39–43 °C, using the natural break method in ArcGIS.
2.3.3. Vegetation Parameters
In the present study, NDVI and LULC were considered important parameters for evaluating the land degradation of the river basin. An LULC map was downloaded for the year 2018 from ESRI and resampled to 30 m in the ArcGIS environment. NDVI data were obtained from NASA Land Processes Distributed Active Archive Center’s MODIS products (MOD13Q1) (https://developers.google.com/earthengine/datasets/catalog/MODIS_006_MOD13Q1 accessed on 23 April 2022) at spatial and temporal resolutions of 250 m and 16 days, respectively, for a period of 21 years (2001–2021) using GEE. The mean annual NDVI was computed from all images of a particular year. These mean annual data of all years were used for the computation of long-term (21 years) mean NDVI. The vegetative greenness of an area can be assessed using the NDVI, a dimensionless index that varies from −1 to +1. A high NDVI value indicates healthy vegetation, while a low value signifies stressed vegetation. The data were reprojected to UTM 43N as previously described and resampled to a 30 m cell size by using the bilinear interpolation method in ArcGIS. Finally, the layer was categorized into five subclasses, namely, −0.039–0.19, 0.19–0.24, 0.24–0.29, 0.29–0.36, and 0.36–0.60, using the natural break method in ArcGIS.
2.3.4. Soil Parameters
Soil texture, soil erosion class, and soil depth data were taken from ICAR-NBSS&LUP, Nagpur, and resampled to 30 m in the ArcGIS environment. Seven soil texture classes were identified, namely, clay loam, fine loam, loam, loamy skeletal, sandy, sandy skeletal, and rock. For soil erosion, four classes were identified, namely, slight, moderate, severe, and very severe erosion. Six classes were reported for soil depth and named, viz., rock, <25, 25–50, 50–75, 75–100, and >100 cm. Soil organic carbon data were downloaded from soil grids and subsequently reprojected to the UTM 43N coordinate system and resampled to a 30 m cell size. The layer was classified into five subclasses, namely, 0–52, 52–67, 67–93, 93–140, and 140–315 decigrams/kg. Prior to the AHP weightage assignment, all input layers should have a uniform resolution. Therefore, all layers were resampled to be comparable to DEM (30 m). A detailed flowchart of the methodology is displayed in Figure 2.
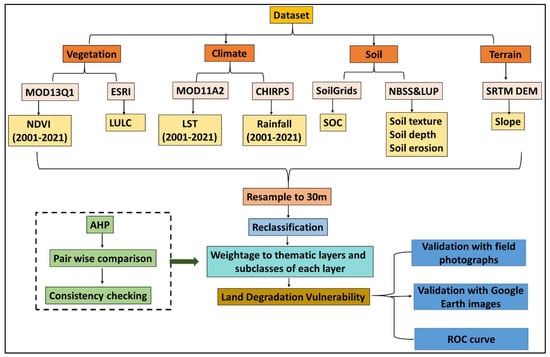
Figure 2.
Flowchart of the methodology followed in the study.
2.4. Analytical Hierarchical Process and Weightage Assignment
The multi-criteria decision analysis (MCDA) using the AHP technique is the most popular and well-known method for identifying land degradation vulnerability [48]. AHP is a pairwise comparison assessment theory, where Saaty’s scale of relative importance is used to compare parameters to one another (Table 2) [49]. We need comparisons and a scale of numbers that indicate how important one parameter is in comparison to another in terms of the criterion being compared in order to draw organized conclusions about priorities.
Table 2.
Saaty’s scale (1–9) for pairwise comparison in AHP.
The consistency ratio (CR) was used to validate the decision about the pairwise comparison of the various thematic layers and their subclasses [50]. The following equation was used to calculate the CR:
where RCI indicates the random consistency index, and Saaty’s standard is used to calculate its values (Table 3); CI stands for the consistency index, which was calculated using the following equation:
where λmax indicates the principal eigenvalue, and n indicates the total number of input layers used in the LD assessment.
Table 3.
Saaty’s random consistency index.
In the weighted overlay analysis using AHP, a CR value of ≤0.10 is acceptable. If the CR is greater than 0.10, the decision must be revised to identify the source of the inconsistency, and it must be resolved so ensure CR value below 0.10.
2.5. Generating Land Degradation Vulnerability Map
Thematic layers and their subclasses were given AHP-based weightages in ArcGIS to delineate the land degradation vulnerability (LDV) zones. The LDV map in the current study was generated using the following equation:
where NDVI, MAR, LST, SE, S, LULC, SOC, ST, and SD indicate the normalized difference vegetation index, mean annual rainfall, land surface temperature, soil erosion, slope, land use/land cover, soil organic carbon, soil texture, and soil depth, respectively; Cwi and Scwi represent the class weight and subclass weight, respectively. Finally, the LDV map was categorized into five classes, viz., very low, low, moderate, high, and very high, using the quantile breaks in ArcGIS. Using the ultra-high definition (UHD) Google Earth imageries of 2022, the LDV map was validated at ten randomly selected sites. Moreover, an ROC curve was generated from the fifty randomly selected sites using Google Earth to validate the results. The ROC curve was used to estimate the area under the curve (AUC), which has values between 0.5 and 1. AUC values closer to 1 indicate excellent model performance whereas, values closer to 0.5 indicate poor prediction accuracy. Validation was also performed using field photographs to determine the agreement with the AHP-generated LDV map.
3. Result
3.1. Input Thematic Layers and Their Variabilities
The mean NDVI values of the study area range from −0.03 to 0.60, and they were divided into five subclasses, viz., −0.03–0.19, 0.19–0.24, 0.24–0.29, 0.29–0.36, and 0.36–0.60 (Figure 3A). The highest area (27.9%) falls under subclass −0.03–0.19, followed by 0.24–0.29 (27.4%), and the lowest area falls under subclass 0.36–0.60 (4.9%). The low NDVI class was assigned higher weights, while the high-value class was assigned lower weights. The study of LULC established the baseline information for activities such as the thematic mapping and change detection analysis of earth over time. The study area’s LULC map represents cropland (46.9%), current fallow land (21.2%), land with shrub/scrub (20.3%), forest (shrub/scrub/degraded) (1.4%), other wastelands (8.6%), built-up land (urban/rural) (0.5%), deciduous forest (0.8%), water bodies (0.5%), and gullied/ravines (0.01%), and it is depicted in Figure 3B. Most of the area (68.7%) is used for agriculture, which spread acrossthe study area, mostly covering the northeastern and southeastern parts rather than the western part. Around 2.15% area of the river basin is covered by various types of forests, including deciduous and degraded forests, which lie in the southeastern part, and the central part of the study area is covered by land with shrub/scrub (20.3%).
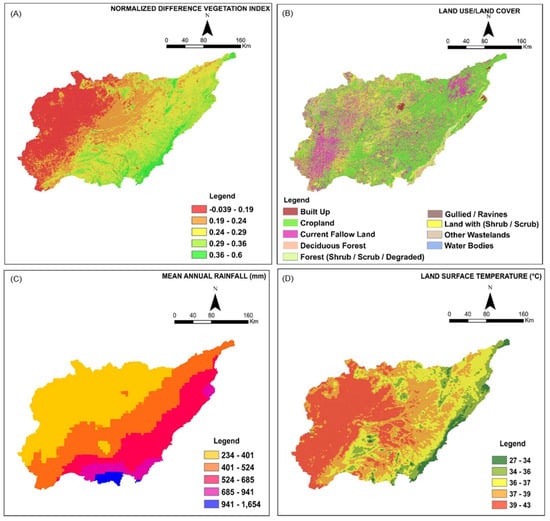
Figure 3.
NDVI (A), LULC (B), MAR (C), and LST (D) maps of the study area.
The mean annual rainfall was categorized into five subclasses, namely, very low (234–401 mm), low (401–524 mm), moderate (524–685 mm), high (685–941 mm), and very high (941–1654 mm) rainfall, occupying approximately 42, 30, 20, 5, and 2% of the total geographical area, respectively (Figure 3C). The study area receives very high precipitation in a small portion of the south and southeastern parts, whereas the western part receives very low rainfall. In the present study, the low rainfall subclass was assigned high weightage and vice versa.
The land surface temperature of the river basin was divided into five subclasses, namely, 27–34, 34–36, 36–37, 37–39, and 39–43 °C (Figure 3D). About 65 % of the area of the basin falls under the fourth and fifth subclasses of LST (37–39, 39–43 °C), lying in the western and central parts of the study area. The third class (36–37 °C) of LST is distributed mostly in the northern and southeastern parts of the river basin and occupies around 23% of the total study area. Only around 12% of the area falls under the first subclass (27–34 °C), lying mostly in the eastern part of the river basin. A high LST was assigned high weights and vice versa.
The study area was classified into five subclasses of SOC content, namely, 0–52, 52–67, 67–93, 93–140, and 141–315 decigrams/kg (Figure 4A). The maximum area (42.1%) of the study area falls under subclass 52–67 decigram/kg, followed by subclass 67–93 (26.9%), whereas the lowest area (1.6%) falls under the 141–315 decigram/kg subclass. The northwestern part of the study area has a low SOC as compared to the southeastern part, which is an important factor for the stability of the soil structure. The soil erosion map of the study area is depicted in Figure 4B, and four erosion classes were identified. The study area is mainly composed of moderate soil erosion (56.3%), followed by severe erosion (35.2%), and very severe erosion occurs the least (4.2%). Severe and very severe erosion are mainly concentrated in the western part, and moderate erosion is found in the eastern part of the study area. The soil depth map is presented in Figure 4C, and six subclasses were identified according to the ICAR-NBSS&LUP, Nagpur, India. The highest area falls under subclass >100 cm (59%), and the lowest area falls under subclass <25 cm, with an area of 1.9%. The soil in the study area was classified into different texture classes, namely, clay/fine loam, loamy skeletal, sandy skeletal, and sandy soils (Figure 4D). The study area is mainly composed of sandy soil (49.5%), followed by clay loam (24.4%), with loam representing the least amount (1.1%). The western part of the study area is dominated by sandy soil, whereas the eastern part is dominated by fine loam and clay loam texture.
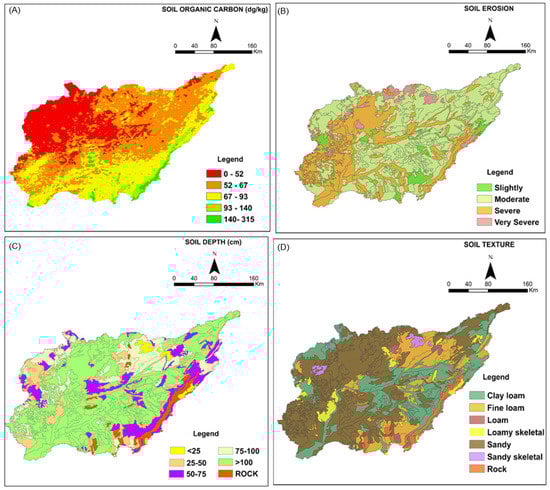
Figure 4.
Soil organic carbon (A), soil erosion (B), soil depth (C), and soil texture (D) maps of the study area.
The study area’s slope was divided into six subclasses, namely, <3, 3–8, 8–15, 15–30, 30–50, and >50% (Figure 5). Almost 62% of the area of the basin falls under the slope subclass of <3%, which is nearly flat and mainly concentrated in the northern and eastern parts of the basin. The slope of the remaining 38% of the area falls under subclass >3%. The eastern and southeastern parts are mainly composed of high slopes.
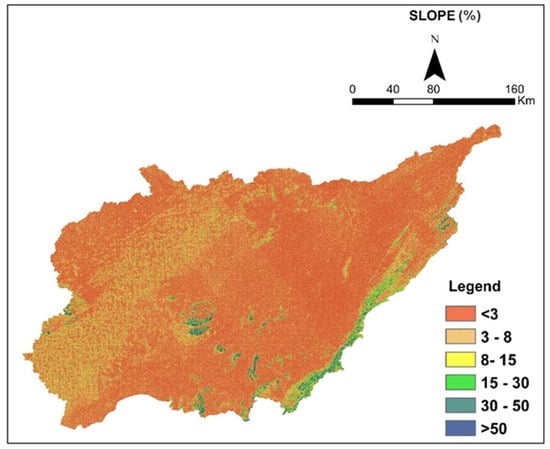
Figure 5.
Slope map of the study area.
3.2. Land Degradation Vulnerability
Before the thematic layer integration, consistency ratios for each thematic layer (Table 4), normalized matrix (Table 5), and thematic layer subclass (Table 6) were computed. The findings show that the judgment matrices used in the analyses were reasonably consistent and accurate (CR ≤ 0.10). The NDVI, LST, rainfall, topography, and pedological parameters were computed and the final weightage assigned to each parameter was computed using the AHP model. The weighted overlay approach was used to integrate the thematic layers according to their associated weights. AHP found that NDVI had the highest priority in land degradation vulnerability zone (LDVZ) identification, with a weight value of 0.27, followed by rainfall (0.22), LST (0.15), erosion (0.12), slope (0.08), LULC (0.06), SOC (0.22), texture (0.22), and depth (0.22). In this study, with the help of the AHP- and the GIS-based modeling approach, five LDVZs, namely, very low, low, moderate, high, and very high, were identified (Figure 6). The findings show that 50.3% of the river basin area (34.72 lakh ha) is highly vulnerable to land degradation, and it was classified in the very low to low class, accounting for nearly half of the river basin (Figure 7). These very low to low classes of LDV cover the eastern, southern, and northeastern parts of the study area. About 11.02 lakh ha (16.0%) of the river basin area falls under the moderate class of land degradation, mostly covering the central to southeastern parts of the study area. The high and very high classes of land degradation vulnerability cover about 23.19 lakh ha (33.7%) of the river basin area. The western and somewhat central portions of the study region mostly fall under these classes. These two classes particularly indicate wind erosion, which is one of the most severe forms of land degradation.
Table 4.
AHP-pairwise comparison matrix for thematic layers.
Table 5.
Normalized matrix for thematic layers.
Table 6.
Weightages of subclasses.
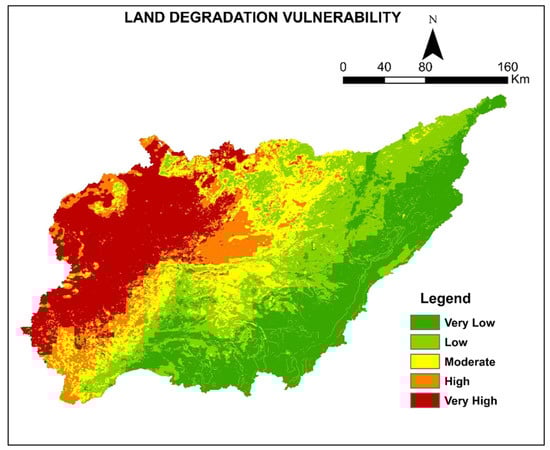
Figure 6.
Land degradation vulnerability map of the study area.
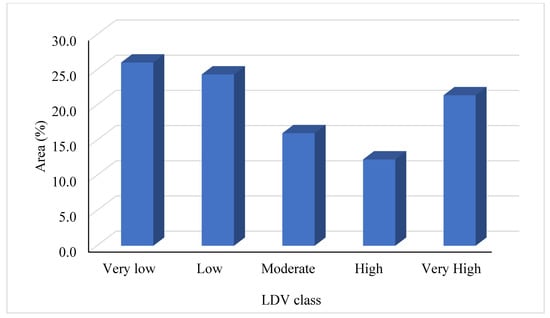
Figure 7.
The area covered under different LDV classes.
3.3. Validation of Land Degradation Vulnerability Zones
The validation of the LDVZs of the study area was conducted using two approaches, namely, field photographs and Google Earth images. Figure 8 indicates good agreement between the LDV map of the study area with the field photographs. In the second approach, validation was carried out with ten randomly selected high-resolution Google Earth images (Figure 9). In addition to this, fifty points were randomly selected in Google Earth to plot the ROC curve, and the AUC value was found to be 82% (Figure 10). The AHP model predicts land degradation vulnerability zones in the research area with reasonable accuracy, as shown by the ROC curve.
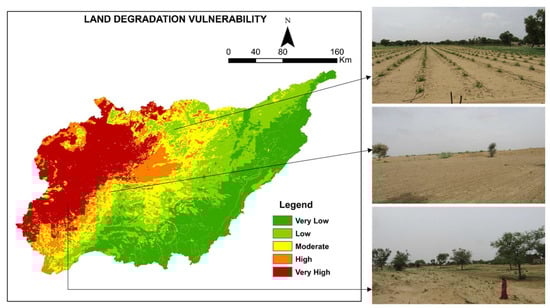
Figure 8.
Validation of LDV map with field photographs.
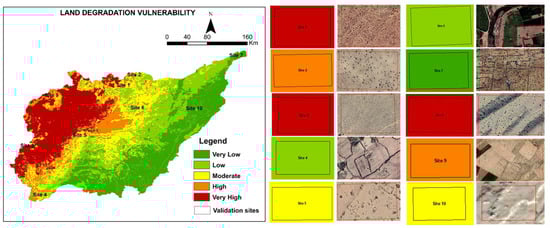
Figure 9.
Validation of LDV map with Google Earth images.
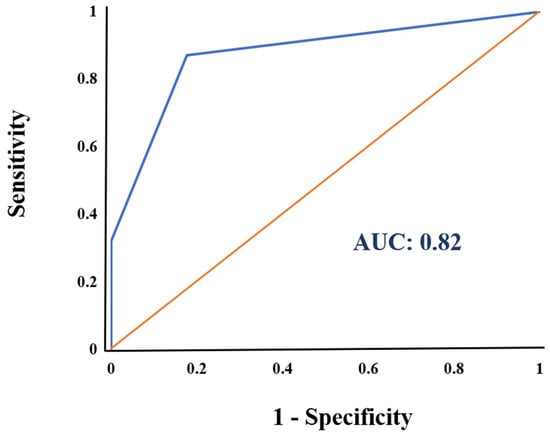
Figure 10.
ROC curve of the LDVZ map using the AHP model.
4. Discussion
Assessments of land degradation status are important for sustainable agricultural planning and development in an ecosystem. Since land degradation has recently accelerated, spatial risk mapping of land degradation is required in order to help authorities make trustworthy and fair decisions on ecosystem rehabilitation or restoration and investment priorities [51]. In the hot, arid western Rajasthan, wind erosion causes serious land degradation and has an impact on the crop production system [19]. For sustainable natural resource management, the identification of areas sensitive to wind erosion is urgently required. Therefore, using an AHP- and GIS-based modeling technique, the current research was carried out to identify land degradation vulnerability zones in the Luni River basin.
In the present investigation, NDVI, MAR, LST, erosion class, slope, LULC, SOC, soil depth, and soil texture were taken into consideration for land degradation vulnerability mapping. The most important layers for assessing vulnerability to land degradation were determined to be NDVI and MAR. It has long been known that NDVI is a valuable tool for assessing the vegetation cover of any study area, and it is widely acknowledged in research that a decline in NDVI is an indication of land degradation and is directly related to climatic factors [52,53]. Rainfall is the most significant factor for wind erosion, as low-rainfall zones are highly vulnerable to sand movement and, consequently, wind erosion [54,55]. LST is a crucial parameter in arid and semi-arid zones due to its direct relationship with soil moisture availability, and it is also a crucial parameter in this study because of its indirect relationship with the vegetation cover of the research area [56,57]. Increased land degradation and decreased vegetation greenness could be the effects of an increasing LST. LULC is a key contributor to land degradation since it indicates both natural and manmade changes in land surfaces [58]. SOC is an important soil parameter that acts as a binding agent and stabilizes the soil structure [59]. Therefore, the depletion of soil organic carbon can reduce soil aggregate stability and, as a consequence, increase soil erodibility [59,60]. Soil texture plays a significant role in the susceptibility of a soil surface to wind erosion [61,62]. Sandy soils are intrinsically more erodible than fine-textured soil due to the lack of clay and silt, which are necessary for physical crusting and soil aggregation [63,64]. Similarly, soil depth is also an important parameter, as shallow soil is more vulnerable to soil loss than deep soil [65]. We used slope as an input in the present study because topographic relief and surface fragmentation both increase with an increase in slopes, which results in a significant increase in surface roughness [66]. So, high-slope areas are less vulnerable to wind erosion.
Finally, weights were assigned to the thematic layers based on their importance, i.e., NDVI (0.27), MAR (0.22), LST (0.15), erosion class (0.12), slope (0.08), LULC (0.06), SOC (0.04), soil texture (0.03), and soil depth (0.02). Since NDVI is the most significant indicator of vegetal degradation, we identified it as the first most crucial parameter in the hierarchy. The mean annual rainfall was selected as the second most important parameter because low rainfall leads to a dry climate and, consequently, more wind erosion. The land surface temperature was chosen as the third layer in the hierarchy because regions with higher LSTs are assumed to have less vegetative cover and an arid climate compared to areas with lower LSTs. The soil erosion class was chosen as the fourth element in the hierarchy because soil erosion is a direct indicator of land degradation in the study area. Lower ranks in the hierarchy were given to the remaining layers. As a result, a pairwise comparison matrix was used to compare all layers. Before the integration of the thematic layers, consistency ratios for each thematic layer and its subclasses were computed. The computed CR value was ≤0.10, demonstrating the accuracy of all the parameters’ predictions regarding how they affect soil erosion.
The land degradation vulnerability (LDV) map generated using AHP- and GIS-based modeling was categorized into five subclasses, viz., very low, low, moderate, high, and very high, occupying 26%, 24.3%, 16%, 12.3%, and 21.4% of the river basin area, respectively. The result shows that the very low to low category of LDV covered half (50.3%) of the study area, predominantly covering the eastern and southern parts of the basin. These categories are mainly associated with high vegetative cover (NDVI >0.24), high to very high rainfall (685–1654 mm), LST <39 °C, deep soils with a clay loam to loam texture and a high organic carbon content, and slight-to-moderate soil erosion. Tolche et al. 2021 [35] also reported that deep soils with acidic-to-neutral pH were very slightly and slightly vulnerable to LD. High NDVI with optimized LULC can improve SOC, which acts as a binding agent and stabilizes soil structure and reduces soil erosion losses [67]. Similarly, many researchers have reported that very low to low categories of LDV have good vegetative coverage with open forests, very low vegetative degradation, adequate rainfall, and well-drained soils [38,43]. About 16% of the study area falls under moderate LDV, mainly concentrated in the central part of the basin. This region is characterized by less vegetative coverage, the scrub/shrub class of LULC, moderate soil erosion, medium rainfall (401–524 mm), medium LST, and sandy soil. Mzuri et al. 2021 [68] and Tolche et al. 2021 [35] also reported that a moderate level of LD was mainly associated with less vegetative cover, insufficient rainfall, a moderate temperature, and sparse shrubland.
The high and very high LDV classes covered about 33.7% of the river basin area mostly comprising the western part of the basin. These two classes showed high to very high severity of land degradation, such as sand dunes and wind erosion, with sparse vegetation conditions. This study area zone had very low vegetation cover (NDVI < 0.19), poor rainfall (<400 mm), a higher LST (39–43 °C), and sandy to sandy skeletal texture soils with low soil organic carbon (0–52 decigram/kg) and severe soil erosion. In the present study, NDVI and rainfall were the most sensitive input parameters. Rukhovich et al. (2021) [69] found that areas with low NDVI values are more prone to land degradation, where the probability of assessing LD using indicators such as NDVI computed from Landsat imagery was 87.5%. Similar to this, it was determined that the assessment of LD was more consistent with spatial and temporal variations in NDVI, especially in arid regions, than with other hydro-climatic indicators [70]. Due to the high temperatures in these locations, the little available precipitation will evaporate, preventing vegetation growth and reducing rain use effectiveness [71,72]. Similar findings were obtained in various studies on LDV for India’s semi-arid ecosystem, where low vegetation cover, little rainfall, and high temperatures make the area extremely vulnerable to LD [38,43]. The prioritization of the river basin was carried out to identify degraded land with high erosion activity so that suitable conservation measures can be taken to minimize LD [73]. The study area can be categorized into three priority zones: high priority (the very high and high LDV class), medium priority (the moderate LDV class), and low priority (the low and very low LDV class).
High-resolution Google Earth images and field photographs were used to validate the land degradation vulnerability zones, and the results are in excellent agreement with the model-based AHP-GIS approach. In earlier studies, similar types of validation approaches have been used by many researchers with respect to land degradation [38,43] and soil erosion hazards [74]. Moreover, the ROC curve has been used to assess the accuracy of AHP models [75,76,77]. ROC curves are commonly used to evaluate test accuracy, as they plot a test’s true positive rate versus its false positive rate [78,79]. Vulnerable to land degradation and non-vulnerable areas were selected from Google Earth images and used them to test the performance of AHP in river basins [38]. The AUC value of the ROC curve in the current investigation was observed to be 82%. Therefore, it could be determined that the AHP model produces satisfactory results in estimating the zones vulnerable to LD in the river basin.
In this research, the AHP- and GIS-based modeling approach showed its usefulness for the assessment of vulnerability to LD by combining different parameters. As expected, arid and semi-arid terrains are generally sensitive to LD; thus, it is important to consider both scientific and policy approaches [80]. The methodology followed in the present study could be used as a tool to guide decision makers in the prioritization of the river basin. The results of this study suggest that very high and high LDV zones should be considered hotspots for initiatives suitable for soil and water conservation measures and sustainable land resource management.
5. Conclusions
In the present study, nine thematic layers, namely, NDVI, LULC, rainfall, LST, slope, SOC, soil erosion, soil texture, and depth, were taken into consideration for LDVZ identification and mapping in the Luni River basin. The analysis revealed that 33.7% of the area falls under high to very high vulnerability, followed by 16% of the area falling under moderate vulnerability and 50.3% of the area falling under low to very low vulnerability. The validation of the LDVZ with Google Earth images and field photographs clearly showed that the remote sensing data combined with AHP adequately distinguished the sites prone to land degradation in the study basin in a cost-effective and time-efficient manner. Additionally, the ROC curve analysis, with an area under the ROC curve value of 82%, validated the AHP method’s potential to accurately estimate the LD vulnerability zones in the research area. Soil and water conservation structures that are appropriate could be suggested for the regions that are extremely and very highly prone to LD. Multi-criteria decision analyses and geospatial techniques can be used as tools for prioritization management in order to achieve LD neutrality in arid and semi-arid regions.
Author Contributions
Conceptualization, B.Y., L.C.M. and N.K.; methodology, G.P.O.R., P.C.M., A.P. (Abhishek Patel) and N.K.; software, B.Y. and L.C.M.; validation, M.N., R.L.M. and C.K.; formal analysis, B.Y., A.P. (Abhik Patra) and A.J.; investigation, B.Y.; resources, R.J.-B. and B.L.M.; data curation, B.Y., R.P.S., A.P. (Abhishek Patel) and L.R.Y.; writing—original draft preparation, B.Y., L.C.M., M.N., R.L.M. and A.P. (Abhik Patra); writing—review and editing, B.Y., R.P.S., B.L.M., G.P.O.R. and A.P. (Abhik Patra); visualization, B.Y., C.K. and L.R.Y.; supervision, B.L.M. All authors have read and agreed to the published version of the manuscript.
Funding
This research received no external funding.
Institutional Review Board Statement
Not applicable.
Informed Consent Statement
Not applicable.
Data Availability Statement
Not applicable.
Acknowledgments
The authors are grateful to the ICAR-NBSS & LUP and DST for their help and support.
Conflicts of Interest
The authors declare that there is no conflict of interest, either financially or otherwise.
References
- Tagore, G.S.; Bairagi, G.D.; Sharma, N.K.; Sharma, R.; Bhelawe, S.; Verma, P.K. Mapping of Degraded Lands Using Remote Sensing and GIS Techniques. J. Agric. Phys. 2012, 12, 29–36. [Google Scholar]
- UNCCD. The Global Land Outlook, 1st ed.; United Nations Convention to Combat Desertification: New York, NY, USA, 2017. [Google Scholar]
- D’Odorico, P.; Ravi, S. Land degradation and environmental change. In Biological and Environmental Hazards, Risks, and Disasters; Academic Press: Cambridge, MA, USA; Elsevier: Amsterdam, The Netherlands, 2016; pp. 219–227. [Google Scholar]
- Parmar, M.; Bhawsar, Z.; Kotecha, M.; Shukla, A.; Rajawat, A.S. Assessment of land degradation vulnerability using geospatial technique: A case study of Kachchh District of Gujarat, India. J. Indian Soc. Remote Sens. 2021, 49, 1661–1675. [Google Scholar] [CrossRef]
- UNCCD. Elaboration of an International Convention to Combat Desertification in Countries Experiencing Serious Drought and/or Desertification, Particularly in Africa; United Nations: New York, NY, USA, 1994. [Google Scholar]
- UNCCD. Desertification-Coping with Today’s Global Challenges in the Context of the Strategy of the UNCCD; United Nations Convention to Combat Desertification: Bonn, Germany, 2008. [Google Scholar]
- Barbero-Sierra, C.; Marques, M.J.; Ruiz-Pérez, M.; Escadafal, R.; Exbrayat, W. How is desertification research addressed in Spain? Land versus soil approaches. Land Degrad. Dev. 2015, 26, 423–432. [Google Scholar] [CrossRef]
- Fleskens, L.; Stringer, L.C. Land management and policy responses to mitigate desertification and land degradation. Land Degrad. Dev. 2014, 25, 1–4. [Google Scholar] [CrossRef]
- Orusa, T.; Orusa, R.; Viani, A.; Carella, E.; Borgogno Mondino, E. Geomatics and EO data to support wildlife diseases assessment at landscape level: A pilot experience to map infectious keratoconjunctivitis in chamois and phenological trends in Aosta Valley (NW Italy). Remote Sens. 2020, 12, 3542. [Google Scholar] [CrossRef]
- Prăvălie, R.; Patriche, C.; Borrelli, P.; Panagos, P.; Roșca, B.; Dumitraşcu, M.; Nita, I.A.; Săvulescu, I.; Birsan, M.V.; Bandoc, G. Arable lands under the pressure of multiple land degradation processes. A global perspective. Environ. Res. 2021, 194, 110697. [Google Scholar] [CrossRef]
- Lal, R. Adaptation and Mitigation of Climate Change by Improving Agriculture in India. In Climate Change and Agriculture in India: Impact and Adaptation; Sheraz Mahdi, S., Ed.; Springer: Cham, Switzerland, 2019. [Google Scholar]
- Romshoo, S.A.; Amin, M.; Sastry, K.L.N.; Parmar, M. Integration of social, economic, and environmental factors in GIS for land degradation vulnerability assessment in the Pir Panjal Himalaya, Kashmir, India. Appl. Geogr. 2020, 125, 102307. [Google Scholar] [CrossRef]
- Bhattacharyya, R.; Ghosh, B.N.; Mishra, P.K.; Mandal, B.; Rao, C.S.; Sarkar, D.; Das, K.; Anil, K.S.; Lalitha, M.; Hati, K.M.; et al. Soil degradation in India: Challenges and potential solutions. Sustainability 2015, 7, 3528–3570. [Google Scholar] [CrossRef]
- Srinivasarao, C.; Chary, G.R.; Raju, B.M.K.; Jakkula, V.S.; Rani, Y.S.; Rani, N. Land use planning for low rainfall (450–750 mm) regions of India. Agropedology 2014, 24, 197–221. [Google Scholar]
- Singh, K.; Tewari, S.K. Does the road to land degradation neutrality in India is paved with restoration science? Restor. Ecol. 2021, 30, e13585. [Google Scholar] [CrossRef]
- Goyal, R.K.; Saxena, A.; Moharana, P.C.; Pandey, C.B. Crop water demand under climate change scenarios for western Rajasthan. Ann. Arid Zone 2013, 52, 89–94. [Google Scholar]
- Kar, A.; Moharana, P.C.; Raina, P.; Kumar, M.; Soni, M.L.; Santra, P.; Ajai; Arya, A.S.; Dhinwa, P.S. Desertification and its control measures. In Trends in Arid ZoneResearches in India; Kar, A., Garg, B.K., Singh, M.P., Kathju, S., Eds.; Central AridZone Research Institute: Jodhpur, India, 2009; pp. 1–47. [Google Scholar]
- Moharana, P.C.; Gaur, M.K.; Chaudhary, C.; Chauhan, J.S.; Rajpurohit, R.S. Asystem of Geomorphological mapping for western Rajasthan with relevance foragricultural land use. Ann. Arid Zone 2013, 52, 163–180. [Google Scholar]
- Santra, P.; Moharana, P.C.; Kumar, M.; Soni, M.L.; Pandey, C.B.; Chaudhari, S.K.; Sikka, A.K. Crop production and economic loss due to wind erosion in hot arid ecosystem of India. Aeolian Res. 2017, 28, 71–82. [Google Scholar] [CrossRef]
- Selmy, S.A.; Abd Al-Aziz, S.H.; Jiménez-Ballesta, R.; García-Navarro, F.J.; Fadl, M.E. Modeling and Assessing Potential Soil Erosion Hazards Using USLE and Wind Erosion Models in Integration with GIS Techniques: Dakhla Oasis, Egypt. Agriculture 2021, 11, 1124. [Google Scholar] [CrossRef]
- AbdelRahman, M.A.E. Estimating soil fertility status in physically degraded land using GIS and remote sensing techniques in Chamarajanagar district, Karnataka, India. Egypt. J. Remote Sens. Space Sci. 2016, 19, 95–108. [Google Scholar] [CrossRef]
- Sujatha, G.; Dwivedi, R.S.; Sreenivas, K.; Venkataratnam, L. Mapping and monitoring of degraded lands in part of Jaunpur district of Uttar Pradesh using temporal spaceborne multispectral data. Int. J. Remote Sens. 2000, 21, 519–531. [Google Scholar] [CrossRef]
- AbdelRahman, M.A.E.; Tahoun, S.A.; Abdel Bary, E.A.; Arafat, S.M. Detecting Land Degradation Processes Using Geo Statistical Approach in Port Said, Egypt. Zagazig J. Agric. Res. 2008, 35, 1361–1379. [Google Scholar]
- Reddy, G.P.O.; Kumar, N.; Singh, S.K. Remote Sensing and GIS in Mapping and Monitoring of Land Degradation. In Geospatial Technologies in Land Resources Mapping, Monitoring and Management; Reddy, G.P.O., Singh, S.K., Eds.; Geotechnologies and the Environment; Springer: Cham, Switzerland, 2018; Volume 21, pp. 401–424. [Google Scholar]
- Jong, R.; Bruin, S.; Schaepman, M.; Dent, D. Quantitative mapping of global land degradation using earth observations. Int. J. Remote Sens. 2011, 32, 6823–6847. [Google Scholar] [CrossRef]
- Higginbottom, T.; Symeonakis, E. Assessing land degradation and desertification using vegetation index data: Current frameworks and future directions. Remote Sens. 2014, 6, 9552–9575. [Google Scholar] [CrossRef]
- Yousefi, S.; Pourghasemi, H.R.; Avand, M.; Janizadeh, S.; Tavangar, S.; Santosh, M. Assessment of land degradation using machine-learning techniques: A case of declining rangelands. Land Degrad. Dev. 2021, 32, 1452–1466. [Google Scholar] [CrossRef]
- Basu, T.; Das, A.; Pham, Q.B.; Al-Ansari, N.; Linh, N.T.T.; Lagerwall, G. Development of an integrated peri-urban wetland degradation assessment approach for the Chatra Wetland in eastern India. Sci. Rep. 2021, 11, 1–22. [Google Scholar]
- Chen, L.; Ren, C.; Li, L.; Wang, Y.; Zhang, B.; Wang, Z.; Li, L. A comparative assessment of geostatistical, machine learning, and hybrid approaches for mapping topsoil organic carbon content. ISPRS Int. J. GeoInf. 2019, 8, 174. [Google Scholar] [CrossRef]
- Li, Z.; Wang, S.; Song, S.; Wang, Y.; Musakwa, W. Detecting land degradation in Southern Africa using Time Series Segment and Residual Trend (TSS-RESTREND). J. Arid Environ. 2021, 184, 104314. [Google Scholar] [CrossRef]
- Waltner, I.; Saeidi, S.; Grósz, J.; Centeri, C.; Laborczi, A.; Pásztor, L. Spatial assessment of the effects of land cover change on soil erosion in Hungary from 1990 to 2018. ISPRS Int. J. Geo-Inf. 2020, 9, 667. [Google Scholar] [CrossRef]
- Lahlaoi, H.; Hassan, R.; Atika, H.; Said, L.; Said, M. Desertification assessment using MEDALUS model in Watershed Oued El Maleh Morocco. Geoscience 2017, 7, 50. [Google Scholar] [CrossRef]
- Rabah, B.; Aida, B. Adaptation of MEDALUS method for the analysis depicting land degradation in Oued Labiod Valley (Eastern Algeria). In Advances in Remote Sensing and Geo Informatics Applications; El-Askary, H.M., Lee, S., Heggy, E., Pradhan, B., Eds.; Springer: Dordrecht, The Netherlands, 2018. [Google Scholar]
- Abuzaid, A.S.; AbdelRahman, M.A.; Fadl, M.E.; Scopa, A. Land degradation vulnerability mapping in a newly-reclaimed desert oasis in a hyper-arid agro-ecosystem using AHP and geospatial techniques. Agronomy 2021, 11, 1426. [Google Scholar] [CrossRef]
- Tolche, A.D.; Gurara, M.A.; Pham, Q.B.; Anh, D.T. Modelling and accessing land degradation vulnerability using remote sensing techniques and the analytical hierarchy process approach. Geocarto Int. 2021, 1–21. [Google Scholar] [CrossRef]
- Wu, Q.; Wang, M. A framework for risk assessment on soil erosion by water using an integrated and systematic approach. J. Hydrol. 2007, 337, 11–21. [Google Scholar] [CrossRef]
- Alexakis, D.D.; Hadjimitsis, D.G.; Agapiou, A. Integrated use of remote sensing, GIS and precipitation data for the assessment of soil erosion rate in the catchment area of “Yialias” in Cyprus. Atmos. Res. 2013, 131, 108–124. [Google Scholar] [CrossRef]
- Sandeep, P.; Reddy, G.P.O.; Jegankumar, R.; Arun Kumar, K.C. Modeling, and assessment of land degradation vulnerability in semi-arid ecosystem of Southern India using temporal satellite data, AHP and GIS. Environ. Model. Assess. 2021, 26, 143–154. [Google Scholar] [CrossRef]
- Singh, M.; Urmila, P.S.; Yadav, K.; Bhakar, S.; Kothati, M. Site suitability analysis for groundwater management in river basin of India. Poll Res. 2022, 41, 132–139. [Google Scholar] [CrossRef]
- Kumar, M.D.; Bassi, N.; James, A.J. Water accounting for Luni river basin, western Rajasthan. In From Catchment Management to Managing River Basins: Science, Technology Choices, Institutions and Policy; Reddy, R., James, A.J., Eds.; Elsevier: Amsterdam, The Netherlands, 2019. [Google Scholar]
- Karra, K.; Kontgis, C.; Statman-Weil, Z.; Mazzariello, J.C.; Mathis, M.; Brumby, S.P. Global land use/land cover with Sentinel 2 and deep learning. In Proceedings of the 2021 IEEE International Geoscience and Remote Sensing Symposium IGARSS, Brussels, Belgium, 1–16 July 2021; pp. 4704–4707. [Google Scholar]
- Jiang, L.; Jiapaer, G.; Bao, A.; Kurban, A.; Guo, H.; Zheng, G.; De Maeyer, P. Monitoring the long-term desertification process and assessing the relative roles of its drivers in Central Asia. Ecol. Indic. 2019, 104, 195–208. [Google Scholar] [CrossRef]
- Malav, L.C.; Yadav, B.; Tailor, B.L.; Pattanayak, S.; Singh, S.V.; Kumar, N.; Reddy, G.P.O.; Mina, B.L.; Dwivedi, B.S.; Jha, P.K. Mapping of Land Degradation Vulnerability in the Semi-Arid Watershed of Rajasthan, India. Sustainability 2022, 14, 10198. [Google Scholar] [CrossRef]
- Wu, H.; Guo, B.; Fan, J.; Yang, F.; Han, B.; Wei, C.; Lu, Y.; Zang, W.; Zhen, X.; Meng, C. A novel remote sensing ecological vulnerability index on large scale: A case study of the China-Pakistan Economic Corridor region. Ecol. Indic. 2021, 129, 107955. [Google Scholar] [CrossRef]
- Akay, H. Flood hazards susceptibility mapping using statistical, fuzzy logic, and MCDM methods. Soft Comput. 2021, 25, 9325–9346. [Google Scholar] [CrossRef]
- Chen, S.; Liu, W.; Bai, Y.; Luo, X.; Li, H.; Zha, X. Evaluation of watershed soil erosion hazard using combination weight and GIS: A case study from eroded soil in Southern China. Nat. Hazards 2021, 109, 1603–1628. [Google Scholar] [CrossRef]
- Neji, N.; Ayed, R.B.; Abida, H. Water erosion hazard mapping using analytic hierarchy process (AHP) and fuzzy logic modeling: A case study of the Chaffar Watershed (Southeastern Tunisia). Arab. J. Geosci. 2021, 14, 1–15. [Google Scholar] [CrossRef]
- Alam, N.M.; Jana, C.; Mandal, D.; Meena, S.K.; Shrimali, S.S.; Mandal, U.; Mitra, S.; Kar, G. Applying Analytic Hierarchy Process for Identifying Best Management Practices in Erosion Risk Areas of Northwestern Himalayas. Land 2022, 11, 832. [Google Scholar] [CrossRef]
- Mukherjee, I.; Singh, U.K. Delineation of groundwater potential zones in a drought-prone semi-arid region of east India using GIS and analytical hierarchical process techniques. Catena 2020, 194, 104681. [Google Scholar] [CrossRef]
- Saaty, T.L. How to make a decision: The analytic hierarchy process. Interfaces 1994, 26, 19–43. [Google Scholar] [CrossRef]
- Torabi Haghighi, A.; Darabi, H.; Karimidastenaei, Z.; Davudirad, A.A.; Rouzbeh, S.; Rahmati, O.; Sajedi-Hosseini, F.; Klöve, B. Land degradation risk mapping using topographic, human-induced, and geo-environmental variables and machine learning algorithms, for the Pole-Doab watershed, Iran. Environ. Earth Sci. 2021, 80, 1–21. [Google Scholar] [CrossRef]
- Emmanuel, O. Effects of Deforestation on Land Degradation; LAP LAMBERT Academic Publishing: Ado Ekiti, Nigeria, 2017. [Google Scholar]
- Lennart, O.; Humberto, B. Climate Change and Land: An IPCC Special Report on Climate Change, Desertification, Land Degradation, Sustainable Land Management, Food Security, and Greenhouse Gas Fluxes in Terrestrial Ecosystems (Sweden: Land Degradation); Moreno, J.M., Ed.; IPCC: Geneva, Switzerland, 2019.
- Singh, S.; Kar, A.; Joshi, D.C.; Kumar, S.; Sharma, K.D. Desertification problem in western Rajasthan. Ann. Arid Zone 1994, 33, 191. [Google Scholar]
- Houyou, Z.; Bielders, C.L.; Benhorma, H.A.; Dellal, A.; Boutemdjet, A. Evidence of strong land degradation by wind erosion as a result of rainfed cropping in the Algerian steppe: A case study at Laghouat. Land Degrad. Dev. 2016, 27, 1788–1796. [Google Scholar] [CrossRef]
- Faramarzi, M.; Heidarizadi, Z.; Mohamadi, A.; Heydari, M. Detection of vegetation changes in relation to normalized difference vegetation index (NDVI) in semi-arid rangeland in western Iran. J. Agric. Sci. Technol. 2018, 20, 51–60. [Google Scholar]
- Yang, L.; Sun, G.; Zhi, L.; Zhao, J. Negative soil moisture-precipitation feedback in dry and wet regions. Sci. Rep. 2018, 8, 4026. [Google Scholar] [CrossRef]
- Tolessa, T.; Dechassa, C.; Simane, B.; Alamerew, B.; Kidane, M. Land use/land cover dynamics in response to various driving forces in Didessa sub-basin, Ethiopia. GeoJournal 2020, 85, 747–760. [Google Scholar] [CrossRef]
- Bronick, C.J.; Lal, R. Soil structure and management: A review. Geoderma 2005, 124, 3–22. [Google Scholar] [CrossRef]
- Mahmoodabadi, M.; Ahmadbeigi, B. Dry and water-stable aggregates in different cultivation systems of arid region soils. Arab. J. Geosi. 2013, 6, 2997–3002. [Google Scholar] [CrossRef]
- Belnap, J.; Phillips, S.L.; Herrick, J.E.; Johansen, J.R. Wind erodibility of soils at Fort Irwin, California (Mojave Desert), USA, before and after trampling disturbance: Implications for land management. Earth Surf. Process. Landf. 2007, 32, 75–84. [Google Scholar] [CrossRef]
- Pásztor, L.; Négyesi, G.; Laborczi, A.; Kovács, T.; László, E.; Bihari, Z. Integrated spatial assessment of wind erosion risk in Hungary. Nat. Hazards Earth Syst. Sci. 2016, 16, 2421–2432. [Google Scholar] [CrossRef]
- Chepil, W.S.; Woodruff, N.P. The physics of wind erosion and its control. Adv. Agron. 1963, 15, 211–302. [Google Scholar]
- Colazo, J.C.; Buschiazzo, D.E. Soil dry aggregate stability and wind erodible fraction in a semiarid environment of Argentina. Geoderma 2010, 159, 228–236. [Google Scholar] [CrossRef]
- Frasetya, B.; Suriadikusumah, A.; Haryanto, R.; Hidayat, C. A new approach of soil degradation assessment for biomass production in Subang District West Java Province. IOP Conf. Ser. Earth Environ. Sci. 2019, 393, 012075. [Google Scholar] [CrossRef]
- Zhou, Y.; Guo, B.; Wang, S.; Tao, H. An estimation method of soil wind erosion in Inner Mongolia of China based on geographic information system and remote sensing. J. Arid Land 2015, 7, 304–317. [Google Scholar] [CrossRef]
- AbdelRahman, M.A.; Natarajan, A.; Hegde, R.; Prakash, S.S. Assessment of land degradation using comprehensive geostatistical approach and remote sensing data in GIS-model builder. Egypt. J. Remote Sens. Space Sci. 2019, 22, 323–334. [Google Scholar] [CrossRef]
- Mzuri, R.T.; Mustafa, Y.T.; Omar, A.A. Land degradation assessment using AHP and GIS-based modelling in Duhok District, Kurdistan Region, Iraq. Geocarto Int. 2021, 1–19. [Google Scholar] [CrossRef]
- Rukhovich, D.I.; Koroleva, P.V.; Rukhovich, D.D.; Kalinina, N.V. The use of deep machine learning for the automated selection of remote sensing data for the determination of areas of arable land degradation processes distribution. Remote Sens. 2021, 13, 155. [Google Scholar] [CrossRef]
- Hereher, M.; El-Kenawy, A. Assessment of land degradation in northern Oman using geospatial techniques. Earth Syst. Environ. 2022, 6, 469–482. [Google Scholar] [CrossRef]
- Hein, L. The impacts of grazing and rainfall variability on the dynamics of a Sahelian rangeland. J. Arid Environ. 2006, 64, 488–504. [Google Scholar] [CrossRef]
- Fensholt, R.; Rasmussen, K.; Kaspersen, P.; Huber, S.; Horion, S.; Swinnen, E. Assessing land degradation/ recovery in the african sahel from long-term earth observation based primary productivity and precipitation relationships. Remote Sens. 2013, 5, 664–686. [Google Scholar] [CrossRef]
- Ambarwulan, W.; Nahib, I.; Widiatmaka, W.; Suryanta, J.; Munajati, S.L.; Suwarno, Y.; Turmudi, T.; Darmawan, M.; Sutrisno, D. Using Geographic Information Systems and the Analytical Hierarchy Process for Delineating Erosion-Induced Land Degradation in the Middle Citarum Sub-Watershed, Indonesia. Front. Environ. Sci. 2021, 9, 710570. [Google Scholar] [CrossRef]
- Balasubramani, K.; Veena, M.; Kumaraswamy, K.; Saravanabavan, V. Estimation of soil erosion in a semi-arid watershed of Tamil Nadu (India) using revised universal soil loss equation (rusle) model through GIS. Model. Earth Syst. Environ. 2015, 1, 1–17. [Google Scholar] [CrossRef]
- Ghosh, A.; Maiti, R. Development of new Ecological Susceptibility Index (ESI) for monitoring ecological risk of river corridor using F-AHP and AHP and its application on the Mayurakshi river ofEastern India. Ecol. Inform. 2021, 63, 101318. [Google Scholar] [CrossRef]
- Nikhil, S.; Danumah, J.H.; Saha, S.; Prasad, M.K.; Rajaneesh, A.; Mammen, P.C.; Ajin, R.S.; Kuriakose, S.L. Application of GIS and AHP Method in Forest Fire Risk Zone Mapping: A Study of the Parambikulam Tiger Reserve, Kerala, India. J. Geovisualization Spat. Anal. 2021, 5, 14. [Google Scholar] [CrossRef]
- Senapati, U.; Das, T.K. Assessment of basin-scale groundwater potentiality mapping in drought-prone upper Dwarakeshwar River basin, West Bengal, India, using GIS-based AHP techniques. Arab. J. Geosci. 2021, 14, 960. [Google Scholar] [CrossRef]
- Pourghasemi, H.R.; Beheshtirad, M.; Pradhan, B. A comparative assessment of prediction capabilities of modified analytical hierarchy process (M-AHP) and Mamdani fuzzy logic models using Netcad-GIS for forest fire susceptibility mapping. Geomat. Nat. Hazards Risk 2016, 7, 861–885. [Google Scholar] [CrossRef]
- Abedi, R.; Costache, R.; Shafizadeh-Moghadam, H.; Pham, Q.B. Flash-flood susceptibility mapping based on XGBoost, random forest and boosted regression trees. Geocarto Int. 2021, 37, 5479–5496. [Google Scholar] [CrossRef]
- Halbac-Cotoara-Zamfir, R.; Smiraglia, D.; Quaranta, G.; Salvia, R.; Salvati, L.; Giménez-Morera, A. Land degradation and mitigation policies in the Mediterranean region: A brief commentary. Sustainability 2020, 12, 8313. [Google Scholar] [CrossRef]
Disclaimer/Publisher’s Note: The statements, opinions and data contained in all publications are solely those of the individual author(s) and contributor(s) and not of MDPI and/or the editor(s). MDPI and/or the editor(s) disclaim responsibility for any injury to people or property resulting from any ideas, methods, instructions or products referred to in the content. |
© 2022 by the authors. Licensee MDPI, Basel, Switzerland. This article is an open access article distributed under the terms and conditions of the Creative Commons Attribution (CC BY) license (https://creativecommons.org/licenses/by/4.0/).