Article

Research on Functional Value Estimation and Development Mode of Green Infrastructure Based on Multi-Dimensional Evaluation Model: A Case Study of China

1
School of Management Engineering, Shandong Jianzhu University, Jinan 250101, China
2
Institute of Geographic Sciences and Natural Resources Research, Chinese Academy of Sciences, Beijing 100101, China
*
Author to whom correspondence should be addressed.
Land 2022, 11(9), 1603; https://doi.org/10.3390/land11091603
Submission received: 13 August 2022 / Revised: 1 September 2022 / Accepted: 13 September 2022 / Published: 19 September 2022

Abstract

:
With the rapid development of urbanization and industrial economy, urban green space and land resources have been squeezed. The problem of urban ecological environment pollution is becoming increasingly serious. With the concept of sustainable development, green infrastructure construction can not only improve the adverse effects of human activities on the urban ecological environment, it can also deal with the relationship between survival and development, economy and the environment, society, and resources. This paper used different provinces and regions of China as an example to construct a multi-dimensional evaluation model. The multi-function green infrastructure was evaluated quantitatively from three dimensions: economy, society, and ecology. The study results showed that the multifunctional development level of green infrastructure varies among different regions in China due to regional location, economic development, and natural resources. The development mode of green infrastructure in North China, South China, and Northwest China has changed from multi-functional weak and basic coordination to strong and coordinated development. Therefore, the multi-dimensional analysis of green infrastructure is helpful for systematically studying and evaluating the functional value of green infrastructure. It can be used to investigate the development models of green infrastructure in different regions, formulate green infrastructure development strategies, and provide countermeasures and suggestions for relevant government departments.

1. Introduction

Under the dual influence of rapid urbanization expansion and climate change, the utilization rate of urban green space and land resources is low. Urban environmental problems have exacerbated urban air pollution, rainstorms, flooding, water pollution, the heat island effect, and ecological diversity degradation, leading to a systematic imbalance of ecological services [1,2]. With the continuous progress and development of society, the comprehensive development of the ecological economy is an important theory in ecological economics, and sustainable development and circular economy have become the focus of urban development. In 1999, the United States Geographical Indication Working Group first proposed the definition of green infrastructure, that is, the nation’s natural life support system, a connected network consisting of parks, forests, farms, wetlands, greenways, waterways, and other protected areas [3]. To reduce the demand for grey infrastructure, the construction of green infrastructure is reasonably planned. It can not only save the investment of national public resources but also expenditure on urban pollution treatment, to improve the urban low-carbon economy and environmental protection benefits. At the same time, green infrastructure can maintain human health, natural resource diversity, and sustainable urban development [4].
In recent years, the research directions of international scholars have mainly included the concept and theoretical development of green foundations [4,5,6], planning and construction [7,8,9,10], and ecosystem service value [11,12,13]. Most of these scholars have conducted a lot of research on the ecological function value of regulation service, cultural service, supply service, and support service. They have mainly focused on the fact that green infrastructure can provide water and food, improve the regulation of stormwater and the climate, alleviate the heat island effect, provide leisure and entertainment places, maintain the nutrient cycle of the earth’s living environment, and protect urban biodiversity [14,15,16,17]. However, in green infrastructure development and planning, people usually focus on maintaining the value and function of ecosystems. There is little understanding of social, cultural, and economic benefits [18], and there is no multi-level analysis of the functional value of green infrastructure. In addition, there are few studies on the quantitative evaluation and criteria of the comprehensive performance of green infrastructure. At present, the evaluation research of green infrastructure can be divided into three categories. The first is the evaluation of the ecological landscape. It primarily includes the evaluation of spatial structures such as landscape ecology, urban planning, and ecological protection patterns. [19]. Based on the information on ecological processes such as the ecological habitat and species dispersal, the corridor connectivity of the network structure is evaluated, and the optimal scheme with high connectivity and low consumption is selected to form a green infrastructure network [20]. The second is the evaluation of ecosystem service value. This evaluation method can be divided into the material quality evaluation method and the value quantity evaluation method [21]. Relevant scholars have established comprehensive methods for spatial distribution, supply–demand relationships, and the vulnerability assessment of urban ecosystem services [22]. The third is the evaluation of urban economic benefits to assess the target benefits of green infrastructure technology. This mainly includes rainwater runoff regulation [23,24,25], climate change regulation [26,27,28], heat island effect mitigation [29,30], real estate appreciation [31,32], and tourism economic development promotion [33,34].
As a strategically planned network of natural and semi-natural areas, green infrastructure enables the multifunctional use of natural resources and improves people’s physical and mental health and quality of life. The main functional value of green infrastructure includes an economic function, a social function, and an ecological function [31,35]. Compared with gray infrastructure with a single function, green infrastructure can improve water-use efficiency, adapt to climate change, resist the risk of natural disasters, and reduce management costs and unnecessary expenses through rational planning and construction technology based on protecting the natural environment [18]. Therefore, increasing investment in green infrastructure can not only protect the urban ecological environment but also play a significant role in promoting regional development. The social function value of green infrastructure refers to the immaterial benefits people receive. These include residents’ physical and mental health, aesthetic value, social relations, sense of place, entertainment, and cultural heritage value [36]. Urban green parks provide residents with recreation opportunities and entertainment. Studies have shown that frequent visits to parks can help increase self-esteem and happiness, promote children’s brain development, and improve cognitive function and mental models [37]. Enhancing community awareness through exposure to nature’s flora and fauna and by spending time outdoors with friends and family can help combat social exclusion and isolation. Exposure to green infrastructure promotes a sense of local dependence and social cohesion [18]. Ecosystem services are the basic functions of green infrastructure, which mainly include resisting the threat of urban stormwater, regulating regional microclimate, preventing and controlling water pollution, improving air quality, reducing noise pollution, mitigating the urban heat island effect, and other ecological services [6]. In addition, green infrastructure also reduces the carbon footprint of transportation and energy supply, promotes healthy ecosystem networks, and protects ecological diversity and habitats [38].
Although green infrastructure is conducive to repairing natural resource systems and alleviating urban ecological and environmental problems, it is difficult to bring direct economic benefits to stakeholders. Developers and related stakeholders are not very attracted to green infrastructure, and there is low investment in it, which hinders its construction and development. The purpose of this study was to analyze the comprehensive functional value level of economic benefits, social culture, and ecological services based on the multifunctional application of green infrastructure. It is helpful to formulate targeted green infrastructure development policies and construction plans, to promote the construction and development of urban civilization and ecology. This paper uses the data of 31 provinces in China in 2020 to construct a green infrastructure evaluation system from three dimensions: economic, social, and ecological. Secondly, the entropy weight method and Technique for Order Preference by Similarity to Ideal Solution (TOPSIS) model were used to determine the evaluation index weight, and the green infrastructure development model was established based on it. Finally, according to the development mode of different regions, the paper classifies and analyzes the gap between different regions and provides countermeasures and suggestions for relevant government departments. The possible contributions of this paper are as follows: (1) this paper builds a more comprehensive evaluation index system for green infrastructure. Based on the three dimensions of economy, society, and ecology, the multi-functional value of green infrastructure can be measured more accurately, to provide a reference for international counterparts engaged in related research. (2) This paper uses the clustering method to analyze the form factors of the multifunctional value of green infrastructure in different regions, to form a multifunctional development model, which can more intuitively evaluate the development situation and rationality of green infrastructure in different regions. (3) Ecological and environmental problems have gradually changed from regional problems of one country to global problems that break national boundaries. However, examining the development characteristics and overall situation of green infrastructure in different provinces of China, it is helpful to provide a theoretical reference for the evaluation of green infrastructure in other countries and promote the sustainable development of urban planning and construction.

2. Materials and Methods

2.1. Overview

The multi-dimensional evaluation model analyzes and evaluates the research object from multiple dimensions [39]. The multi-dimensional evaluation model [40,41] is used to comprehensively evaluate the multi-functional value of green infrastructure. The value of each dimension indicates the development level of the function. A larger value indicates greater versatility. The value ranges from 0 to 1. This model can show the advantages and disadvantages of green infrastructure in a certain region. At the same time, the multifunctional development level of green infrastructure in different regions can be compared and studied.

2.2. Data Sources

The research object of this paper was the multifunctional development level of green infrastructure in 31 provinces and regions of China in 2020. The data were mainly derived from the statistical databases of the China Statistical Yearbook, the China Urban Construction Statistical Yearbook, Provincial Statistical Yearbooks, and Provincial Ecological Environmental Bulletin

2.3. Indicator Selection

According to scientific, comprehensive, representative, quantifiable, and operable principles, the evaluation index system is established from the three dimensions of economic function, social function, and ecological function of green infrastructure (Table 1).
Economic function refers to the effect of green infrastructure on the environmental and economic benefits of urban construction, the appreciation of the real estate industry, the promotion of resident consumption, and the attraction of tourism and the labor force. The economic benefits of green infrastructure come from the appreciation of real estate around urban green spaces and the improvement of the sales of real estate in green ecological corridors [42]. Secondly, urban park green space can attract a large number of tourists, promote the development of local tourism, and promote regional economic growth and sustainable development [43]. Representative indicators include investment in urban environmental infrastructure construction, per capita gross domestic product (GDP), per capita wages of workers in water conservancy, environmental and public facilities management, and domestic tourism income.
The social function mainly reflects that green infrastructure improves the physical and mental health of urban residents, increases employment opportunities, enhances the sense of local dependence, and attracts the rural population. Green spaces in cities have a direct impact on the health of residents, reducing mortality and the risk of several chronic diseases. At the same time, green natural elements can effectively buffer people’s emotional stress, thereby indirectly reducing stress levels and improving mental health [44,45]. In addition, green infrastructure can improve the working environment, strengthen the connection between urban and rural areas, improve productivity, and increase employment opportunities [16]. Representative indicators include the employment value of water conservancy, environment management, and public facilities management; the employment structure level of water conservancy and environment and public facilities management; the urbanization rate; population density; the population mortality rate; and the natural population growth rate.
Ecological functions are mainly reflected in the relief of urban rain and flooding, the regulation of air quality, the reduction in noise pollution, the guarantee of fresh water supply, the protection of ecosystems, and other services. Because of urban stormwater problems, green plants and soil of green infrastructure can store and permeate rainfall runoff and play a sustainable role in rainwater regulation and storage [2]. Due to climate change and a lack of vegetation, cities are more susceptible to extreme climate and natural disasters. The evaporation effect of urban green spaces, parks, green corridors, and other infrastructure can effectively absorb heat in the atmosphere, cool cities, and alleviate the impact of the urban heat island effect and extreme climate [28]. At the same time, green plants can absorb carbon dioxide in the air and release oxygen, adsorb and degrade particulate pollutants in the air, and improve the air quality of the urban environment [46]. The representative indicators include the green coverage rate, the green land rate, the per capita park green area, the forest coverage rate, the cultivated-land coverage rate, the average annual concentration of fine particles (PM2.5), the proportion of days with good ambient air quality in built-up areas, the equivalent sound level of environmental noise in urban areas dB (A), and the penetration rate of urban water supply.

2.4. Methodology

2.4.1. Entropy Weight Method

The entropy weight method [47,48] is an objective valuation method that uses the disorder degree of information to measure the utility value of information. According to the difference of each index, the entropy weight of each index is determined by information entropy and its weight is modified, and the objective weight of each index is obtained to evaluate the comprehensive level of each index. Among them, the higher the information entropy is, the more chaotic the system is and the less information it provides. The lower the entropy of information, the less chaotic the system is and the more information it provides. The entropy weight method can objectively reflect index information and is suitable for the comprehensive evaluation of multiple indexes. Therefore, this paper mainly uses the entropy weight method to determine the indicator weight of green infrastructure.
If n evaluation object i = 1 , 2 , , n and m evaluation index j = 1 , 2 , , m , then Rij is the value of the j index of the i evaluation object. The original evaluation matrix is
R =   r 11                       r 12                                       r 1 n     r 21                       r 22                                       r 2 n                                                                   r m 1                       r m 2                                     r m n  
(1) Standardized treatment of index range
In order to eliminate the influence of dimensionality and other attributes among indicators, the values of each indicator are standardized, namely,
Positive   Indexes :   p i j = r i j r j min r j max r j min + α
Negative   Indexes :   p i j = r j max r i j r j max r j min + α
where r i j is the original value of the index; p i j is the standardized value; r j max , r j min are the maximum and minimum values of the j index, respectively; and α is 0.0001.
(2) Calculate the proportion of indicators
b i j = p i j i = 1 n p i j          
(3) Calculate information entropy e j
e j = 1 ln n   n i = 1 b i j ln b i j
(4) Calculate the weight of indicators
w j = 1 e j i = 1 n 1 e j

2.4.2. TOPSIS Model

According to Fu and Chu [49], the TOPSIS Model is to sort the deviation degree between the finite evaluation object and the positive ideal solution and the negative ideal solution. The positive ideal solution refers to the solution where all indicators reach the optimal value, while the negative ideal solution refers to the solution where all indicators are the worst. The results are better when the evaluation object is closest to the positive ideal solution and worse when the evaluation object is far from the positive ideal solution.
(1) Calculate the weighting matrix
U = w j p i j =   u 11                       u 12                                       u 1 n     u 21                       u 22                                       u 2 n                                                                   u m 1                       u m 2                                     u m n  
(2) Determine positive and negative ideal solutions
Positive   ideal   solution :   z + = z 1 + , z 2 + , z n + = max z i j |   j = 1 , 2 , , m
Negative   ideal   solution :   z = z 1 , z 2 , z n = min z i j |   j = 1 , 2 , , m
(3) Calculate the distance between positive and negative understanding
d i + = m j = 1 z i j z j + 2
d i = m j = 1 z i j z j 2
(4) Calculate the degree of closeness
c j = d i d i + + d i

2.5. Scenario Clustering of Evaluation Results

According to the combination of three functional development levels of green infrastructure in different regions, the multi-functional evaluation results of green infrastructure in 31 provinces of China were analyzed by scenario cluster analysis. Using the method of systematic cluster analysis, this paper analyzes and evaluates the form factors of the multi-functional development model in various regions of China and proposes optimization suggestions for green infrastructure.

3. Results

Equations (1)–(6) were used to standardize the original data and calculate the index weights, as shown in Table 1. According to Equations (7) to (12), the comprehensive development level of economic, social, and ecological functions of green infrastructure in various provinces in China is obtained, as shown in 
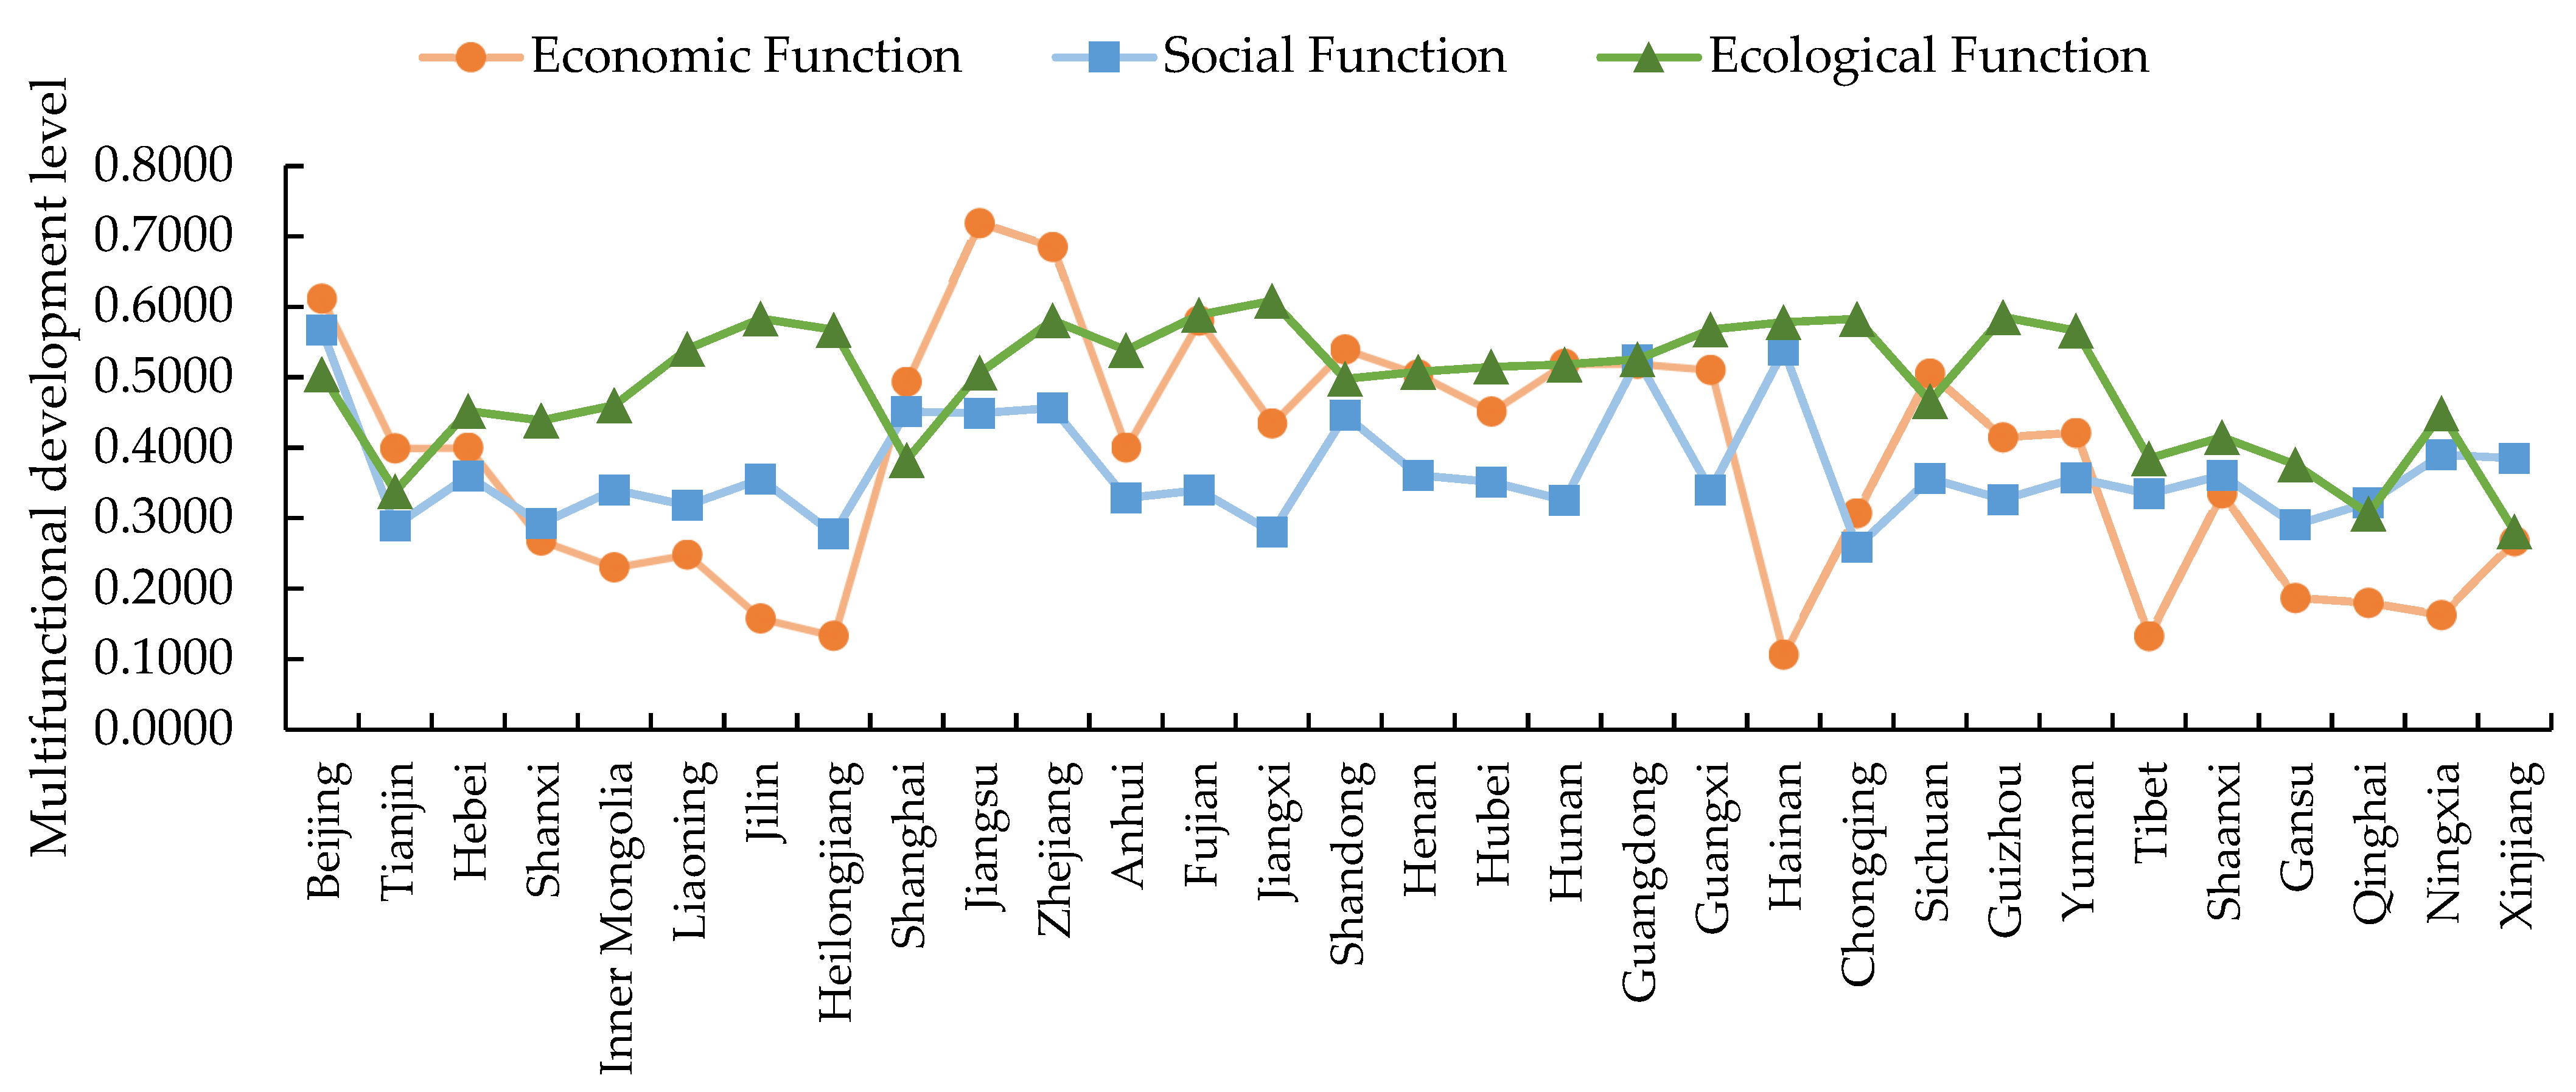
Table 2. According to the evaluation results, the trend chart of its development level is drawn, as shown in Figure 1.

3.1. Economic Function Analysis

According to the geographical division of China’s provinces and regions, the 31 provinces and regions are divided into North China, Northeast China, East China, Central China, South China, Xizang, and Northwest China. Among them, North China includes Beijing, Tianjin, and other provinces; Northeast China includes Liaoning, Jilin, and Heilongjiang provinces; East China includes Shanghai, Jiangsu, and other provinces; Central China includes Henan, Hubei, and Hunan; Central China includes Guangdong, Guangxi, and Hainan; South China includes Chongqing, Sichuan and other provinces; and the southwest region includes Shaanxi, Gansu, and other provinces.
According to the analysis of the evaluation results in Table 2, the development level of the economic function of green infrastructure in each province of China ranges from 0.1065 to 0.7193. The level of development varies greatly among different provinces. According to the mean values of indexes in different regions in Table 3, the economic function development of North China is higher than that of other regions in China. Northeast China has the lowest level of economic function development. Among them, Jiangsu Province has the highest level of economic function development and ranks first among all regions. According to the mean value of the evaluation index, East China > Central China > South China > North China > Southwest > Northwest > Northeast China in the investment of urban environmental infrastructure construction. It shows that China’s central and eastern regions are equipped with perfect environmental infrastructure and strong government investment. The inadequate development of facilities in the southwest and northeast of China may aggravate the vulnerability of the urban ecological environment. In terms of per capita GDP and per capita wages of workers in water conservancy, environment management, and public facilities management, the average levels in East, Central, North, and South China are still higher than those in Southwest, Northwest, and Northeast China. In terms of tourism development, Central China, East China, and South China occupy the top three places above the national average level, among which Zhejiang, Hunan, and Jiangsu have the highest index values of domestic tourism income and domestic tourism times. This shows that these areas have the characteristic resources of the cultural tourism region and the green and healthy tourism environment of cities, to attract more tourists.

3.2. Social Function Analysis

In terms of the comprehensive development level of the social function, the development level of green infrastructure in various provinces is between 0.2590 and 0.5668. There is little difference among provinces, as shown in Table 2. According to Table 4, the employment value and employment structure of water conservancy, environment management, and public facilities management are higher in South China than in other regions. Although the employment value of East China and Central China is higher than that of Northeast and Northwest China, in terms of employment structure level, the employment value of East and Central China is much lower than that of Northeast and northwest China. This indicates that the employment economic income of water conservancy, environment management, and public facilities management industry is high in East and central China, but the proportion of employees in this industry is low in the whole industry, and vice versa in the northeast and northwest China. The urbanization rate of North China, East China, and Northeast China is higher than that of other regions, among which Shanghai, Tianjin, and Beijing occupy the top three places. The population density of South China and southwest China is better than that of North China, East China, and Northeast China. The results show that the rapid development of big cities attracts a large rural population influx, but at the same time, the population surge causes urban traffic congestion, insufficient resources, environmental pollution, a shortage of public services, and other problems. Due to economic development, medical services, environmental quality, and other factors, the mortality rate and natural population growth rate of various regions are different. The mortality rate was the highest in northeast China and the lowest in North China. Liaoning, Jilin, and Heilongjiang provinces in northeast China and Shanghai in East China all have negative natural population growth rates.

3.3. Ecological Function Analysis

From the perspective of the ecological dimension, the development level of green infrastructure in each province of China ranges from 0.2809 to 0.6087. Central China, South China, and Northeast China were higher than other regions, and there was little difference among different provinces. The overall level of East China, North China, Southwest China, and Northwest China is relatively low, and the development of different provinces is unbalanced, as shown in Table 2. According to Table 5 and Table 6, the index means of green coverage rate and green land rate in built-up areas, North China, Central China, and Southwest China are higher than in other regions. Among them, the green coverage rate and the green land ratio of the built-up area in Beijing ranks first in China. This indicates that there is more investment in afforestation construction planning in these areas, and the proportion of afforestation coverage area and green space area in built-up areas is relatively high. With the rapid expansion of cities and the continuous growth of population, the green space in East China and Northeast China is gradually occupied. Relevant departments should increase the area of urban green space and vegetation to alleviate ecological and environmental problems such as the urban heat island effect and air pollution. Due to the unique conditions of geographical location and natural resources, the average value of the per capita park green space index in Northwest China is at the highest level, which provides recreation places and improves physical and mental health for people. The average value of forest coverage in South China is higher than that in other regions, and Fujian ranks first in China. The three provinces in Northeast China are known as “the granaries of China”. They have the blackest soil resources in China, and the cultivated-land coverage rate is higher than in other regions. In terms of air quality, South China with a large number of forest resources has the highest proportion of good air days, while North China has the lowest proportion of good air days and the highest level of fine particles (PM2.5) pollution. In the average index of the penetration rate of urban water supply, the development level of all regions is high, and the difference is not big.

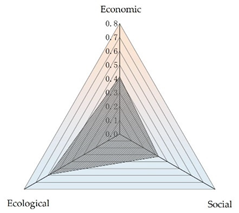
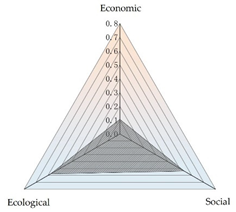
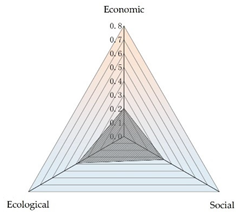
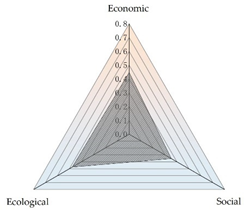
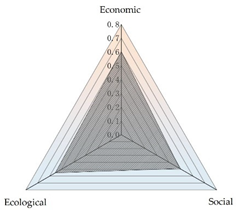
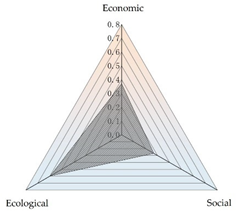
3.4. Multifunctional Development Model Analysis

Along with green planning to lead urban high-quality development, green infrastructure not only alleviates ecological environmental problems and ecological service value function but also improves labor productivity, promotes urban economic growth, and produces social and economic benefits for regional construction. Due to the different geographical locations and development and construction situations among provinces, the development level of the multifunctional value of green infrastructure presents obvious differences. Through the evaluation of the multifunctional development level of green infrastructure in each region, the coordination between economic, social, and ecological functions and the rule of multifunctional development mode was measured. The multi-dimensional evaluation model is used to cluster the evaluation results of multifunctional development levels of green infrastructure in various provinces of China, and it is divided into nine multifunctional development modes of green infrastructure, as shown in Table 7.
In terms of the ecological development model, Guizhou is a province in Southwest China. Due to its special geographical location and natural resource conditions, its forest coverage rate ranks 10th in the country, and it has many national forest parks with good air quality and a healthy environment. Therefore, the ecological function value has high value, but the development of economic and social functions is not prominent.
In terms of the ecological society priority and economic lag development mode, as one of the major tourist provinces in China, Hainan is one of the two tropical islands with beautiful scenery, a pleasant climate, and less air pollution, attracting a large number of foreign tourists. However, due to the unbalanced development of the region, most of the economic sources depend on Sanya city, so the overall economic level is low.
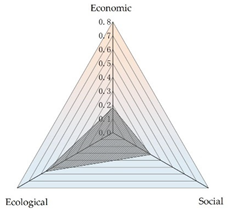
Multi-functional weak collaborative development mode. It mainly includes Shanxi and Inner Mongolia in north China and Tibet, and Gansu, Qinghai, Ningxia, and Xinjiang in northwest China. The development of economic, social, and ecological functions in these regions is relatively weak, and the development of various functions is relatively coordinated, but the overall level of comprehensive development is low. Therefore, it is necessary to vigorously develop economic strength, guarantee the quality of life of people, and protect the ecological environment of the region.
The multi-functional basic collaborative development mode mainly includes Tianjin, Hebei, Anhui, Shandong, Henan, Hubei, Hunan, Sichuan, and other provinces. The development level of economic, social, and ecological functions in each region is at the average level, and there is a relatively synergistic relationship among all the functions. Among them, the ecological development level of Hubei, Hunan, and Yunnan is relatively high. Shandong and Hunan have relatively high levels of economic development.
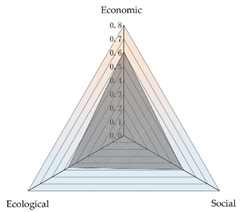
The multi-functional strong collaborative development mode mainly includes Zhejiang and Guangdong provinces. These areas have a high level of economic, social, and ecological function and are well coordinated, with a high overall level of multi-functional development and strong sustainable development ability.
The ecological priority economic lag development mode mainly includes the northeastern provinces of Liaoning, Jilin, and Heilongjiang. The level of ecological function development in these areas is high, reaching 0.5, but the level of economic function only reaches 0.1 ~ 0.2. Therefore, based on maintaining the balance of ecological functions, the three northeastern provinces should reasonably plan the construction of green infrastructure to promote the sustainable growth of the regional economic level.
The economic and social development model mainly includes Beijing, Shanghai, and Jiangsu. These areas are heavily invested in green infrastructure, with high social labor productivity and prominent economic functions. The social service value is high, which guarantees the physical and mental health of residents, while the ecological function value is at the general level.
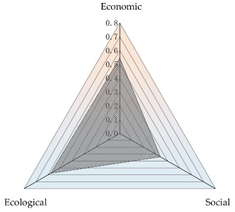
The ecological economy leading development mode includes Fujian in east China and Guangxi in south China. In this area of ecology, economic function is more outstanding, as is social function development in general.
The ecological priority social lag development model mainly includes Jiangxi in east China and Chongqing in southwest China. The level of ecological function development in these areas is relatively high, reaching 0.5-0.6, but the level of social function development is only 0.2. Therefore, the value of social services should be improved here to ensure people’s well-being.

4. Discussion

The lack of urban ecological environment resources and energy, and serious environmental pollution, restrict the construction of green infrastructure. At present, there are still many problems in green infrastructure construction in many cities in China, such as the insufficient allocation of land resources, insufficient investment by developers, and and insufficient government publicity and promotion. These problems hinder the construction and development of urban green infrastructure, thereby affecting the construction of urban ecological civilization. The core of urban sustainable development is to emphasize the harmonious development of economic benefits, social culture, and environmental resources [50]. It is necessary to increase cities’ attention to the construction of green infrastructure, build an ecological living environment in cities, alleviate the problems of the urban ecological environment, and promote the construction of ecological civilization. Therefore, a single evaluation of the ecological service and value of green infrastructure cannot effectively enhance the participation and initiative of relevant governments, developers, and relevant departments. It is necessary to evaluate the functional service value of green infrastructure from a multi-dimensional perspective to provide help for relevant policies and academic research.
Using the multi-dimensional evaluation model to quantify and evaluate the multi-functional value of green infrastructure can provide a theoretical basis for the future development planning and construction of various regions. Secondly, due to the significant regional differences in terms of geographical environment, resource endowment, and capital investment in different regions, the form factors of multifunctional green infrastructure are analyzed and evaluated by using the systematic clustering method, which can directly reflect the development mode of green infrastructure in different regions and provide a reference for the relevant decision-making departments of the government.
In addition, this study has some limitations and prospects. Further studies need to solve the following problems: (1) Due to the inability of green infrastructure system versatility to evaluate whether it is possible cover all of the properties and characteristics of green infrastructure involved, and the inability to verify its rationality, practical need further research. (2) Due to time limitations, the multifunctional evaluation and development model of green infrastructure in China is limited. In the next research, international famous cities can be added as reference objects to analyze and evaluate the multi-functional value of green infrastructure from an international perspective, to make the research results more convincing.

5. Conclusions

The current study used a comprehensive evaluation index system for the three functions of green infrastructure: economy, society, and ecology. The entropy weight TOPSIS method is used to evaluate the development level of green infrastructure functions in 31 provinces in China. A systematic clustering method was used to analyze the functional value of green infrastructure in each region. It is concluded that the multi-functional development model of green infrastructure in different regions of China has obvious differences in the level of functional development in different regions. The results show that due factors such as geographical location, economic development, and natural resources, there are differences in the multi-functional development level of green infrastructure in different regions of China. From the perspective of multi-functional value, the economic function development level in South China is the highest, while the development level in the west to the northeast is gradually weakened. In terms of social function value, there is little difference in the level of social function development in different regions. The ecological function development level in central China and south China is relatively high, while the ecological function value in North China and West China has gradually weakened. In terms of the multi-functional development mode, the development mode of green infrastructure in north China, south China, and northwest China has changed from a multi-functional weak coordination development mode, a basic coordination mode to a strong coordination mode. Based on the above research results, the following government countermeasures and suggestions are put forward.
(1) Improve the system and planning of green infrastructure. The government’s systematic research twoward green infrastructure is insufficient and lacks depth. There are still problems such as unbalanced supply and demand allocation and the unreasonable layout of green infrastructure in various regions. The government should make strategic land-use decisions, reduce the demand for club infrastructure, rationally optimize the layout of urban green space, and promote the sustainable development of cities.
(2) Formulate an effective incentive mechanism. However, in the urbanization construction process, developers and related stakeholders often develop green land into other lands to obtain short-term economic benefits. The relevant government departments lack the evaluation content of policy formulation, incentive management, and service efficiency and should correctly guide developers and related stakeholders to not only pursue economic interests but also pay attention to social, spiritual, cultural, and ecological protection.
(3) Increase public participation. The public is the most important stakeholder in green infrastructure, public participation is the key to the effective implementation of the plan, and the degree of social cognition is the key factor. It is crucial to use activites to win community residents over to green infrastructure and to mobilize public participation. In addition, relevant departments should formulate relevant encouragement policies, increase resource input, attract relevant professionals to participate in the construction of green infrastructure, and promote the development of green infrastructure.

Author Contributions

Conceptualization, F.Z.; methodology, F.Z. and X.W.; software, X.W.; validation, F.Z. and X.W.; formal analysis, F.Z.; investigation, F.Z.; resources, F.Z.; data curation, F.Z and X.W.; writing—original draft preparation, F.Z and X.W.; writing—review and editing, F.Z and X.W.; visualization, X.L.; supervision, X.L.; project administration, X.L.; funding acquisition, F.Z. All authors have read and agreed to the published version of the manuscript.

Funding

This research was funded by Shandong Provincial Social Science Planning and Research Project, grant number 20BGLJ06.

Institutional Review Board Statement

Not applicable.

Informed Consent Statement

Not applicable.

Conflicts of Interest

The authors declare no conflict of interest.

References

  1. Huang, N.; Shi, T.; Shi, Y.; Li, C.; Hu, Y. Research progress on ecological and social functions of green infrastructure. Acta Ecol. Sin. 2021, 41, 7946–7954. [Google Scholar]
  2. Wu, X.; Zhou, Z. Spatial relationship between supply and demand of urban green infrastructure ecosystem services: A case study of Xi ‘an City. Acta Ecol. Sin. 2019, 39, 9211–9221. [Google Scholar]
  3. Mell, I. Green Infrastructure: Concepts, Perceptions and Its Use in Spatial Planning; Newcastle University: Newcastle, Australia, 2010. [Google Scholar]
  4. Wu, W.; Fu, X. Concept of green infrastructure and review of research progress. Int. Urban Plan. 2009, 24, 67–71. [Google Scholar]
  5. Jiang, W.; Wei, H. Urban green infrastructure: Concept, classification and value. Jiangxi Norm. Univ. (Nat. Sci. Ed. ) 2021, 45, 246–254. [Google Scholar]
  6. Luan, B.; Chai, M.; Wang, X. Research progress of green infrastructure. Acta Ecol. Sin. 2017, 37, 5246–5261. [Google Scholar]
  7. Xie, F. Green infrastructure planning and its implications for China. Urban Dev. Res. 2015, 22, 52–58. [Google Scholar]
  8. Zhao, W. Research on Green Infrastructure Planning in mountainous cities from the perspective of ecological civilization: A case study of New Town in Jiulongpo District, Chongqing. Urban Plan. Rev. 2021, 45, 91–103. [Google Scholar]
  9. Liu, M.; Fan, J.; Yu, Z. Multi-functional Green Infrastructure planning: A Case study of Haidian District. Landsc. Arch. 2013, 29, 61–66. [Google Scholar]
  10. Gong, C. Urban Public Space System Planning Based on Green Infrastructure; Southeast University: Dhaka, Bangladesh, 2018. [Google Scholar]
  11. Wu, Y.; Wang, H.; Jin, H.; Pan, X. Research on ecological service evaluation model of urban green infrastructure. Urban Arch. 2018, 33, 31–34. [Google Scholar]
  12. Wang, Y.; Shen, J.; Peng, Z.; Xiang, W. Ecosystem service optimization of green infrastructure for urban growth. Chin. Chin. Gard. 2018, 34, 45–49. [Google Scholar]
  13. Tan, C. Assessment of Additional Demand for Urban Ecosystem Services from the Perspective of Green Infrastructure; Huazhong Agricultural University: Wuhan, China, 2019. [Google Scholar]
  14. Li, C. Ecohydrology and good urban design for urban storm water-logging in Beijing, China. Ecohydrol. Hydrobiol. 2012, 12, 287–300. [Google Scholar] [CrossRef]
  15. Nowak, D.J.; Crane, D.E.; Stevens, J.C. Air pollution removal by urban trees and shrubs in the United States. Urban For. Urban Green. 2006, 4, 115–123. [Google Scholar] [CrossRef]
  16. Berry, R.; Livesley, S.J.; Aye, L. Tree canopy shade impacts on solar irradiance received by building walls and their surface temperature. Build. Environ. 2013, 69, 91–100. [Google Scholar] [CrossRef]
  17. Zhang, J. Green infrastructure: A systematic approach to solve urban spatial and environmental problems. Mod. Urban Res. 2009, 24, 81–86. [Google Scholar]
  18. Huang, P.; Lou, G. Green infrastructure function and evaluation system. Coop. Econ. Sci. Technol. 2020, 44–45. [Google Scholar]
  19. Yang, J. Evaluation of Green Infrastructure Based on Ecosystem Service Value; Huazhong University of Science and Technology: Wuhan, China, 2017. [Google Scholar]
  20. Jia, X.; Dai, F. Research progress of green infrastructure in China. Landsc. Arch. 2015, 118–124. [Google Scholar]
  21. Lafortezza, R.; Davies, C.; Sanesi, G.; Konijnendijk, C.C. Green Infrastructure as a tool to support spatial planning in European urban regions. iforest-Biogeosci. For. 2013, 6, 102–108. [Google Scholar] [CrossRef]
  22. Beichler, S.A. Exploring the link between supply and demand of Cultural ecosystem services-Towards an integrated vulnerability assessment. Int. J. Biodivers. Sci. Ecosyst. Serv. Manag. 2015, 11, 250–263. [Google Scholar] [CrossRef]
  23. Prudencio, L.; Null, S.E. Stormwater management and ecosystem services: A review. Environ. Res. Lett. 2018, 13, 33002. [Google Scholar] [CrossRef]
  24. Jiang, L.; Ying, J.; Xu, J. Urban stormwater Management Based on Green Infrastructure Theory: A case study of New York City, USA. China Urban For. 2012, 10, 59–62. [Google Scholar]
  25. Guo, X.; Xu, J.; Lv, X. Influence of spatial configuration of urban typical underlying surface on precipitation infiltration rate. J. Soil Water Conserv. 2007, 60–66. [Google Scholar]
  26. Ding, W.; Jia, Z.; Shi, Z.; Shi, X. Effect and mechanism of road green space on PM2.5 and other particulate matter. J. Jian Agric. For. Univ. (Nat. Sci. Ed.) 2018, 47, 729–735. [Google Scholar]
  27. Demuzere, M.; Orru, K.; Heidrich, O.; Bhave, A.B.; Mittal, M.; Feliu, E.; Faehnle, F. Mitigating and adapting to climate change: Multi-functional and multi-scale assessment of green urban infrastructure. J. Environ. Manag. 2014, 146, 107–115. [Google Scholar] [CrossRef] [PubMed]
  28. Ying, J.; Yao, W.; Cheng, Y.; Sun, L. Quantitative analysis of coordination relationship between climate and green infrastructure in Hangzhou based on coupling model. Chin. Landsc. Arch. 2017, 33, 53–57. [Google Scholar]
  29. Susca, T.; Gaffin, S.R.; Dell ‘Osso, G.R. Positive Effects of vegetation: Urban heat island and green roofs. Environ. Pollut. 2011, 159, 2119–2126. [Google Scholar] [CrossRef]
  30. Di Leo, N.; Escobedo, F.J.; Dubbeling, M. The role of urban green infrastructure in mitigating land surface temperature in Bobo-Dioulasso, Burkina Faso. Environ. Dev. Sustain. 2016, 18, 373–392. [Google Scholar] [CrossRef]
  31. Nieuwenhuijsen, M.J. Green infrastructure and health. Annu. Rev. Public Health 2021, 42, 317–328. [Google Scholar] [CrossRef]
  32. Wang, Z.; Zhang, S.; Zhang, Y.; Zhang, J. The spillover effect of urban green space on residential land price: A case study of 51 cities with excellent green space construction. J. Arid Land Resour. Environ. 2016, 30, 24–29. [Google Scholar]
  33. Zhu, L.; Huang, L. Analysis of geographical location factors affecting the spatial distribution of cultural and creative Industry Parks: A Case study of Shanghai. Mod. Urban Res. 2019, 1, 37–41. [Google Scholar]
  34. Li, H. Comprehensive Analysis of Influencing Factors of Urban Tourism Attraction: An empirical study based on Panel data. J. Guangxi Univ. Natl. (Philos. Soc. Sci. Ed.) 2011, 33, 145–150. [Google Scholar]
  35. Wang, Y. The Research of Green Infrastructure Implementation System and Stakeholders Participation Mechanism. ICCREM 2017, 364–369. [Google Scholar]
  36. Maas, J.; Verheij, R.A.; Groenewegen, P.P.; De Vries, S.; Spreeuwenberg, P. Green space, urbanity, and health: How strong is the relation? Epidemol. Community Health 2006, 60, 587–592. [Google Scholar] [CrossRef]
  37. Markevych, I.; Schoierer, J.; Hartig, T.; Chudnovsky, A.; Hystad, P.; Dzhambov, A.M.; de Vries, S.; Triguero-Mas, M.; Brauer, M.; Nieuwenhuijsen, M.J.; et al. Exploring pathways linking greenspace to health: Theoretical and methodological guidance. Environ. Res. 2017, 158, 301–317. [Google Scholar] [CrossRef]
  38. Bowen, K.J.; Lynch, Y. The public health benefits of green infrastructure: The potential of economic framing for enhanced decision-making. Curr. Opin. Environ. Sustain. 2017, 25, 90–95. [Google Scholar] [CrossRef]
  39. Lv, Y. Evaluation of agricultural multifunctional value based on multi-dimensional evaluation model. Econ. Geogr. 2008, 28, 650–655. [Google Scholar]
  40. He, L.; Min, W.; Zhang, D. Agricultural multi-functional and multi-dimensional evaluation model and its application: A case study of Qingtian County, Zhejiang Province. Resour. Sci. 2010, 32, 1057–1064. [Google Scholar]
  41. Li, M.; Zhou, Z. Research on multi-functional development model of urban agriculture based on multi-dimensional evaluation model. Chin. J. Eco-Agric. 2016, 24, 1275–1284. [Google Scholar]
  42. Mullaney, J.; Lucke, T.; Trueman, S.J. A review of benefits and challenges in growing street trees in paved urban environments. Landsc. Urban Plan. J. 2015, 134, 157–166. [Google Scholar] [CrossRef]
  43. Van Den Berg, A.; Maas, J.; Verheij, R.; Groenewegen, P. Green space as a buffer between stressful life events and health. Soc. Sci. Med. 2010, 70, 1203–1210. [Google Scholar] [CrossRef]
  44. Jiang, B.; Chang, C.Y.; Sullivan, W.C. A dose of nature: Tree cover, stress reduction, and gender Differences. Landsc. Urban Plan. 2014, 132, 26–36. [Google Scholar] [CrossRef]
  45. European Commission. Green infrastructure (GI)—Enhancing Europe’s natural capital. Communication from the Commission to the European Parliament, the Council, the European Economic and Social Committee and the Committee of the Regions; European Commission: Brussels, Belgium, 2013. [Google Scholar]
  46. Zhang, Z.; Zhang, L. Effects of green infrastructure on atmospheric particulate matter in urban built environment. China Urban For. 2021, 19, 1–5. [Google Scholar]
  47. Ning, L.; Xiao, Y.; Liu, J.; Cui, R. Evaluation and Demonstration of cross-administrative innovation policy source Capacity: Based on entropy weight method, TOPSIS method and grey correlation analysis. Sci. Technol. Manag. Res. 2021, 41, 44–51. [Google Scholar]
  48. Yang, R.; Liu, Y.; Guo, L.; Li, Y. Spatial-temporal variation and coupling relationship between rural hollowing degree and cultivated land use intensity in Bohai Rim region. Prog. Geogr. 2013, 32, 181–190. [Google Scholar]
  49. Fu, W.; Chu, L. Research on the Evaluation of High Quality Development of Manufacturing Industry from the Perspective of Yangtze River Delta Integration-TOPSIS evaluation model based on the improved CRITIC-entropy weight method combined weight. Ind. Technol. Econ. 2020, 39, 145–152. [Google Scholar]
  50. Zhang, X. Theory of sustainable development: Conceptual evolution, dimensions and prospects. Bull. Chin. Acad. Sci. 2018, 33, 10–19. [Google Scholar]
Figure 1. The changing trend of the evaluation results at multi-functional development level of green infrastructure in various provinces of China.
Land 11 01603 g001
Table 1. Multi-function evaluation index system of green infrastructure.
Objective LevelFunctional IndicatorsIndex Connotation and Calculation Method Weight   ( w j ) Efficiency
Economic FunctionInvestment in urban environmental infrastructure r 11 Investment in environmental infrastructure construction in regional cities and towns0.0793+
Per capita GDP r 12 Total regional output/total regional population0.0883+
Per capita wage of persons employed in water conservancy, environment management, and public facilities management r 13 Total wage of employed persons/average number of employed persons0.0810+
Domestic tourism r 14 Related expenses incurred by domestic tourists during travel and sightseeing in the region0.0714+
Number of domestic visitors r 15 Number of trips by domestic tourists0.0795+
Social FunctionValue of employment in water, environment, and public facilities management r 21 Persons employed in water conservancy, environment management, and public facilities management * Per capita wage of persons employed0.0752+
Level of the employment structure in water conservancy, environment management, and public facilities management r 22 Number of persons employed in water conservancy, environment management, and public facilities management/total number of persons employed0.0765+
Natural growth rate r 23 Urban population/total population0.0232+
Population density r 24 Population/area0.0336-
Death rate r 25 Annual number of deaths/annual average0.0307-
Natural growth rate r 26 (Annual number of births/annual number of deaths)/annual average0.0282+
Ecological FunctionGreen coverage rate of built districts r 31 Green coverage area/built districts0.0414+
Green space rate of built districts r 32 Built-up area green area/built districts0.0174+
Public recreational green space per capita r 33 Total area of green space in regional parks/total population of the region0.0330+
Forest coverage rate r 34 Area of woodland/area of land0.0614+
Cultivated−land coverage rate r 35 Area of cultivated land/area of land0.0586+
Annual average Concentration of PM2.5 r 36 Arithmetic mean of the mean daily concentration of fine particle content in a year0.0444-
Proportion of days with good ambient air quality in built districts r 37 Days with good ambient air quality in built districts/total days0.0295+
Urban environment noise average noise level r 38 Evaluation index of noise in the urban area0.0308-
Urban water supply penetration rate r 39 Urban water population/total urban population0.0165+
“+” refers to positive effect index, “-” refers to negative effect index.
Table 2. Evaluation results of multi-functional development level of green infrastructure in various provinces.
ProvinceEconomic FunctionRankingSocial FunctionRankingEcological FunctionRanking
Beijing0.611830.566810.504518
Tianjin0.3993180.2892280.338229
Hebei0.4006160.3597120.452322
Shanxi0.2686210.2921260.438724
Inner Mongolia0.2304240.3401170.460521
Liaoning0.2488230.3183250.540411
Jilin0.1578280.3554150.58324
Heilongjiang0.1333290.2777300.56739
Shanghai0.4940110.451250.382627
Jiangsu0.719310.449060.506617
Zhejiang0.685320.456340.58096
Anhui0.4005170.3286210.538712
Fujian0.581040.3396190.58842
Jiangxi0.4349130.2801290.60871
Shandong0.539650.446270.498019
Henan0.5043100.3610110.507816
Hubei0.4515120.3513160.514615
Hunan0.519560.3255230.518214
Guangdong0.519470.525130.525513
Guangxi0.510980.3400180.56798
Hainan0.1065310.538620.57847
Chongqing0.3073200.2590310.58315
Sichuan0.505890.3562140.466520
Guizhou0.4149150.3263220.58553
Yunnan0.4215140.3572130.566010
Tibet0.1327300.3345200.384726
Shaanxi0.3355190.3611100.415025
Gansu0.1868250.2904270.376128
Qinghai0.1797260.3214240.306630
Ningxia0.1626270.389780.448723
Xinjiang0.2674220.385190.280931
Table 3. Mean value of green infrastructure economic function evaluation index in different regions.
DistrictInvestment in Urban Environmental Infrastructure r 11 Per Capita GDP r 12 Per capita Wage of Persons Employed in Water Conservancy, Environment Management, and Public Facilities Management r 13 Domestic Tourism r 14 Number of Domestic Visitors r 15
North China2,226,62387,53169,876264223,239
Northeastern China846,04950,76944,058229019,909
East China3,436,96096,55568,072578245,658
Central China3,104,99964,25860,885581256,026
Southern China2,789,29262,55061,407421931,705
Southwest China1,573,34257,37762,361415033,944
Northwest China1,028,40252,24560,664166016,970
Table 4. Mean value of green infrastructure social function evaluation index in different regions.
DistrictValue of Employment in Water Conservancy, Environment Management, and Public Facilities Management r 21 Level of the Employment Structure in Water Conservancy, Environment Management, and Public Facilities Management r 22 Natural Growth Rate r 23 Population Density r 24 Death Rate r 25 Natural Growth Rate r 26
North China51.860.01570.724729470.00590.0022
Northeastern China30.360.02000.668030610.0092−0.0058
East China72.420.01300.693529240.00680.0043
Central China65.410.01510.590338160.00760.0011
Southern China73.210.02250.628728380.00880.0068
Southwest China33.200.01400.530224420.00700.0043
Northwest China26.540.01930.592936680.00610.0052
Table 5. Mean value of green infrastructure ecological function evaluation index in different regions.
DistrictGreen Coverage Rate of Built Districts r 31 Green Space Rate of Built Districts r 32 Public Recreational Green Space Per Capita r 33 Forest Coverage Rate r 34 Cultivated-Land Coverage Rate r 35
North China0.42680.378314.980.25040.1994
Northeastern China0.39670.230613.040.41500.3713
East China0.37300.35799.050.14040.2571
Central China0.41500.325413.470.37810.2926
Southern China0.41800.319314.200.57020.1294
Southwest China0.41020.351614.450.38420.1344
Northwest China0.39180.300415.090.15540.0990
Table 6. Mean value of green infrastructure ecological function evaluation index in different regions.
DistrictAnnual Average Concentration of PM2.5 r 36 Proportion of Days with Good Ambient Air Quality in Built Districts r 37 Urban Environment Noise Average Noise Level r 38 Urban Water Supply Penetration Rate r 39
North China420.731253.40.9950
Northeastern China330.887754.10.9810
East China320.872054.91.0000
Central China400.824153.70.9890
Southern China240.975755.00.9873
Southwest China250.958753.40.9775
Northwest China360.860453.80.9862
Table 7. Multi-functional development mode of green infrastructure in China.
Development ModelExplanatory ChartDistrict
Ecological development model Land 11 01603 i001Guizhou (0.4149, 0.3263, and 0.5855)
Ecological society priority and economic lag development mode Land 11 01603 i002Hainan (0.1065, 0.5386, and 0.5784)
Multi-functional weak collaborative development mode Land 11 01603 i003Shanxi (0.2686, 0.2921, and 0.4387), Inner Mongolia (0.2304, 0.3401, and 0.4605), Tibet (0.1327, 0.3345, and 0.3847), Gansu (0.1868, 0.2904, and 0.3761), Qinghai (0.1797, 0.3214, and 0.3066), Ningxia (0.1626, 0.3897, and 0.4487), and Xinjiang (0.2674, 0.3851, and 0.2809)
Multi-functional basic collaborative development mode Land 11 01603 i004Tianjin (0.3993, 0.2892, and 0.3382), Hebei (0.4006, 0.3597, and 0.4523), Anhui (0.4005, 0.3286, and 0.5387), Shandong (0.5396, 0.4462, and 0.4980), Henan (0.5043, 0.3610, and 0.5078), Hubei (0.4515, 0.3513, and 0.5146), Hunan (0.5195, 0.3255, and 0.5182), Sichuan (0.5058, 0.3562, and 0.4665), Yunnan (0.4215, 0.3572, and 0.5660), and Shaanxi (0.3355, 0.3611, and 0.4150)
Multi-functional strong collaborative development mode Land 11 01603 i005Zhejiang (0.6853, 0.4563, and 0.5809), Guangdong (0.5194, 0.5251, and 0.5255)
Ecological priority economic lag development mode Land 11 01603 i006Liaoning (0.2488, 0.3183, and 0.5404), Jilin (0.1578, 0.3554, and 0.5832), and Heilongjiang (0.1333, 0.2777, and 0.5673)
Economic and social development model Land 11 01603 i007Beijing (0.6118, 0.5668, and 0.5045), Shanghai (0.4940, 0.4512, and 0.3826), and Jiangsu (0.7193, 0.4490, and 0.5066)
Ecological economy leading development mode Land 11 01603 i008Fujian (0.5810, 0.3396, and 0.5884), Guangxi (0.5109, 0.3400, and 0.5679)
Ecological priority social lag development model Land 11 01603 i009Jiangxi (0.4349, 0.2801, and 0.6087), Chongqing (0.3073, 0.2590, and 0.5831)
Publisher’s Note: MDPI stays neutral with regard to jurisdictional claims in published maps and institutional affiliations.

