Article

How Do High-Speed Railways Facilitate High-Quality Urban Development: Evidence from China

School of Business, Sichuan University, Chengdu 610064, China
*
Author to whom correspondence should be addressed.
Land 2022, 11(9), 1596; https://doi.org/10.3390/land11091596
Submission received: 23 August 2022 / Revised: 12 September 2022 / Accepted: 13 September 2022 / Published: 17 September 2022

Abstract

:
In 2017, China released the statement of High-Quality Development in response to the sustainable development goals proposed by the United Nations. As the spatial carriers of human economic, social, and cultural development, cities should be updated in order to enter a new period of high-quality urban development. In this paper, we use a multi-period DID model, consider the opening of high-speed railways as a quasi-natural experiment, and use the panel data of 285 prefecture-level and above cities in China from 2007 to 2020 to empirically analyze the effect of high-speed railway (HSR) opening on urban development quality and explore its transmission mechanism. The empirical results find that the HSR opening can significantly promote the level of high-quality urban development. The results remain the same after robustness tests such as PSM-DID and placebo tests. The study mechanism suggests that the HSR opening can significantly improve the quality of urban development through a population agglomeration effect, while capital agglomeration has a masking effect between the HSR opening and high-quality urban development. Further results show that there is heterogeneity in the impact of HSR opening on the high-quality development of cities in different regions and sizes, in which the boosting effect of HSR opening on the development quality of cities in eastern and western regions is more significant compared to cities in central regions; the boosting effect of HSR opening on the high-quality development level of medium-sized cities is stronger.

1. Introduction

With the continuous development of the economy and society, China’s infrastructure has also been continuously improved in recent years. Among them, the rapid development of high-speed rail (HSR) as a category of important transportation infrastructure in China is particularly remarkable. By the end of 2021, China’s high-speed rail operating mileage had exceeded 40,000 km, ranking first in the world, and China’s total railroad operating mileage exceeded 150,000 km, ranking second in the world [1]. The construction of high-speed rail has enabled China’s economy to find a new growth point at a time when the world economy is growing sluggishly, opening the way for a new round of counter-trend upward development.
It is worth noting that while the HSR opening has brought huge economic growth effects to China, more and more scholars have started to pay attention to the negative externalities of the HSR opening, and studies have shown that high-grade cities may have a siphon absorption effect on neighboring cities [2,3,4]. In addition, the transition of China’s economy from a high-speed growth to a high-quality development stage also puts forward new requirements for the development of high-speed rail. High-quality development refers to an effective and sustainable way to meet the growing needs of society [5], based on the five major development concepts of innovation, coordination, green, openness, and sharing, and to achieve efficient economic and social operations. Since the concept of high-quality development was proposed, scholars have conducted multiple studies around its perspectives, themes, and evaluation criteria. In terms of research perspectives, existing studies have mainly been conducted from macro and micro perspectives, based on micro-level studies including the analysis of high-quality development of enterprises [6,7], tourism [8,9], and logistics [10], while macro studies have focused on the current situation of regional high-quality development [11,12]. In terms of research themes, scholars have studied high-quality development from the themes of economic development [13,14,15], environmental pollution [16,17,18], technological innovation and diffusion [19,20,21], and population mobility and changing spatial patterns [22,23]. In terms of evaluation criteria, some scholars tend to construct a multi-dimensional comprehensive evaluation index system that includes economic growth, innovation dynamics, resource allocation, regional coordination, infrastructure, and ecological civilization [6,24], while other scholars prefer to evaluate high-quality development by a single indicator such as total factor productivity [25,26].
The mechanism of the impact of the HSR opening on cities originates from studies on the economic growth effects of transportation infrastructure. On the one hand, some scholars have affirmed the positive economic externalities of HSR through empirical studies, which can promote the economic growth of cities along the route [27,28,29]. On the other hand, there are also empirical research results indicating that the HSR opening fails to promote the economic growth of cities along the route in the short term but accelerates their economic diffusion or makes cities become peripheral cities [15,30]. In addition, scholars’ studies around transportation infrastructure and cities have mostly focused on the changes of high-speed rail on spatial patterns, including peripheral housing prices [31,32,33], land use efficiency along the route [34,35], accessibility [36,37,38], and so on.
In summary, this paper uses the HSR opening as a quasi-natural experiment to empirically test the relationship between the opening of high-speed rail and high-quality urban development and to investigate its mechanism of action from the perspective of population agglomeration and capital agglomeration.
The marginal contributions are as follows: first, the research method chooses to make a comprehensive measurement of urban high-quality development and constructs a complete evaluation index system of urban high-quality development from four dimensions: economic, social, environmental, and infrastructure, which is a supplement to the single index to measure urban high-quality development and makes the evaluation of urban high-quality development more objective and specific; second, the study focuses on the impact of the HSR opening on the multifaceted development of the city, compared with previous studies that focused more on the relationship between HSR and economic growth, this paper provides a more comprehensive and objective evaluation of the comprehensive benefits brought by the HSR opening; and third, the research topic is focused on high-quality urban development. With the deepening of the concept of sustainable development and the promotion of carbon emission reduction actions, new requirements have been put forward for high-quality urban development, and this study further enriches and expands the scope and topics of existing high-quality development research.

2. Theoretical Analysis and Research Hypothesis

2.1. The HSR Opening and High-Quality Development

High-quality urban development is an all-round development in many aspects, and the quality of the urban economy, society, ecology, and infrastructure are all important indicators to measure the quality of urban development. The spatial and temporal compression and boundary breakthrough effects generated by the HSR opening break down the barriers to the flow of factors between regions to a certain extent and promote the transfer of talents, technology, production materials, capital, and other factors to a certain degree, which not only reduces the cost of factor flow but also improves the efficiency of social resource allocation and realizes factor agglomeration [39]. High-speed rail makes production factors flow more conveniently to economically developed cities through the agglomeration effect, and at the same time, drives the developing cities through the diffusion effect [14,15].
In addition, some research has shown that the HSR opening meets the travel demand of residents, improves commuting efficiency [40], influences the level of urbanization [41], and has a certain improvement effect on air quality and the ecological environment [42]. It has also been found that the high passenger carrying capacity and speed of rail transport help to alleviate the employment pressure in large cities, causing positive employment impacts [43,44]. The factor clustering brought by the HSR opening is conducive to enhancing the sustainable development of cities and achieving high-quality development. Therefore, the following hypothesis is proposed.
Hypothesis 1 (H1).
The HSR opening helps to promote high-quality urban development.

2.2. The HSR Opening, Population Agglomeration, and High-Quality Development

Human resources are an important element essential to urban construction. The flow and gathering of human resources inject momentum into urban development. High-speed rail has the advantages of high carrying capacity, timeliness, and safety, which greatly promote the cross-regional clustering of human capital. Some scholars believe that the HSR opening will help balance labor mobility [45]. Many highly skilled workers are employed in cities that are not their daily residence, and the HSR opening has greatly reduced commuting time and improved work efficiency [46]. In addition, the HSR opening will change the situation in the labor market, reduce the regional differences in employment, and provide support for urban economic construction [47,48]. The process of population mobility is usually accompanied by the diffusion of tacit knowledge [42]. Human capital is an important element for urban development. Population agglomeration accelerates the spread of new technologies, knowledge and information, which is conducive to strengthening information and technology exchange between advanced regions, achieving interconnection and cooperation, and stimulating the innovative vitality of cities [49,50].
For relatively backward areas, the HSR opening has also triggered a counter-urbanization effect; that is, the phenomenon of urban residents moving to rural areas. A study carried out in Greece showed that young people and the unemployed contributed to the counter-urbanization process in Athens, which created opportunities for rural areas connected to large cities [51]. The HSR opening promotes the mobility of the population, especially highly qualified talents, to share the successful experience, high-end technology, and management insights of advanced regions with the backward ones, promoting the transformation and upgrading of urban industries. High-speed rail improves the accessibility of cities and shortens the spatial and temporal distance between cities through rapid and large-scale transportation across regions, which significantly promotes population mobility and agglomeration. Therefore, the following hypothesis is proposed.
Hypothesis 2 (H2).
The HSR opening drives urban to improve their high-quality development through population agglomeration effect.

2.3. The HSR Opening, Capital Agglomeration, and High-Quality Development

As an important factor of production for economic growth, the amount of capital directly determines the size of the potential for economic growth. Changes in transportation location conditions affect the investment environment of the invested area, which is directly expressed in the concentration of capital factors [52]. First, the HSR opening reduces the time cost between cities, opens new effective channels for communication between regions, facilitates investors’ access to more information, alleviates investors’ concerns, improves investment efficiency, and effectively attracts the influx of external capital. Existing studies suggest that cities along high-speed rail lines attract more investment because of the time-space compression effect brought by high-speed rail [53], and the HSR opening optimizes the allocation of capital factors among enterprises [54].
Secondly, the HSR opening improves the accessibility between cities, making the exchange of resources between large cities and small cities easier and faster, and the gathering of resources itself has the tendency to pursue profit maximization, which drives some enterprises to invest and set up factories in cities with lower production costs and return to large cities for sales, optimizes the industrial division of labor and collaboration between cities; and improves the efficiency of urban resource allocation. Among them, it has been found that the infrastructure investment brought by high-speed rail can effectively guide the flow and agglomeration of capital from developed to backward regions [2]. The HSR opening promotes capital flow, and the capital agglomeration formed by capital flow provides a continuous and stable source of capital for cities to achieve high-quality development, further improving the overall efficiency of capital utilization in the meantime. Therefore, the following hypothesis is proposed.
Hypothesis 3 (H3).
The HSR opening drives urban to achieve high-quality development through the capital agglomeration effect.

3. Data and Methodology

3.1. Models

Due to the differences in the levels of development of different cities before the HSR opening and the differences in many aspects, such as economic development conditions and infrastructure, it is not possible to judge the effect of the HSR opening only by comparing the urban development quality before and after the HSR opening in a city. Therefore, this paper draws on previous research and treats the HSR opening as a ‘quasi-experiment’ by constructing a multi-period DID model to estimate the impact of the HSR opening on urban development quality [55]. The baseline model is set as follows:
Q u d i t = α 0 + β 1 ( d u * d t i t ) + β 2 c o n t r o l s i t + μ i + δ t + ε i t
where i denoted the city, and t denoted the time, Q u d i t denoted the level of quality development of i city in t year; du*dt denoted the dependent variable, the HSR opening; β1 denoted the actual effect of the HSR opening on the quality of urban development; and c o n t r o l s i t   is a set of selected control variables. μ i and δ t are city and year-fixed effects and ε i t are random disturbance terms.

3.2. Description of Variables and Data

3.2.1. Dependent Variables

High-quality urban development (Qud). This paper refers to Xiao and Li [56,57]. Implementing the development concepts of innovation, coordination, green, openness, and sharing, the high-quality urban development guideline level indexes are constructed from four aspects: economic, social, ecological, and infrastructural indexes, which are then refined into 12 basic indexes, including the industrial output value above designated size, to jointly build a comprehensive evaluation index system of urban development quality. Given the existence of both positive and negative indexes in the selected indexes, the inverse indexes are first converged by taking the inverse of the indexes, and then the basic indexes are dimensionless. Each dimensional index is shown in Table 1.
By using the entropy value method for calculation, it was found that the difference in the weights of each index was extremely small. The weight of the ecological and environmental efficiency index is 0.2627, which is the highest among the four guideline level indexes, which also proves that green development has become an important part of improving the quality of urban development.

3.2.2. Independent Variables

The HSR opening (du*dt), measures whether different prefecture-level cities have opened high-speed rail in different years. In this paper, a multi-period DID model is used for empirical testing, so the between-group dummy variable is set d u , which takes the value of 1 if the city is open to HSR and 0 if the city is not open to HSR. The dummy variable d t is set to 0 for cities before the HSR opening and 1 for cities after the HSR opening. d u * d t is the interaction term, and its coefficient demonstrates the difference in the impact of HSR opening on the quality of urban development between the treatment and control groups. Considering the fact that the HSR opening in some cities is at the end of the year and the expected impact of HSR opening, this paper draws on Qin [2] and uses June 30 as the cut-off date. With June 30 as the dividing line, high-speed trains opened in the first half of the year are defined as those opened in the current year, while those opened in the second half of the year are considered those opened in the next year.

3.2.3. Control Variables

Referring to the existing literature [58,59,60,61], the following seven variables are selected as control variables affecting the quality of urban development in this paper. The level of economic development (Edl), economic development is an important dimension of urban development and has an important role in promoting the ecological environment and spatial structure of cities, measured by the logarithm of urban GDP per capita. The level of foreign investment (Fil), foreign direct investment is one of the main forces to promote China’s economic development and can effectively promote the transformation and upgrading of industrial structures, measured by the logarithm of the actual utilization of foreign investment. The level of government expenditure (Gi) and the arrangement of various systems of urban finance play a great role in urban development, measured by the proportion of regional financial expenditure to regional GDP. Educational input (Ei), education is an important livelihood project, providing talents, science and technology, and intellectual support for urban society to achieve high-quality development, measured by the logarithm of the city’s education input for the year. The road occupancy rate per capita (Roc) reflects the accessibility of the city. The more convenient the transportation, the higher the accessibility, and the more conducive to the flow of economic factors, is measured by taking the logarithm of the road area per capita. Urbanization (Url), the degree of urbanization directly affects the development potential of cities, measured by the proportion of the total population of the municipal district to the total population of the city. The level of technological innovation (Ti), technological innovation helps to solve the challenges encountered in the process of urban development and helps to achieve high-quality urban development and is measured by the number of patents granted.

3.3. Data Sources and Descriptive Statistics of Key Variables

In this paper, the data of 285 cities at the prefecture level and above are used as the research sample. The data relating to urban development quality indicators of prefecture-level cities and municipalities directly under the central government are primarily obtained from the China City Statistical Yearbook and the China Statistical Yearbook from 2007 to 2020, and their data on the opening time of high-speed rail are primarily obtained from the websites of China Railway Corporation and the State Railway Bureau. Some missing data were made up by the statistical bulletin data of each city or the mean method. The descriptive statistics for each variable selected in this paper are shown in Table 2.

4. Analysis of the Empirical Results

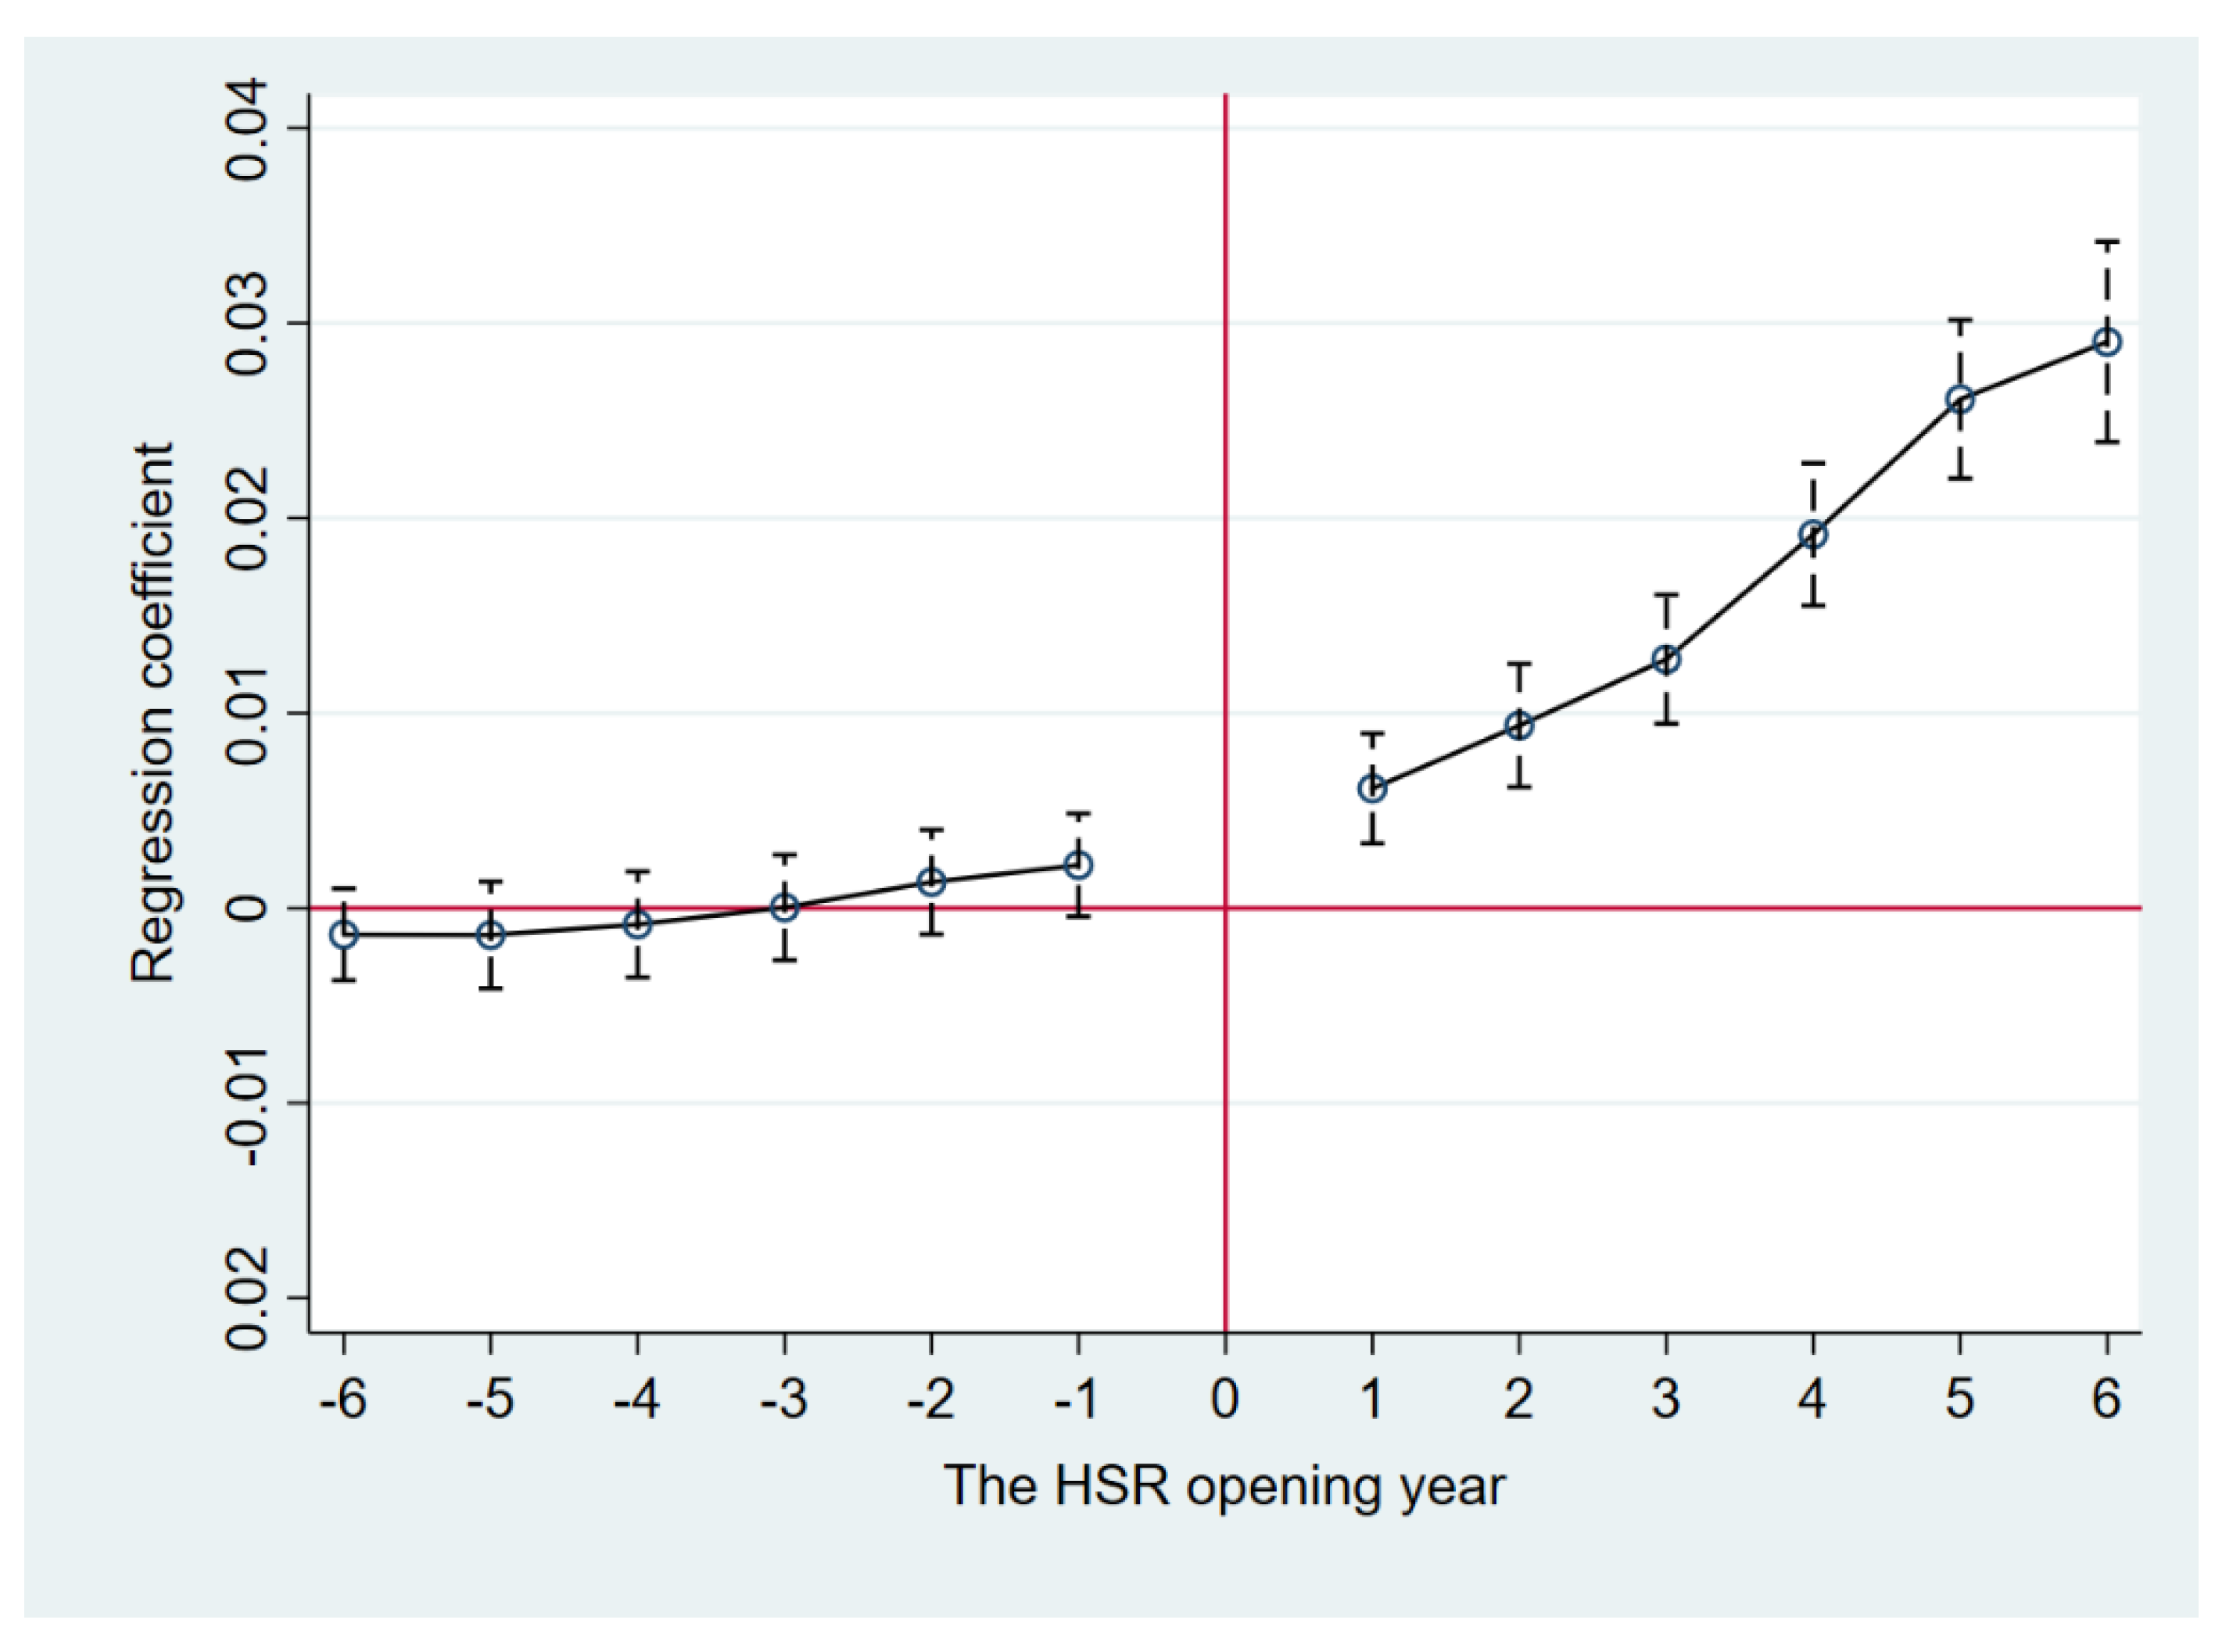
4.1. Parallel Trend Test

Parallel trend hypothesis testing is an important prerequisite for the development of multi-period DID models. Figure 1 plots the parallel trend test for the high-quality urban development level. In addition, it shows the magnitude of the estimated coefficient of high-quality development level and its confidence interval at the 95% level. Where the vertical coordinates indicate the estimated coefficient values of the high-quality urban development level in different years, and the horizontal coordinates indicate the time interval before and after the year of the HSR opening. As can be seen from Figure 1, the coefficients of regression coefficients of high-quality urban development level do not show a certain regularity in the six periods before the treatment, and the coefficient values are not significantly different from zero. This proves that the stationary trend assumption is valid.

4.2. Analysis of Baseline Regression Results

This paper uses the Hausman test to show that the empirical regressions should be selected using a fixed effects model and considers two-way fixed effects for year and city, with the empirical results shown in Table 3. Models 1–7 are the baseline regression results with the gradual inclusion of control variables. It is worth noting that the regression coefficients of the high-speed railway opening (du*dt) and high-quality urban development both pass the test at the 1% significance level, and the results are independent of whether control variables are included or not, and both are positively significant, which initially indicates that the HSR opening can effectively promote the development of urban areas. Using the empirical regression results of model (8) as the main reference to look at the relevant control variables, the regression coefficient of the HSR opening (du*dt) and high-quality urban development is 0.079, which is significantly positive at the 1% test level. Hypothesis H1 has been verified; that is, the HSR opening can effectively promote the improvement of high-quality urban development.

4.3. Robustness Tests

4.3.1. PSM-DID Test

Whether or not a city opens to high-speed rail may be influenced by a variety of factors and is not completely randomly determined. In order to reduce systematic differences in the sample selection process and reduce the estimation error of the multi-period double difference model, a double difference propensity to match score method (PSM-DID) was used to screen the samples of the experimental and control groups, followed by a multi-period DID regression, in order to reduce the endogeneity problem arising from the selection bias. Specifically, all control variables were selected as covariates for sample matching, and the matched samples were subjected to multi-period DID regression using nearest neighbor matching, kernel matching, and radius matching. The regression results for the associated PSM-DID are given in columns 1–3 of Table 4. The regression results show that the values of the estimated coefficients are significant at least at the 10% level, indicating that the baseline regression results of the article are highly robust.

4.3.2. Data Filtering and Variable Lagging by One Period
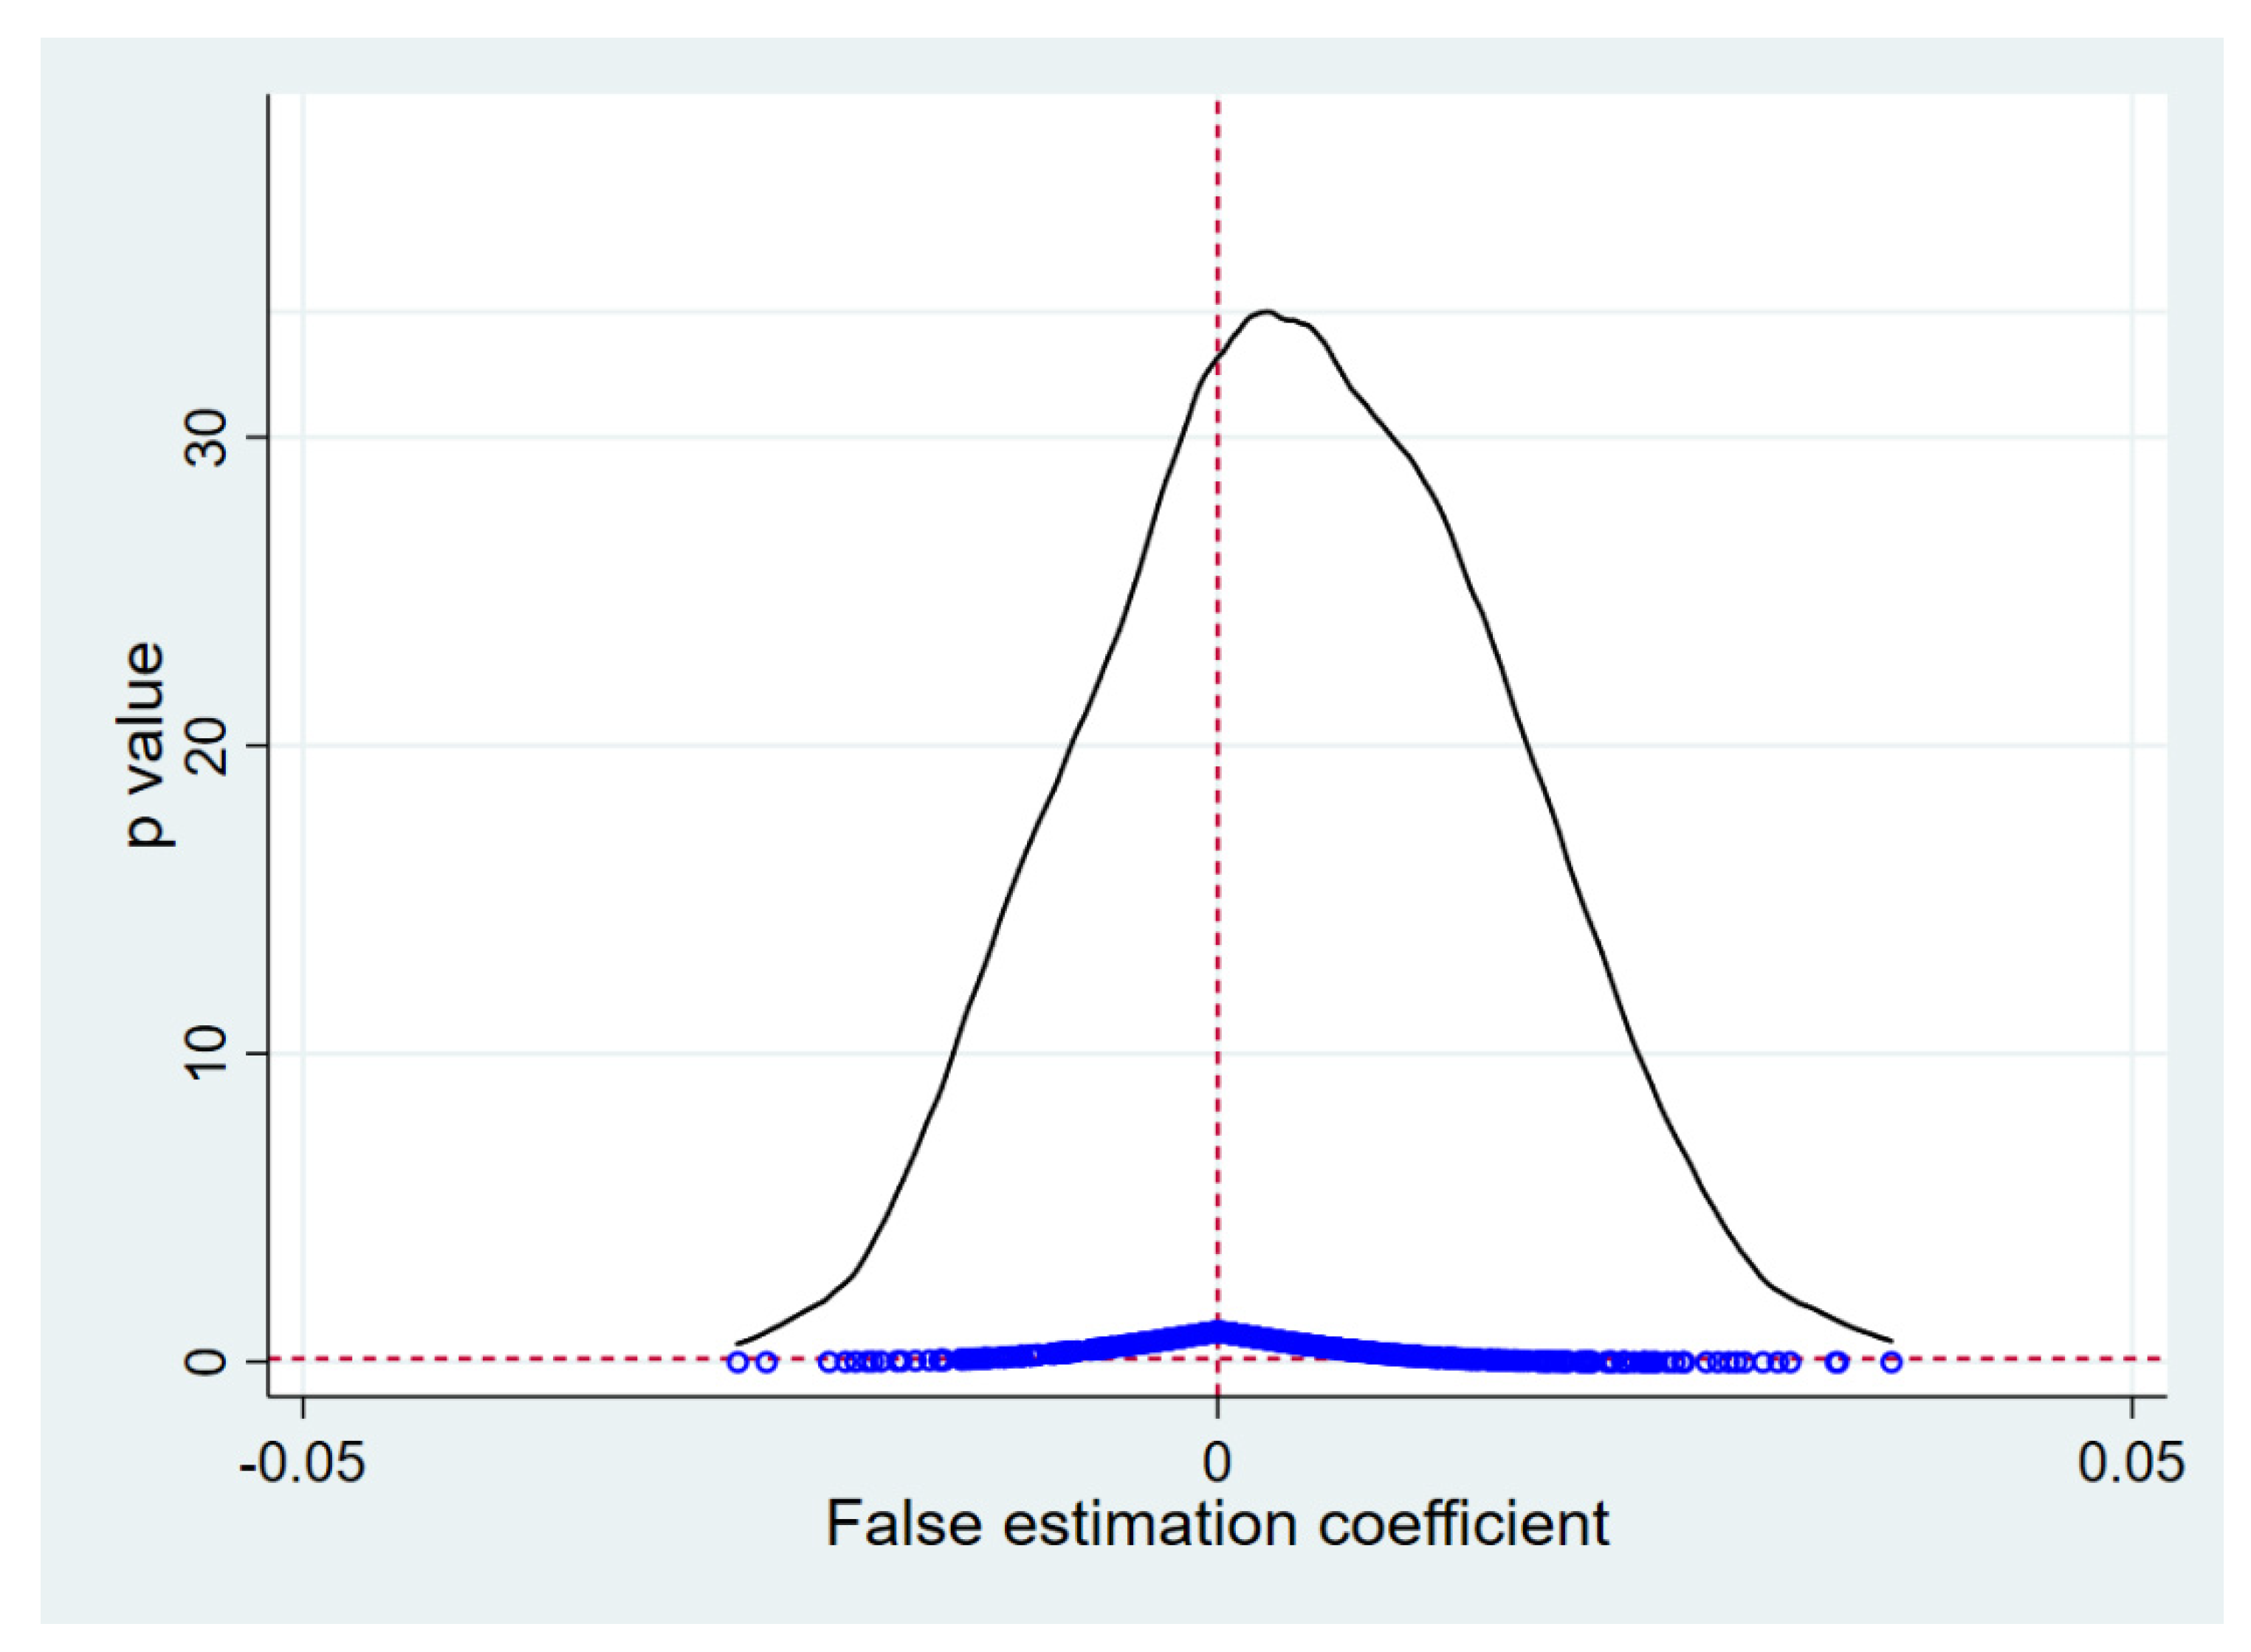
In this paper, the sample data were processed by breaking the tails by 1% and shrinking the tails by 1% to reduce the impact of the sample outliers on the baseline regression results. The results after re-running the baseline regression are shown in columns 4 and 5 of Table 4. The results show that the main effects regression coefficients are all significantly positive at the 1% level, indicating that the baseline regression results of this paper are robust. In addition, considering that the impact of the HSR opening on urban development quality cannot be fully reflected in the current year, there is a lag. In this paper drawing on Liu and Zhang [62], the dependent variable is lagged by one period and re-run as an empirical regression, and the results are shown in column 6 of Table 4. The estimated coefficient from the main effects regression is still positive and significant at the 1% test level, demonstrating that the baseline regression results in this paper remain robust.

4.3.3. Placebo Test

To explore the extent to which omitted variables and random factors affect the results of the baseline regression, this paper draws on Li, Lu et al. [63]. A randomized experiment of cities opening high-speed rail was constructed by randomly generating the time of cities’ opening high-speed rail. Secondly, the main effects regression is performed on the constructed dummy experiment data, and this random trial process is repeated 500 times, resulting in a kernel density estimation distribution of the estimated coefficients and p-values for the pseudo-cities (see Figure 2). In the figure, the solid line represents the pseudo-urban estimated coefficient value, and the horizontal dashed line is the standard line for a p-value of 0.1. A scatter point that lies below the dashed line at p = 0.1 represents a regression coefficient significant at least at the 10% level. As shown, the pseudo-city estimates and p-values are evenly distributed around 0, and the vast majority of scatter points lie above the p = 0.1 standard line, demonstrating that most of the pseudo-city estimates are insignificant and that the effect of other unobserved factors on the net effect of the HSR opening on high-quality urban development can be ignored.

4.4. Analysis of Impact Mechanisms

Based on the empirical analysis in the previous paper, which has demonstrated that the HSR opening significantly contributes to high-quality urban development, this part of the paper focuses on whether the HSR opening contributes to the high-quality of urban development through the agglomeration effect from the perspective of population agglomeration (Pa) and capital agglomeration (Ca). This paper uses the mediation effect model for verification, which draws on Baron and Kenny [64], and the model is shown below:
Y i t = a 0 + a 1 ( d u * d t ) i t + i = 1 N a j c o n t r o l s i t + μ i + δ t   + ε i t                    
            M i t   =   b 0 + b 1 ( d u * d t ) i t + i = 1 N b j c o n t r o l s i t + μ i + δ t + ε i t  
  Y i t = c 0 + c 1 ( d u * d t ) i t + c 2 M i t + i = 1 N c j c o n t r o l s i t + μ i + δ t + ε i t
Equation (2) represents the impact of the HSR opening on high-quality urban development; Equation (3) is the impact of the HSR opening on the mediating variables, Mit, including population agglomeration (Pa) and capital agglomeration (Ca); and Equation (4) is used to verify whether the HSR opening has an impact on high-quality urban development through Mit.
Table 5 reports the results of the tests of the mediating effects of the HSR opening on high-quality urban development. Among them, columns 1 to 3 show the results of the test for the mechanical effect of population agglomeration. It can be seen that the regression coefficients of the HSR opening and population agglomeration on high-quality urban development are both significantly positive at the 1% test level, indicating that the HSR opening accelerates the movement of the population between cities, which is conducive to the agglomeration of human capital and provides labor for urban development, i.e., the HSR opening can promote the quality of urban development through the population agglomeration effect and the theoretical hypothesis H2 is verified. Calculating the mediating effect of population agglomeration accounts for about 0.024 of the total effect.
Columns 1 and 4 to 5 show the results of the test for the mechanical effect of capital agglomeration. It can be seen that the regression coefficients of the HSR opening and capital agglomeration on high-quality urban development are also both significant at the 1% test level, while it is further found that b1c2 and c1 have the opposite sign. The theoretical hypothesis H3 is partially verified by the fact that capital agglomeration has a “masking effect” between the HSR opening and high-quality urban development.

4.5. Heterogeneity Analysis

The empirical analysis in the previous section demonstrates that the HSR opening has a catalytic effect on high-quality urban development, but as different cities have their own differences, the effect of the HSR opening on their development may subsequently vary to a certain extent, so this paper further analyses the heterogeneity of cities of different regions and sizes.
Given the vast area of China, the differences in economic and social development between different regions, and the fact that China’s high-speed rail network is “relatively dense in the eastern coastal and central regions and sparse in the western regions”, this paper draws on the study by Xiao et al. and divides the sample cities into three regions according to their geographical location: eastern cities, central cities, and western cities [56]. The results are shown in columns 1–3 of Table 6. After controlling for time and city effects, the estimated coefficients of the regressions for both eastern and western cities are found to be significantly positive at the 1% test level, and the coefficient of impact for eastern cities is slightly higher than that for western cities, but the impact on central cities is not significant, indicating that the HSR opening has only contributed to improving the quality of urban development in the eastern and western regions but not in central cities.
Relying on the good development foundation and advanced technology elements, the eastern region, combined with the huge effect brought by the opening of high-speed rail, further attracts more talents and capital to achieve high-quality urban development. The western region, on the other hand, due to its late start in development and relatively backward economy, coupled with fewer high-speed rail lines, the effect of the HSR opening on high-quality development of its cities is less than that of the eastern cities. The central cities are located in the middle of the eastern and western cities, and the HSR opening affects the gathering or diffusion of the local population, capital, and other factors and influences the comprehensive development of the city through the combination of “polarization effect” and “diffusion effect”, so the impact of the HSR opening on high-quality development of the central cities is relatively small.
Furthermore, this paper classifies the sample cities at the city size level according to their population size in accordance with the Notice on Adjusting the Criteria for City Size Classification issued by the State Council in 2014. Those with an urban resident population of 500,000 or more and less than 1 million are classified as medium-sized cities. Those with a resident population of 1 million or more and less than 5 million are classified as large cities, and those with a resident population of 5 million or more and less than 10 million are classified as mega cities. The regression results of the sample classification are shown in columns 4 and 5 of Table 6.
As shown by the results in Table 6, the smaller the size of the city, the greater the boost to the high-quality urban development from the HSR opening. Compared to large cities, medium-sized cities have fewer ways to communicate and cooperate with the outside world due to their population base and degree of economic development, and they rely heavily on railway transport for the concentration of factors. The opening of high-speed rail brings a greater impact, more able to stimulate the momentum of high-quality development of the city. The larger the city, the more ways it has to learn and collaborate with the outside world, but railway transport, although efficient and convenient, is only one of the channels. Therefore, the HSR opening has a more profound impact on the realization of high-quality development in medium-sized cities.

5. Conclusions

Based on a panel of 285 prefecture-level cities and above in China from 2007 to 2020, this paper explores the impact and mechanism of the HSR opening on high-quality urban development using a double difference model and a mediating effect model, both based on manually collected data on the HSR opening in each city. The results of the study show that the exogenous shock of HSR opening has a significant impact on the quality of development of cities, and the robustness tests such as PSM-DID and placebo tests on the impact of HSR opening on the quality of urban development further verify its impact. In terms of the transmission mechanism, the opening of HSR can promote high-quality urban development through the population agglomeration effect and capital agglomeration effect. The opening of HSR provides transportation convenience for population and capital flow, which is conducive to the realization of population and capital agglomeration; and the capital agglomeration and high-quality urban development have a “masking effect”. In terms of heterogeneity, the empirical results show that there are differences in the effects of HSR opening on different regions and cities of different sizes, with eastern and western cities being more affected by HSR opening than central cities, and the smaller the city, the greater the policy dividend it enjoys.

6. Recommendation

The “high-speed railway era” has not only changed people’s lifestyles but also China’s economic and urban landscape. Ensuring that high-speed railways play a huge role is of great significance for cities. Combined with the above studies, this paper makes the following recommendations.
Firstly, the construction and optimization of the high-speed rail network should continue to be vigorously pursued in order to improve the coverage and radiation range of high-speed rail. The empirical results confirm that the HSR opening has a significant contribution to improving the overall quality of cities. It is thus clear that the current Chinese government should continue to increase the construction of high-speed rail to further shorten the space-time distance between cities, optimize the allocation of resources, inject new impetus, and create new opportunities for regional development.
Secondly, make full use of the location advantages and development opportunities brought about by the HSR opening to attract labor mobility and concentration. Local governments should create good channels for attracting talents and formulate more active, open, and effective talent policies to attract labor force clustering while introducing corresponding policies to encourage innovation and entrepreneurship among talents, promote industrial structure upgrading, and achieve a combination of quantity and quality of urban development.
Thirdly, create a good investment environment and vigorously promote investment attraction. The various factors that attract investment include the ability to support industry, government efficiency, social security, and other comprehensive ecological environments. As an economic activity under market economy conditions, cities must have scientific and open procedures and systems for operation and management to maximize the vitality of investment and provide an impetus for high-quality urban development.

Author Contributions

Conceptualization, L.Z.; methodology, Y.L.; writing–original draft, Y.L. and L.Z.; writing–review and editing, Y.L. and L.Z. All authors have read and agreed to the published version of the manuscript.

Funding

This research was funded by the National Natural Science Foundation of China, grant number. 71974136.

Data Availability Statement

The data related to high-speed rail were obtained from the China National Railway Corporation database (http://www.china-railway.com.cn (accessed on 15 August 2022)) and the National Railway Administration of the People of China (http://www.nra.gov.cn (accessed on 15 August 2022)). The relevant data at the urban level were obtained from the China Urban Statistical Yearbook, the China Urban Construction Statistical Yearbook, the Statistical Yearbooks, and annual bulletins of various provinces (cities and districts).

Acknowledgments

We would like to thank all the authors and reviewers for their great guidance and help in writing this manuscript.

Conflicts of Interest

The authors declare no conflict of interest.

References

  1. Zhao, W. The length of China’s High-Speed Railways in Operation has Exceeded 40,000 km, Ranking First in the World. Available online: https://baijiahao.baidu.com/s?id=1720634957406249562&wfr=spider&for=pc (accessed on 15 August 2022).
  2. Qin, Y. ‘No county left behind?’The distributional impact of high-speed rail upgrades in China. J. Econ. Geogr. 2017, 17, 489–520. [Google Scholar] [CrossRef]
  3. Coto-Millán, P.; Inglada, V.; Rey, B. Effects of network economies in high-speed rail: The Spanish case. Ann. Reg. Sci. 2007, 41, 911–925. [Google Scholar] [CrossRef]
  4. Li, Z.; Xu, H. High-speed railroads and economic geography: Evidence from Japan. J. Reg. Sci. 2018, 58, 705–727. [Google Scholar] [CrossRef]
  5. Bei, J. Study on the “high-quality development” economics. China Political Econ. 2018, 4, 5–18. [Google Scholar] [CrossRef]
  6. Cao, Z.; Zhang, H.; Hang, Z.; Zhou, D.; Jing, B. Does the Responsibility System for Environmental Protection Targets Enhance Corporate High-Quality Development in China? Energies 2022, 15, 3650. [Google Scholar] [CrossRef]
  7. Ge, G.; Xiao, X.; Li, Z.; Dai, Q. Does ESG Performance Promote High-Quality Development of Enterprises in China? The Mediating Role of Innovation Input. Sustainability 2022, 14, 3843. [Google Scholar] [CrossRef]
  8. Campa, J.L.; López-Lambas, M.E.; Guirao, B. High speed rail effects on tourism: Spanish empirical evidence derived from China’s modelling experience. J. Transp. Geogr. 2016, 57, 44–54. [Google Scholar] [CrossRef]
  9. Hiramatsu, T. Unequal regional impacts of high speed rail on the tourism industry: A simulation analysis of the effects of Kyushu Shinkansen. Transportation 2018, 45, 677–701. [Google Scholar] [CrossRef]
  10. Yan, B.R.; Dong, Q.L.; Li, Q.; Amin, F.U.; Wu, J.N. A study on the coupling and coordination between logistics industry and economy in the background of high-quality development. Sustainability 2021, 13, 10360. [Google Scholar] [CrossRef]
  11. Chen, L.; Ye, W.; Huo, C.; James, K. Environmental regulations, the industrial structure, and high-quality regional economic development: Evidence from China. Land 2020, 9, 517. [Google Scholar] [CrossRef]
  12. Yu, G.; Zhou, X. The influence and countermeasures of digital economy on cultivating new driving force of high-quality economic development in Henan Province under the background of “double circulation”. Ann. Oper. Res. 2021, 1–22. [Google Scholar] [CrossRef] [PubMed]
  13. Li, F.; Su, Y.; Xie, J.; Zhu, W.; Wang, Y. The impact of High-Speed Rail opening on city economics along the Silk Road Economic Belt. Sustainability 2020, 12, 3176. [Google Scholar] [CrossRef]
  14. Wang, C.; Meng, W.; Hou, X. The impact of high-speed rails on urban economy: An investigation using night lighting data of Chinese cities. Res. Transp. Econ. 2020, 80, 100819. [Google Scholar] [CrossRef]
  15. Jia, S.; Zhou, C.; Qin, C. No difference in effect of high-speed rail on regional economic growth based on match effect perspective? Transp. Res. Part A Policy Pract. 2017, 106, 144–157. [Google Scholar] [CrossRef]
  16. Ozturk, I.; Bilgili, F. Economic growth and biomass consumption nexus: Dynamic panel analysis for Sub-Sahara African countries. Appl. Energy 2015, 137, 110–116. [Google Scholar] [CrossRef]
  17. Zhong, C.; Cai, H.; Shi, Q. Will high-speed rail bring cleaning effect to the cities? Evidence from China. Appl. Econ. Lett. 2021, 1–5. [Google Scholar] [CrossRef]
  18. Verhoef, E.T.; Nijkamp, P. Externalities in urban sustainability: Environmental versus localization-type agglomeration externalities in a general spatial equilibrium model of a single-sector monocentric industrial city. Ecol. Econ. 2002, 40, 157–179. [Google Scholar] [CrossRef]
  19. Chen, M.; Wang, H. Import technology sophistication and high-quality economic development: Evidence from city-level data of China. Econ. Res. -Ekon. Istraživanja 2022, 35, 1106–1141. [Google Scholar] [CrossRef]
  20. Lu, Y.; Yang, S.; Li, J. The influence of high-speed rails on urban innovation and the underlying mechanism. PLoS ONE 2022, 17, e0264779. [Google Scholar] [CrossRef]
  21. Lin, S.; Chen, Z.; He, Z. Rapid Transportation and Green Technology Innovation in Cities—From the View of the Industrial Collaborative Agglomeration. Appl. Sci. 2021, 11, 8110. [Google Scholar] [CrossRef]
  22. Chen, H.; Sun, D.; Zhu, Z.; Zeng, J. The impact of high-speed rail on residents’ travel behavior and household mobility: A case study of the Beijing-Shanghai Line, China. Sustainability 2016, 8, 1187. [Google Scholar] [CrossRef]
  23. Li, L.; Lu, L.; Xu, Y.; Sun, X. Influence of high-speed rail on tourist flow network in typical tourist cities: An empirical study based on the Hefei–Fuzhou high-speed rail in China. Asia Pac. J. Tour. Res. 2020, 25, 1215–1231. [Google Scholar] [CrossRef]
  24. Yang, J.; Guo, A.; Li, X.; Huang, T. Study of the impact of a high-speed railway opening on China’s accessibility pattern and spatial equality. Sustainability 2018, 10, 2943. [Google Scholar] [CrossRef]
  25. Zhao, T.; Xiao, X.; Dai, Q. Transportation Infrastructure Construction and High-Quality Development of Enterprises: Evidence from the Quasi-Natural Experiment of High-Speed Railway Opening in China. Sustainability 2021, 13, 13316. [Google Scholar] [CrossRef]
  26. Hua, X.; Lv, H.; Jin, X. Research on High-Quality Development Efficiency and Total Factor Productivity of Regional Economies in China. Sustainability 2021, 13, 8287. [Google Scholar] [CrossRef]
  27. Gutiérrez, J. Location, economic potential and daily accessibility: An analysis of the accessibility impact of the high-speed line Madrid–Barcelona–French border. J. Transp. Geogr. 2001, 9, 229–242. [Google Scholar] [CrossRef]
  28. Yao, S.; Zhang, F.; Wang, F.; Ou, J. High-speed rail and urban economic growth in China after the global financial crisis. China World Econ. 2019, 27, 44–65. [Google Scholar] [CrossRef]
  29. Donaldson, D.; Hornbeck, R. Railroads and American economic growth: A “market access” approach. Q. J. Econ. 2016, 131, 799–858. [Google Scholar] [CrossRef]
  30. Faber, B. Trade integration, market size, and industrialization: Evidence from China’s National Trunk Highway System. Rev. Econ. Stud. 2014, 81, 1046–1070. [Google Scholar] [CrossRef]
  31. Gu, Y.; Zheng, S. The impacts of rail transit on property values and land development intensity: The case of No. 13 Line in Beijing. Acta Geogr. Sin. 2010, 65, 213–223. [Google Scholar]
  32. Debrezion, G.; Pels, E.; Rietveld, P. The impact of rail transport on real estate prices: An empirical analysis of the Dutch housing market. Urban Stud. 2011, 48, 997–1015. [Google Scholar] [CrossRef]
  33. Geng, B.; Bao, H.; Liang, Y. A study of the effect of a high-speed rail station on spatial variations in housing price based on the hedonic model. Habitat Int. 2015, 49, 333–339. [Google Scholar] [CrossRef]
  34. Fallah, B.N.; Partridge, M.D.; Olfert, M.R. Urban sprawl and productivity: Evidence from US metropolitan areas. Pap. Reg. Sci. 2011, 90, 451–472. [Google Scholar] [CrossRef]
  35. Guastella, G.; Pareglio, S.; Sckokai, P. A spatial econometric analysis of land use efficiency in large and small municipalities. Land Use Policy 2017, 63, 288–297. [Google Scholar] [CrossRef]
  36. Ureña, J.M.; Menerault, P.; Garmendia, M. The high-speed rail challenge for big intermediate cities: A national, regional and local perspective. Cities 2009, 26, 266–279. [Google Scholar] [CrossRef]
  37. Kim, K.S. High-speed rail developments and spatial restructuring: A case study of the Capital region in South Korea. Cities 2000, 17, 251–262. [Google Scholar] [CrossRef]
  38. Monzón, A.; Ortega, E.; López, E. Efficiency and spatial equity impacts of high-speed rail extensions in urban areas. Cities 2013, 30, 18–30. [Google Scholar] [CrossRef]
  39. Huang, Y.; Wang, Y. How does high-speed railway affect green innovation efficiency? A perspective of innovation factor mobility. J. Clean. Prod. 2020, 265, 121623. [Google Scholar] [CrossRef]
  40. Cascetta, E.; Papola, A.; Pagliara, F.; Marzano, V. Analysis of mobility impacts of the high speed Rome–Naples rail link using withinday dynamic mode service choice models. J. Transp. Geogr. 2011, 19, 635–643. [Google Scholar] [CrossRef]
  41. Liao, M.L.; Chen, Y.; Wang, Y.J.; Lin, M.S.; Wang, Y.J.; Lin, M.S. Study on the coupling and coordination degree of high-quality economic development and ecological environmet in Beijing-Tianjin-Hebei region. Appl. Ecol. Environ. Res. 2019, 17, 11069–11083. [Google Scholar] [CrossRef]
  42. Guirao, B.; Lara-Galera, A.; Campa, J.L. High Speed Rail commuting impacts on labour migration: The case of the concentration of metropolis in the Madrid functional area. Land Use Policy 2017, 66, 131–140. [Google Scholar] [CrossRef]
  43. Hao, L.; Zhang, N.; Li, H.; Strauss, J.; Liu, X.; Guo, X. The influence of the Air Cargo Network on the regional economy under the impact of High-Speed Rail in China. Sustainability 2020, 12, 8120. [Google Scholar] [CrossRef]
  44. Sobieralski, J.B. Transportation infrastructure and employment: Are all investments created equal? Res. Transp. Econ. 2021, 88, 100927. [Google Scholar] [CrossRef]
  45. Haller, P.; Heuermann, D.F. Job search and hiring in local labor markets: Spillovers in regional matching functions. Reg. Sci. Urban Econ. 2016, 60, 125–138. [Google Scholar] [CrossRef]
  46. Haas, A.; Osland, L. Commuting, migration, housing and labour markets: Complex interactions. Urban Stud. 2014, 51, 463–476. [Google Scholar] [CrossRef]
  47. Moyano, A.; Coronado, J.M.; Garmendia, M. How to choose the most efficient transport mode for weekend tourism journeys: An HSR and private vehicle comparison. Open Transp. J. 2016, 10, 84–96. [Google Scholar] [CrossRef]
  48. Guirao, B.; Campa, J.L. Cross effects between high speed rail lines and tourism: Looking for empirical evidence using the Spanish case study. Transp. Res. Procedia 2016, 14, 392–401. [Google Scholar] [CrossRef]
  49. Banerjee, A.; Duflo, E.; Qian, N. On the road: Access to transportation infrastructure and economic growth in China. J. Dev. Econ. 2020, 145, 102442. [Google Scholar] [CrossRef]
  50. Zhang, X.; Wu, W.; Zhou, Z.; Yuan, L. Geographic proximity, information flows and corporate innovation: Evidence from the high-speed rail construction in China. Pac. -Basin Financ. J. 2020, 61, 101342. [Google Scholar] [CrossRef]
  51. Remoundou, K.; Gkartzios, M.; Garrod, G. Conceptualizing mobility in times of crisis: Towards crisis-led counter urbanization? Reg. Stud. 2016, 50, 1663–1674. [Google Scholar] [CrossRef]
  52. Li, H.; Chan, K.C. Does high speed rail enhance financial development? Appl. Econ. Lett. 2022, 29, 442–445. [Google Scholar] [CrossRef]
  53. Long, Y.; Zhao, H.L.; Zhang, X.D. Venture capital under the spatiotemporal compression—high-speed rail opening and regional changes of venture capital. Econ. Res. J. 2017, 52, 195–208. [Google Scholar]
  54. Xinze, L.; Xiaole, L.; Lingling, Z. Can high-speed rail improve enterprise resource allocation? Microscopic evidence from Chinese industrial enterprise database and high-speed rail geographic data. Econ. Rev. 2017, 6, 3–21. [Google Scholar]
  55. Wolff, H. Keep your clunker in the suburb: Low-emission zones and adoption of green vehicles. Econ. J. 2014, 124, F481–F512. [Google Scholar] [CrossRef]
  56. Jiang, Y.; Xiao, X.; Li, X.; Ge, G. High-Speed Railway Opening and High-Quality Development of Cities in China: Does Environmental Regulation Enhance the Effects? Sustainability 2022, 14, 1392. [Google Scholar] [CrossRef]
  57. Li, B.X.; Wang, H. Comprehensive evaluation of urban high-quality development: A case study of Liaoning Province. Environ. Dev. Sustain. 2021, 9, 12–99. [Google Scholar] [CrossRef]
  58. Hu, B.; Li, J.; Kuang, B. Evolution characteristics and influencing factors of urban land use efficiency difference under the concept of green development. Econ. Geogr. 2018, 38, 183–189. [Google Scholar]
  59. Haarstad, H.; Wathne, M.W. Are smart city projects catalyzing urban energy sustainability? Energy Policy 2019, 129, 918–925. [Google Scholar] [CrossRef]
  60. Angelidou, M. The role of smart city characteristics in the plans of fifteen cities. J. Urban Technol. 2017, 24, 3–28. [Google Scholar] [CrossRef]
  61. Xie, H.; Chen, Q.; Lu, F.; Wang, W.; Yao, G.; Yu, J. Spatial-temporal disparities and influencing factors of total-factor green use efficiency of industrial land in China. J. Clean. Prod. 2019, 207, 1047–1058. [Google Scholar] [CrossRef]
  62. Liu, L.; Zhang, M. High-speed rail impacts on travel times, accessibility, and economic productivity: A benchmarking analysis in city-cluster regions of China. J. Transp. Geogr. 2018, 73, 25–40. [Google Scholar] [CrossRef]
  63. Li, P.; Lu, Y.; Wang, J. Does flattening government improve economic performance? Evidence from China. J. Dev. Econ. 2016, 123, 18–37. [Google Scholar] [CrossRef]
  64. Baron, R.M.; Kenny, D.A. The moderator–mediator variable distinction in social psychological research: Conceptual, strategic, and statistical considerations. J. Personal. Soc. Psychol. 1986, 51, 1173. [Google Scholar] [CrossRef]
Figure 1. Parallel trend test chart.
Land 11 01596 g001
Figure 2. Placebo test.
Land 11 01596 g002
Table 1. High-quality urban development evaluation index system.
Target LevelGuideline LevelWeightingIndex LayerWeightingProperty
High-quality urban developmentEconomic growth momentum0.2558Total industrial output value above designated size (RMB 10,000)0.3231+
GDP growth rate (%)0.3541+
Per capita retail sales of consumer goods (RMB)0.3228+
Social support functions0.2408Number of beds in hospitals and health centers (sheets)0.3580+
Public library holdings per 100 persons (volumes)0.3367+
Scientific research and technology practitioners (person)0.3053+
Ecological and environmental efficiency0.2627Green space coverage in built-up area (%)0.3274+
Harmless treatment rate of household garbage (%)0.3357+
Industrial wastewater displacement per unit of GDP (ton)0.3369
Infrastructure potential0.2407Postal service revenue (RMB 10,000)0.2972+
Public transport vehicle ownership per 10,000 persons (vehicles)0.3639+
End of year drainage pipe length (km)0.3389+
Table 2. Descriptive Statistics.
VariablesObs.MeanS.D.MinMax
1. High-quality urban development (Qud)39900.2510.2840.0396.970
2. High-speed rail opening (du*dt)39900.1550.3620.0001.000
3. Level of economic development (Edl)399010.4500.7364.60513.156
4. Level of foreign investment (Fil)39909.7391.9941.38614.941
5. Level of government expenditure (Gi)39901.0972.3560.0018.896
6. Educational input (Ei)39900.8662.0310.0027.213
7. Road occupancy rate per capita (Roc)399012.38011.0170.020442.950
8. Urbanization (Url)39900.3620.2400.0441.000
9. Level of technological innovation (Ti)39904.4701.9190.00011.053
10. Capital agglomeration (Ca)39901.7602.8950.0849.893
11. Population agglomeration (Pa)39905.7320.9381.7629.984
Table 3. Baseline regression results.
Model (1)Model (2)Model (3)Model (4)Model (5)Model (6)Model (7)Model (8)
du*dt0.087 ***
(9.124)
0.087 ***
(9.132)
0.086 ***
(8.984)
0.085 ***
(8.947)
0.083 ***
(8.748)
0.084 ***
(8.749)
0.081 ***
(8.511)
0.079 ***
(8.324)
Edl 0.028 ***
(2.779)
0.022 **
(2.205)
0.022 **
(2.222)
0.029 ***
(2.880)
0.029 ***
(2.881)
0.026 **
(2.510)
0.023 **
(2.240)
Fil 0.012 ***
(4.059)
0.012 ***
(4.061)
0.011 ***
(3.871)
0.011 ***
(3.871)
0.011 ***
(3.898)
0.010 ***
(3.651)
Gi −0.002
(−0.414)
0.008
(1.487)
0.008
(1.486)
0.008
(1.503)
0.008
(1.524)
Ei −0.033 ***
(−3.331)
−0.033 ***
(−3.332)
−0.032 ***
(−3.208)
−0.031 ***
(−3.084)
Roc −0.001
(−0.195)
0.001
(0.254)
0.001
(0.137)
Url 0.152 ***
(4.528)
0.150 ***
(4.480)
Ti 0.014 **
(2.525)
_cons0.168 ***
(18.825)
−0.101
(−1.039)
−0.154
(−1.574)
−0.156
(−1.590)
−0.220 **
(−2.205)
−0.220 **
(−2.200)
−0.237 **
(−2.371)
−0.243 **
(−2.439)
CityYESYESYESYESYESYESYESYES
YearYESYESYESYESYESYESYESYES
Obs.39903990399039903990399039903990
R^20.1680.1690.1730.1730.1760.1760.1800.182
Note: *** and ** denote significance levels at 1%, 5%, and 10% respectively, with t-values in brackets. Same below.
Table 4. Robustness test results.
PSM-DID Neighbor MatchingPSM-DID Nuclear MatchingPSM-DID Radius MatchingTail Shrinkage 1%Tail Breakage 1%Dependent Variable Lags by One Period
du*dt0.025 *
(1.677)
0.012 *
(1. 677)
0.051 ***
(5.797)
0.070 ***
(14.780)
0.059 ***
(14.142)
0.070 ***
(11.708)
Edl0.001
(0.024)
0.032 ***
(3.090)
0.027 ***
(2.698)
0.019 ***
(3.283)
0.016 ***
(2.920)
0.014 **
(2.089)
Fil0.008 ***
(2.666)
0.005 *
(1.765)
0.008 ***
(2.794)
0.005 ***
(3.398)
0.003 **
(2.224)
0.007 ***
(3.940)
Gi−0.002
(−0.197)
0.001
(0.283)
0.006
(1.246)
0.001
(0.115)
0.005 **
(2.197)
0.002
(0.588)
Ei0.004
(0.257)
−0.012
(−1.350)
0.008
(0.516)
−0.022 ***
(−4.384)
−0.022 ***
(−4.878)
−0.030 ***
(−4.365)
Roc0.001 *
(1.961)
0.001
(1.310)
0.001
(1.412)
0.001
(1.593)
0.001 ***
(3.525)
−0.001
(−0.006)
Url0.022
(0.932)
0.030
(0.906)
0.074 **
(2.327)
0.136 ***
(8.045)
0.111 ***
(7.435)
0.146 ***
(6.892)
Ti0.038 ***
(9.013)
0.023 ***
(4.586)
0.018 ***
(3.574)
0.008 ***
(2.922)
0.007 ***
(2.727)
−0.001
(−0.166)
_cons−0.048
(−0.561)
−0.284 ***
(−2.879)
−0.242 **
(−2.514)
−0.136 **
(−2.460)
−0.097 *
(−1.860)
−0.081
(−1.263)
CityYESYESYESYESYESYES
YearYESYESYESYESYESYES
Obs.188434423787399035403696
R^20.1330.1190.1570.3850.4430.279
Note: ***, **, and * denote significance levels at 1%, 5%, and 10% respectively, with t-values in brackets. Same below.
Table 5. Results of the test for mechanism effects.
VariablesHigh-Quality DevelopmentPopulation
Agglomeration
High-Quality
Development
Capital
Agglomeration
High-Quality
Development
du*dt0.079 ***
(8.324)
0.026 ***
(2.663)
0.078 ***
(8.137)
0.043 ***
(3.119)
0.082 ***
(8.584)
Pa 0.073 ***
(4.597)
Ca −0.055 ***
(−4.798)
Edl0.023 **
(2.240)
0.011
(1.013)
0.022 **
(2.169)
−0.222 ***
(−15.042)
0.011
(1.025)
Fil0.010 ***
(3.651)
0.002
(0.788)
0.010 ***
(3.601)
0.033 ***
(7.920)
0.012 ***
(4.252)
Gi0.008
(1.524)
−0.002
(−0.391)
0.008
(1.558)
0.024 ***
(3.265)
0.009 *
(1.785)
Ei−0.031 ***
(−3.084)
0.003
(0.317)
−0.031 ***
(−3.116)
1.126 ***
(78.659)
0.031 *
(1.912)
Roc0.001
(0.137)
−0.001 *
(−1.745)
0.001
(0.270)
0.001
(1.322)
0.001
(0.242)
Url0.150 ***
(4.480)
−0.425 ***
(−12.177)
0.181 ***
(5.309)
−0.052
(−1.087)
0.147 ***
(4.406)
Ti0.014 **
(2.525)
0.001
(0.221)
0.014 **
(2.515)
0.036 ***
(4.532)
0.016 ***
(2.883)
_cons−0.243 **
(−2.439)
5.716 ***
(55.047)
−0.659 ***
(−4.901)
2.166 ***
(15.143)
−0.124
(−1.211)
CityYESYESYESYESYES
YearYESYESYESYESYES
Obs.39903990399039903990
R^20.1820.0540.1860.9950.187
Note: ***, **, and * denote significance levels at 1%, 5%, and 10% respectively, with t-values in brackets. Same below.
Table 6. Heterogeneity test results.
Variables(1)
Eastern
Cities
(2)
Central
Cities
(3)
Western Cities
(4)
Medium-sized Cities
(5)
Big Cities
(6)
Mega
Cities
du*dt0.110 ***
(7.559)
−0.003
(−0.156)
0.097 ***
(8.525)
0.017 ***
(2.698)
0.029 *
(1.828)
0.063
(0.826)
_cons−0.397 **
(−2.183)
−0.503 **
(−2.288)
−0.138 *
(−1.711)
0.003
(0.049)
−0.423 **
(−2.060)
−0.405
(−0.256)
ControlsYESYESYESYESYESYES
CityYESYESYESYESYESYES
YearYESYESYESYESYESYES
Obs.14001400118113821763131
R^20.3400.0910.4040.2050.1610.752
Note: ***, **, and * denote significance levels at 1%, 5%, and 10% respectively, with t-values in brackets. Same below.
Publisher’s Note: MDPI stays neutral with regard to jurisdictional claims in published maps and institutional affiliations.

