
Public Service Delivery and the Livelihood Adaptive Capacity of Farmers and Herders: The Mediating Effect of Livelihood Capital


Abstract
:1. Introduction
2. Research Hypotheses
3. Model, Variables, and Data Specifications
3.1. Measurement of Variables
3.1.1. Explained Variables
3.1.2. Explanatory Variables
3.1.3. Mediating Variables
3.1.4. Control Variables
3.2. Model Construction
3.3. Study Area and Data Sources
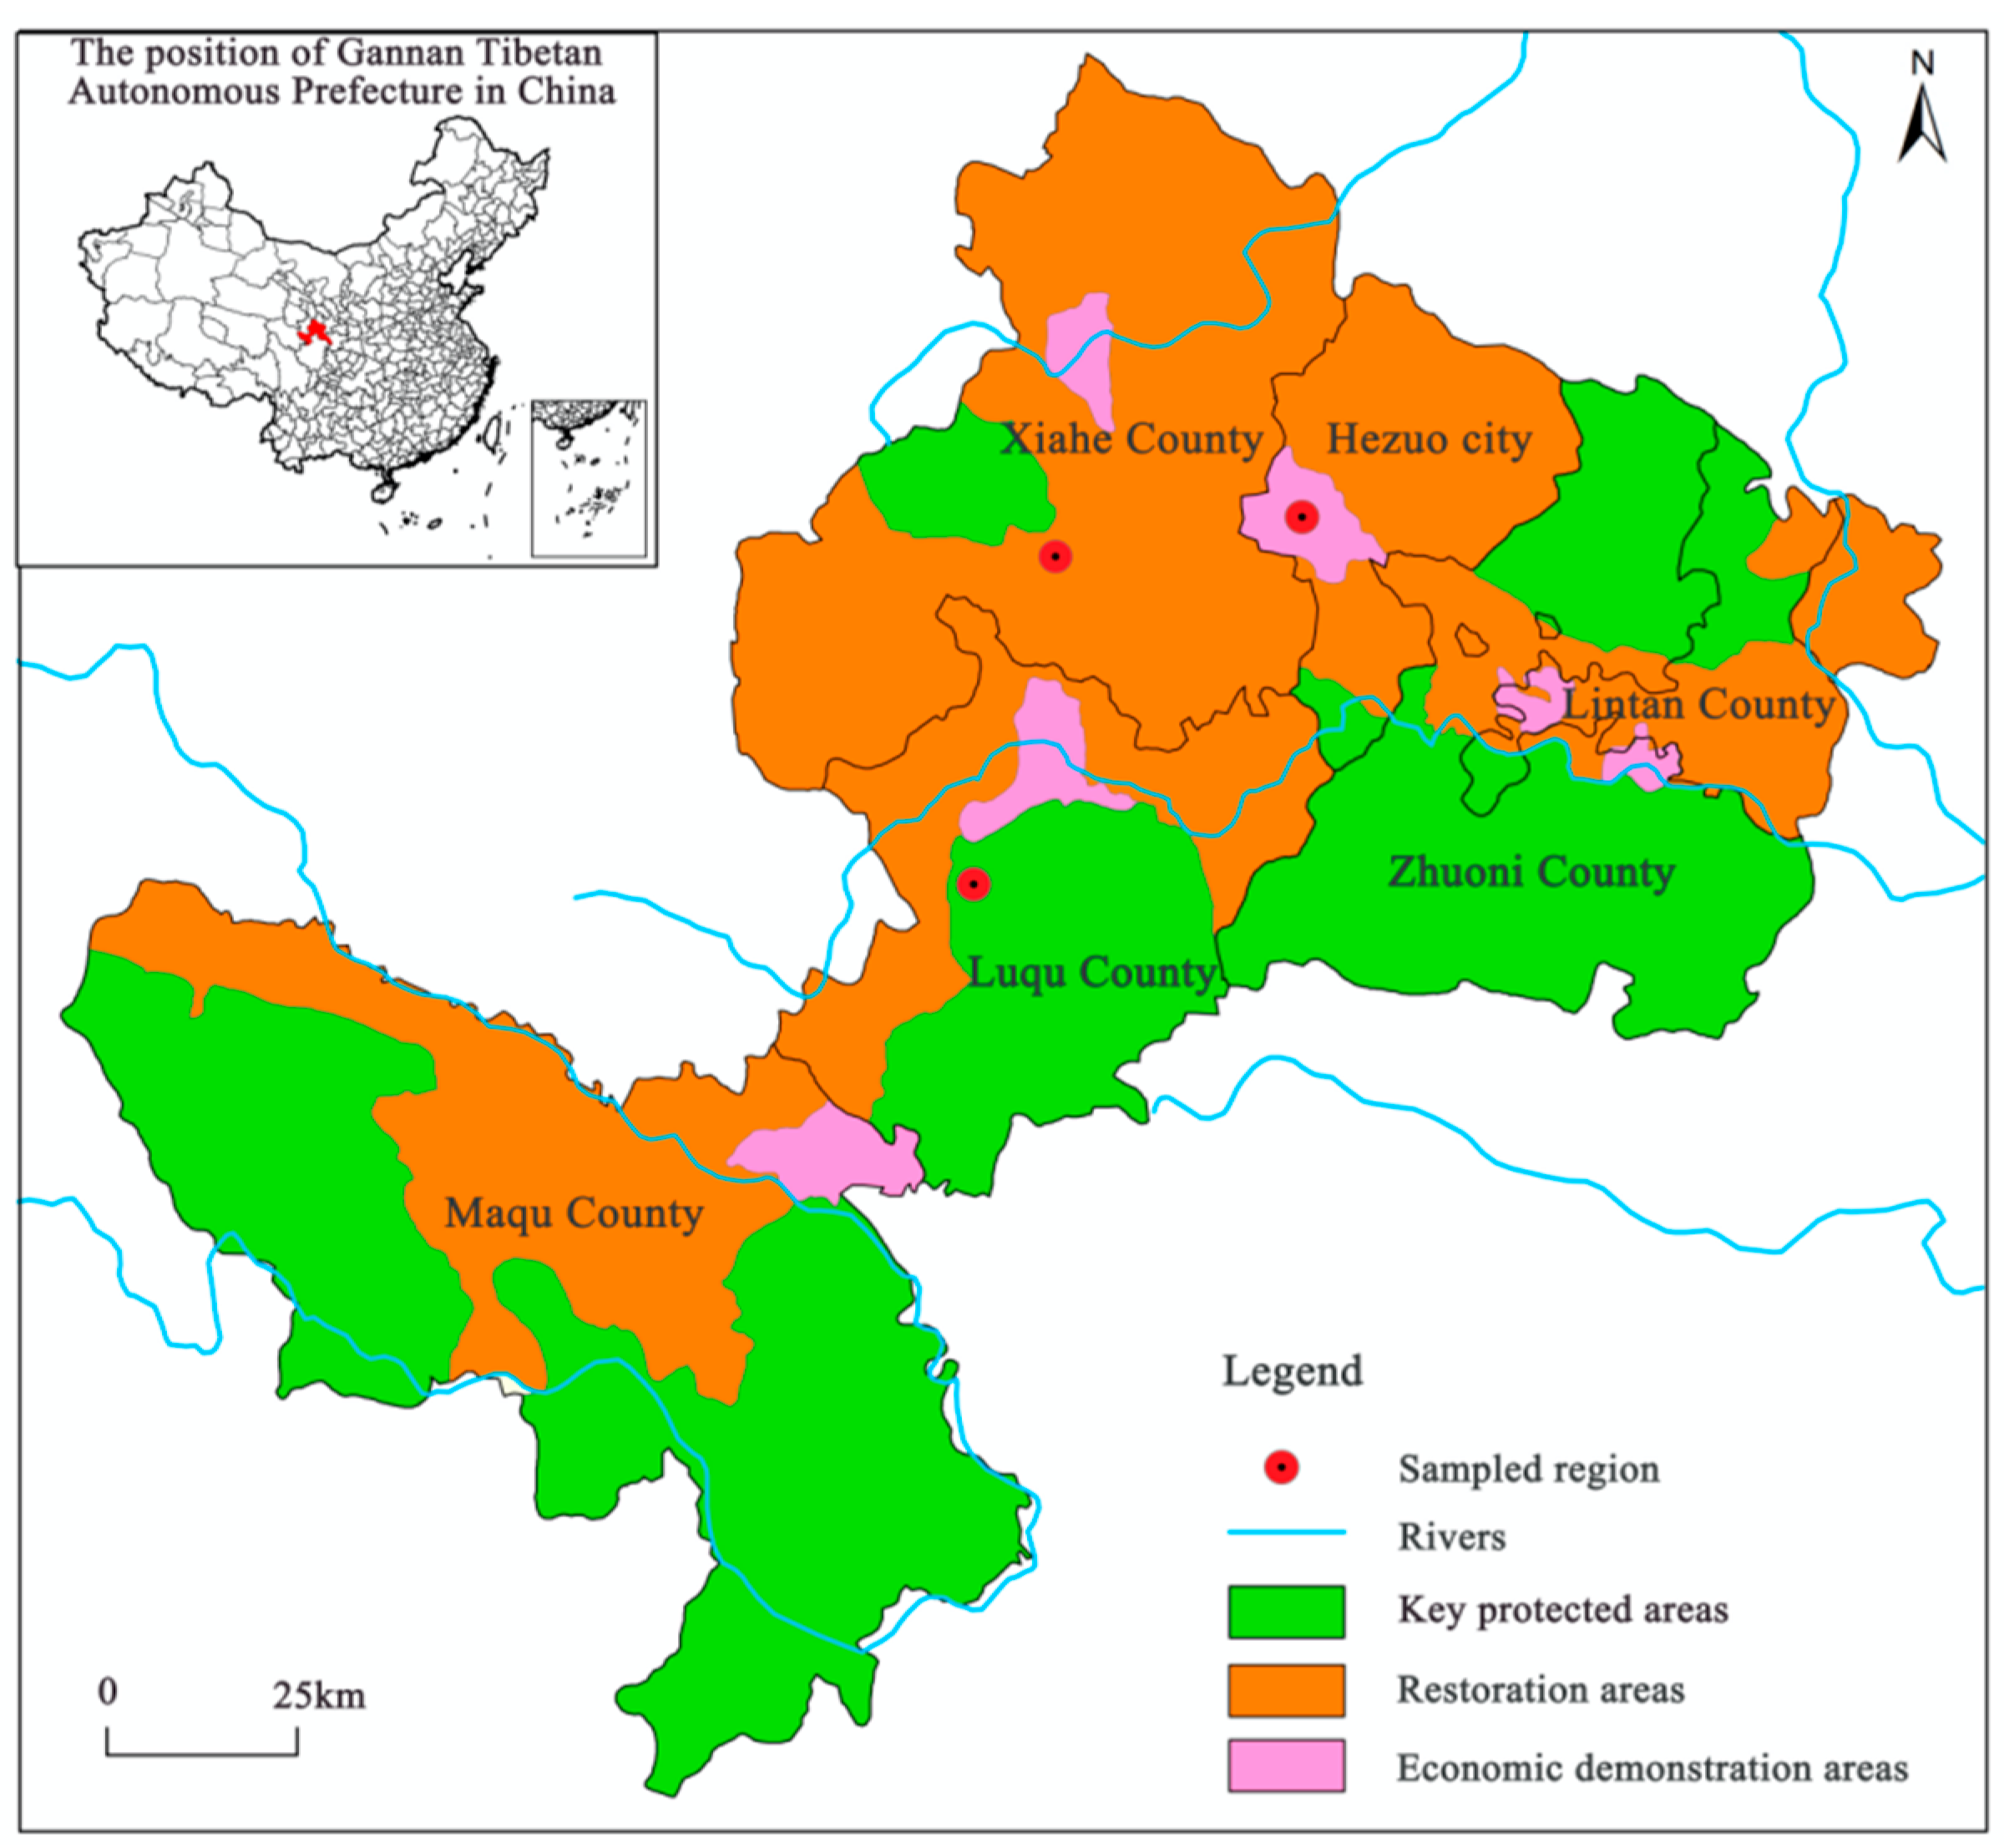
3.3.1. Study Area
3.3.2. Data Sources
4. Results
4.1. The Effect of Public Service Delivery on the Livelihood Adaptive Capacity of Farmers and Herders
4.2. Testing and Estimating the Mediating Effect of Livelihood Capital
4.2.1. Mediated Effects Model Test
4.2.2. Endogeneity and Robustness Testing
5. Discussion
6. Conclusions
6.1. Research Conclusions
- (1)
- Increasing the level of public service delivery enhances the livelihood adaptation capacity of farming and herding households, and all variables are significant at the 1% and 5% levels. On the one hand, improving the level of basic public service delivery can optimize the allocation of the livelihood capital of farming and herding households and enhance their development capacity through capital accumulation. On the other hand, public services create a new livelihood environment to help people to adapt to the market demand for the modernization and transformation of agricultural and rural livelihoods.
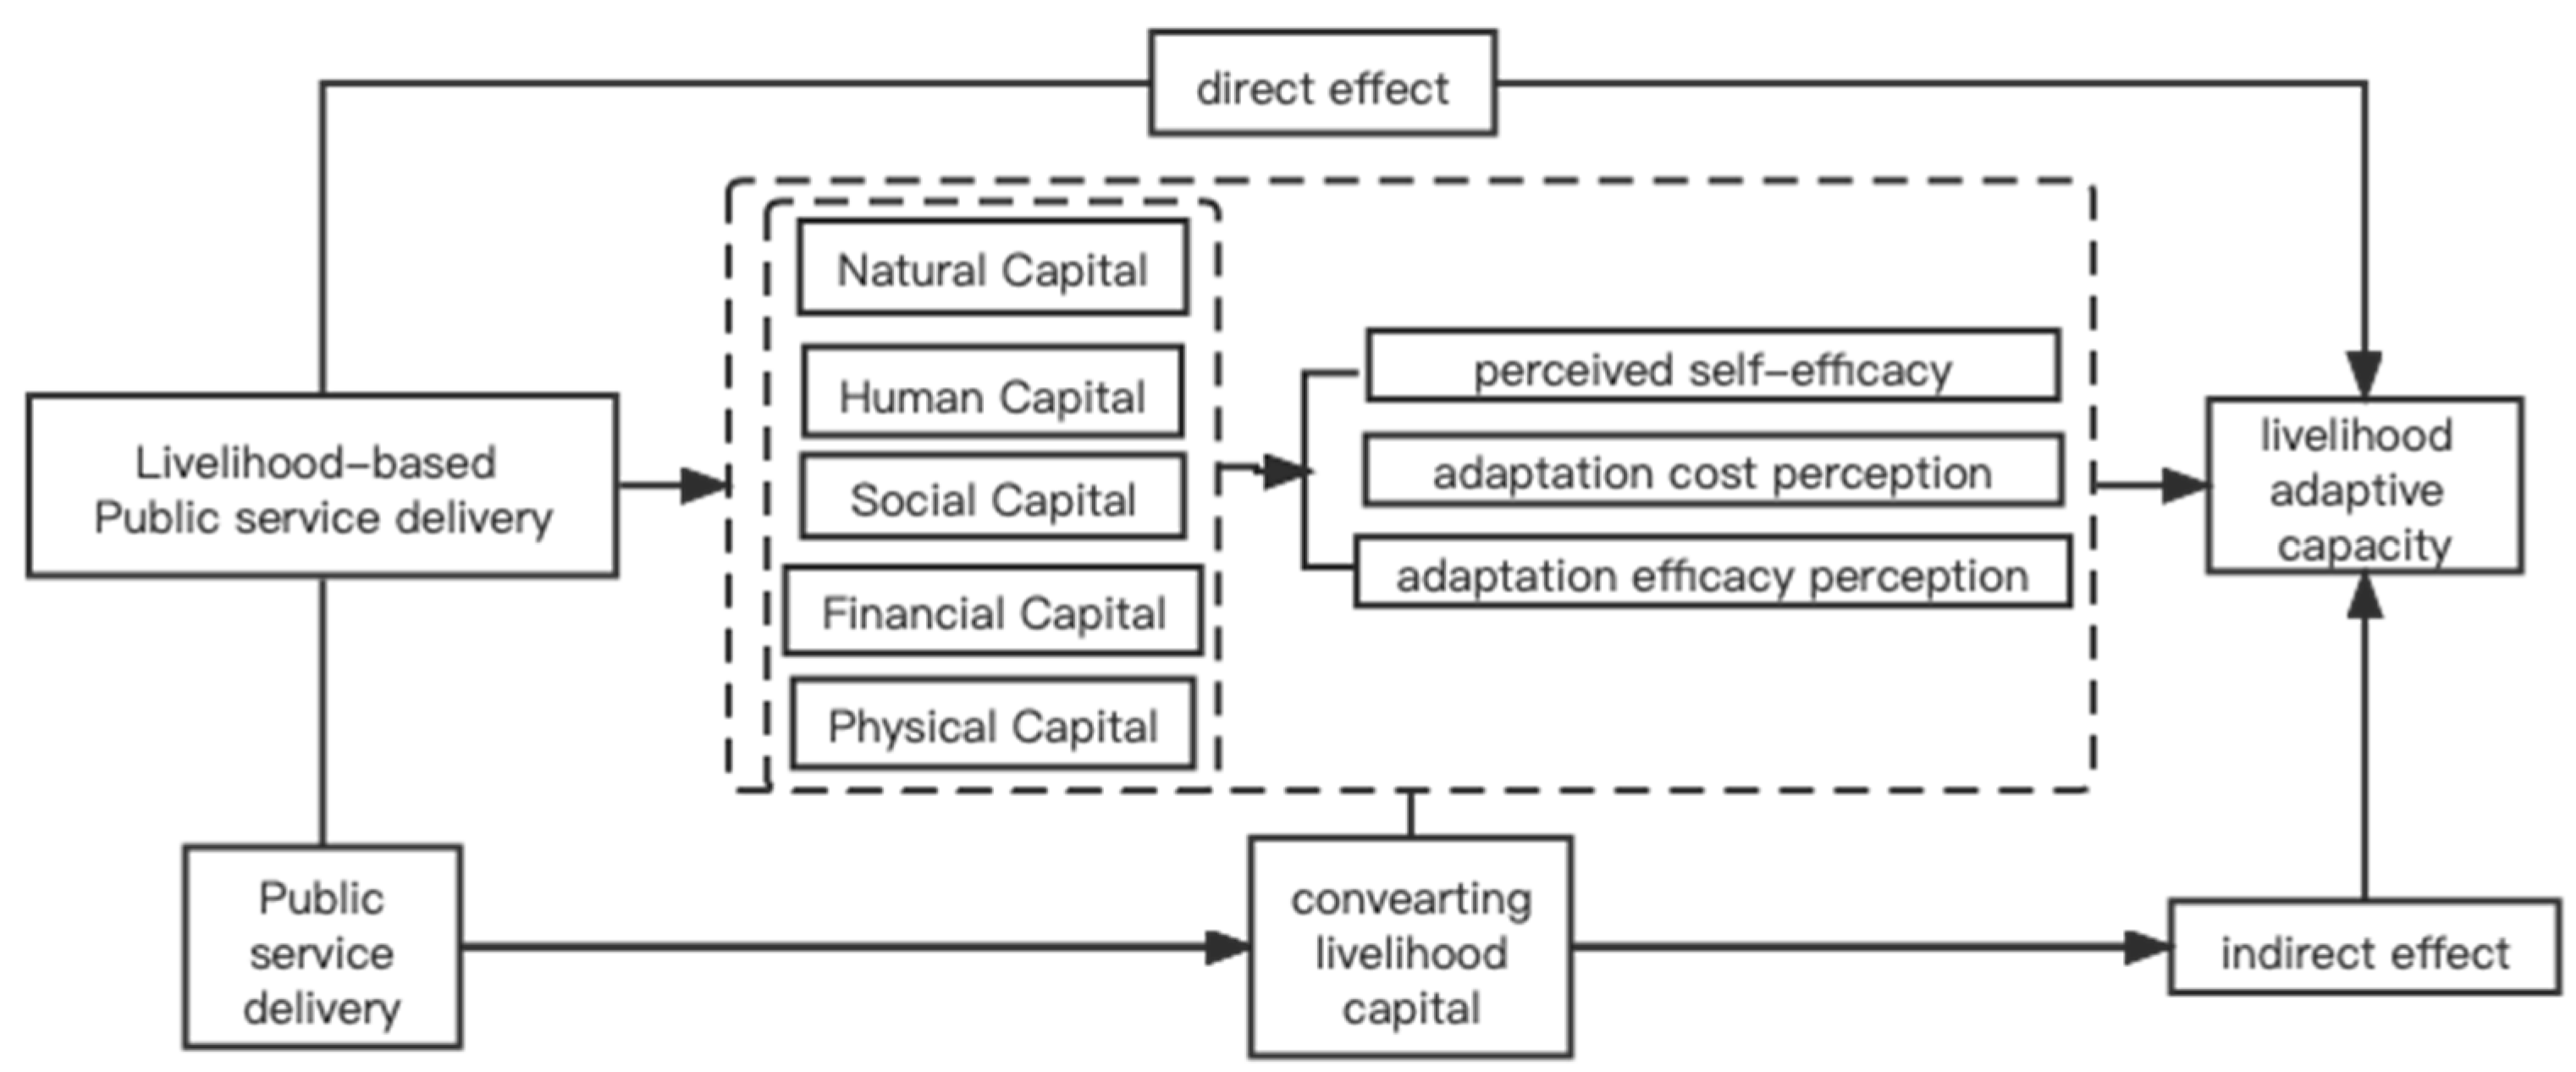
- (2)
- The results presented found that the coefficient of the total effect of public service delivery on the livelihood adaptive capacity of farmers and herders was 0.125 and was significantly positive at the 1% level. The direct effect was 0.056, accounting for 38.08% of the total effect. The indirect effect of the five types of livelihood capital, natural, physical, human, social, and financial, on adaptive capacity accounted for 61.92% of the total effect, with coefficients of 0.232, 0.313, 0.152, 0.228, and 0.230, respectively, all of which were significantly positive at the 5% levels. Transformation of livelihood capital by public service delivery is a key factor in improving livelihood adaptive capacity, and empowering farming and herding households to develop themselves in the process of livelihood transition.
- (3)
- It was found that perceived self-efficacy and adaptation costs of farmers and herders were significantly correlated with social and financial capital: the greater the social and financial capital, the greater the perceived self-efficacy, the lower the perceived adaptation cost, and the greater the adaptation capacity. Perceived adaptation efficacy was not significantly correlated with livelihood capital, but there was significant regional heterogeneity. This provides further evidence that the level of public service delivery is closely related to the perceived livelihood environment and livelihood risk of farmers and herders, which in turn affects their livelihood adaptation capacity.
6.2. Policy Implications
Author Contributions
Funding
Informed Consent Statement
Data Availability Statement
Conflicts of Interest
References
- Xi, J.P. Speech at the Symposium on Solving the Outstanding Issues of “Two No Worries and Three Guarantees”. SHIJIAN. 2019, 9, 5–8. [Google Scholar]
- Wang, Y.; Xu, L.X. Consolidate And Expand the Research on The Path of Effective Connection Between the Achievements of Poverty Alleviation and Rural Revitalization-Take the Qinba Mountains in China As An Example. Int. J. Soc. Sci. U 2021, 4, 4. [Google Scholar]
- Huang, C.W. On the Inner Logic and Theoretical Issues of Rural Revitalization and Common Prosperity. J. Nanjing Agr. U Soc. Sci. 2021, 21, 1–9. [Google Scholar]
- Rasmus, R.; Kristian, N. Employment effects of investments in public employment services for disadvantaged social assistance recipients. Eur. J. Soc. Secur. 2019, 21, 42–62. [Google Scholar]
- Ramesh, R. How Equal is Access to Public Services? The Impact of Sociodemographic Background on Public Service Delivery in Sri Lanka. J. Dev. Soc. 2021, 37, 7–29. [Google Scholar] [CrossRef]
- Dai, F.Q.; Liu, H.; Zhang, X.; Li, Q. Does the Equalization of Public Services Effect Regional Disparities in the Ratio of Investment to Consumption? Evidence From Provincial Level in China. SAGE Open 2022, 12, 265–277. [Google Scholar] [CrossRef]
- Xu, B.; Abukhalifeh, A.N.; Lu, X.L.; Gao, B.; Cui, H.Y.; Wu, Y. Rural Tourism Public Service Performance Evaluation Based on Analytic Hierarchy Process. Math. Probl. Eng. 2022, 2022, 4189862. [Google Scholar] [CrossRef]
- Andrea, F. Does Diversity Undermine the Welfare State? Evidence from the Provision of Local Public Services in European Regions. Kyklos 2020, 73, 68–95. [Google Scholar]
- Wu, X.R.; Fan, X.M. The Sustainable Development of Human Beings: The Inherent Logic of the International Research on Education and Poverty Alleviation and its Inspiration to China. TSINGHUA J. Educ. 2019, 40, 80–89. [Google Scholar]
- Cao, Q. The Study on Concepts, Principles and Framework of Land-Lost Farmers’ Security System—Based on Perspective of Sustainable Livelihoods. Contemp. Econ. Manag. 2011, 191, 59–63. [Google Scholar]
- Yang, B.; He, Q. Study on the concept, principles and framework of the security system for landless farmers based on the perspective of sustainable livelihood. Contemp. Econ. Manag. 2011, 33, 59–63. [Google Scholar]
- Tai, X.J.; Yang, H.Z. Livelihood rebuild of Loess Plateau ecological migrants in the view of ethnic cultures. Res. Agr. Mod. 2017, 38, 1009–1015. [Google Scholar]
- Li, T.; Tan, S. Pastoralists’ Livelihood Vulnerability in the Context of Institutional Transition: An Analysis Based on the “Vulnerability-Resilience” Framework. China Rural. Surv. 2018, 3, 19–34. [Google Scholar]
- Cui, S.; Li, X.; Li, Y. Review on Adaptation in the Perspective of Global Change. Prog. Geog. 2011, 30, 1088–1098. [Google Scholar]
- Meng, J.J.; Aimur, L.; Liu, Y.; Xiang, Y.Y. Study on Relationship between Livelihood Capital and Livelihood Strategy of Farming and Grazing Households: A Case of Uxin Banner in Ordos. Acta. Sci. Nat. Univ. Pekin. 2013, 49, 321–328. [Google Scholar]
- Bu, R.; Nham, M. Multi-Scalar pathways to smallholder adaptation. World Dev. 2018, 108, 249–262. [Google Scholar]
- Ellis, F. Rural Development and Diversity in Developing Countries; Oxford University Press: Oxford, UK, 2000. [Google Scholar]
- Li, T.Y.; Tan, S.H. Livelihood Vulnerability of Pastoralist Households in the Context of Institutional Change-Based on the “Vulnerability-Resilience” Analysis Framework. China Rural. Obs. 2018, 3, 9–34. [Google Scholar]
- Ali, J.; Joern, B.; Daniel, F.; Irfan, A.R. A Conceptual Framework to Understand the Dynamics of Rural-Urban Linkages for Rural Flood Vulnerability. Sustainability 2020, 12, 2894. [Google Scholar]
- Iwan, R.; Dony, P.K. Spatial Exposure and Livelihood Vulnerability to Climate-Related Disasters in The North Coast of Tegal City, Indonesia. Int. Rev. Spat. Plan. Sustain. 2020, 8, 34–53. [Google Scholar]
- Huang, X.J.; Huang, X.; He, Y.B.; Yang, X.J. Assessment of livelihood vulnerability of land-Lost farmers in urban fringes: A case study of Xi’an, China. Habitat Int. 2017, 59, 1–9. [Google Scholar] [CrossRef]
- Philip, A.; Millar, K.K.N.D.; Joseph, A.A. Smallholder farmers’ livelihood adaptation to climate variability and ecological changes in the savanna agro ecological zone of Ghana. Heliyon 2019, 5, e01492. [Google Scholar]
- Li, J. Livelihood adaptation strategy and perceived adaptive capacity of rural relocated households in Southern Shaanxi Province, China. China Popul. Resour. Environ. 2016, 26, 44–52. [Google Scholar]
- He, Y.B.; Huang, X.J.; Yang, X.J. Adaptation of land-Lost farmers to rapid urbanization in urban fringe: A case study of Xi’an. Geogr. Res. 2017, 36, 226–240. [Google Scholar]
- Mcdowell, J.Z.; Hess, J.J. Accessing adaptation: Multiple stressors on livelihoods in the bolivian highlands under a changing climate. Glob. Environ. Change 2012, 22, 342–352. [Google Scholar] [CrossRef]
- Rashmi, C.; Rathny, S. A theoretical analysis of the impact of public participation on satisfaction with livelihood-Based public services. Open J. Soc. Sci. 2019, 7, 243–258. [Google Scholar]
- Zhao, Z.H.; Huo, Z.X. The Impact of Rural Infrastructure Construction on Poverty Reduction in Poverty-Stricken Minority Areas—Empirical Research Based on 20 National Poverty-Stricken Counties in Inner Mongolia Autonomous Region. J. Hubei Minzu U Philos. Soc. Sci. 2020, 38, 68–76. [Google Scholar]
- Li, J.F.; Zhang, X.J.; Jin, K. Research on Land-Lost Farmers’ Social Security under the Sustainable Livelihoods Model: Based on the Positive Analysis of Henan Province. J. Aussie-Sino Stud. 2016, 2, 10–15. [Google Scholar]
- Singh, R.K.; Bhardwaj, R.; Sureja, A.K. Livelihood resilience in the face of multiple stressors: Biocultural resource-Based adaptive strategies among the vulnerable communities. Sustain. Sci. 2022, 17, 275–293. [Google Scholar] [CrossRef]
- Xu, Y.Y.; Xu, Z. Public Service Supply, livelihood capital conversion and the Formation of Relative Poverty an Empirical Analysis Based on CGSS2015 Data. J. Public Man. 2020, 17, 140–151. [Google Scholar]
- Sun, H.L.; Liu, R.L.; Liu, X.Z. Impact of Rural Construction on the Livelihood Sustainability of Households Lifted out of Poverty: Data Analysis of 2660 Pre poverty Families in Poverty stricken Areas. J. Northwest AF U Soc. Sci. Ed. 2020, 20, 56–57. [Google Scholar]
- Min, Y.Z.; Antonio, P.C. The quality and efficiency of public service delivery in the UK and China. Reg. Stud. 2015, 51, 285–296. [Google Scholar]
- Jiang, J.L.; Gong, L.Y.; Li, Y.H. Establishment and Empirical Analysis of Evaluation Index System for Basic Public Service Level of Transportation. MATEC Web. Conf. 2017, 124, 01004. [Google Scholar] [CrossRef]
- Li, Z.F.; Wei, F.Q. Research on Coupling and Coordinating Development of Urbanization Quality and Basic Public Services at Large Regional Scale: Take Shanxi Province as an example. J. Aussie-Sino Stud. 2019, 5. [Google Scholar]
- Wei, X. The Impact of Fiscal Public Service Expenditure on Labor Supply-Taking Guangdong Province as an Example. World Sci. Res. J. 2021, 7, 105–115. [Google Scholar]
- Wu, Y.Q.; Zhao, J.Q. Measurement of Regional Basic Public Service Integration Level. Econ. Manag. 2017, 31, 11–16. [Google Scholar]
- Gumah, B.; Aziabah, M.A. “Our Lives Are Affected by Government Agencies”: Citizens’ Perception Survey as a Measure of Public Service Efficiency in Ghana. SAGE Open 2020, 10, 1–10. [Google Scholar] [CrossRef]
- Rey, M.M.; Medina, M.C.; Barrera, B.R. Multichannel strategies in public services: Levels of satisfaction and citizens’ preferences. Int. Rev. Pub. Non. Mark. 2018, 15, 9–24. [Google Scholar]
- Grothmann, T.; Patt, A. Adaptive capacity and human cognition: The process of individual adaptation to climate change. Global Environ. Change 2005, 15, 199–213. [Google Scholar] [CrossRef]
- Liu, S.M. Types and structural differences of farmers’ public service needs in ethnic areas. Gansu Soc. Sci. 2016, 6, 172–177. [Google Scholar]
- Chambers, R.; Conway, G.R. Sustainable Rural Livelihoods: Practical Concepts for the 21st Century. In IWMI Books Reports; IDS: Brighton, UK, 1991. [Google Scholar]
- Zhang, Q.; Zhao, X.Y.; Wang, Y.R. Adaptation needs of farmers to climate change in an ecologically vulnerable alpine region: Take Gannan Plateau for example. Acta. Ecol. Sin. 2017, 37, 1688–1698. [Google Scholar]
- Wen, Z.L.; Ye, B.J. Mediated effects analysis; Methodology and model development. Adv. Psychol. Sci. 2014, 22, 731–745. [Google Scholar] [CrossRef]
- Gansu Provincial Forestry Survey and Planning Institute. Ecological Protection and Construction Plan of the Important Water Recharge Ecological Function Area of the Yellow River in Gannan, Gansu (2006–2020). 2007. Available online: http://fzgg.gnzrmzf.gov.cn/info/1024/1301.htm (accessed on 14 March 2022).
- Xiao, Y.C.; Zhong, D.N. The impact of basic public service supply on urban-Rural income gap: A perspective based on different income sources. J. Southwest U Natl. Hum. Soc. Sci. Edit. 2020, 41, 105–114. [Google Scholar]
- Liu, W.B.; Yu, X.Y.; Yuan, P.J. The impact of industrial poverty alleviation on livelihood strategies and income levels of poor farmers in ethnic areas. Econ. Geogr. 2019, 39, 175–182. [Google Scholar]
- Ibrahim, S.S. Livelihood transition and economic well-Being in remote areas under the threat of cattle rustling in Nigeria. GeoJournal 2022, 89, 1–16. [Google Scholar] [CrossRef]
- Guo, X.L.; Zhou, L.H.; Chen, Y.; Gu, M.; Zhao, M.M. Analysis on the adaptability of farmers to ecological and environmental changes and the driving factors in the inner mongolia autonomous region. Acta. Ecol. Sinica. 2018, 38, 7629–7637. [Google Scholar]
- Pandey, R.; Jha, S.K.; Alatalo, J.M.; Archie, K.M.; Gupta, A.K. Sustainable livelihood framework-Based indicators for assessing climate change vulnerability and adaptation for Himalayan communities. Ecol. Indic. 2017, 79, 338–346. [Google Scholar] [CrossRef]
- Malakar, K.; Mishra, T.; Patwardhan, A. Perceptions of multi-Stresses impacting livelihoods of marine fishermen. Mar. Policy 2018, 97, 41–49. [Google Scholar] [CrossRef]

| Indicators | Measurement Issues | Indicator Assignment | Average Value | Standard Deviation |
|---|---|---|---|---|
| Perceived self-efficacy | How is your ability to adapt? | Cannot at all 1; generally 3; definitely can 5 | 2.32 | 0.73 |
| Adaptation cost perception | Do you think the budgetary cost of adaptation actions is high? | Very low 1; generally 3; very high 5 | 3.42 | 0.83 |
| Adaptation efficacy perception | What are the expected outcomes of your adaptation actions? | No effect 1; general 3; very good effect for 5 | 3.11 | 0.82 |
| Tier 1 Indicators | Specific Public Service Content | Measurement Issues |
|---|---|---|
| Security-based Public service delivery | County/township/village security duty point construction | Are you satisfied with the way the police station works? |
| Rural legal aid | Are you satisfied with the county government’s legal aid public welfare activities? | |
| Natural disasters and sudden crisis management | Are you satisfied with the county government’s disaster relief services and relief measures? | |
| Development-based Public service delivery | Rural public employment guarantee | Are you satisfied with the free non-farm jobs and skills training provided? |
| Agricultural science and technology extension and training | Are you satisfied with the government’s agricultural technology training? | |
| Rural infrastructure development | Are you satisfied with the transportation, postal and commercial services around your home? | |
| Culture-based Public service delivery | Rural public sports facilities and activities | Are you satisfied with the fitness equipment and public sports Competitions in the village square? |
| Famous cultural heritage activities | Are you satisfied with the public performance and publicity activities of the county art troupe in the village? | |
| Ecological-based Public service delivery | Uniform treatment of household waste | Are you satisfied with the service of unified domestic waste disposal? |
| Sanitary toilets in agricultural and pastoral villages | Are you satisfied with the sanitary toilets built by the government for free? | |
| Livelihood-based Public service delivery | Rural social security | Are you satisfied with the premiums and coverage of the new social insurance? |
| Popularization of safe drinking water in farming and herding villages | Are you satisfied with the convenience and quality of your own home drinking water? | |
| Rural public health and medical care | Are you satisfied with the level of doctors’ treatment and medical facilities in the village health center? | |
| Rural compulsory education | Are you satisfied with the teaching and student recreational activities in the township schools? | |
| Administrative villages through hardened roads | Are you satisfied with the quality and accessibility of the hardened roads around your home? |
| Dependent Variable | Indicator Weights and Assignment | Average Value | Standard Deviation | |
| Livelihood adaptive capacity | Perceived self-efficacy + Perceived cost of adaptation + Adaptation efficacy perception; Strong adaptive capacity OR poor adaptive capacity assign 0 or 1 | 0.067 | 0.251 | |
| Independent Variable | ||||
| Satisfaction with Livelihood-based public services | “Very dissatisfied” to “very satisfied” assignment 1–5 | 3.56 | 0.90 | |
| Satisfaction with Development-based public services | “Very dissatisfied” to “very satisfied” assignment 1–5 | 3.52 | 0.92 | |
| Satisfaction with Culture-based public services | “Very dissatisfied” to “very satisfied” assignment 1–5 | 3.72 | 0.84 | |
| Satisfaction with Ecological-based public services | “Very dissatisfied” to “very satisfied” assignment 1–5 | 3.51 | 0.90 | |
| Satisfaction with Security-based public services | “Very dissatisfied” to “very satisfied” assignment 1–5 | 3.51 | 0.94 | |
| Intermediate Variables | Indicator Meaning | Weights | Average Value | Standard Deviation |
| Natural Capital | Arable land area per capita (mu) | 0.47 | 1.53 | 6.50 |
| Grassland area per capita (mu) | 0.53 | 11.46 | 31.35 | |
| Human Capital | 0 for non-labor force; 0.5 for half labor force; 1.0 for full labor force | 0.44 | 4.12 | 1.21 |
| 0 for illiterate; 0.25 for elementary school; 0.5 for junior high school and school leavers; 0.75 for high school; 1.0 for college and above | 0.56 | 1.27 | 0.89 | |
| Social Capital | Number of public officials among relatives (persons) | 0.40 | 0.94 | 0.43 |
| The number of relatives in the village is 1 for many; 0.75 for more; 0.5 for more; 0.25 for less; and 0 for less | 0.60 | 0.56 | 0.26 | |
| Financial Capital | Household cash income | 0.65 | 5987.34 | 6213.32 |
| There is a loan opportunity for 1; none is 0 | 0.35 | 0.57 | 0.51 | |
| Number of livestock | 0.68 | 196.32 | 332.76 | |
| Physical Capital | The number of fixed assets items as a percentage of the number of items listed | 0.32 | 0.34 | 0.17 |
| Control Variables | Indicator Weights and Assignment | Average Value | Standard Deviation | |
| Age of head of household | Actual observations (years) | 42.50 | 11.36 | |
| Family Size | Total family size (persons) | 5.50 | 1.21 | |
| Non-farm employment share | Non-farm payroll employment/total household size (%) | 0.54 | 0.26 | |
| Traffic conditions | Very poor = 1; poor =2; fair = 3; good = 4; very good = 5 | 3.14 | 1.23 | |
| Economic Development Level | Very poor = 1; poor = 2; fair = 3; good = 4; very good = 5 | 1.72 | 0.94 | |
| Functional Area Name | Construction Tasks | Ecological Construction and Public Services | Specific Name | Administrative Area (County) |
|---|---|---|---|---|
| Key Protected Areas | No grazing, hunting, logging; all development and utilization activities are prohibited in the area; forest and grass vegetation is restored through measures such as closure and management | Comprehensive management of degraded grasslands; Wetland Conservation and Restoration Grassland and Forest Conservation Biodiversity Conservation Research | Taohe forest ecosystem protection District | Hezuo, ZhuoNi, LinTan |
| Shouqu Wetland Ecosystem Conservation District | Maqu | |||
| Gahai-Zecha National Nature Reserve | Luqu | |||
| Animaqing Mountain Grassland Ecosystem Conservation District | Maqu | |||
| Daxia River Headwaters Grassland Ecosystem Conservation District | Xiahe | |||
| Restoration of treatment areas | The region implements grass-based livestock, grazing rest and rotation, focusing on the implementation of “three” grass management, forest and wetland and wildlife protection measures, and at the same time, the implementation of concentrated settlement of herdsmen to reduce the pressure of grass carrying | Comprehensive management of degraded grasslands; livestock warming shed construction; barley production base and other ecological agriculture and animal husbandry construction; pastoralist training in applicable technology | Ganjia-Zuogai Manma grassland restoration and management District | Xiahe, Hezuo |
| Animaqing Mountain Grassland Ecological Restoration and Management District | Maqu | |||
| Amuquhu grassland ecological restoration and management District | Xiahe | |||
| Jiamaogong-Taoyan Ecological Restoration and Management District | Hezuo, ZhuoNi, LinTan | |||
| Xiqingshan Ecological Restoration and Management District | Luqu | |||
| Zuogai-duoma wetland ecological restoration and management District | Hezuo | |||
| Economic Demonstration areas | The region is centered on the county town and linked by national and provincial highways. Development of cattle and sheep fattening, breeding and tourism industries with livestock products processing as the main focus | Nomadic settlement construction; dairy farming; cattle and sheep fattening; pastoralist training in applicable technology; biogas digester construction; human and animal water diversion | Maqu County Economic Model District | Maqu |
| Xiahe-Cooperative Economy Model District | Xiahe, Hezuo | |||
| Luqu Economic Model District | Luqu | |||
| Lintan-Zhuoni Economic Model District | Lintan, Zhuoni |
| Variable Name | Farmers’ and Herders’ Livelihoods Adaptive Capacity |
|---|---|
| Constants | −0.990 ** (0.052) |
| Satisfaction with livelihood-based public service delivery | 0.124 ** (0.020) |
| Satisfaction with development-based public service delivery | 0.133 ** (0.026) |
| Satisfaction with Culture-based Public Service delivery | 0.109 ** (0.017) |
| Satisfaction with ecological-based public service delivery | 0.114 ** (0.014) |
| Satisfaction with security-based public service delivery | 0.108 (0.015) |
| Age of head of household | 0.004 ** (0.001) |
| Family size | 0.007 ** (0.013) |
| Non-farm employment share | 0.057 ** (0.020) |
| Traffic conditions | 0.023 ** (0.024) |
| Economic Development Level | 0.086 ** (0.022) |
| Sample size | 334 |
| R2 | 0.813 |
| Adjust R2 | 0.819 |
| F-value | F(12, 332) = 185. 183, p = 0.000 |
| Variable Name | Human Capital | Social Capital | Natural Capital | Physical Capital | Financial Capital | Adaptive Capability |
|---|---|---|---|---|---|---|
| Constants | 3.029 (0.221) | 0.188 (0.231) | 0.914 (0.516) | 0.018 (0.065) | −1.067 (0.229) | −0.515 (0.066) |
| Public Service delivery | 0.232 ** | 0.313 ** | 0.152 * | 0.228 ** | 0.230 ** | 0.056 |
| Human Capital | 0.133 ** | |||||
| Social Capital | 0.051 ** | |||||
| Natural Capital | 0.051 * | |||||
| Physical Capital | 0.044 ** | |||||
| Financial Capital | 0.130 ** | |||||
| Sample size | 334 | 334 | 334 | 334 | 334 | 334 |
| Control variables | Controlled | Controlled | Controlled | Controlled | Controlled | Controlled |
| Adjust R2 | 0.813 | 0.785 | 0.913 | 0.774 | 0.731 | 0.729 |
| F-value | F(12, 332) = 24.183, p = 0.000 | F(12, 332) = 35.113, p = 0.000 | F(12, 332) = 30.183, p = 0.000 | F(12, 332) = 41.283, p = 0.000 | F(12, 332) = 49.083, p = 0.000 | F(12, 332) = 285.144, p = 0.000 |
| Item | a1 (Total Effect) | b1c2 (Intermediary Effect) | c1 Direct Effect | Effectiveness Ratio Calculation Formula | Percentage of Each Effect/% |
|---|---|---|---|---|---|
| Human Capital | 0.125 | 0.031 | 0.056 | ab/c | 12.754% |
| Social Capital | 0.125 | 0.016 | 0.056 | ab/c | 24.795% |
| Natural Capital | 0.125 | 0.008 | 0.056 | ab/c | 6.181% |
| Physical Capital | 0.125 | 0.010 | 0.056 | ab/c | 7.981% |
| Financial Capital | 0.125 | 0.030 | 0.056 | ab/c | 10.210% |
| Variable Name | Farmers and Herderss Livelihoods Adaptive Capacity |
|---|---|
| Public Service delivery | 0.039 * (4.043) |
| Human Capital | 0.048 ** (1.760) |
| Social Capital | 0.034 * (2.663) |
| Natural Capital | 0.043 ** (2.113) |
| Physical Capital | 0.046 ** (5.663) |
| Financial Capital | 0.124 ** (6.132) |
| Control variables and constant terms | Controlled |
| R2 | 0.956 |
| Adjusting R2 | 0.953 |
| F-value | F(12, 158) = 283.221, p = 0.000 |
| Variable Name | I Livelihood Adaptation Capacity | Variable Name | II Livelihood Adaptation Capacity | Variable Name | Livelihood Adaptability |
|---|---|---|---|---|---|
| Adaptive Perception | 0.173 ** (0.049) | Public Service delivery | 0.142 ** (0.014) | Public Service delivery | 5.119 * (2.441) |
| Human Capital | 0.023 ** (0.034) | Human Capital | 0.089 ** (0.031) | Human Capital | 6.112 * (6.114) |
| Social Capital | 0.039 ** (0.011) | Social Capital | 0.039 ** (0.015) | Social Capital | 2.781 ** (7.110) |
| Natural Capital | −0.045 ** (0.015) | Natural Capital | −0.072 (0.011) | Natural Capital | −4.008 ** (−6.213) |
| Physical Capital | −0.127 ** (0.018) | Physical Capital | −0.168 ** (0.019) | Physical Capital | −8.221 ** (6.213) |
| Financial Capital | 0.042 ** (0.004) | Financial Capital | 0.062 ** (0.007) | Financial Capital | 2.991 ** (7.891) |
| Control variables and constant terms | Controlled | Delete control variables | Deleted | Control variables and constant terms | Controlled |
Publisher’s Note: MDPI stays neutral with regard to jurisdictional claims in published maps and institutional affiliations. |
© 2022 by the authors. Licensee MDPI, Basel, Switzerland. This article is an open access article distributed under the terms and conditions of the Creative Commons Attribution (CC BY) license (https://creativecommons.org/licenses/by/4.0/).
Share and Cite
Zhong, F.; Ying, C.; Fan, D. Public Service Delivery and the Livelihood Adaptive Capacity of Farmers and Herders: The Mediating Effect of Livelihood Capital. Land 2022, 11, 1467. https://doi.org/10.3390/land11091467
Zhong F, Ying C, Fan D. Public Service Delivery and the Livelihood Adaptive Capacity of Farmers and Herders: The Mediating Effect of Livelihood Capital. Land. 2022; 11(9):1467. https://doi.org/10.3390/land11091467
Chicago/Turabian StyleZhong, Fanglei, Caoji Ying, and Di Fan. 2022. "Public Service Delivery and the Livelihood Adaptive Capacity of Farmers and Herders: The Mediating Effect of Livelihood Capital" Land 11, no. 9: 1467. https://doi.org/10.3390/land11091467
APA StyleZhong, F., Ying, C., & Fan, D. (2022). Public Service Delivery and the Livelihood Adaptive Capacity of Farmers and Herders: The Mediating Effect of Livelihood Capital. Land, 11(9), 1467. https://doi.org/10.3390/land11091467