Article

Evaluation of MODIS, Climate Change Initiative, and CORINE Land Cover Products Based on a Ground Truth Dataset in a Mediterranean Landscape

by
Margarita Bachantourian
1,
Kyriakos Chaleplis
2,
Alexandra Gemitzi
3,*,
Kostas Kalabokidis
4,
Palaiologos Palaiologou
5 and
Christos Vasilakos
4
1
Department of Kassandra Forest Service, Hellenic Forest Service, Hellenic Ministry of Environment and Energy, 63077 Kassandria, Greece
2
Department of Kassandra Fire Service, Hellenic Fire Service, 63077 Athitos, Greece
3
Department of Environmental Engineering, Democritus University of Thrace, 67100 Xanthi, Greece
4
Department of Geography, University of the Aegean, 81100 Mytilene, Greece
5
Department of Forestry and Natural Environment Management, Agricultural University of Athens, 36100 Karpenisi, Greece
*
Author to whom correspondence should be addressed.
Land 2022, 11(9), 1453; https://doi.org/10.3390/land11091453
Submission received: 27 July 2022 / Revised: 23 August 2022 / Accepted: 28 August 2022 / Published: 1 September 2022

Abstract

:
Land cover can reflect global environmental changes if their associated transitions are quantitatively and correctly analysed, thus helping to assess the drivers and impacts of climate change and other applied research studies. It is highly important to acquire accurate spatial land cover information to perform multidisciplinary analyses. This work aims at estimating the accuracy of three widely used land cover products, the Moderate Resolution Imaging Spectroradiometer (MODIS) land cover product (MCD12Q1), the European Space Agency Climate Change Initiative land cover (ESA-CCI-LC), and the EU CORINE land cover (CLC), all for the reference year of 2018, by comparing them against a fine resolution land cover dataset created for this study with combined ground surveys and high-resolution Large Scale Orthophotography (LSO 25/2015). Initially, the four datasets had their land cover classes harmonized and all were resampled to the same spatial resolution. The accuracy metrics used to conduct the comparisons were Overall Accuracy, Producer’s Accuracy, User’s Accuracy, and the Kappa Coefficient. Comparisons with the reference dataset revealed an underestimation of the forested areas class in all three compared products. Further analysis showed that the accuracy metrics were reasonably high for the broad classes (forest vs. non-forest), with an overall accuracy exceeding 70% in all examined products. On the contrary, in the detailed classification (total land cover mapping), the comparison of the reference dataset with the three land cover products highlighted specific weaknesses in the classification results of the three products, showing that CLC depicted more precisely the landscape characteristics than the two other products, since it demonstrated the highest overall accuracy (37.47%), while MODIS and ESA-CCI-LC revealed a percentage that did not exceed 22%.

1. Introduction

Several environmental assessments and applications, such as land degradation, habitat and ecosystem studies, hazard mitigation, hydrological, and land surface models are based on land cover datasets. The quality of their outputs is controlled by the accuracy of the land cover classification and its ability to describe the landscape variability [1,2,3,4]. Climate change is also affected by land use/land cover (LULC) changes, as indicated in the Special Report on land use, land use change, and forestry, of the Intergovernmental Panel on Climate Change (IPCC) [5], where annual emissions from LULC changes from 1980 to 1995 equal to approximately 25% of those emitted from fossil fuel combustion and cement production.
Nowadays, with the wide acceptance of remote sensing and the open research data policies adopted by the U.S. and EU space agencies, several global land cover datasets are available in various spatial and temporal scales from different classification schemes. Thus, coarser resolution land cover products are available at the global scale, while finer resolution products are generated at local or regional scales. Global land cover datasets comprise the MODIS land cover, more precisely MCD12Q1 v006 [6], which includes five legacy classification schemes with an annual time step from 2001 to present, at 500 m spatial resolution. The GlobaLand30 [7] is a fine-resolution (30 m) global land cover product that does not have an annual update rate, produced only for the reference years of 2000, 2010, and 2017 as its latest updates. The GlobCover project [8,9] is an ESA initiative that provided a global 300-m land cover dataset covering two periods, December 2004 to June 2006 and January to December 2009. The classification is compatible with the FAO Land Cover Classification System (FAO LCCS) and its accuracy has been reported to be between 73% to 79% [9]. Another global land cover dataset is the Global Land Cover 2000 (GLC2000 global) [10], equivalent to the International Geosphere–Biosphere Programme (IGBP) classification system. The GLC2000 uses 22 land cover types at 1 km2 spatial resolution. Although this dataset is not regularly updated, it can be used as a reference land cover assessment. The ESA’s Climate Change Initiative released a global land cover (ESA-CCI-LC) product with a spatial resolution of 300 m, updated annually from 1992 to 2020, and evaluated in various scales for different areas around the world [11]. It was found to be a consistent dataset suitable for the identification of land cover transitions at national, continental, and global scales [12,13,14]. Other land cover products that have been produced at finer spatial scales with continental or national coverage include the EU CORINE land cover (CLC) [15] for Europe and the US National Land Cover Database [16].
Previous studies have dealt with the accuracy assessment and inter-comparison of various land cover datasets. Aune-Lundberg and Strand [17] estimated the accuracy of CLC2018 in Norway by comparing it against several national land cover datasets. They concluded that there are certain discrepancies between CLC2018 and more detailed datasets, however, considering its generalized character, the accuracy for the broad Norwegian classes was satisfactory, and only classes that cover a small part of the country were detected with lower accuracy. Büttner [15] reported a thematic accuracy of >85% for CLC2000, while CLC2006 and CLC2012 have also been reported with similar accuracy. The CLC2000 was also verified against the European Land Use/Cover Area Frame Statistical Survey (LUCAS) across 15 European Union countries, and its overall percentage of total agreement was found to be 74.8%, whereas for the forest land cover category the performance was even better (83.3%) [18]. An inter-comparison study of three land use/land cover datasets (i.e., a national land use inventory, CLC2000 and a Landsat 5 TM classification) in two case studies in Germany reported an overall accuracy ranging from 69% to 87%, while the agreement of individual land cover classes demonstrated higher variability, with forest, urban, and traffic areas performing better compared to open land (arable land, pastures and meadows, fallow) [19]. A comparison of GLC2000 and CLC2000 indicated many dissimilarities between the two datasets, and highlighted issues that arise when comparing land cover datasets of different resolution and land cover definitions [20]. A comparison study for the tundra–taiga transition zone in northern Finland of three land cover datasets, namely, the MODIS IGBP [21], the tree cover layer of the MODIS vegetation continuous fields product (MODIS-VCF), and the Global Land Cover 2000 Northern Eurasia map (GLC2000-NE), with the Finnish CORINE Land Cover 2000 map indicated the uncertainty of the tree cover estimates in all three examined products, while the forest vs. non-forest boundaries were accurately mapped.
The need for reliable land cover information has been underscored in many previous research works, not only within the framework of climate change but also regarding the protection of biodiversity and wetlands, for the assessment and mitigation of desertification, and for the planning of targeted policy measures that will help with managing the observed changes in a timely manner [22,23]. Reliable land cover products are also of paramount importance for acquiring information related to the future of the Earth’s surface, through projections of the observed land cover changes to future periods [24]. Although it is recognized that a breakthrough in Earth Observing missions has been achieved, providing an unprecedented abundance of monitoring data and an associated production of high quality freely available global and continental land cover products, it is also widely accepted that they still lack the required applicability to meet the wide variety of user needs in terms of spatial and temporal resolution, types, and number of land cover classes [23]. Currently, the various land cover products use information from different sensors and implement different classification techniques, with their respective advantages and limitations, resulting in variations in spatial and temporal resolution and classification nomenclature. Thus, such products are difficult to harmonize, and they contain inconsistencies at global and regional scales, limiting their applicability [22].
Considering the importance of accurate land cover information for many research areas and applications (e.g., climate change, hydrology, ecology, biodiversity, and fire science studies), the estimation of the uncertainty of land cover datasets in specific hydro-climatic zones, depicted as “hot spots” regarding climate change impacts [25] in Mediterranean landscapes, is critical. The aim of the present work was to provide a detailed accuracy assessment of three widely used land cover products—MODIS, CLC, and ESA-CCI-LC—and compare them to a detailed and highly accurate dataset produced with aerial interpretation over orthophotos and acquisition of ground truth information, collected during field surveys in a typical Mediterranean landscape of Greece for the reference year of 2018, specifically the western peninsula of Kassandra in the Chalkidiki Prefecture, Macedonia. To the best of our knowledge, the evaluation of these three datasets has not been performed before for this type of mixed and fragmented wildfire-prone ecosystem.
The MODIS Land Cover Type Product (MCD12Q1) Collection 6 (C6) provides a collection of five legacy classification schemes (International Geosphere-Biosphere Programme-IGBP; University of Maryland-UMD; Leaf Area Index-LAI; BIOME-Biogeochemical Cycles-BGC; and Plant Functional Types-PFT) and a three-layer legend based on the Land Cover Classification System (LCCS) from the Food and Agriculture Organization at 500-m spatial resolution and an annual time step. The MCD12Q1 product is created using supervised classification of MODIS nadir BRDF-adjusted surface reflectance (NBAR) data. More specifically, the LCCS legend is a nested set of classifications based on new class information in the site database. It is also a Random Forest classifier for each layer of the hierarchy followed by post-processing steps that integrate prior probability knowledge and adjust specific classes based on ancillary information [26].
The CLC2018 product is derived from ortho-corrected Sentinel-2 and Landsat 8 for gap filling imagery. A computer-assisted image interpretation (CAPI) method was applied for deriving the land cover types from 2017 images by also using other ancillary information, such as: topographic maps; orthophotos; thematic maps; Land Parcel Identification System data; LUCAS field survey data, including landscape photographs from visited points; and other Very High-Resolution image data, such as Google Earth [27].
The CCI-LC maps are intended to be globally consistent, and their typology is defined by the United Nations (UN) Food and Agriculture Organization’s Land Cover Classification System (LCCS) (FAO). The UN-LCCS defines LC classes using a set of classifiers. The system was designed as a hierarchical classification, allowing thematic detail in the legend to be adapted to the amount of information available to describe each LC class, while adhering to a standardized classification approach. The product is based on the GlobCover unsupervised classification chain, but it also uses a machine learning approach and a multi-year strategy. In this manner, it aggregated both the spectral and temporal characteristics of the MERIS full resolution time series [28,29]. The characteristics of the four land cover products are presented in Table 1.

2. Materials and Methods
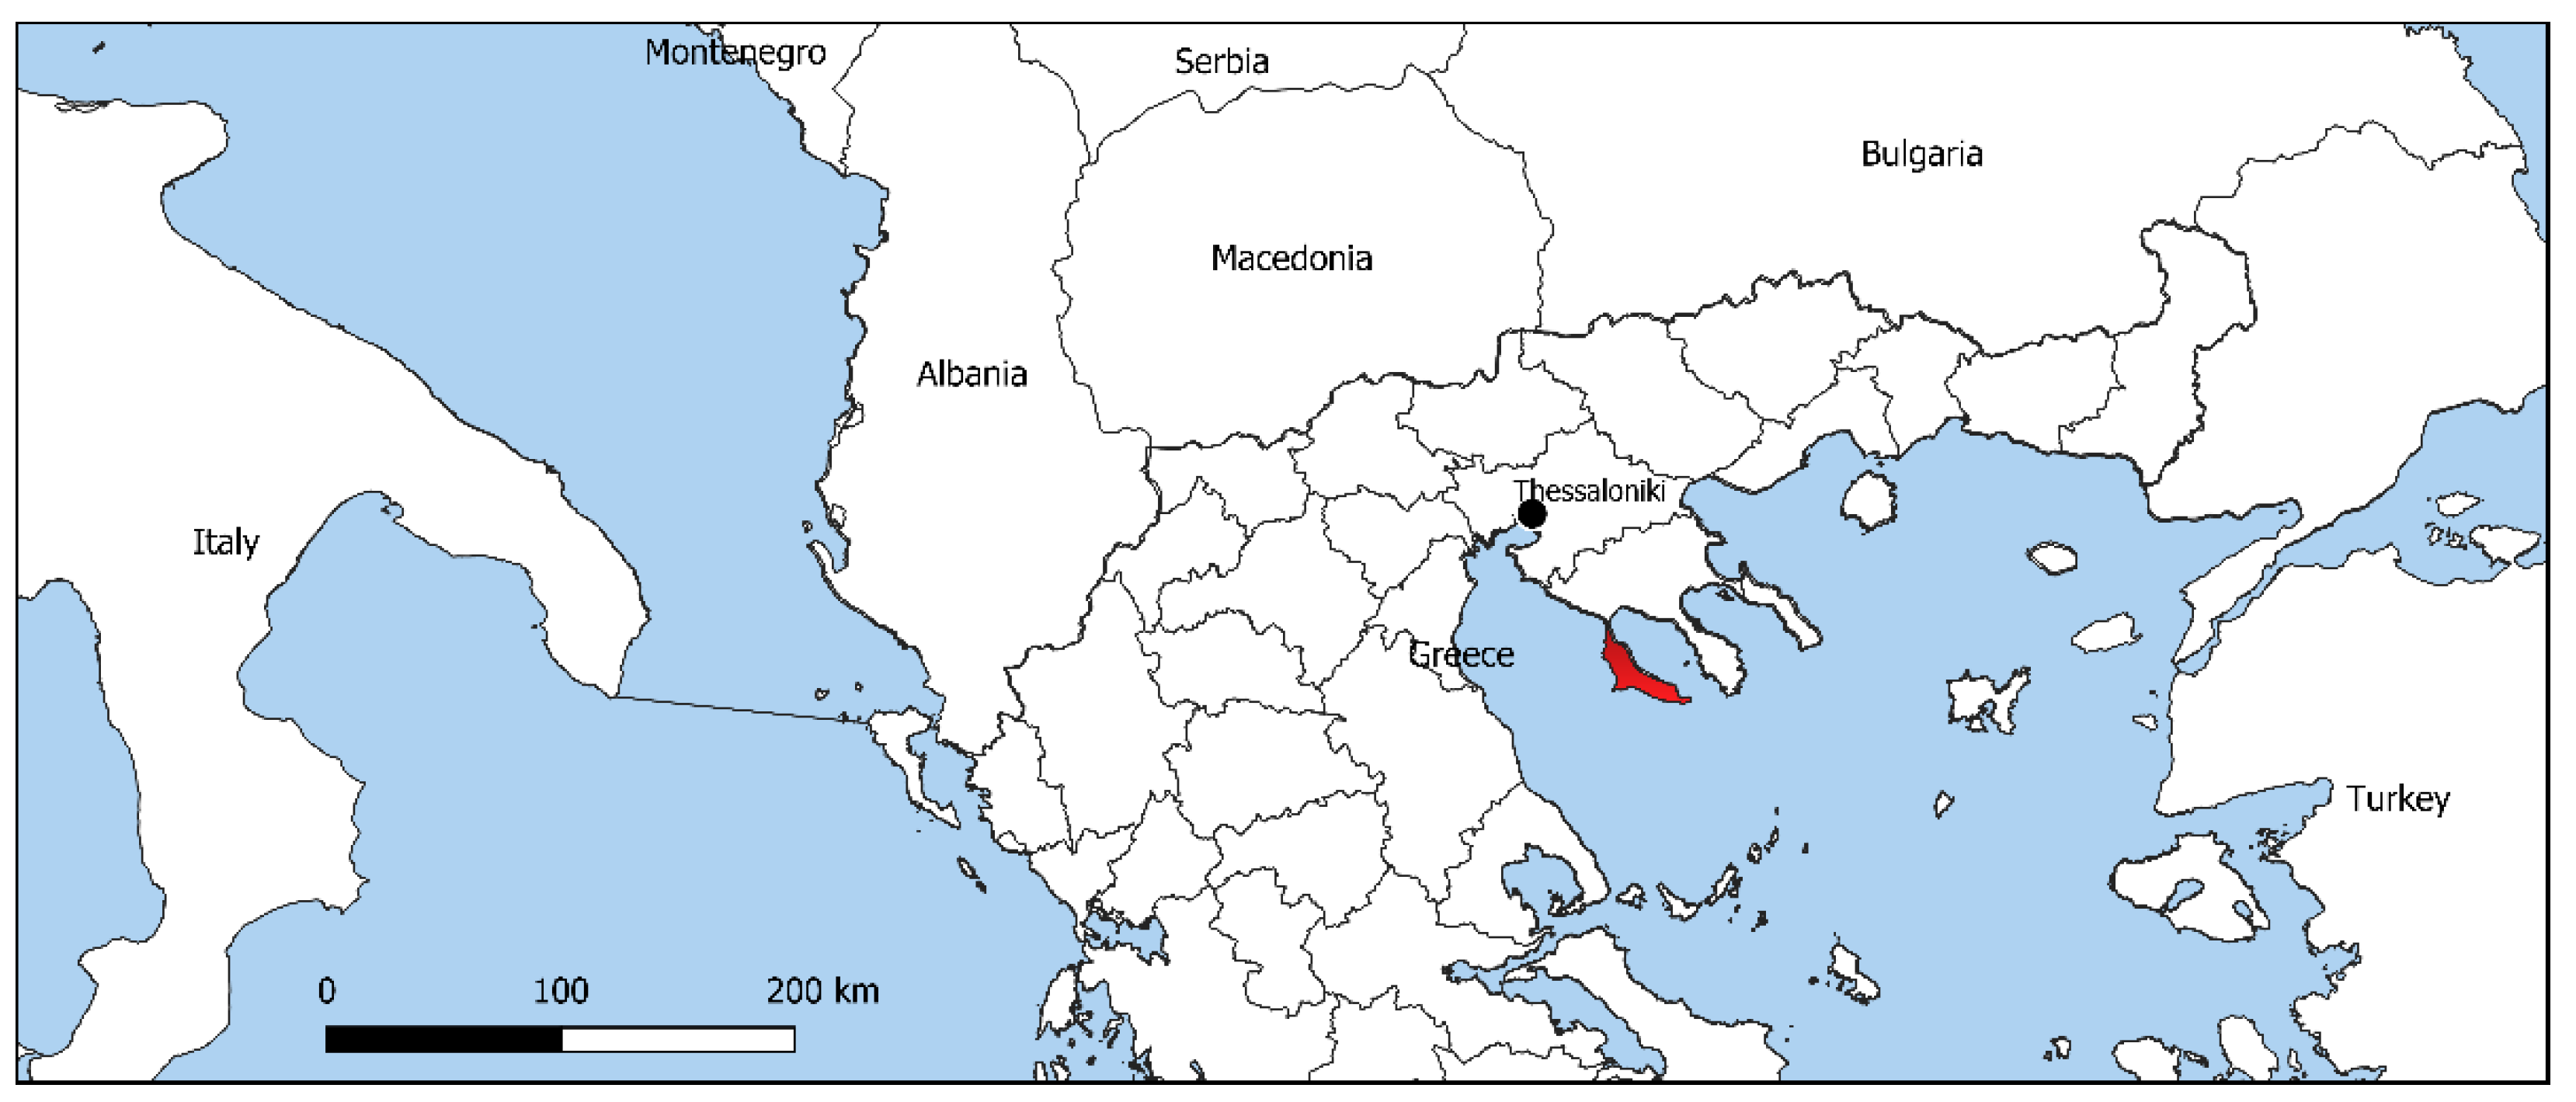
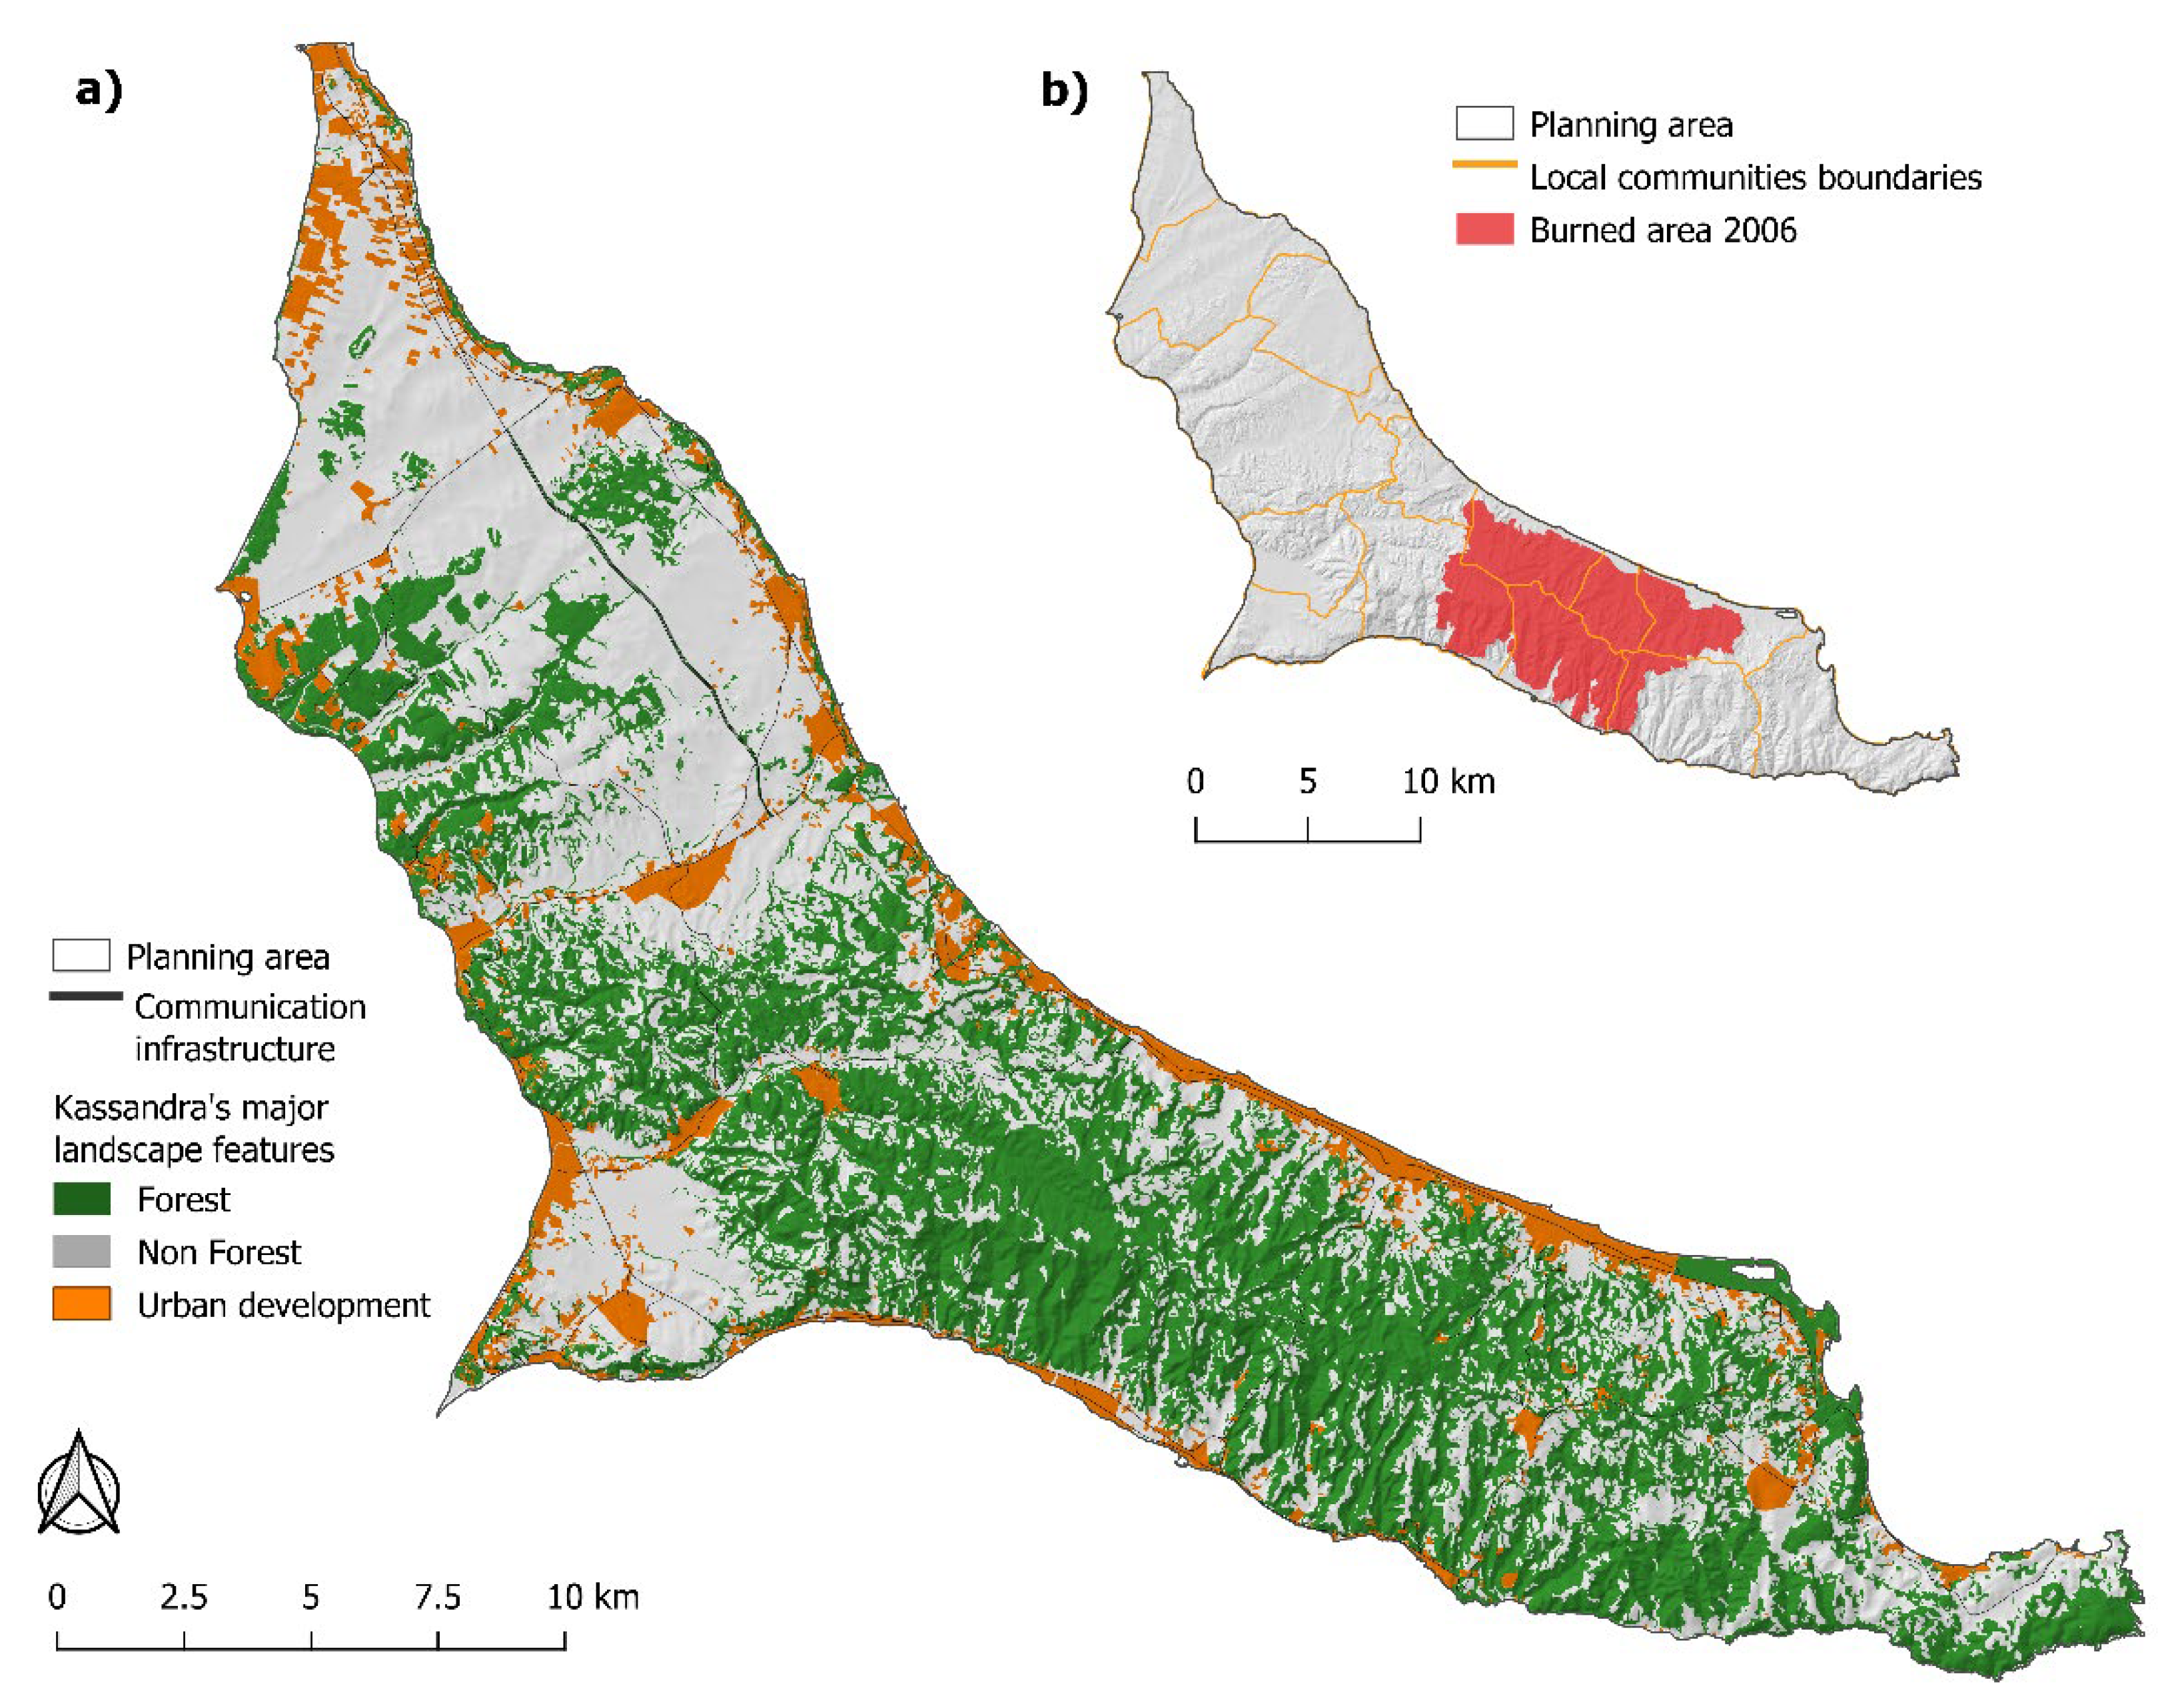
2.1. Study Area

Kassandra (350 km2) is located at the north-central part of Greece (Figure 1), about 60 km south of the large urban centre of Thessaloniki. Its climate is characterized as Mediterranean-type temperate, with relatively mild winters and dry hot summers. The mean annual rainfall is approximately 580 mm, and the mean temperature is about 16.7 °C, with the dry period lasting from May to September. The topography is rather gradual, apart from some isolated northwest-facing slopes that are steeper. The maximum altitude is approximately 320 m above sea level.
Kassandra is mostly covered (44%) with a fire-prone conifer species typical across the coastal Mediterranean areas, commonly named Aleppo pine (Pinus halepensis Mill.) (Figure 2a). Agricultural areas occupy approximately 44.5% of the study area, comprising mostly of olive trees (Olea europaea L.) and non-irrigated croplands. During the last decades, the trend of land use conversion in favour of residential developments for tourism and recreational use has transformed the dominant vegetation patterns of the peninsula into a widespread wildland–urban interface (WUI), with hundreds of dispersed recreational houses or hotels intermingled with the natural vegetation in approximately 10% of the study area. A large-scale lightning wildfire burned 20% of the study area in 2006, destroying an old mature Pinus halepensis forest (Figure 2b). Nowadays, most of the affected areas have been converted to maquis broadleaved evergreen Mediterranean shrubs (Quercus conferta Kit., Quercus ilex L. and Pistacia lentiscus L.).

2.2. Datasets and Analysis Inputs

2.2.1. The MODIS Land Cover Product

A global land cover product provided at an annual time step is the MODIS land cover, specifically the MCD12Q1v006 product, described in Sulla-Menashe et al. [26]. It has been used in many global and regional scale studies for quantification of land cover transitions, model land cover changes, or as a reference layer for the classification of Landsat images [30,31,32,33]. The spatial resolution of MODIS land cover is 500 m, which is quite restrictive for local scale applications; however, its extensive validation in many areas all over the world and the reported overall accuracy of 73.6% [6], combined with the annual update rate, make this specific land cover product a state-of-the-art dataset suitable to depict major land cover characteristics in various regions [24,34]. Five major land cover schemes developed by different research groups are incorporated in the MODIS land cover dataset as individual layers of information, namely, the Annual International Geosphere-Biosphere Program (IGBP) classification [35], the Annual University of Maryland (UMD) classification [36], the Annual Leaf Area Index (LAI) classification, the Annual BIOME-Biogeochemical Cycles (BGC) classification, and the Annual Plant Functional Types (PFT) classification. Additionally, three more land cover layers associated with the FAO LCCS are released as additional scientific datasets of this specific product. Among the five land cover schemes, the one provided by the International Geosphere Biosphere Programme (IGBP) is the most detailed one, identifying 17 land cover classes, and has been found to demonstrate the highest overall accuracy at the regional scale compared to the other four MODIS classification schemes [34].

2.2.2. The ESA-CCI-LC

The European Space Agency Climate Change Initiative (ESA CCI) [11] releases high quality land cover data at the global scale with a spatial resolution of 300 m, updated annually since 1992 (latest release: 2020). This is the longest period of global land cover data suitable to describe vegetation distribution for climate modelling. The ESA CCI land cover (ESA-CCI-LC) dataset is produced by merging information from a variety of Earth observation missions, e.g., the MERIS, SPOT-Vegetation, and AVHRR, and it categorizes land features into classes according to the land cover classification scheme defined by FAO. The ESA-CCI-LC quality has been assessed by various researchers with a reported overall accuracy of 73.2% [8], while for China this accuracy is 71.98% [37], with most validation efforts focused on the ESA-CCI-LC for 2010. Regarding the cropland classification of the 2013 ESA-CCI-LC release, overall accuracy has been reported to be 76.7% in Niger [38], whereas for Central and Eastern Europe an agreement of approximately 76% with CLC has been reported [39]. Two legend levels of information are incorporated in the ESA-CCI-LC maps. Level 1 corresponds to the global scale discretization scheme with 22 classes, whereas Level 2, known as regional level, assimilates regional information to define a higher level of detail in specific areas. Finally, ESA-CCI-LC is used worldwide to describe global vegetation changes and energy balance [40,41].

2.2.3. The CORINE Land Cover

The CLC [42] product is a result from an EU initiative aimed at the standardization of environmental information at the EU level. The first pan-European land cover dataset was the CLC1990, and was followed by the CLC2000. Since then, CLC has been updated every six years, i.e., in 2006, 2012, and 2018 (latest available update). The European Environmental Agency (EEA) supervises and provides guidance to the national teams in charge of the production of the national CLC datasets which form the parts of the pan-European CLC. The number of countries participating in the CORINE program was constantly increasing over time and currently, 32 EEA member countries along with the UK and six cooperating countries covering an area of approximately six million km2 are participating in the project. CLC categorizes land using a hierarchical classification system comprising 3 levels of detail, with level 3 being the most detailed with 44 classes allocated to five main land cover categories of the less detailed level 1, namely Artificial surfaces, Agriculture, Forests and Semi-Natural Areas, Wetlands, and Water, with a minimum mapping unit of 25 hectares and 100-m minimum mapping width [43]. Quality assessment had been implemented throughout the CLC period and the overall accuracy of the CLC2000 and its successors has been reported above the specific minimum of 85% [15].
The detailed description of the land cover classes of each examined product with the reference classification is available in Tables S1–S3 in Supplementary Material S1.

2.2.4. The KASSANDRA DATASET

The KASSANDRA DATASET is a research product with accurate land cover descriptions at a regional scale. It was developed to categorize vegetation types into forest fire fuel models suitable for fire behaviour modelling.
Field data were collected from 154 circular sampling plots (0.1 ha area each), allocated inside forest areas throughout the Kassandra peninsula. The centre of the sampling plot was recorded by GPS measurements (coordinates and elevation). Applying the principles and methods of forestry science [44], in each sample plot the representative tree of each diameter class was found by recording the diameter at breast height (DBH) of every tree with DBH > 8 cm. For each representative tree (about four trees by sampling plot), we measured the stand height (SH), the crown base height (CBH), i.e., the height at which a tree crown has sufficient fine diameter fuel to allow fire to propagate vertically into the crown [45], and the minimum and maximum diameter below the crown. The Canopy Cover (CC) of each plot was also estimated as the average of four measurements in the four peripheral trees of the circle using a spherical densitometer [46]. Additionally, for each sampling plot we recorded an accurate description of the forest composition (i.e., dominant species, coverage percentages) and physical conditions (i.e., weather damages, diseases). Overall, the forest inventory metrics and statistics based on terrestrial field samples are the only reliable sources of information for forested landscapes [47,48].
The above datasets were also combined with (a) the official digital vector layer from the Chalkidiki Forestry Cadastre [49], (b) the subsidized olive-producing areas vector layer [50], (c) the discontinuous urban developed areas vector layer [51], (d) the dominant wildfires for the period 1980–2021 vector layer [52], (e) the Kassandra’s road network line vector in three categories: main, rural, and forest roads [53], (f) forest stands vector layer, and (g) literature data, such as forestry management plans and fire protection plans. The discontinuous urban developed area of the peninsula shapefile (25,632 records) that includes villages, dispersed country houses, and hotel units, was created with the official shapefiles provided by the Hellenic Cadastre and ground surveys.
The final product eventuated as the combination of the above datasets; it is comprised of 6718 records and was verified by photointerpretation of high-resolution (0.25 × 0.25 m) Large Scale Orthophotography (LSO 25/2015) in natural colour [54]. Photointerpretation is acceptable in regional scale studies [55], and is a process that minimizes the generalizations and maximizes the accuracy of the final product. Coverage for the 12 land cover classes, in pixel sum, percentages, and km2 is shown in Table 2, which also includes summaries for five groups of KASSANDRA DATASET’s classes (Artificial surfaces, Agricultural areas, Forest, Wetlands and Barren) with their corresponding percentage.

2.3. Preparation of Datasets and Computed Metrics

To compare the KASSANDRA DATASET with different land cover databases (CLC, MODIS, ESA-CCI-LC) the products must be comparable in terms of nomenclature and actual vegetation or land cover type [56], and must be resampled to the same spatial resolution. Therefore, the KASSANDRA DATASET was reclassified to the respective class codes of the other three datasets. The harmonization procedure is illustrated in Table 3. The comparison study refers to the 2018 period for all land cover products, as it corresponds to the period where detailed ground information for the study area is collected and coincides with the latest version of CLC.
Coniferous forests in the KASSANDRA DATASET are represented by the land cover classes Coniferous forest/Treated (Code: kd161), Coniferous forest/Dwarf conifer (Code: kd164) and Coniferous forest (Code: kd165). For the comparison process, those types of forests were integrated into the class Coniferous forest (Code: 312) of CLC’s nomenclature, in the class Tree cover, needleleaved, evergreen, closed to open (>15%) (Code: 70) of ESA-CCI-LC’s nomenclature and in classes Evergreen Needleleaf Forests (Code: 1) and Woody Savannas (Code: 8) of MODIS’s nomenclature. Specifically, the KASSANDRA DATASET’s land cover classes Coniferous forest/Dwarf conifer (Code: kd164) and Coniferous forest (Code: kd165) were integrated into the class Evergreen Needleleaf Forests (Code: 1) and the class Coniferous forest/Treated (Code: kd161) into the class Woody Savannas (Code: 8).
The ESA-CCI-LC product land cover class of Cropland was based on the regional value instead of global value nomenclature [57], since areas have been classified as Cropland, rainfed, herbaceous cover (Code: 11) and as Cropland, rainfed, tree or shrub cover (Code: 12). To match Cropland (Code: kd101) of the KASSANDRA DATASET classification with the corresponding ESA-CCI-LC’s categories, and due to the lack of sufficient information to distinguish them into the subcategories Cropland, rainfed, herbaceous cover (Code:11) and Cropland, rainfed, tree or shrub cover (Code:12) only the global value nomenclature Cropland, rainfed (Code: 10) was used in the harmonization procedure. The classes in the CLC’s nomenclature: Road and rail networks and associated land (Code: 122), Mineral extraction sites (Code: 131), Beaches, dunes, and sand plains (Code: 331) and Bare rock (Code 332), correspond to the features depicted by the Bare ground (Code: kd99) category in the KASSANDRA DATASET.
The three datasets were downscaled to match the KASSANDRA DATASET’s land cover spatial resolution (30 × 30 m). Then, they were compared with the Kassandra land cover dataset by using the open plugin of QGIS named Semi-Automatic Classification Plugin (SCP) [58]. The thematic accuracy of the classification was calculated through specific accuracy measurements such as User’s Accuracy (UA), also known as reliability, which represents the percentage of map features that are actually present (true) on the ground, Producer’s Accuracy (PA), which quantifies the probability of the real ground features to be captured by a land cover classification. Another accuracy metric used is Overall Accuracy (OA), which is the proportion of overall sites that were mapped correctly, and the Kappa Coefficient (K), ranging from −1 to 1, that compares the classification performance to a random value assignment. Thus, a classification outcome with a Kappa Coefficient close to −1 performs considerably worse compared to a random classifier, whereas a value close to 1 corresponds to a classification that performs considerably better than a random value assignment [59]. In the comparison raster file, each value represents agreement or disagreement with the reference class.

3. Results

The spatial distribution of the dominant differences between the KASSANDRA DATASET2018 (reference dataset) and the three widely used land cover products is illustrated in Figure 3a–c. Comparisons revealed that the dominant differences are identified in the class of forest areas for all the three products (Table 4). Thus, a profound disagreement for CLC2018 was found in class Coniferous forests (Code: 312), which amounts to 18.55% of the total area. In particular, 8.28% of Coniferous forests are included in the class Land occupied mainly by agriculture with significant areas of natural vegetation (Code: 243) due to the complexity and variation of the case study’s land pattern. Forests alternate with crops in many parts of the study area and false classifications might have occurred in cells within the transition zone between those two land cover types. The class (Code: 243), which is non-existent in the KASSANDRA DATASET2018, appears overestimated in the CLC2018 product as a result of the unclear definition and the broad meaning of this land type; consequently, in the reference dataset those areas are divided into five different classes: Coniferous forest, Agricultural areas, Olive groves, Shrublands, and Discontinuous urban areas. Moreover, 18.56 km2 of the class Transitional woodland–scrub (Code: 324) in the CLC2018 product should be replaced by category Coniferous forest (Code: 312), since the recent field data indicated that herbaceous vegetation was initially substituted by shrubs 12 years after the 2006 wildfire, and then a successional young forest of Aleppo pine regeneration emerged in the study area. Furthermore, 17.26 km2 classified in the class Mixed Forests (Code: 313) of the CLC2018 classification to define some areas with Conifer forests, although the reference dataset indicates that this particular class does not occur in the study area. The observed difference between Mixed forests and Coniferous forests in CLC product is a valid and important finding. A possible explanation for that may be due to Kassandra’s coniferous forest stand structure (~60% canopy cover), having a dense understory of broadleaf evergreen shrubs. For the cases where the understory vegetation height of broadleaf evergreen shrubs surpasses the 2 m, these two forest types can be easily falsely classified by remotely sensed observations. However, they cannot be considered as Mixed forests. For such cases, ground observations like those provided in the present work constitute a precious source of information. Such misclassifications can potentially affect fire risk management practices, since they are different in Mixed forests compared to those in coniferous forests, which are far more fire-prone forest types.
The biggest difference for MODIS2018 was also found for the forest class, since a substantial part of the coniferous forests in this product’s central and southern part of Kassandra is represented by the classes Woody Savannas (Code: 8) and Savannas (Code: 9) instead of the ground truth class Evergreen Needleleaf Forests (Code: 1). This inconsistency is evident in 21.16% of the study area, and it might occur because the ground truth class Evergreen Needleleaf Forests that has been treated for either fire protection or disease reasons is falsely classified due to the low canopy cover and absence of understory. The underestimation of forest areas is also observed in the ESA-CCI-LC2018 product. Thus, 98.83 km2 of the classes Tree cover needle-leaved (Code: 70) and Tree cover broadleaved (Code: 50) (forest areas) were categorized in the class Shrublands (Code: 120), while an additional area of 10.65 km2 of the class (Code: 50) was depicted as the non-forest class Cropland rainfed (Code: 10) in the ESA-CCI-LC2018. One of the main reasons for this underestimation might be due to the different interpretations of how forest land cover is defined among various countries. A lower or higher tree (crown) cover threshold for example might differentiate different forest classes, as shown in previous work [48,60,61]. The cross comparison of the examined datasets with the reference classification is available in Tables S1–S3 in Supplementary Material S2.

3.1. Accuracy Metrics

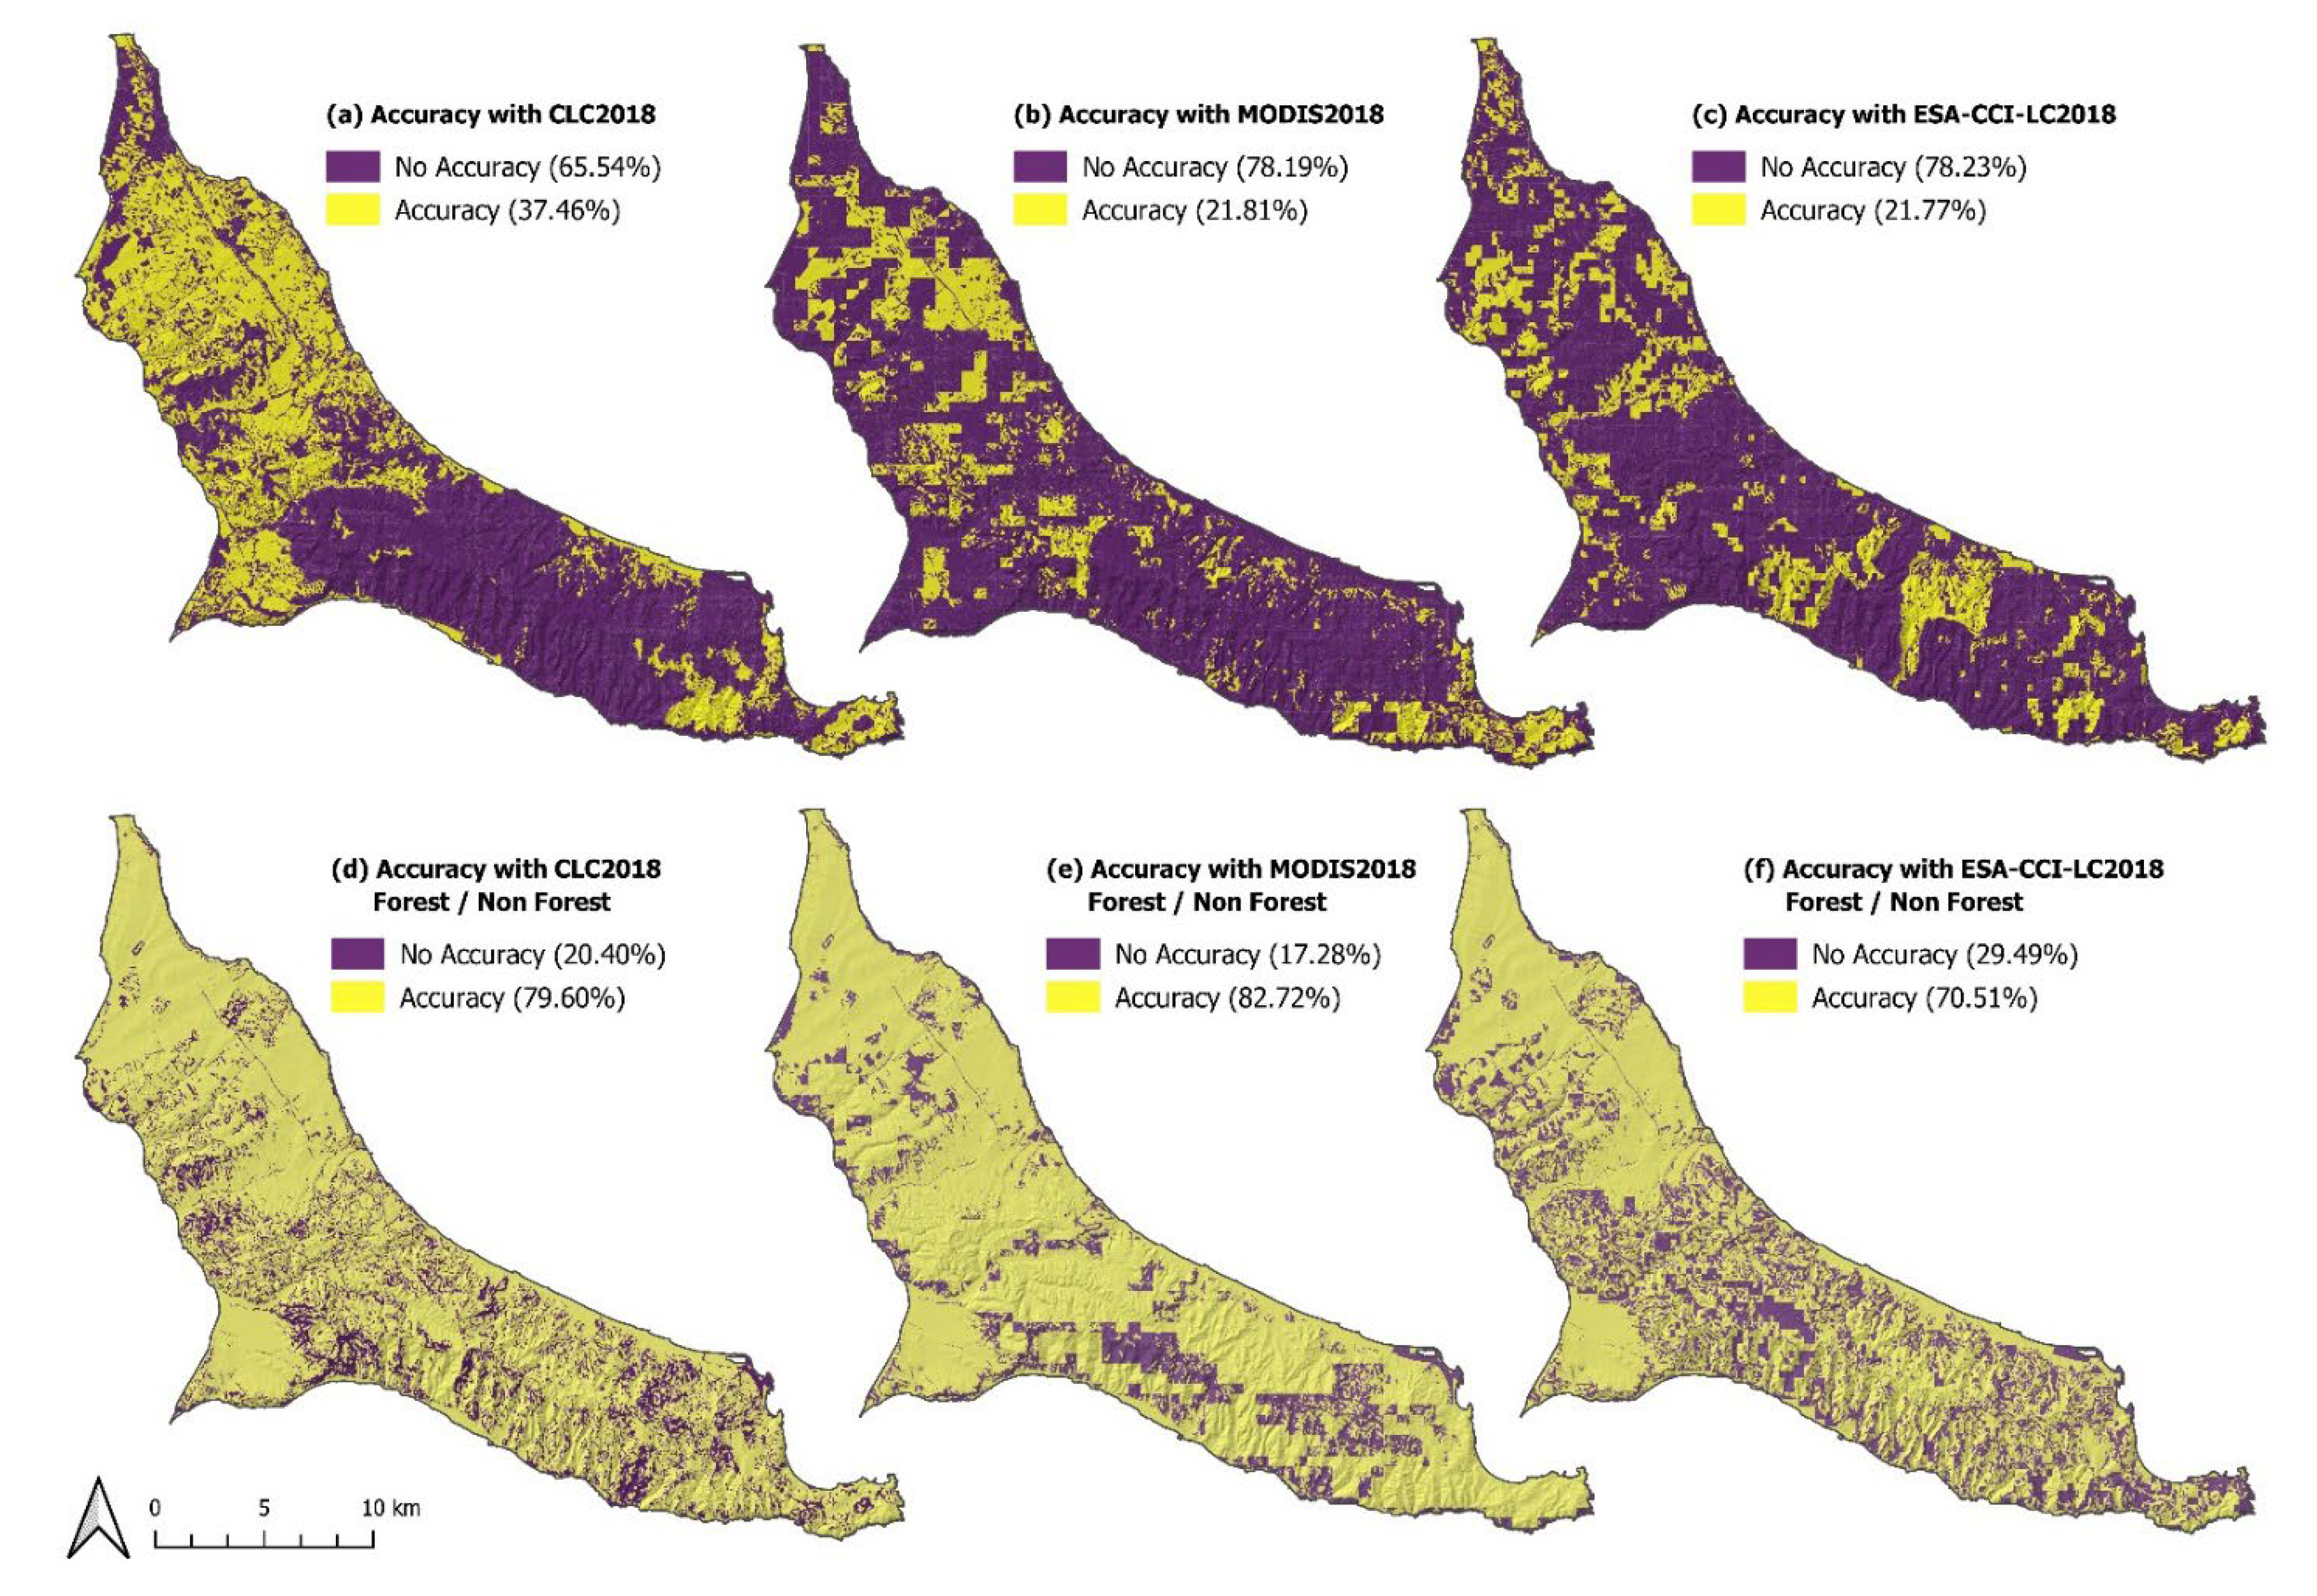
3.1.1. Analysis of Total Land Cover Mapping

Based on a comparison of the reference dataset with the three land cover products, CLC2018 demonstrated the highest overall accuracy of 37.47%, while MODIS2018 and ESA-CCI-LC2018 revealed similar percentages that did not exceed 22% (Table 5), indicating that CLC2018 depicted more precisely the characteristics of the landscape than the two other products. The reason for that might be the higher resolution and the more detailed cartographic representation that CLC2018 offers in comparison to MODIS2018 and ESA-CCI-LC2018. The spatial distribution of the agreement and differences of the total land cover mapping in the case of CLC2018 indicated inconsistencies in the southern part of the peninsula that is mainly occupied by forest areas. On the contrary, the inconsistencies observed for the other two products were evenly distributed throughout the study area (Figure 3a–c).
Table 5 also provides the accuracy metrics for the prevailing (exceeding 1% of the study area) land cover categories in the Kassandra peninsula for the three land cover datasets in comparison with the reference land cover dataset. The three land cover products provided high percentages of User’s Accuracy in forest land cover classes, which occupied the largest part of the study area in all land cover products (more than 100 km2). Thus, the correctly classified land for CLC2018 in the class of Coniferous forest (Code: 312) reached 79.12%, for MODIS2018 in the class of Evergreen Needleleaf Forests (Code: 1) the correctly classified area reached 61.27%, while for CCI2018 the forest class of Tree cover, needleleaf, evergreen, closed to open (>15%) (Code: 70) correct classification reached 73.06%. Regarding Producer’s Accuracy, the three land cover products provided generally lower percentages than those of UA. Thus, the PA exceeded 70% only for the CCI2018 product, for the class of Shrubland (Code: 120), while for CLC2018 the higher value of PA (62.27%) corresponds to the class of Discontinuous urban fabric (Code: 112). In the case of MODIS2018, the probability of the ground characteristics being displayed correctly on the map is low, since the highest PA is 33.04% and corresponds to the class of Woody Savannas (Code: 8). CCI2018 demonstrated the highest percentages for both UA and PA among the examined datasets, while its class Urban areas (Code: 190) provided 89.24% of the UA value and its class Shrubland (Code: 120), 71.45% of the PA value. The Kappa Coefficient was higher than 0 for all the land cover products, indicating better classification compared to random between the compared datasets, with the highest value being that of the CLC2018 product (0.27), while MODIS2018 and CCI2018 recorded lower values (0.12 and 0.11, respectively). The results for User’s and Producer’s Accuracy for each land cover class are reported in Table S4 in Supplementary Material S2.
A complete example of computing the accuracy metrics (UA, PA, OA, K) for one of the analysed datasets (MODIS2018), as well as an error matrix for the same case is shown in Table 6. According to the reference land cover dataset, for example, the classification of Evergreen Broadleaf Forests (Code: 2), and Permanent Wetlands (Code: 11) of MODIS2018 should not be present in the peninsula. The former class probably refers to limited areas of dense evergreen broadleaves that exceed 2 m height, while the second one seems to be an overestimation of the coastal areas, since the spatial analysis at coarser resolution may result in merging of the marine areas with the coastal forest ecosystems occupied mostly by evergreen vegetation. Sandy beaches, the main features of the peninsula, are not classified by any of the examined products.
The Discontinuous Urban Developed areas (villages, dispersed country houses, and hotel units) were underestimated by all three examined land cover products, due to their narrow shape, small size, and scattered polygons of that land type, with the CLC2018 providing better results, although far from the ground truth. Moreover, since every product has a minimum mapping unit e.g., in the case of the CLC product, it is 25 ha, smaller land parcels cannot be detected. Nevertheless, there are cases, e.g., the village of Kassandrino (50 ha) that has not been captured at all in the CLC product, which is a certain miss in CLC (Figure 4). Thus, even the CLC product cannot capture correctly the land development pattern that prevails across the coastal part of Greece, i.e., sparse blocks of buildings surrounded by various types of vegetation.
The peninsula’s wetlands, many of them being areas protected by national and international treaties, are not correctly categorized. Thus, in MODIS2018, they are categorized as Grasslands (Code: 10) and Croplands (Code: 12), in CLC2018 they are given as Salines (Code: 422) instead of Inland marshes (Code: 411), while they do not appear at all in ESA-CCI-LC2018.

3.1.2. Analysis of Forest vs. Non-Forest Areas

To investigate whether the three examined land cover products can effectively categorize land into the two broad categories, ‘forest’ and ‘non-forest’, the analysis was conducted reclassifying all products to those two broad land cover classes, using the following correspondence. The forest areas are represented in the KASSANDRA DATASET2018 by the classes Shrublands/moderate load (Code: kd142), Sclerophyllous vegetation/maquis (Code: kd147), Coniferous forest/Treated (Code: kd161), Coniferous forest/Dwarf conifer (Code: kd164), Coniferous forest (Code: kd165), and Broad-leaved forest (Code: kd182), covering 43.96% of the study area in the reference dataset (Table 1). The forest areas in the CLC2018 classification are comprised of the categories Broad-leaved forest (Code: 311), Coniferous forest (Code: 312), Moors and heathland (Code: 322), and Sclerophyllous vegetation (Code: 323), occupying 32.68% of the study area. In the MODIS2018 classification, the classes Evergreen Needleleaf Forests (Code: 1), Evergreen Broadleaf Forests (Code: 2), and part of class Woody Savannas (Code: 8) are those that represented the forest areas, occupying only 26.68% of the total study area. To overcome the issue of the class Woody Savannas (Code: 8), comprising both forest and olive groves areas, the MODIS2018 forest map was masked using the KASSANDRA DATASET2018 of forest areas. Thus, the olive groves areas were removed from the finally produced map that exclusively contained forest areas.
In the ESA-CCI-LC2018 classification, the forest areas are defined by the categories Tree cover, broadleaved, deciduous, closed to open (>15%) (Code: 60), Tree cover, needleleaf, evergreen, closed to open (>15%) (Code: 70), and Shrubland (Code: 120), covering the 43.31% of the study area. The results for the forest land cover class are reported Tables S1–S3 in Supplementary Material S3. Analysis of the three forest cover maps revealed that they were quite successful in assessing the forest areas with an OA exceeding 70% in all examined products (Table 7). Overall Accuracy of forest areas in CLC2018 reached 79.60%, meaning that most forest areas are correctly classified. User’s Accuracy was 86.01% implying that 13.99% of the land classified as forests is the result of commission errors. Producer’s Accuracy was 63.99% indicating omission errors as well [17]. The spatial distribution of the accuracy of forest and non-forest mapping is illustrated in Figure 5d–f.
The best results were obtained for the forest classes of MODIS2018 with a perfect User’s Accuracy (100%), while the lowest agreement was obtained in ESA-CCI-LC2018 (63.67%). Producer’s Accuracy rendered lower percentages than User’s Accuracy for the forest class in the cases of CLC2018 and MODIS2018, and a higher percentage in ESA-CCI-LC2018. Thus, in the case of the former two datasets, the identified forest features that are also present on the ground (i.e., User’s Accuracy) are fewer compared to those ground forest features correctly classified (i.e., Producer’s Accuracy). The opposite is the case for ESA-CCI-LC2018. The Kappa Coefficient was always positive, indicating better classification than random between the compared datasets. Thus, the Kappa Coefficient for the MODIS2018 product is 0.63, with a slightly lower value for CLC2018 (0.57) and the worst value of 0.41 for ESA-CCI-LC2018 (Table 7).

4. Discussion

The above information on the comparison of a detailed land cover dataset was based on ground information with the three widely used land cover products, and indicated the similarities and inconsistencies of the examined products. Our results of forest vs. non-forest mapping agree with those of previous studies that compared various land cover products with different resolutions and nomenclatures. Thus, regarding CLC2018 in Norway [17], a study found low accuracy when compared to detailed high-resolution data that is also the case in our work, although it focuses on a totally different hydro-climatic zone and ecosystem. The broad land cover classes can be represented with sufficient accuracy, which is also the case in previous work [21], highlighting the generalized character of the examined products either at the European or at a global level. The same finding is also observed in the comparison work of Neumann et al. [20], which besides the spatial resolution inconsistencies, also highlighted the need for harmonized land cover definitions. Compared to the results of Bach et al. [19] focusing on CLC2000 accuracy assessment for two sites in Germany, considerably lower performance was detected in our work for CLC2018, although the comparison sites in Germany cover a total area of only 17 km2 and comprised six land cover classes.
According to the above comparison and analyses, the spatial distribution consistency between the four datasets was not high. For instance, in the detailed classification (total land cover types), the differences between the three land cover products and the reference dataset were obvious, with the CLC depicting more precisely the landscape characteristics than the two other products, while the overall accuracy did not exceed 40% for any of the products. However, in the broad classes (forest vs. non-forest), the accuracy assessment revealed that mapping accuracy was reasonably high, exceeding 70% in all examined products. Thus, as far as applications of the above examined land cover datasets are concerned, the acquired results indicate that they are all suitable for categorizing land into broad land cover classes, forest and non-forest, and they can support applications that require this level of detail. For example, the estimation of vegetation carbon stocks is greatly dependent on the forest and non-forest classification and not on detailed land cover classes, as indicated by the vegetation carbon density factors [62]. When a more detailed classification is required, for example for the allocation of specific land cover, especially for hydrological and flood or fire risk assessment studies, the extent of specific land cover classes, e.g., built-up areas or conifer forest areas, is important for accurate predictions. Furthermore, in cases when allocation of land to specific land uses is crucial for sectors such as energy production or agriculture, then none of the three examined products can support this level of detail, at least at the local scale.
Probable solutions to obtain widely applicable global land cover information that would cover a much wider range of possible applications would require either a world-wide coordinated network, or an approach similar to the Data Cube that would integrate all individual land cover monitoring efforts, even from small entities [23]. Although the first approach seems quite promising, there is still no such initiative. The second approach seems more realistic for the near future, enabling connected workflows through stakeholder engagement aiming at the co-development of regional land cover monitoring systems [22].
Our work incorporates ground information on land cover types, focusing mainly on their fire risk. The harmonization process of the land cover types with each of the examined land cover products certainly introduces a source of uncertainty. Additionally, the detailed Kassandra dataset was acquired through a labour-intensive and costly process. The sampling procedures depend on the structure and size of the land being studied, the purpose of the inventory, and the level of desired accuracy. Thus, it should not be assumed that such detailed land cover information can be easily available over large areas for the accuracy assessment of the various land cover products.
Finally, the existence of constantly updated land cover datasets based on ground observations is very important for acquiring information on the uncertainties entailed within the remotely sensed global or continental land cover products. Although it is difficult to maintain such high-resolution datasets for broad regions, it is important to have such information even for smaller areas dispersed throughout many different hydro-climatic zones, and provide useful test sites for detailed uncertainty assessment of widely used land cover products.

5. Conclusions

Within the present work a comparison study of three widely used land cover products, the CLC2018, MODIS2018, and ESA-CCI-LC2018, was performed by examining their differences and similarities to a reference land cover dataset produced for the Kassandra peninsula, a typical Mediterranean fire-prone area in Macedonia, North Greece. All the examined datasets had different spatial resolution and nomenclature; therefore, the reference dataset was reclassified to be harmonized with the nomenclature of each one of the examined products, and they were resampled to 30 × 30 m. Comparisons with the reference dataset revealed an underestimation of the forested areas class in all three compared products. Results indicated that the level of accuracy in the case of detailed land cover classification was low in all three examined products, with CLC outperforming the MODIS and ESA-CCI-LC products. The low overall accuracy of all datasets restricts their suitability for certain applications, especially for specific risk assessment studies, where a high level of detail for specific land cover types is required. When broad land cover classes of forest and non-forest are examined, a high level of overall accuracy was achieved by all examined datasets (>70%), with MODIS demonstrating the highest overall accuracy for this broad categorization. Thus, when broad forest and non-forest classes are of particular importance, e.g., in vegetation carbon stocks estimation, all three examined products have sufficient accuracy, at least for the typical Mediterranean landscape studied in this work.

Supplementary Materials

The following supporting information can be downloaded at: https://www.mdpi.com/article/10.3390/land11091453/s1, Tables S1–S3: Supplementary Material S1; Tables S1–S4: Supplementary Material S2; Tables S1–S3: Supplementary Material S3.

Author Contributions

Conceptualization, M.B., K.C. and A.G.; methodology, M.B. and A.G.; software, K.C. and C.V.; validation, A.G., P.P. and K.K.; formal analysis, P.P.; investigation, M.B.; resources, M.B., A.G. and K.C.; data curation, M.B. and A.G.; writing—original draft preparation, M.B., K.C. and A.G.; writing—review and editing, M.B., A.G. and P.P.; visualization, K.C. and C.V.; supervision, K.K.; project administration, K.K. and A.G.; funding acquisition, P.P. and K.K. All authors have read and agreed to the published version of the manuscript.

Funding

This research received no external funding.

Institutional Review Board Statement

Not applicable.

Informed Consent Statement

Not applicable.

Data Availability Statement

Not applicable.

Acknowledgments

The authors would like to thank the Hellenic Forest Service and the Hellenic Fire Service for their valuable contribution to the writing of the article.

Conflicts of Interest

The authors declare no conflict of interest.

References

  1. Prasad, P.; Loveson, V.J.; Chandra, P.; Kotha, M. Evaluation and Comparison of the Earth Observing Sensors in Land Cover/Land Use Studies Using Machine Learning Algorithms. Ecol. Inform. 2022, 68, 101522. [Google Scholar] [CrossRef]
  2. Santos-Alamillos, F.J.; Pozo-Vázquez, D.; Ruiz-Arias, J.A.; Tovar-Pescador, J. Influence of Land-Use Misrepresentation on the Accuracy of WRF Wind Estimates: Evaluation of GLCC and CORINE Land-Use Maps in Southern Spain. Atmos. Res. 2015, 157, 17–28. [Google Scholar] [CrossRef]
  3. Thiam, S.; Salas, E.A.L.; Rholan, N.; Delos, A.; Almoradie, S.; Verleysdonk, S.; Adounkpe, J.G.; Komi, K. Modelling Land Use and Land Cover in the Transboundary Mono River Catchment of Togo and Benin Using Markov Chain and Stakeholder’ s Perspectives. Sustainability 2022, 14, 4160. [Google Scholar] [CrossRef]
  4. Koubodana, D.H.; Diekkrüger, B.; Näschen, K.; Adounkpe, J.; Atchonouglo, K. Impact of the Accuracy of Land Cover Data Sets on the Accuracy of Land Cover Change Scenarios in the Mono River Basin, Togo, West Africa. Int. J. Adv. Remote Sens. GIS 2019, 8, 3073–3095. [Google Scholar] [CrossRef]
  5. Mchenry, M.P.; Kulshreshtha, S.N.; Lac, S. Land Use, Land-Use Change and Forestry; Nova Science Publishers: New York, NY, USA, 2015. [Google Scholar]
  6. Sulla-Menashe, D.; Friedl, M. MCD12Q1 MODIS/Terra+Aqua Land Cover Type Yearly L3 Global 500 m SIN Grid V006. 2019, Distributed by NASA EOSDIS Land Processes DAAC. Available online: https://lpdaac.usgs.gov/products/mcd12q1v006/ (accessed on 29 July 2020).
  7. Chen, J.; Chen, J.; Liao, A.; Cao, X.; Chen, L.; Chen, X.; He, C.; Han, G.; Peng, S.; Lu, M.; et al. Global Land Cover Mapping at 30 m Resolution: A POK-Based Operational Approach. ISPRS J. Photogramm. Remote Sens. 2015, 103, 7–27. [Google Scholar] [CrossRef]
  8. Arino, O.; Ramos Perez, J.J.; Kalogirou, V.; Bontemps, S.; Defourny, P.; Van Bogaert, E. Global Land Cover Map for 2009 (GlobCover 2009); European Space Agency (ESA): Paris, France; University Catholic of Louvain (UCL): Ottignies-Louvain-la-Neuve, Belgium; PANGAEA: Bremen, Germany, 2012. [CrossRef]
  9. Defourny, P.; Schouten, L.; Bartalev, S.; Bontemps, S.; Caccetta, P.; De Wit, A.J.W.; Di Bella, C.; Gérard, B.; Giri, C.; Gond, V.; et al. Accuracy Assessment of a 300 m Global Land Cover Map: The GlobCover Experience. In Proceedings of the 33rd International Symposium on Remote Sensing of Environment, Stresa, Italy, 5–9 May 2009; pp. 400–403. [Google Scholar]
  10. Bartholomé, E.; Belward, A.S. GLC2000: A New Approach to Global Land Cover Mapping from Earth Observation Data. Int. J. Remote Sens. 2005, 26, 1959–1977. [Google Scholar] [CrossRef]
  11. Plummer, S.; Lecomte, P.; Doherty, M. The ESA Climate Change Initiative (CCI): A European Contribution to the Generation of the Global Climate Observing System. Remote Sens. Environ. 2017, 203, 2–8. [Google Scholar] [CrossRef]
  12. Liu, X.; Yu, L.; Si, Y.; Zhang, C.; Lu, H.; Yu, C.; Gong, P. Identifying Patterns and Hotspots of Global Land Cover Transitions Using the ESA CCI Land Cover Dataset. Remote Sens. Lett. 2018, 9, 972–981. [Google Scholar] [CrossRef]
  13. Tavares, P.A.; Ely, N.; Beltr, S.; Silva, U.; Cl, A. Integration of Sentinel-1 and Sentinel-2 for Classification and LULC Mapping in the Urban Area of Bel é m, Eastern Brazilian Amazon. Sensors 2019, 19, 1140. [Google Scholar] [CrossRef] [Green Version]
  14. Radwan, T.M.; Blackburn, G.A.; Whyatt, J.D.; Atkinson, P.M. Global Land Cover Trajectories and Transitions. Sci. Rep. 2021, 11, 12814. [Google Scholar] [CrossRef] [PubMed]
  15. Büttner, G. CORINE Land Cover and Land Cover Change Products. In Land Use and Land Cover Mapping in Europe: Practices & Trends; Manakos, I., Braun, M., Eds.; Springer: Dordrecht, The Netherlands, 2014; pp. 55–74. ISBN 978-94-007-7969-3. [Google Scholar]
  16. Wickham, J.; Stehman, S.; Gass, L.; Dewitz, J.; Sorenson, D.; Granneman, B.; Ross, R.; Baer, L. Thematic Accuracy Assessment of the 2011 National Land Cover Database (NLCD) James. Remote Sens. Environ. 2017, 191, 328–341. [Google Scholar] [CrossRef] [PubMed]
  17. Aune-Lundberg, L.; Strand, G.H. The Content and Accuracy of the CORINE Land Cover Dataset for Norway. Int. J. Appl. Earth Obs. Geoinf. 2021, 96, 102266. [Google Scholar] [CrossRef]
  18. Seebach, L.M.; Strobl, P.; San Miguel-Ayanz, J.; Gallego, J.; Bastrup-Birk, A. Comparative Analysis of Harmonized Forest Area Estimates for European Countries. Forestry 2011, 84, 285–299. [Google Scholar] [CrossRef]
  19. Bach, M.; Breuer, L.; Frede, H.G.; Huisman, J.A.; Otte, A.; Waldhardt, R. Accuracy and Congruency of Three Different Digital Land-Use Maps. Landsc. Urban Plan. 2006, 78, 289–299. [Google Scholar] [CrossRef]
  20. Neumann, K.; Herold, M.; Hartley, A.; Schmullius, C. Comparative Assessment of CORINE2000 and GLC2000: Spatial Analysis of Land Cover Data for Europe. Int. J. Appl. Earth Obs. Geoinf. 2007, 9, 425–437. [Google Scholar] [CrossRef]
  21. Heiskanen, J. Evaluation of Global Land Cover Data Sets over the Tundra-Taiga Transition Zone in Northern Most Finland. Int. J. Remote Sens. 2008, 29, 3727–3751. [Google Scholar] [CrossRef]
  22. Saah, D.; Tenneson, K.; Matin, M.; Uddin, K.; Cutter, P.; Poortinga, A.; Nguyen, Q.H.; Patterson, M.; Johnson, G.; Markert, K.; et al. Land Cover Mapping in Data Scarce Environments: Challenges and Opportunities. Front. Environ. Sci. 2019, 7, 150. [Google Scholar] [CrossRef]
  23. Szantoi, Z.; Geller, G.N.; Tsendbazar, N.E.; See, L.; Griffiths, P.; Fritz, S.; Gong, P.; Herold, M.; Mora, B.; Obregón, A. Addressing the Need for Improved Land Cover Map Products for Policy Support. Environ. Sci. Policy 2020, 112, 28–35. [Google Scholar] [CrossRef]
  24. Gemitzi, A. Predicting Land Cover Changes Using a CA Markov Model under Different Shared Socioeconomic Pathways in Greece. GISci. Remote Sens. 2021, 58, 425–441. [Google Scholar] [CrossRef]
  25. Giorgi, F. Climate Change Hot-Spots. Geophys. Res. Lett. 2006, 33, L08707. [Google Scholar] [CrossRef]
  26. Sulla-Menashe, D.; Gray, J.M.; Abercrombie, S.P.; Friedl, M.A. Hierarchical Mapping of Annual Global Land Cover 2001 to Present: The MODIS Collection 6 Land Cover Product. Remote Sens. Environ. 2019, 222, 183–194. [Google Scholar] [CrossRef]
  27. George, B.; Jan, F.; Gabriel, J. Corine Land Cover Update 2000; European Environment Agency, European Commission Joint Research Centre: Ispra, Italy, 2002; ISBN 9291675113.
  28. Bicheron, P.; Defourny, P.; Brockmann, C.; Schouten, L.; Vancutsem, C.; Huc, M.; Bontemps, S.; Leroy, M.; Achard, F.; Herold, M.; et al. GlobCover—Products Description and Validation Report; MEDIAS-France: Toulouse, France, 2008; p. JRC49240. [Google Scholar]
  29. Bontemps, S.; Herold, M.; Kooistra, L.; van Groenestijn, A.; Hartley, A.; Arino, O.; Moreau, I.; Defourny, P. Revisiting Land Cover Observations to Address the Needs of the Climate Modelling Community. Biogeosciences 2012, 9, 2145–2157. [Google Scholar] [CrossRef]
  30. Zhang, H.K.; Roy, D.P. Using the 500 m MODIS Land Cover Product to Derive a Consistent Continental Scale 30 m Landsat Land Cover Classification. Remote Sens. Environ. 2017, 197, 15–34. [Google Scholar] [CrossRef]
  31. Sharma, R.C.; Hara, K.; Hirayama, H.; Harada, I.; Hasegawa, D.; Tomita, M.; Geol Park, J.; Asanuma, I.; Short, K.M.; Hara, M.; et al. Production of Multi-Features Driven Nationwide Vegetation Physiognomic Map and Comparison to MODIS Land Cover Type Product. Adv. Remote Sens. 2017, 6, 54–65. [Google Scholar] [CrossRef]
  32. Vijith, H.; Dodge-Wan, D. Applicability of MODIS Land Cover and Enhanced Vegetation Index (EVI) for the Assessment of Spatial and Temporal Changes in Strength of Vegetation in Tropical Rainforest Region of Borneo. Remote Sens. Appl. Soc. Environ. 2020, 18, 100311. [Google Scholar] [CrossRef]
  33. Demattê, J.A.M.; Safanelli, J.L.; Poppiel, R.R.; Rizzo, R.; Silvero, N.E.Q.; de Mendes, W.S.; Bonfatti, B.R.; Dotto, A.C.; Salazar, D.F.U.; de Mello, F.A.O.; et al. Bare Earth’s Surface Spectra as a Proxy for Soil Resource Monitoring. Sci. Rep. 2020, 10, 4461. [Google Scholar] [CrossRef] [PubMed]
  34. Liang, D.; Zuo, Y.; Huang, L.; Zhao, J.; Teng, L.; Yang, F. Evaluation of the Consistency of MODIS Land Cover Product (MCD12Q1) Based on Chinese 30 m GlobeLand30 Datasets: A Case Study in Anhui Province, China. ISPRS Int. J. Geo-Inf. 2015, 4, 2519–2541. [Google Scholar] [CrossRef]
  35. Loveland, T.R.; Reed, B.C.; Ohlen, D.O.; Brown, J.F.; Zhu, Z.; Yang, L.; Merchant, J.W. Development of a Global Land Cover Characteristics Database and IGBP DISCover from 1 Km AVHRR Data. Int. J. Remote Sens. 2000, 21, 1303–1330. [Google Scholar] [CrossRef]
  36. Hansen, M.C.; Sohlberg, R.; Defries, R.S.; Townshend, J.R.G. Global Land Cover Classification at 1 Km Spatial Resolution Using a Classification Tree Approach. Int. J. Remote Sens. 2000, 21, 1331–1364. [Google Scholar] [CrossRef]
  37. Yang, Y.; Xiao, P.; Feng, X.; Li, H. Accuracy Assessment of Seven Global Land Cover Datasets over China. ISPRS J. Photogramm. Remote Sens. 2017, 125, 156–173. [Google Scholar] [CrossRef]
  38. Samasse, K.; Hanan, N.P.; Tappan, G.; Diallo, Y. Assessing Cropland Area in West Africa for Agricultural Yield Analysis. Remote Sens. 2018, 10, 1785. [Google Scholar] [CrossRef]
  39. Reinhart, V.; Fonte, C.C.; Hoffmann, P.; Bechtel, B.; Rechid, D.; Boehner, J. Comparison of ESA Climate Change Initiative Land Cover to CORINE Land Cover over Eastern Europe and the Baltic States from a Regional Climate Modeling Perspective. Int. J. Appl. Earth Obs. Geoinf. 2021, 94, 102221. [Google Scholar] [CrossRef]
  40. Duveiller, G.; Hooker, J.; Cescatti, A. The Mark of Vegetation Change on Earth’s Surface Energy Balance. Nat. Commun. 2018, 9, 679. [Google Scholar] [CrossRef] [PubMed]
  41. Li, C.; Li, M.; Liu, J.; Li, Y.; Dai, Q. Comparative Analysis of Seasonal Landsat 8 Images for Forest Aboveground Biomass Estimation in a Subtropical Forest. Forests 2020, 11, 45. [Google Scholar] [CrossRef]
  42. EEA CORINE Land Cover—User Manual; Copernicus Land Monitoring Service: Copenhagen, Denmark, 2021.
  43. European Space Agency. Land Cover CCI Product User Guide Version 2. Techology Report. 2017. Available online: Maps.Elie.Ucl.Ac.Be/CCI/Viewer/Download/ESACCI-LC-Ph2-PUGv2_2.0.Pdf (accessed on 10 March 2022).
  44. Raptis, D.; Kazaklis, A.; Kazana, V.; Stamatiou, C.; Koutsona, P. Assessment of Woody Mass during the Impelementation of Field Sampling Campaigns. 2016. Available online: https://fmproadmap.files.wordpress.com/2016/09/b3_report.pdf (accessed on 27 June 2022). (In Greek).
  45. Palaiologou, P.; Kalabokidis, K.; Kyriakidis, P. Forest Mapping by Geoinformatics for Landscape Fire Behaviour Modelling in Coastal Forests, Greece. Int. J. Remote Sens. 2013, 34, 4466–4490. [Google Scholar] [CrossRef]
  46. Lemmon, P. A Spherical Densiometer for Estimating Forest Overstory Density. For. Sci. 1956, 2, 314–320. [Google Scholar]
  47. Keller, M.; Brassel, P. Daten Zum Bergwald, 2. Alpenreport, Daten, Fakten, Probleme, Lösungsansätze. International Alpenschutzkommission CIPRA: Bern, Switzerland, 2001; pp. 216–235. [Google Scholar]
  48. Waser, L.T.; Schwarz, M. Comparison of Large-Area Land Cover Products with National Forest Inventories and CORINE Land Cover in the European Alps. Int. J. Appl. Earth Obs. Geoinf. 2006, 8, 196–207. [Google Scholar] [CrossRef]
  49. Hellenic Cadastre Forest Maps in Regional Unit of Chalkidiki. Available online: https://gis.ktimanet.gr/gis/forestsuspension (accessed on 15 May 2022).
  50. OPEKEPE Greek Payment Authority of Common Agricultural Policy. Available online: https://www.opekepe.gr (accessed on 15 May 2022).
  51. Hellenic Republic Law No 4164/2013. Available online: https://www.arpedonaptis.gr/iKTIMATOLOGIO/EGGRAFA/2013_4164.pdf (accessed on 15 May 2022).
  52. GR Survey Data Base. Greek Forest and Fire Service Digital Data for Wildfires in Kassandra; GR Survey Data Base: Kassandria, Greece, 2021. [Google Scholar]
  53. Greece Forest Service. Greek Forest Service Forest Road Network Maintenance and Fire Protection Project for the Peninsula of Kassandra Chalkidiki; Greece Forest Service: Kassandria, Greece, 2021. [Google Scholar]
  54. Hellenic Cadastre Land Registry—Datasets. Available online: https://data.ktimatologio.gr/dataset/d4c9eb3a-73c2-440a-b068-6b532ea459a9 (accessed on 15 May 2022).
  55. Arroyo, L.A.; Pascual, C.; Manzanera, J.A. Fire Models and Methods to Map Fuel Types: The Role of Remote Sensing. For. Ecol. Manag. 2008, 256, 1240–1250. [Google Scholar]
  56. Caetano, Μ.; Araújo, A. Comparing Land Cover Products CLC2000 and MOD12Q1 for Portugal. In Global Developments in Environmental Earth Observation from Space; IOS Press: Lisbon, Portugal, 2006; pp. 469–477. [Google Scholar]
  57. Copernicus Climate Change Service Product User Guide and Specification. Available online: https://climate.copernicus.eu (accessed on 15 May 2022).
  58. Congedo, L. Semi-Automatic Classification Plugin: A Python Tool for the Download and Processing of Remote Sensing Images in QGIS. J. Open Source Softw. 2021, 6, 3172. [Google Scholar] [CrossRef]
  59. Mchugh, M.L. Lessons in Biostatistics Interrater Reliability: The Kappa Statistic. Biochem. Med. 2012, 22, 276–282. [Google Scholar] [CrossRef]
  60. Gillis, M.; Leckie, D. Forest Inventory Mapping Procedures across Canada; Petawawa National Forestry Institute: Chalk River, ON, Canada, 1993.
  61. Traub, B.; Kiihl, M.; Paivinen, R.; Kugler, O. Effects of Different Definitions on Forest Area Estimation in National Forest Inventories in Europe; European Commission: Brussels, Belgium, 1998. [Google Scholar]
  62. Muñoz-Rojas, M.; de la Rosa, D.; Zavala, L.M.; Jordán, A.; Anaya-Romero, M. Changes in Land Cover and Vegetation Carbon Stocks in Andalusia, Southern Spain (1956–2007). Sci. Total Environ. 2011, 409, 2796–2806. [Google Scholar] [CrossRef] [PubMed]
Figure 1. Location map of the study red area.
Land 11 01453 g001
Figure 2. Study area (a) with major landscape features (forest, non-forest, urban development) and (b) the burned area of 2006.
Land 11 01453 g002
Figure 3. Spatial distribution of dominant land cover differences between the KASSANDRA DATASET2018 and (a) CLC2018, (b) MODIS2018, and (c) ESA-CCI-LC2018 land cover products.
Land 11 01453 g003
Figure 4. Black circle indicates the village of Kassandrino that has been captured in (a) the Kassandra dataset, (b) but it is absent in CLC dataset.
Land 11 01453 g004
Figure 5. Spatial distribution of the agreement and differences of the total land cover mapping (ac) and of the forest vs. non-forest mapping (df) between the KASSANDRA DATASET2018 and the three land cover products.
Land 11 01453 g005
Table 1. Overview of the datasets examined in this study.
DatasetSatellite SensorSpatial Resolution (m)Minimum Mapping Unit (ha)Reference Date Nomenclature
KASSANDRA DATASETLSO25/2015300.1201812 classes.
CLCSentinel 2 and Landsat 8100252018CLC2018, hierarchical, 44 classes at the lowest level.
MCD12Q1Terra MODIS5001002018IGBP, non-hierarchical, 17 classes.
ESA-CCI-LCPROBA-Vegetation (PROBA-V) and Sentinel-3 OLCI (S3 OLCI)3009 (nominal), 81 (verified)2018Level 1, global scale, 22 classes.
Table 2. KASSANDRAS’S DATASET land cover codes and classes grouped in five general groups.
Land Cover CodeLand Cover ClassesPixel SumPercentage %Km2GroupPercentage %
kd91Urban/Suburban developed11,3252.9110.19Artificial surfaces9.61
kd102WUI26,1236.7123.51
kd101Croplands107,68627.6596.92Agricultural areas44.43
kd100Olive groves65,36916.7858.83
kd142Shrublands/moderate load 24860.642.24Forest43.96
kd147Sclerophyllous vegetation/maquis31,6498.1328.48
kd161Coniferous forest/Treated71851.846.47
kd164Coniferous forest/Dwarf conifer 35,4449.1031.90
kd165Coniferous forest93,32423.9683.99
kd182Broad-leaved forest11160.291.00
kd98Open water25820.662.32Wetlands0.66
kd99Bare ground52091.344.69Barren1.34
Total389,498100.00350.55 100.00
Table 3. Kassandra land cover classes harmonization with the respective class codes of the other three used datasets.
Land Cover Classes Harmonization
IDLand Cover ClassesLand Cover Codes Harmonization
KASSANDRA DATASET2018CLC2018MODIS2018ESA-CCI-LC2018
1Urban/Suburban Developmentkd9111213190
2Open waterkd9841117210
3Barren (Roads, Mine, Beaches, Rocks)kd99122, 131, 331, 33216200
4Croplandskd1012111210, 11, 12
5WUIkd10214213190
6Shrublands /moderate loadkd1423227150
7Sclerophyllous vegetation/maquiskd1473236120
8Olive groveskd100223850
9Coniferous forestkd161, kd164, kd1653121, 870
10Broad-leaved forestkd182311460
Table 4. Areas of dominant land cover differences between the KASSANDRA DATASET2018 and the CLC2018, MODIS2018, and ESA-CCI-LC2018 land cover products.
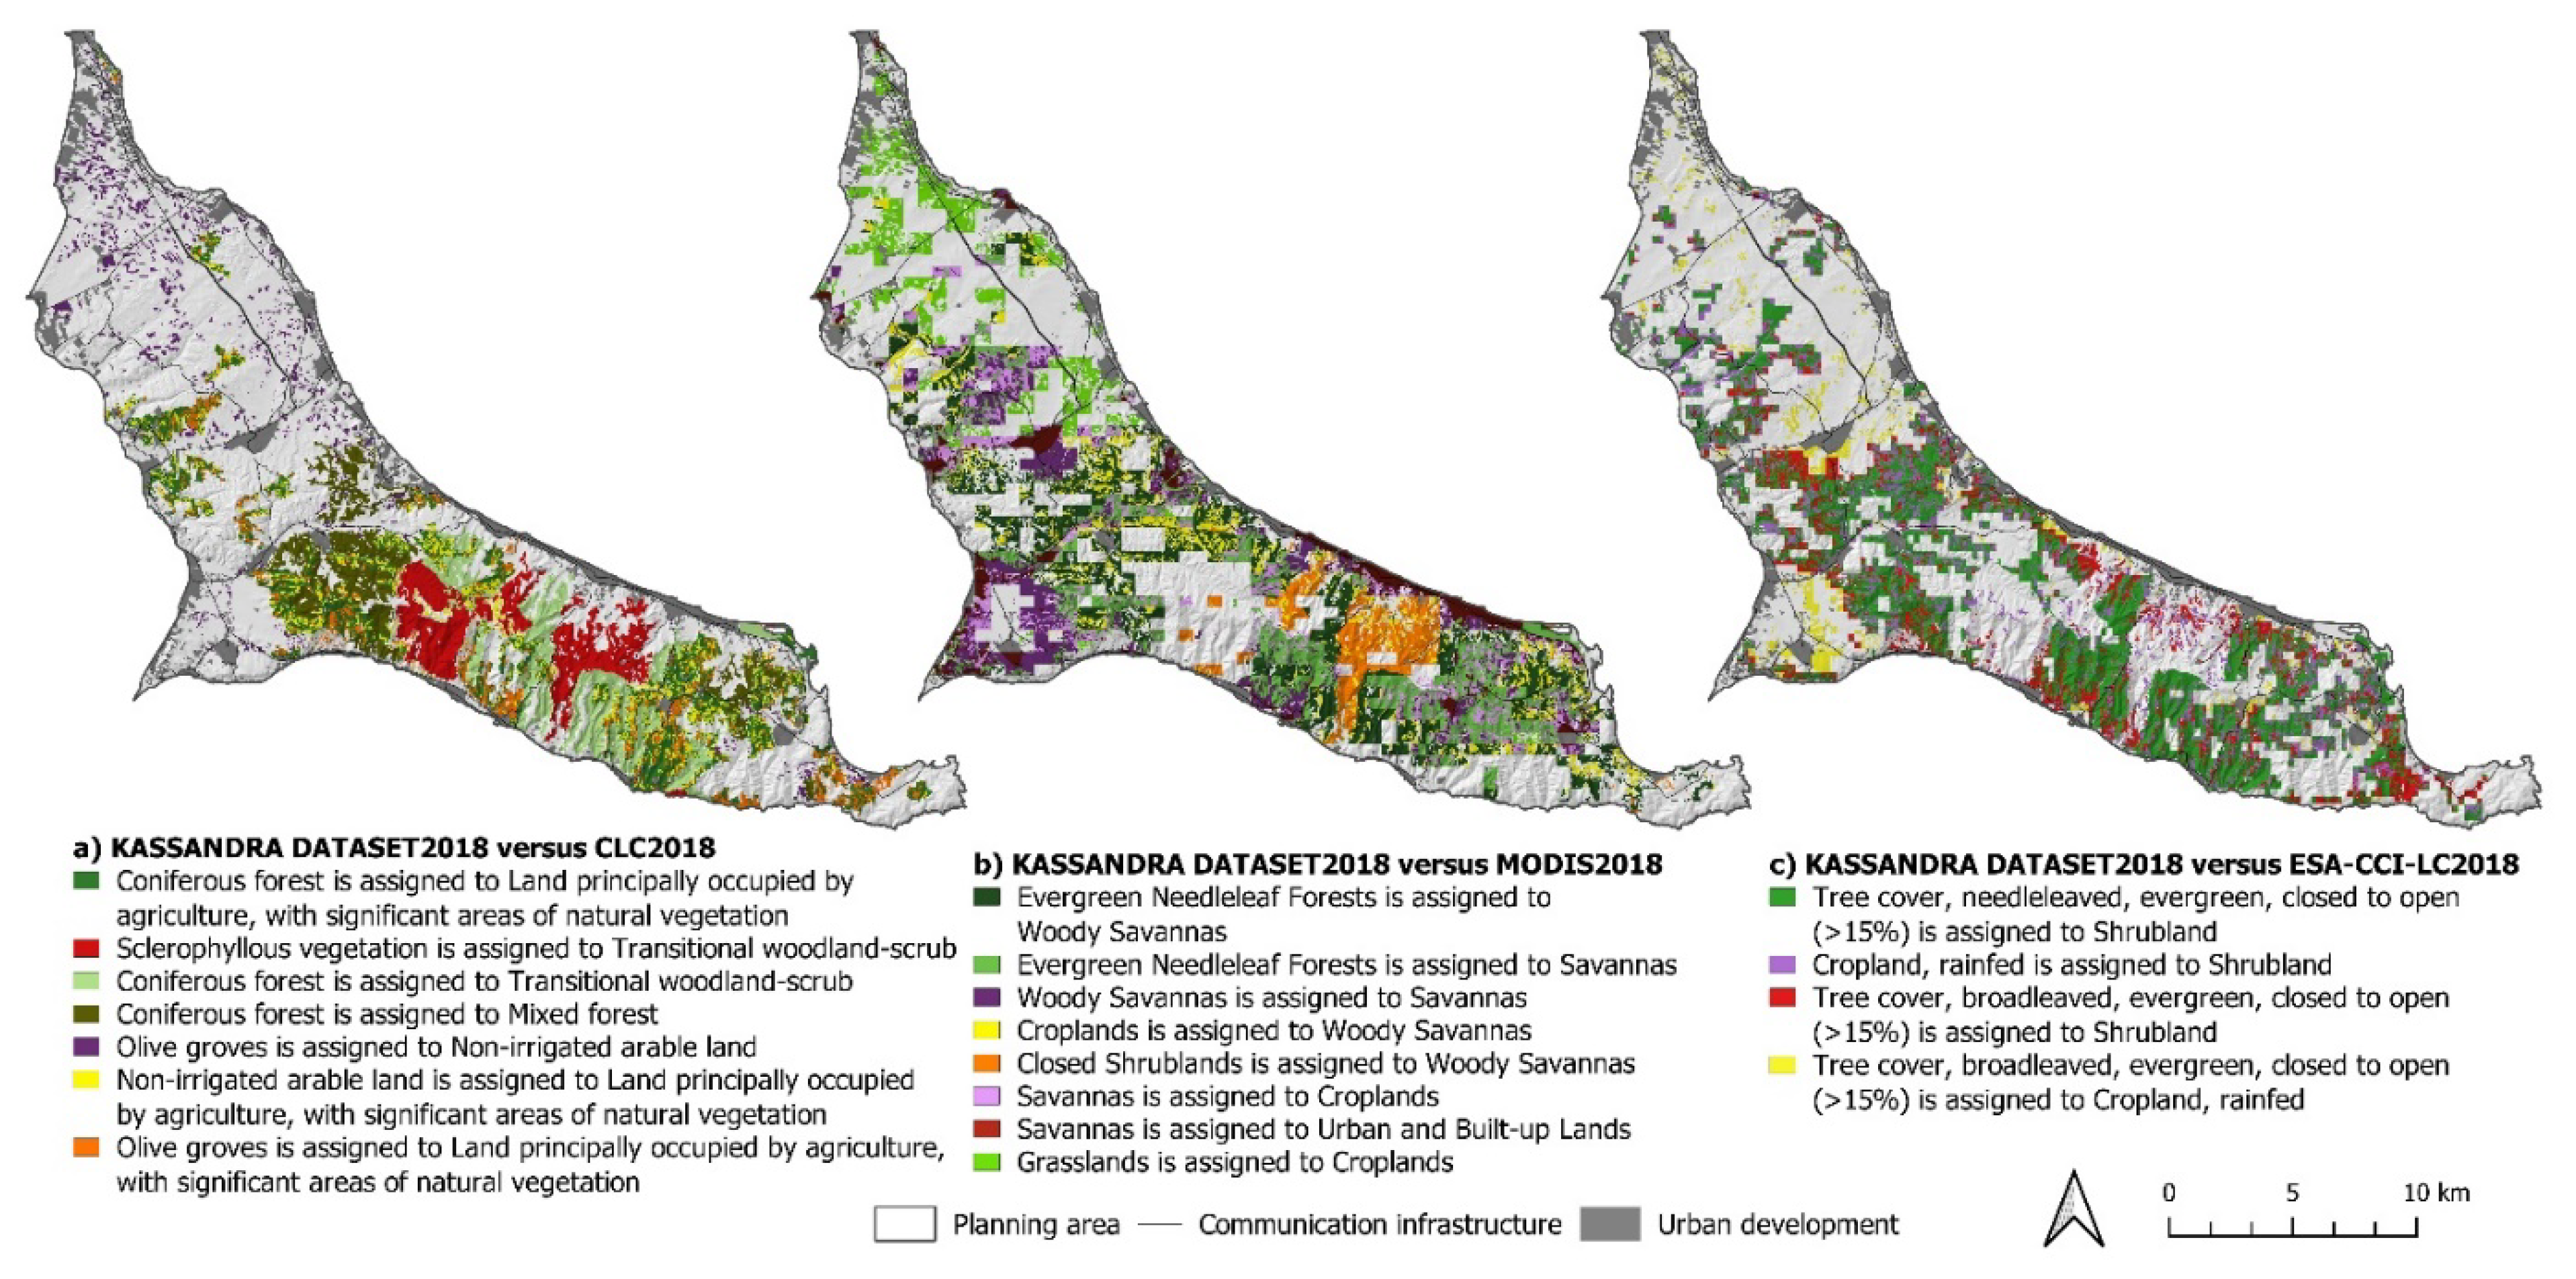
Dominant Land Cover Differences
ProductCodeLand Cover ClassesProductCodeLand Cover ClassesArea (km2)Area (%)
KASSANDRA DATASET2018312Coniferous forestCLC2018243Land principally occupied by agriculture, with significant areas of natural vegetation28.868.28
323Sclerophyllous vegetation324Transitional woodland–scrub20.045.75
312Coniferous forest324Transitional woodland–scrub18.565.32
312Coniferous forest313Mixed forest17.264.95
1Evergreen Needleleaf ForestsMODIS20188Woody Savannas43.3112.38
1Evergreen Needleleaf Forests9Savannas30.748.78
8Woody Savannas9Savannas23.056.59
12Croplands8Woody Savannas19.785.65
70Tree cover, needleleaved, evergreen, closed to open (>15%)ESA-CCI-LC2018120Shrubland72.8420.80
10Cropland, rainfed120Shrubland27.137.75
50Tree cover, broadleaved, evergreen, closed to open (>15%)120Shrubland25.997.42
50Tree cover, broadleaved, evergreen, closed to open (>15%)10Cropland, rainfed10.653.04
Table 5. Overall Accuracy (OA), Kappa Coefficient (K), User’s Accuracy (UA), and Producer’s Accuracy (PA) for the prevailing (exceeding 1% of the study area) land cover categories in Kassandra, for the three land cover datasets compared to the reference land cover dataset.
ProductLand Cover ClassesArea (km2)PA (%)UA (%)OA (%)K
CLC2018(112) Discontinuous urban fabric10.3462.2763.2037.470.27
(142) Sport and leisure facilities23.8023.5556.12
(211) Non-irrigated arable land97.0759.7269.19
(223) Olive groves58.9839.6652.70
(312) Coniferous forest122.8530.7879.12
(323) Sclerophylous vegetation28.440.604.53
MODIS2018(1) Evergreen Needleleaf Forests115.9920.4661.2721.820.11
(6) Closed Shrublands28.520.00nan
(8) Woody Savannas65.3733.0420.80
(12) Croplands96.9930.7673.27
(13) Urban and Built-up Lands33.821.6334.17
(16) Barren4.240.00nan
ESA-CCI-LC2018(10) Cropland, rainfed96.9328.6851.6721.780.12
(50) Tree cover, broadleaved, evergreen, closed to open (>15%)58.850.00nan
(70) Tree cover, needleleaved, evergreen, closed to open (>15%)122.3517.8973.06
(120) Shrubland28.4671.4513.13
(190) Urban areas33.7715.2389.24
(200) Bare areas4.5114.015.41
Table 6. Per-pixel error matrix showing the differences between MODIS2018 (columns) and KASSANDRA DATASET2018 (rows). The numbers 1–17 are MODIS nomenclature.
MODIS
2018
1246789101112131617Total
126,365004566157525300054879622321143,033
2243800327474870003660006572
400000000000000
600000000000000
700000000000000
848,127021614,53650623,99000021,97652746079911,5331
934,1540358457196525,61000021,96513,5671031215102,436
1054880160106589736900020,032480560686840,023
116808032391711524070002591487569938721,831
121651030912112554700033,150383642918645,241
13147000201820007546127601791
1600000000000000
17350904154611117010001363349099381612,570
Total128,6870111631,637248272,546000107,68437,42146732582388,828
Omission
Error (OE) [%]
9.51000066.9300069.2198.36068.40
Commission Error (CE) [%]38.73000079.2000026.7265.83093.50
Producer’s Accuracy (PA) [%]0000033.0700030.781.63031.60
User’s Accuracy (UA) [%]0000020.8000073.2734.1706.49
Overall accuracy [%] = 21.81; Total Error [%] = 78.15; Kappa hat classification = 0.1069.
Table 7. Comparison of forest vs. non-forest areas of the three land cover datasets CLC2018, MODIS2018, and ESA-CCI-LC2018 with the KASSANDRA DATASET2018.
Land Use TypeUser’s Accuracy (%)Producer’s Accuracy (%)Overall Accuracy (%)Kappa Coefficient
CLC2018non-forest76.4991.8479.600.57
forest86.0163.99
MODIS2018non-forest76.44100.0082.720.63
forest100.0060.70
ESA-CCI-LC2018non-forest78.2265.6870.510.41
forest63.6776.68
Publisher’s Note: MDPI stays neutral with regard to jurisdictional claims in published maps and institutional affiliations.

