Article

Fire Dynamics of the Bolivian Amazon

The Centre for Environmental Policy, Imperial College London, London SW7 1NE, UK
*
Author to whom correspondence should be addressed.
Land 2022, 11(9), 1436; https://doi.org/10.3390/land11091436
Submission received: 28 June 2022 / Revised: 14 August 2022 / Accepted: 26 August 2022 / Published: 31 August 2022

Abstract

:
This study identifies the spatial and temporal trends, as well as the drivers, of fire dynamics in the Bolivian Amazon basin. Bolivia ranks in the top ten countries in terms of total annual burnt, with fires affecting an estimated 2.3 million hectares of forest in 2020. However, in comparison to the Brazilian Amazon, there has been little research into the fire regime in Bolivia. The sparse research and the limited literature on the subject indicate that fire activity is higher in the Bolivian Amazon basin’s dry forests and flooded savanna zones, and that agriculture and drought are the primary causes of fire activity. In this study, trend analysis and emerging hotspot analysis are deployed to identify the spatial and temporal patterns of fire activity and boosted regression tree models to identify the drivers of forest fire within each ecoregion of the Bolivian Amazon basin. Comparable to most of the Brazilian literature, this study finds that fire activity and fire season length is higher in the flooded Beni Savanna, and Chiquitano seasonally dry tropical forests than in the Bolivian Amazon ecoregion. This study also identifies moisture stress and human activity as the main drivers of fire dynamics within the region. It is intended that this research will offer a foundation for future research and conservation activities aimed at better understanding the fire regime of the Bolivian Amazon basin.

1. Introduction

Anthropogenic climate change and rising human consumption are threatening ecosystems all over the world. The average rate of global warming is unprecedented in geological history [1], and the rate and quantity of species extinctions have caused some scientists to announce the beginning of a sixth mass extinction [2]. The Amazon basin is one location that has been and will continue to be greatly influenced by climate change and human activities. This region of about 6.3 million km2 is home to more than 10% of the world’s documented species [3], and the basin’s vastness and richness are unparalleled internationally. Brazil accounts for 60% of the basin, with the balance distributed among Bolivia, Colombia, Ecuador, Guyana, Peru, Suriname and Venezuela. Over the past fifty years economic expansion and globalization have resulted in ecological degradation of the whole basin [4]. These effects were apparent worldwide when in 2019 fire dynamics destroyed over 6.4 million hectares of Bolivian Amazon forest [5].
Fire dynamics typically occurs in two areas of the Amazon basin [6]: (1) within the “Arc of Deforestation” [7,8], and (2) in regions with low rainfall and moderate to long dry seasons [6]. The “Arc of Deforestation” is now a major agricultural region in southern and eastern Brazil [9], it has the highest deforestation rate of any region in the Amazon basin and over 50% of the world’s deforestation occurs there [10]. Deforestation and land management clearance for agriculture are dependent on slash-and-burn techniques [11], and many clearance fires are ignited within this arc [12]. These fires frequently expand and become uncontrollable leading to large fire events that can spread across the different biomes of the Amazon including internationally [13,14].
Fire dynamics occurs and spreads throughout the basin region, while being frequently portrayed as a Brazil-specific hazard. On the causes and effects of fire dynamics in tropical regions, Juárez-Orozco et al. observed that one-third of all identified research on the topic was focused on Brazil [15], and that there is a lack of research on the spatial and temporal distribution, and drivers of fire dynamics within the Amazon basin but outside of Brazil. Bolivia, the focus nation in this study, has traditionally and historically been influenced by wildfires, but has lately witnessed an increase in fire activity, becoming one of the top ten countries with the greatest burnt area [14]. Fires in Bolivia destroyed 5.3 million hectares of forests and savannas between July and November 2019. Bolivia has one of the world’s worst rates of deforestation; if present trends continue, the majority of the country’s 50 million hectares of forest might be lost by 2050 [16].
The three principal ecoregions of the Bolivian section of the basin such as the Bolivian Amazon, the Beni Savanna and the Chiquitano seasonally dry tropical forest (SDTF) lie at the southwestern edge of the Amazon basin. These regions experienced fire dynamics due to their climatic conditions as precipitation is lower and the climate is dryer [17]. The dryer and less humid regions of the Amazon are less well fire adapted [18] and fires can impact the functioning of Bolivian ecosystems. Forest burning is dependent on several factors including weather, forest structure and fuel load. Previous research on Chiquitano SDTF (seasonal dry tropical forests) in Bolivia was discovered even though these forests were resilient to fire occurrence. Climatic factors are the most important determinants of fire than forest structure and these forests recover from fires [19].
Wide-scale deforestation in Bolivia is largely caused by human agricultural and urban expansion [20] and has been rising since the 1980s [8,21]. The area burnt annually has mirrored this pattern and in 2019, 12% of the Chiquitano SDTF was destroyed by fire dynamics with 70% of the burned area lying along deforestation or agricultural frontiers [16]. Around the world, and particularly in Amazonia, deforestation rates and fire occurrence are higher near important transportation corridors such as highways and rivers [22,23,24], as well as close to interconnected agricultural settlements [23,25]. Although the specific research findings focused on South America, these apply to generic tropical biome. Landscape topography and soil drainage also influence fire dynamics [26] as agriculture is favoured on well-drained, level terrain [27]. Conservation efforts, such as protected areas (PAs), can reduce deforestation rates and fire density [23,28] as lower population densities and occupancy by traditional cultural groups leads to fewer ignition sources and the natural tree cover/land-use limits the susceptibility of forests to fires [28,29]. Urbanism and fire dynamics have a more complex relationship. Proximity to expanding urban areas and their infrastructure can drive an increase in fire incidence [30]. Conversely, in urban areas, there are greater resources to combat fires and citizens’ safety concerns rise, particularly as a region’s GDP rises, both potentially depressing the local area burnt [31].
In addition to direct anthropogenic drivers, the major determinant of contemporary fire dynamics in Amazonia is drought [32]. Drought caused forest dieback, increasing fuel availability and ground-level insolation, making the Amazon more combustible [20,24,33]. The main trigger of drought in South America is the occurrence of El Niño-Southern Oscillation (ENSO) or Atlantic Multidecadal Oscillation (AMO) events driven by anomalous warming of the tropical Atlantic and Pacific respectively, and both cause a rise in temperature and fall in precipitation over South America [7,34,35]. During periods of extreme drought, fires will often spread rapidly and become uncontrollable resulting in devastating wildfires as seen in 1997, 2005, 2009, 2010, 2015 and 2018 [24,33,36]. The amount of rainfall over the subtropics is predicted to decrease and the spatial pattern of rainfall is expected to become more variable and may exacerbate drought conditions in dryer regions of the Amazon basin [37]. This will increase the region’s fire susceptibility, endangering the basin’s functioning and biodiversity [17].
The fire dynamics increase across Bolivia creates an urgent need to characterize locally specific drivers and spatial/temporal relationships of fire dynamics in order to aid adaptation and conservation efforts. Fire dynamics in Bolivia is largely concentrated in the Amazon basin, a heterogenous zone with a mosaic of different ecoregions [27]. This work examines fire activity among the three major ecoregions to determine spatial and temporal trends, as well as the drivers of fire dynamics in the Bolivian Amazon basin, with the goal of assisting conservation and supporting climate change adaption strategies.

2. Materials and Methods
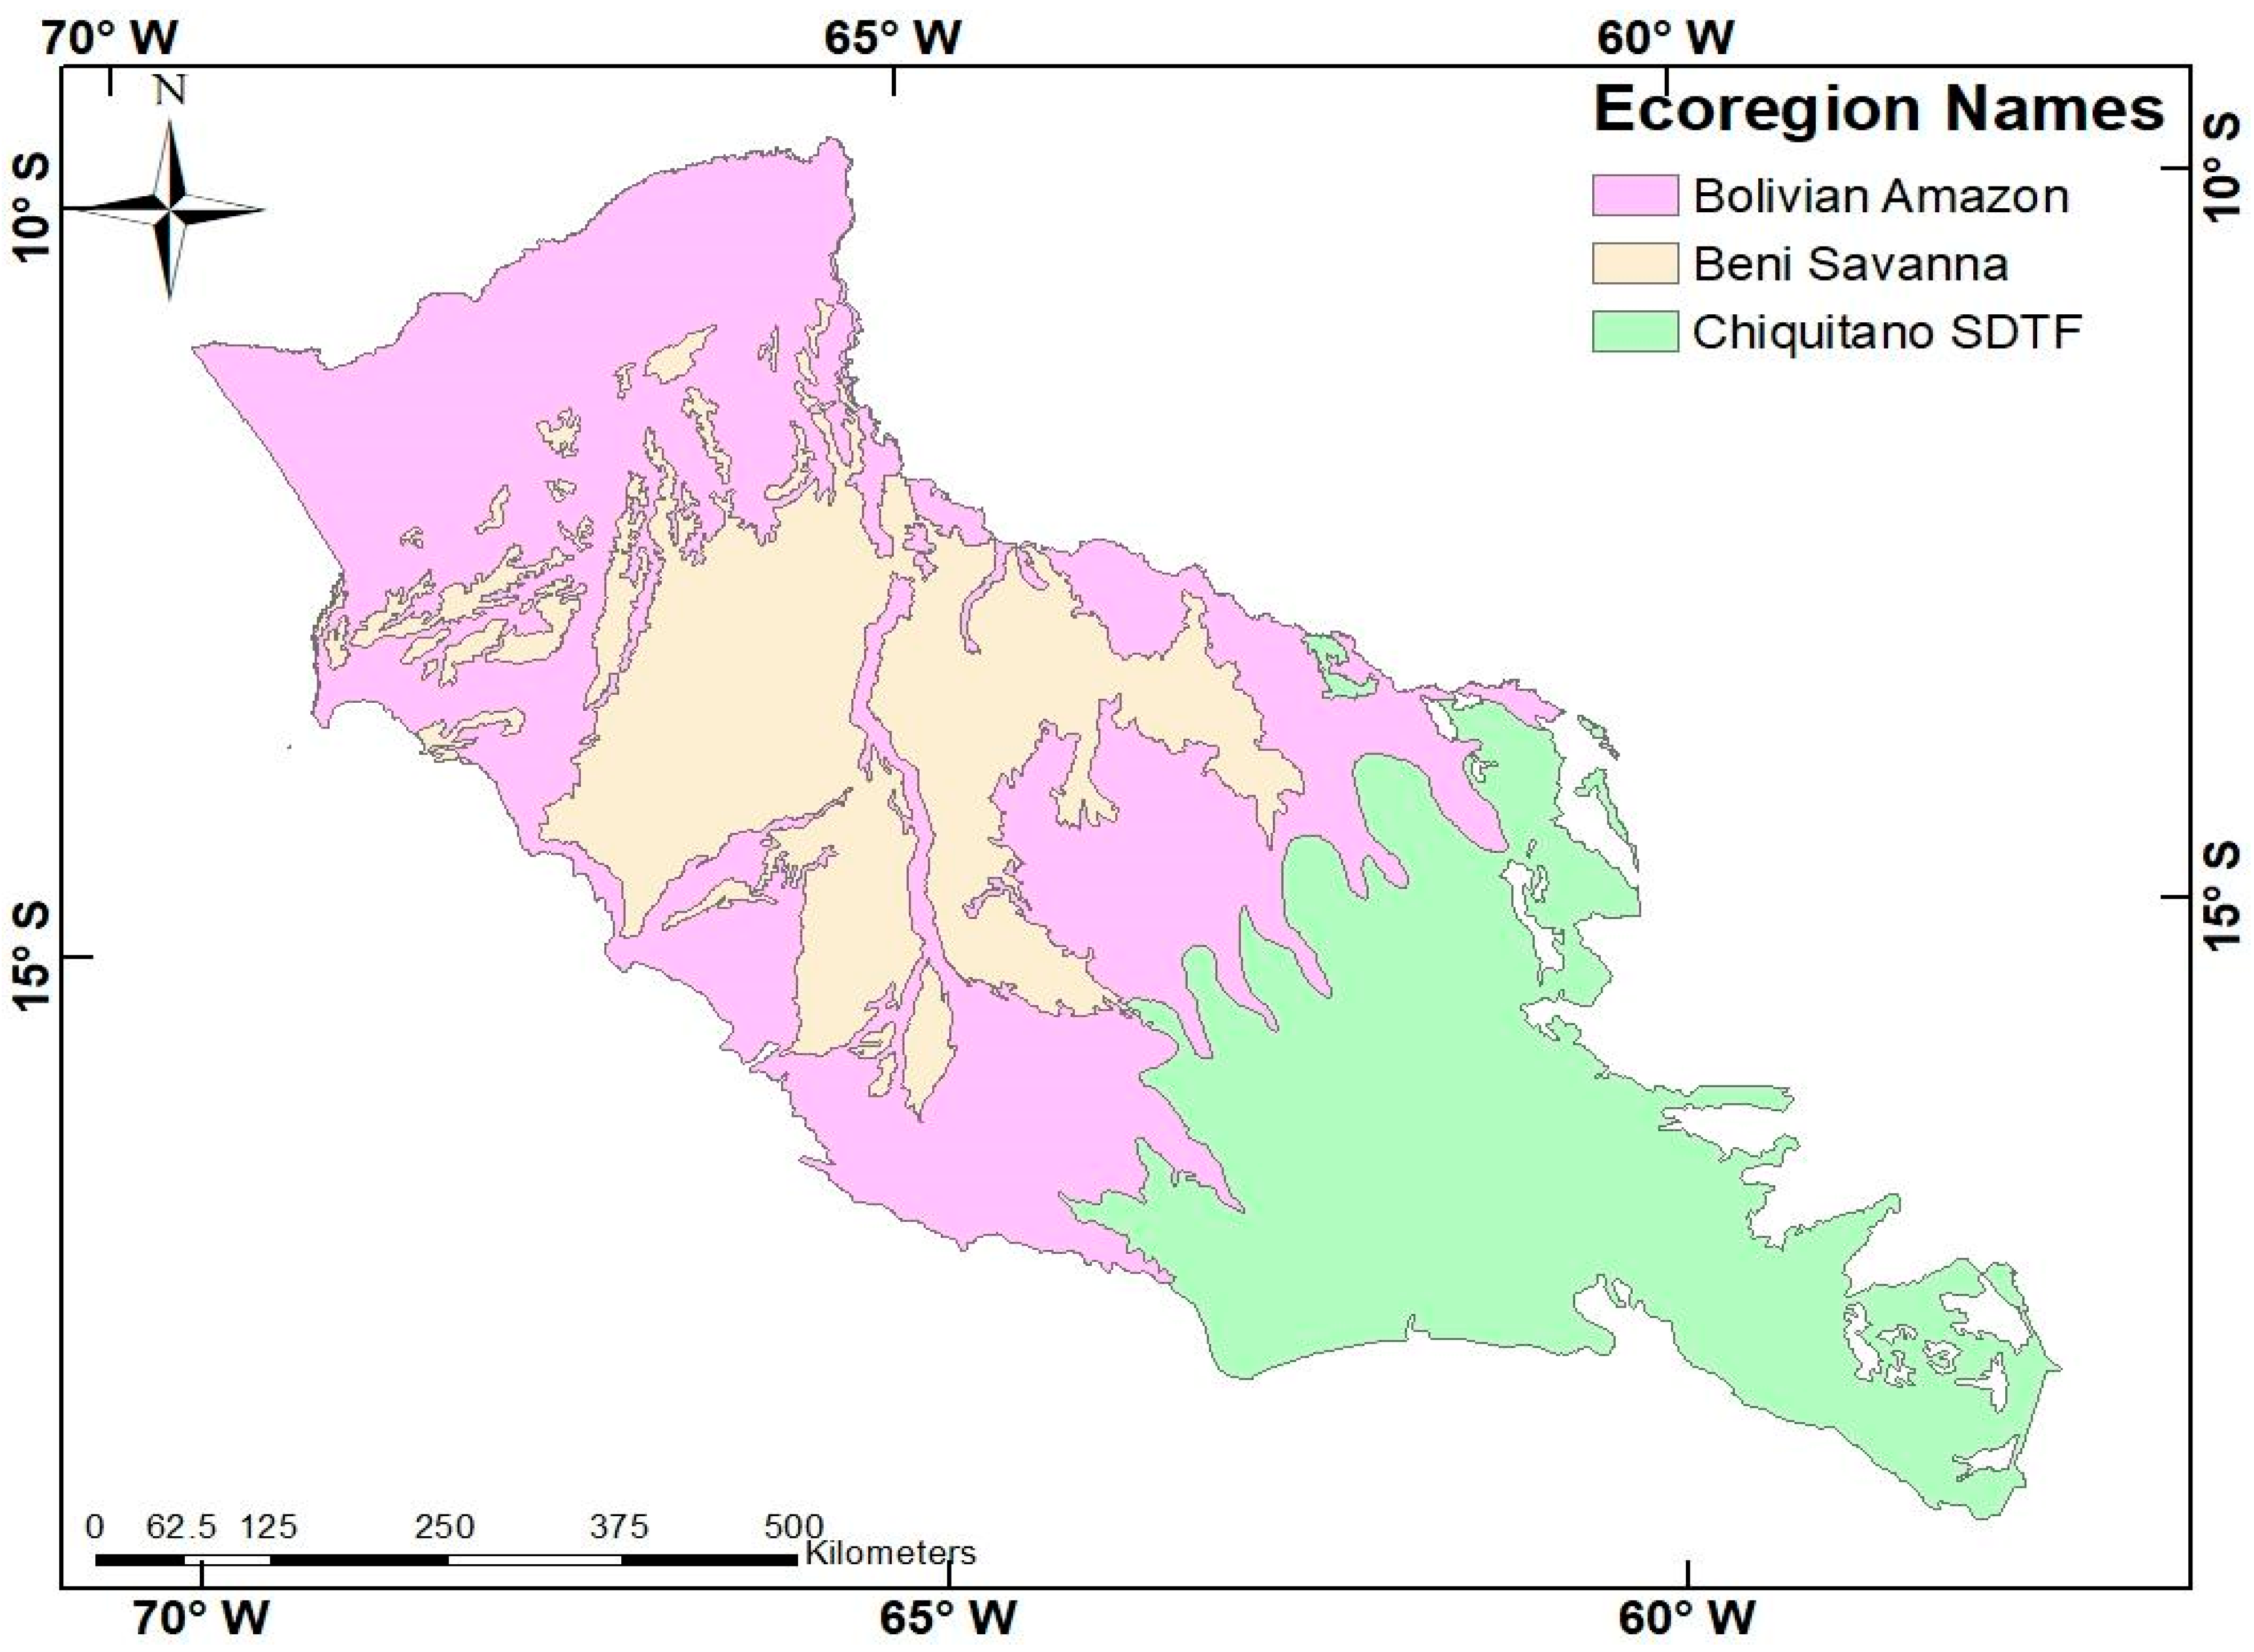
2.1. Study Area

The study area covers 745,546 km2 and lies within north and north-eastern Bolivia. The four municipalities of Pando, Le Paz, El Beni and Santa Cruz partially lie within the area as does the major city of Santa Cruz. The area falls within a climatic transition zone with a noticeable precipitation gradient, with rainfall decreasing in the south. Along this precipitation gradient the structure and composition of vegetation also changes, transitioning from dense, evergreen vegetation in the north to dryer, semi-deciduous vegetation. The WWF terrestrial ecoregions of the world categorization [38] divides the zone into three distinct ecoregions: the Bolivian Amazon, Beni Savanna and Chiquitano SDTF (Figure 1).

2.1.1. The Bolivian Amazon

The Bolivian amazon covers an area of 600,000 km2, or 7.9% of the total Amazon rainforest area [39]. Average temperatures in the region vary between 22 and 27 °C and precipitation ranges between 1500 and 2100 mm per year. The source data for average annual temperature are determined by TerraClimate, which is a monthly global gridded dataset of temperature, precipitation and other water balance variables from 1958 to the present [40]. Its combination of the high spatial resolution of ~4 km2, global extent and long length fills a unique gap in climate data. Using climatically aided interpolation, TerraClimate combines spatial climatology from the WorldClim dataset, with time-varying information from the coarser-resolution CRU Ts4.0 and Japanese 55-year Reanalysis (JRA55), to produce a monthly dataset of precipitation, maximum and minimum temperature, wind speed, vapour pressure and solar radiation (Table 1) [41].
There is an observable dry season that coincides with the austral winter, resulting in four to five months in which precipitation can be below 100 mm [42,43]. The region is characterized by dense, closed canopy trees and moist, evergreen vegetation [44].

2.1.2. The Beni Savanna

The Beni savanna spans 126,100 square kilometres (48,700 square miles) in northern Bolivia’s lowlands, with tiny swaths in neighbouring Brazil. Beni savanna has an extent of 126, 000 km2, which represents 8–9% of the Bolivian territory [45]. El Beni, Cochabamba, La Paz, Pando and Santa Cruz are the departments that contain the majority of the Beni savanna [42]. Largely falls within Bolivia except for a small portion that is located in the Brazilian state of Rondônia [46]. Temperatures vary between 25 and 37 °C and rainfall ranges between 1300 mm in the east to 2000 mm in the west [23]. The region has a mosaic of different component ecotypes including dry savannas, wet savannas, flooded forests and dry forests [47]. The southwestern Amazon Rainforest Ecotone (ARE) is the transitional landscape between the tropical forest and seasonally flooded savannahs of the Bolivian Llanos de Moxos/Beni Savannas have a long history of using fire for ecosystem modification [48,49].

2.1.3. The Chiquitano Seasonally Dry Tropical Forest (SDTF)

The Chiquitano seasonally dry tropical forest (SDTF) is the world’s best preserved tropical dry forest [44] covering an area of over 230,000 km2 [18]. Average annual rainfall is less than 1500 mm [44], with the majority of precipitation occurring in the summer months (December and February) triggered by the South American Southern Monsoon (SASM). The ecoregion is characterized by a closed-canopy and contains an abundance of thorny and succulent species [50]. Fire dynamics has become increasingly common in the Chiquitanía region of Bolivia [51], where approximately 17 million ha of forest burned between 2005 and 2019. This region is home to the Chiquitano seasonally dry tropical forest (SDTF), the largest intact SDTF block in the Neotropics [52]. Historical records show that fire has been an integral part of the ecology of the Chiquitanía [18], and several fire-adapted species with protective traits such as a thick bark are present, suggesting that the resilience to fire is relatively higher (Tropical Dry Forest Resilience to Fire Depends on Fire Frequency and Climate). Wildfires are becoming increasingly frequent and devastating in many tropical forests. Although seasonally dry tropical forests (SDTF) are among the most fire-threatened ecosystems, their long-term response to frequent wildfires remains largely unknown [19].

2.2. Methodological Approach

This work has three distinct stages. Firstly, 20 years of active fire data were downloaded, cleaned and processed. Secondly, Getis-Ord Gi* and Mann–Kendall tests were used to estimate and analyse the spatial and temporal trends. Finally, a Boosted Regression Tree (BRT) method was applied to identify drivers of fire dynamics and to estimate their influence in the Bolivian Amazon basin.

2.2.1. Fire Data

Daily active fire data were obtained for the period between 2001 and 2020 from NASA’s Fire Information for Resource Management Systems (FIRMS) website [53].
These data can be plotted as vector points in which they represent a centroid of a 1 km by 1 km pixel where one or more active fires or thermal anomalies were detected [3]. The active fire data were collected by sensors on NASA’s Moderate Resolution Imaging Spectroradiometers (MODIS) Terra and Aqua satellites. Data from Terra and Aqua were combined as this ensures the highest number of non-redundant detections [3,54].
MODIS relies on an algorithm to detect fires based on the strong mid-infrared signal emitted by fires. The algorithm is not perfect and can mistake very bright or reflective surfaces as fires [55]. The MODIS dataset provides a confidence value for each hot pixel detected that ranges from 0 to 100 (%). Data are often clipped to remove low-confidence detections. The desired minimum confidence value to include in a study is not specified by NASA and depends on the aims of the study [56]. We sought to minimize the number of false alarms included and only included fires with a confidence interval of over 70%.

2.2.2. Gridded Data

To estimate spatial and temporal trends in fire occurrence whilst limiting processing times, the study area was split into a 10 × 10 km grid [3] and contained 5690 grid cells/pixels.

2.2.3. Fire Regime Metrics

The MODIS fire data were converted into two grid-based fire regime metrics based on studies conducted by Dwomoh and Wimberly [57] and Chuvieco et al. [58]: mean Active Fire Density (AFD) and mean Fire Season Length (FSL):
AFD (count/km2/year) acts as an indicator of fire activity. It is equal to the Active Monthly Fire Density (AMFD) divided by the number of years covered by the fire data (k). AFD is calculated using the equation:
A F D c = y = 1 k A M F D y , c K
where AMFD (fires/km2/month) is the average monthly fire frequency in a given year, y is the year, m is the month, c is the cell and Ac is the area of the cell.
A M F D y , c = m = 1 12 F y , m , c 12 · A c
FSL (months) provides information on fire seasonality and is given by:
F S L c = S F m
where SF indicates if a month has more than 10% of the mean active fire density [3],
S F m = 1 ,   if   A M F D c > 0.1 · A F D c else ,   S F = 0

2.2.4. Climatic and Anthropogenic Variables

To estimate the influence of the identified drivers of fire dynamics in Bolivia we sourced relevant and available data on these.

2.2.5. Protected Areas

Protected area data were obtained from the IUCN as a shapefile. The boundaries for the protected areas were plotted and the Euclidean distance of each pixel to the boundary of the closest protected area was calculated using the near tool available in ArcMap 10.8.1. The distance was calculated in km and set to 0 for points within the boundary of protected area.

2.2.6. Climatic Variables

Forests fires are related to drought conditions in South America, so three variables relating to precipitation and water availability were sourced and included: mean monthly precipitation, potential evapotranspiration and maximum cumulative water deficit (MCWD) which acts as a measure of drought intensity and severity [36]. From a series of ground measurements, Aragao et al. [59] estimate that a moist, tropical canopy will transpire approximately 100 mm per month [60]. If the monthly precipitation for a region is less than 100 mm then that region enters a water deficit. Using this idea, the cumulative water deficit for each month can be calculated as follows:
I f   C W D n 1 E i , j + P n ( i , j ) < 0   t h e n   C W D n ( i , j ) = C W D n 1 ( i , j ) E i , j + P n ( i , j )   e l s e   C W D n ( i , j ) = 0
where, CWD is cumulative water deficit of a grid cell, E is mean transpiration of a moist, tropical canopy and fixed at 100 mm, and P is monthly precipitation for each grid cell. The more negative the value of MCWD, the greater the water deficit. Potential evapotranspiration (PET) was also used as a measure of moisture stress. The greater the value of PET, the greater the moisture stress. Mean monthly precipitation was calculated using the daily CHIRPS dataset available on the Google Earth Engine [61]. The Google Earth Engine was used to clip and download data for both PET and average precipitation. MCWD was calculated in RStudio using code adapted from [62]. One advantage of using this approach as opposed to an off-the-shelf product is that TerraClimate uses a water balance model that incorporates temperature, precipitation, reference evapotranspiration and interpolated plant extractable soil water capacity to produce a monthly surface water balance dataset. The procedure applies interpolated time-varying anomalies from CRU Ts4.0/JRA55 to the high spatial resolution climatology of WorldClim, creating a high spatial resolution dataset covering a broad temporal range. Temporal information on global land surface temperature, precipitation and vapour pressure is acquired from CRU Ts4.0, whilst JRA55 data is used for regions where CRU data are lacking.
In this research, we have used MCWD not CWD. The MCWD corresponds to the maximum value of the accumulated water deficit. MCWD has been used to extensively examine fire dynamics and its interlinkages with forest structure in South America [63]. This attribute has been derived for different parts of South America and has been employed for examining fire dynamics across different ecosystems [59,64]. MCWD ghastly been used for studying the fire dynamics for other human modified dry forest ecosystems [65]. MCWD has also been used for Amazonia wide fire studies, The MCWD is a useful indicator of meteorologically induced water stress without taking into account local soil conditions and plant adaptations, which are poorly understood in Amazonia [36,66,67].
The other two bio-geographic variables included were forest strata and distance to rivers. Due to the mosaic structure of ecoregions within the study area [43,68] the forest strata can vary substantially within ecoregions. To understand how different forest strata impact fire dynamics, the GLAD Pan tropical forest strata dataset was incorporated into this study [69]. Previous studies of drivers of forest have found a relation between distance to rivers and forest fire occurrence [7,70]. To see if a similar relationship existed in Bolivia, a dataset of major rivers running through Bolivia was downloaded from the World Bank [71] and the Euclidean distance raster was computer.

2.2.7. Anthropogenic Variables

To model overall human impact on the environment, the Global Human Modification index was used. The Global Human Modification dataset models 13 different anthropogenic stressors and their expected impacts [72], including urban and built-up, crop and pasture lands, livestock grazing, oil and gas production, mining and quarrying and power generation (renewable and nonrenewable) [73]. A higher value of human modification means a greater impact of human activity on the area. Population changes and Euclidean distance to cities were used to model the impact of urbanization on the fire regime. Deforestation area was included to model the impact of the deforestation on the fire regime. As slash-and-burn deforestation often occurs near roads, the Euclidean distance to roads was also included as a variable.

2.2.8. Topographic Variables

The elevation was collected by the Shuttle Radar Topographic Mission (SRTM) and sourced via a DEM raster available on Google Earth Engine [74]. The slope was calculated using the slope tool available in ArcMap 108.1.

2.3. Analysis

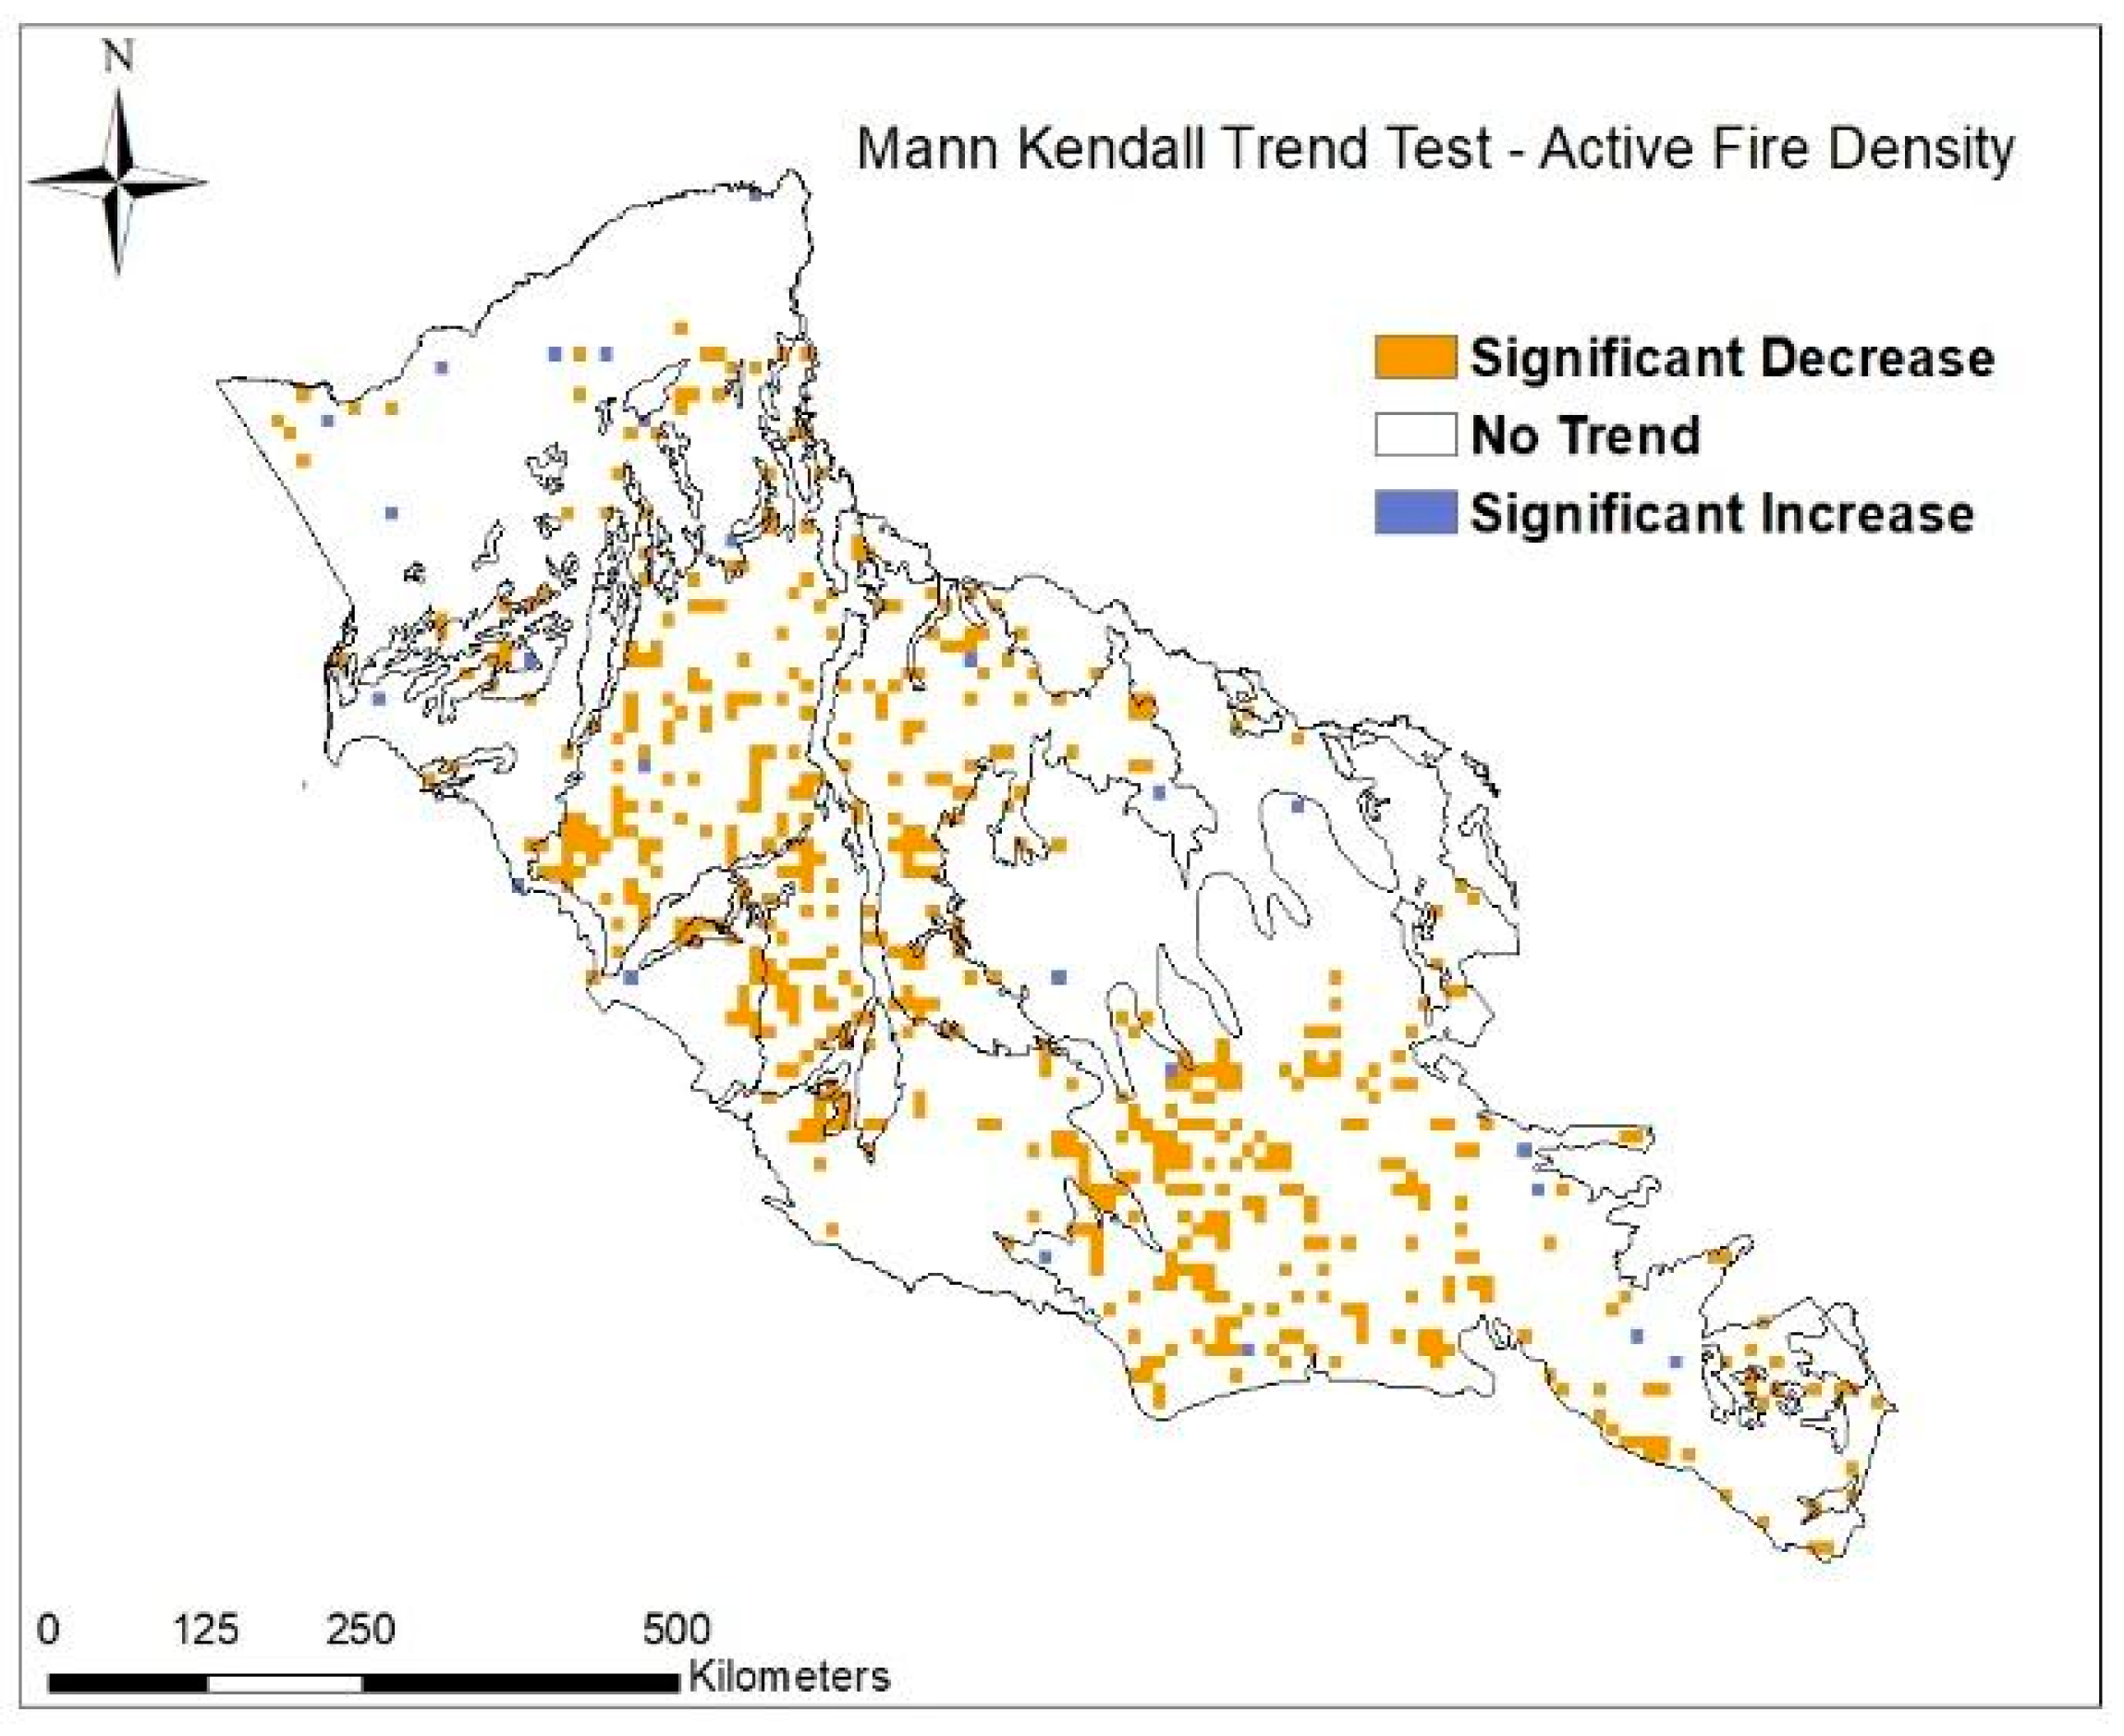
2.3.1. Mann–Kendall Trend Test

The Mann–Kendall trend test is a non-parametric test used to determine whether time-series data exhibit a directional trend [75,76,77] and which has been applied to fire activity data a number of times [78,79]. The test was applied across the whole study area and to each individual ecoregion at the 10 × 10 km grid cell scale using the raster.kendall library from the spatialEco package in RStudio. A time step of 1 year was applied to avoid potential seasonal patterns.
Table 1. Summary information for the different variables used to identify the drivers of fire dynamics, their source and brief comment on their data handling and processing [69]. All the response variables were considered at the spatial resolution of 1 km. Most of the response variables were available at this spatial resolution. The response variable raster layers with finer spatial resolution was aggregated by mean, and those with coarser spatial resolution were resampled using bilinear interpolation to the target resolution of 1 km × 1 km [80].
CategorisationVariable NameSourceComments
ClimaticMaximum Cumulative Water Deficit (mm)Precipitation data from CHIRPS [61]MCWD calculated RStudio using code from [59]
Mean Monthly Precipitation (mm/month)CHIRPS daily available from Google Earth Engine [61]Data clipped and monthly values collected using Google Earth Engine
Potential EvapotranspirationMOD16A2: MODIS Global Terrestrial Evapotranspiration 8-Day Global 1km available from Google Earth Engine [81]Data clipped using Google Earth Engine
Forest StrataPan tropical forest strata available from GLAD [69]Most common strata in each pixel used in analysis
Distance to Rivers (km)Shapefile of location of major rivers available from the World Bank Distance calculated using ‘near’ tool from ArcMap 10.8.1
AnthropogeneticGlobal Human ModificationNASA Socioeconomic Data and Applications Centre [72]Data clipped in QGIS
Distance to Cities (km)Shapefile of cities within study area from Simple Maps Distance calculated using ‘near’ tool from ArcMap 10.8.1
% of area deforested in each pixel (Deforestation Area in km2)Hansen Global Forest Change [82]Data clipped in Google Earth Engine
Distance to Roads (km)Shapefile of major roads available from World BankDistance calculated using ‘near’ tool from ArcMap 10.8.1
% change in population between 2000 to 2020Gridded population raster (“Gridded Population of the World, Version 4”)Raster clipped QGIS and percentage change calculated in Excel
TopographicElevationData elevation model obtained from SRTM [83]Data clipped in Google Earth Engine
SlopeData elevation model obtained from SRTM [83]Data clipped in Google Earth Engine
Protected AreasDistance to protected areas (km)Shapefile available from the IUCN Data clipped in QGIS

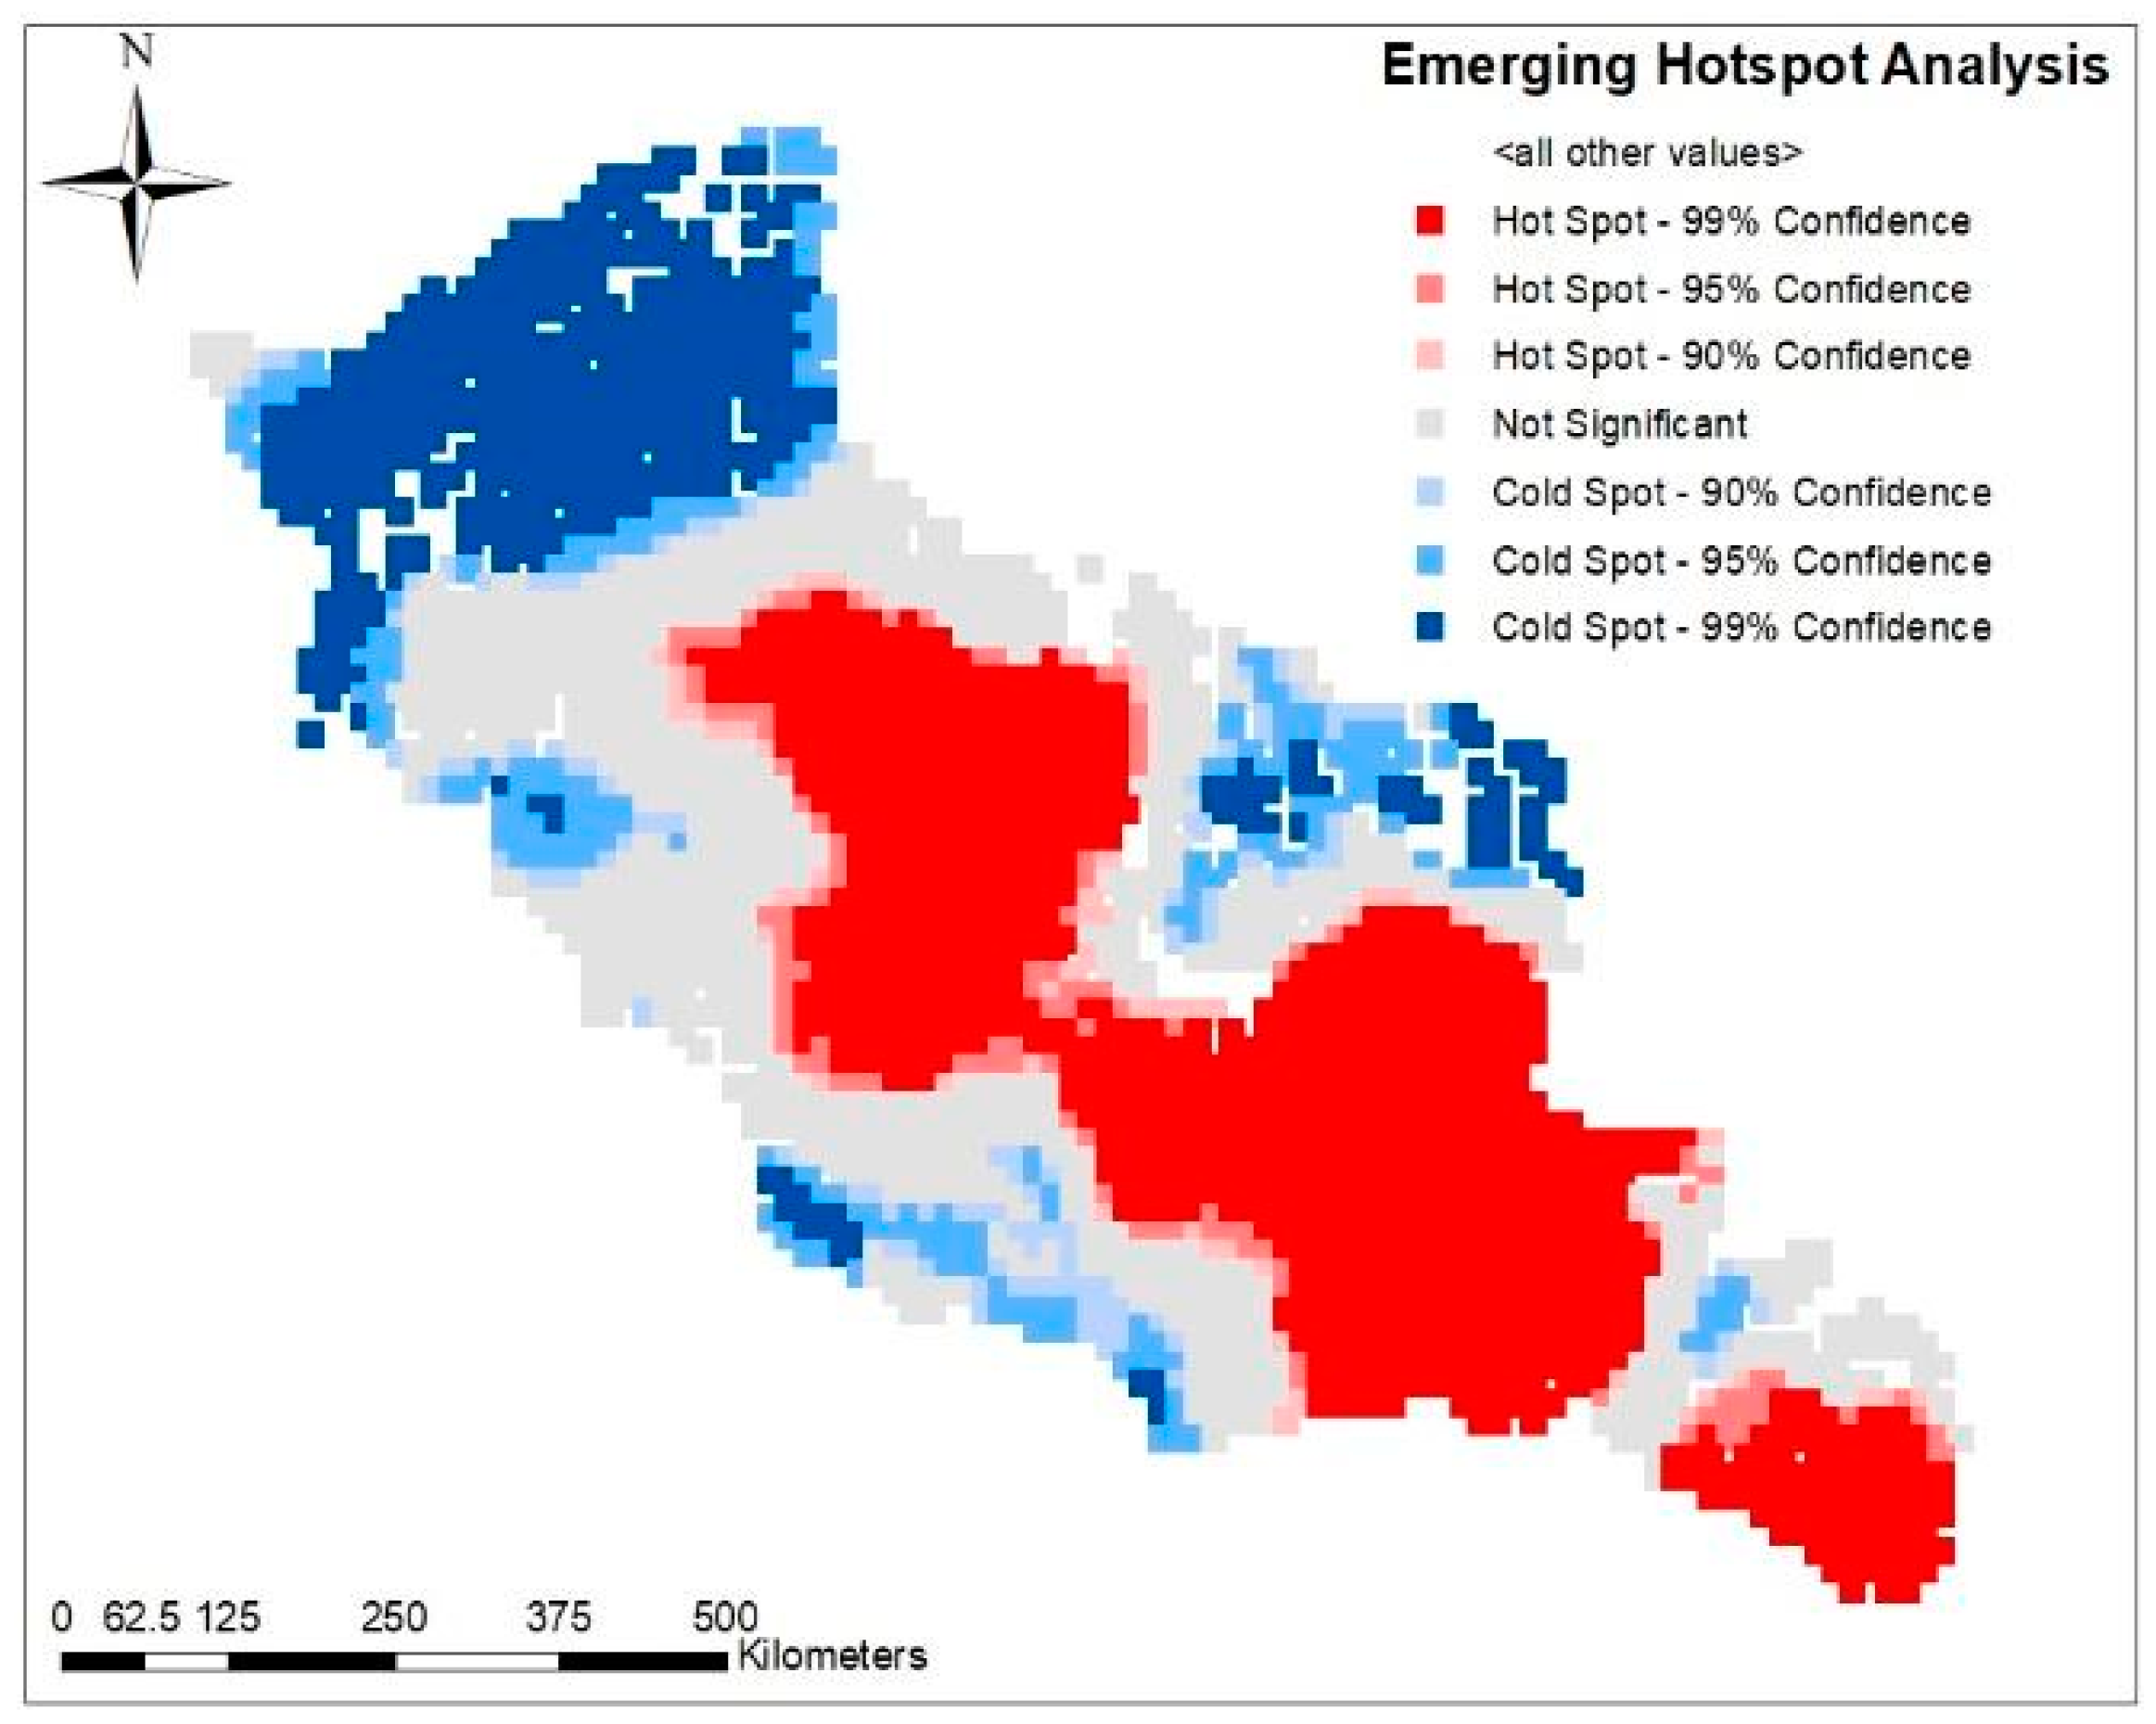
2.3.2. Emerging Hotspot Analysis

The emerging hotspot analysis evaluates both spatial and temporal trends of a phenomenon (e.g., fire occurrence) using two statistical methods: GetisOrd Gi* and Mann–Kendall. The Getis-Ord Gi* statistic calculates z-scores and p-values (measures of statistical significance for hotspots and cold spots) based on trends in spatial clustering of forest loss (counts in a bin relative to its neighbours) [84,85]. We only looked at deforestation hotspots because they have statistical significance. A hotspot with a z-score greater than 1.96 is statistically significant (at the p.05 significance level) and has a higher clustering intensity. Since the forest data were collected annually, the neighbourhood distance was set at 10 km, and the neighbourhood timestep interval (the number of timestep intervals included in the analysis) was set at one year [46].
The Mann–Kendall statistic calculates the significant trend in each bin over the course of the study. Each bin’s trend is represented by a z-score (positive for increasing trend; negative for decreasing trend) and a p-value (which indicates whether each trend is statistically significant). The expected z-score value is 0 (no trend) and is compared to the observed value to determine statistical significance. Emerging hotspot analysis can generate eight types of hotspot patterns: new, consecutive, intensifying, persistent, diminishing, sporadic, oscillating and historical [46,86].
The emerging hotspot analysis available in ArcMap10.8.1 uses the Getis-Ord Gi* statistic and the Mann–Kendall trend test to evaluate spatial and temporal trends in geospatial time series data. The Getis-Ord Gi* statistics analyses spatial clustering and estimates variation between clusters [87] and assigns z-score for all bins. The hotspot analysis then applies a Mann–Kendall trend test to estimate temporal trends over the pertinent time period [76]. Emerging Hot Spot Analysis (ArcGIS) tool helps identify statistically significant spatiotemporal trends of a point pattern, for instance, fire occurrence [46].
The emerging hotspot analysis tool in ArcMap 10.8.1 outputs a netCDF time cube. This time cube was then processed using the “visualise spacetime cube in 3 d” tool to create an easy-to-understand visualisation of any detected hotspots. The data are output as a hotspot (z-score > 1.96 for p-value < 0.05), a cold-spot (z-score < 1.96 for p-value > 0.05) or exhibiting no trend based on the values of the Getis-Ord Gi* statistic and Mann–Kendall trend test.
To run the emerging hotspot analysis, ArcGIS creates spatial temporal cubes with the time series geospatial data (in this case the fire data). We used a temporal scale/time step of 1 year and a spatial scale as performed by Singh and Yan [86].
When ArcGIS creates the Space Time Cube, it calculates the Mann–Kendall statistic for each location independently. The Mann–Kendall test is a rank correlation analysis that assesses whether an increasing or decreasing trend is present in time series data. The result of the test is compared with the expected result of no trend over time to determine if the observed result is statistically significant. Each location is given a z-score and p-value. The Emerging Hot Spot Analysis tool takes the space time cube as an input and conducts a hot spot analysis using the Getis-Ord Gi* statistic for each individual bin. The Neighbourhood Distance and Neighbourhood Time Step parameters define how many surrounding bins, in both space and time, will be considered when calculating the statistic for a specific bin. Then, the hot and cold spot trends detected by the Getis-Ord Gi* hot spot analysis are evaluated with the Mann–Kendall test to determine whether trends are persistent, increasing or decreasing over time. The results are symbolized with seventeen different categories describing the statistical significance of hot or cold spots and the location’s trend over time [88].
The concept of hotspots and cold spots comes from the original Getis-ord-based hotspot analysis that arcgis facilitates—identifying the significant clustering (of either the high or low values) of a given attribute [89]. Hotspots mean significantly higher values whereas cold spots mean significantly lower values.

2.3.3. Boosted Regression Trees

Boosted Regression Trees (BRT) are “non-parametric machine learning models” [90] applied to determine the relative influence of predictor variables on a response variable. Decision/regression models are constructed by an algorithm that splits data such that the predictive error is always minimized [91,92]. Boosting improves the accuracy of a results by producing many trees which split the data in multiple ways and then averaging these to improve the predictive performance and have been previously used to model drivers of fire dynamics [57]. In BRT models, values for tree complexity (tc), learning rate (lr) and bag fraction (bf) must be pre-specified (all details of the references are in Table 1).
Friedman [93] introduced BRT (or stochastic gradient boosting), which uses machine learning and statistical regression trees to create predictions. BRT uses a coupling approach to fit complicated nonlinear interactions, which entails fitting numerous basic models and combining them to forecast the location of objects. Detailed descriptions of BRT are found in Elith et al. [94,95].
BRT is a novel decision tree extension that uses boosting to produce an ensemble of regression trees. The source set is split into subsets based on an attribute value test, which learns the tree for improved accuracy. This recursive partitioning process is repeated for every derived subset [96].
Each tree’s dependence on earlier trees is referred to as boosting, and it is learned by fitting the residual of those earlier trees. Regression is also a supervised machine learning method that uses a labelled dataset to implement it [97]. In this work, we applied a BRT model with a bag fraction of 0.5 and a learning rate (lr) of 0.005. R version 3.0.2 was used to implement this method, and the package GBM was used [94,98].
The methodologies and insights of both statistical and machine-learning approaches are used in the BRT technique. Instead of using the boosting approach to adaptively combine a large number of various simple tree models to improve the predictive process, as is performed with conventional regression strategies, which produce a single excellent model, this approach mainly differs from those strategies [99]. The boosting method used by BRT has its roots in machine learning [100]. However, subsequent developments or posterior revolutions within the statistical community re-explain it as a sophisticated form of regression [93]. BRT has a number of important advantages over tree-based strategies, including the following: (1) it can be used with a variety of response types (binomial, Gaussian and Poisson), as long as the distribution of the error and the link function are specified; (2) it has a probabilistic or random component, which enhances predictive performance by decreasing the definitive model variance through the use of just a random data subset to adequate every new tree [93]; (3) the algorithm automatically detects the best fit; (4) the model shows the impact of each predictor on the reconstruction after accounting for their overall contributions; and (5) the algorithm is robust and unaffected by missing values and outliers [101]. The biggest problem with single tree models is solved by fitting many trees in BRT (i.e., their comparatively weak prediction achievement). BRT models can be brief in forms that give a strong hydrological perception despite their complexity. BRT is therefore appropriate for a variety of environmental applications [102]. The final Boosted Regression tree models included 12 out of the 13 initial variables as elevation was removed from all models as it was consistently highly correlated with slope. As slope is considered more influential on fire spread than elevation per se, elevation was dropped [26].
The tc specifies the number of nodes for each tree, the lr determines the contribution of each tree to the model (lower contributions require more trees) and the bf introduces randomness to the model to improve accuracy and speed and reduce overfitting (a gaussian error function was used and the bf set to 0.5) [94]. As the sample size, for this project is small, and there were ten (10) cross-validation folds used [94,103]. The overall accuracy of all the ML models was greater than 75% and were thus retained. The method established by Elith et al. [94] to model drivers for ecological geospatial data was used here and the model was created using the gbm library available from RStudio [103]. Further, univariate response curves of the most influential predictor variables were derived using partial dependence plots, that help visualize non-linear and complex relationships, along with the direction of relationship between the response and the given fire variable predictor for the three different regions under consideration (see Supplementary Materials for more details) [104].

3. Results

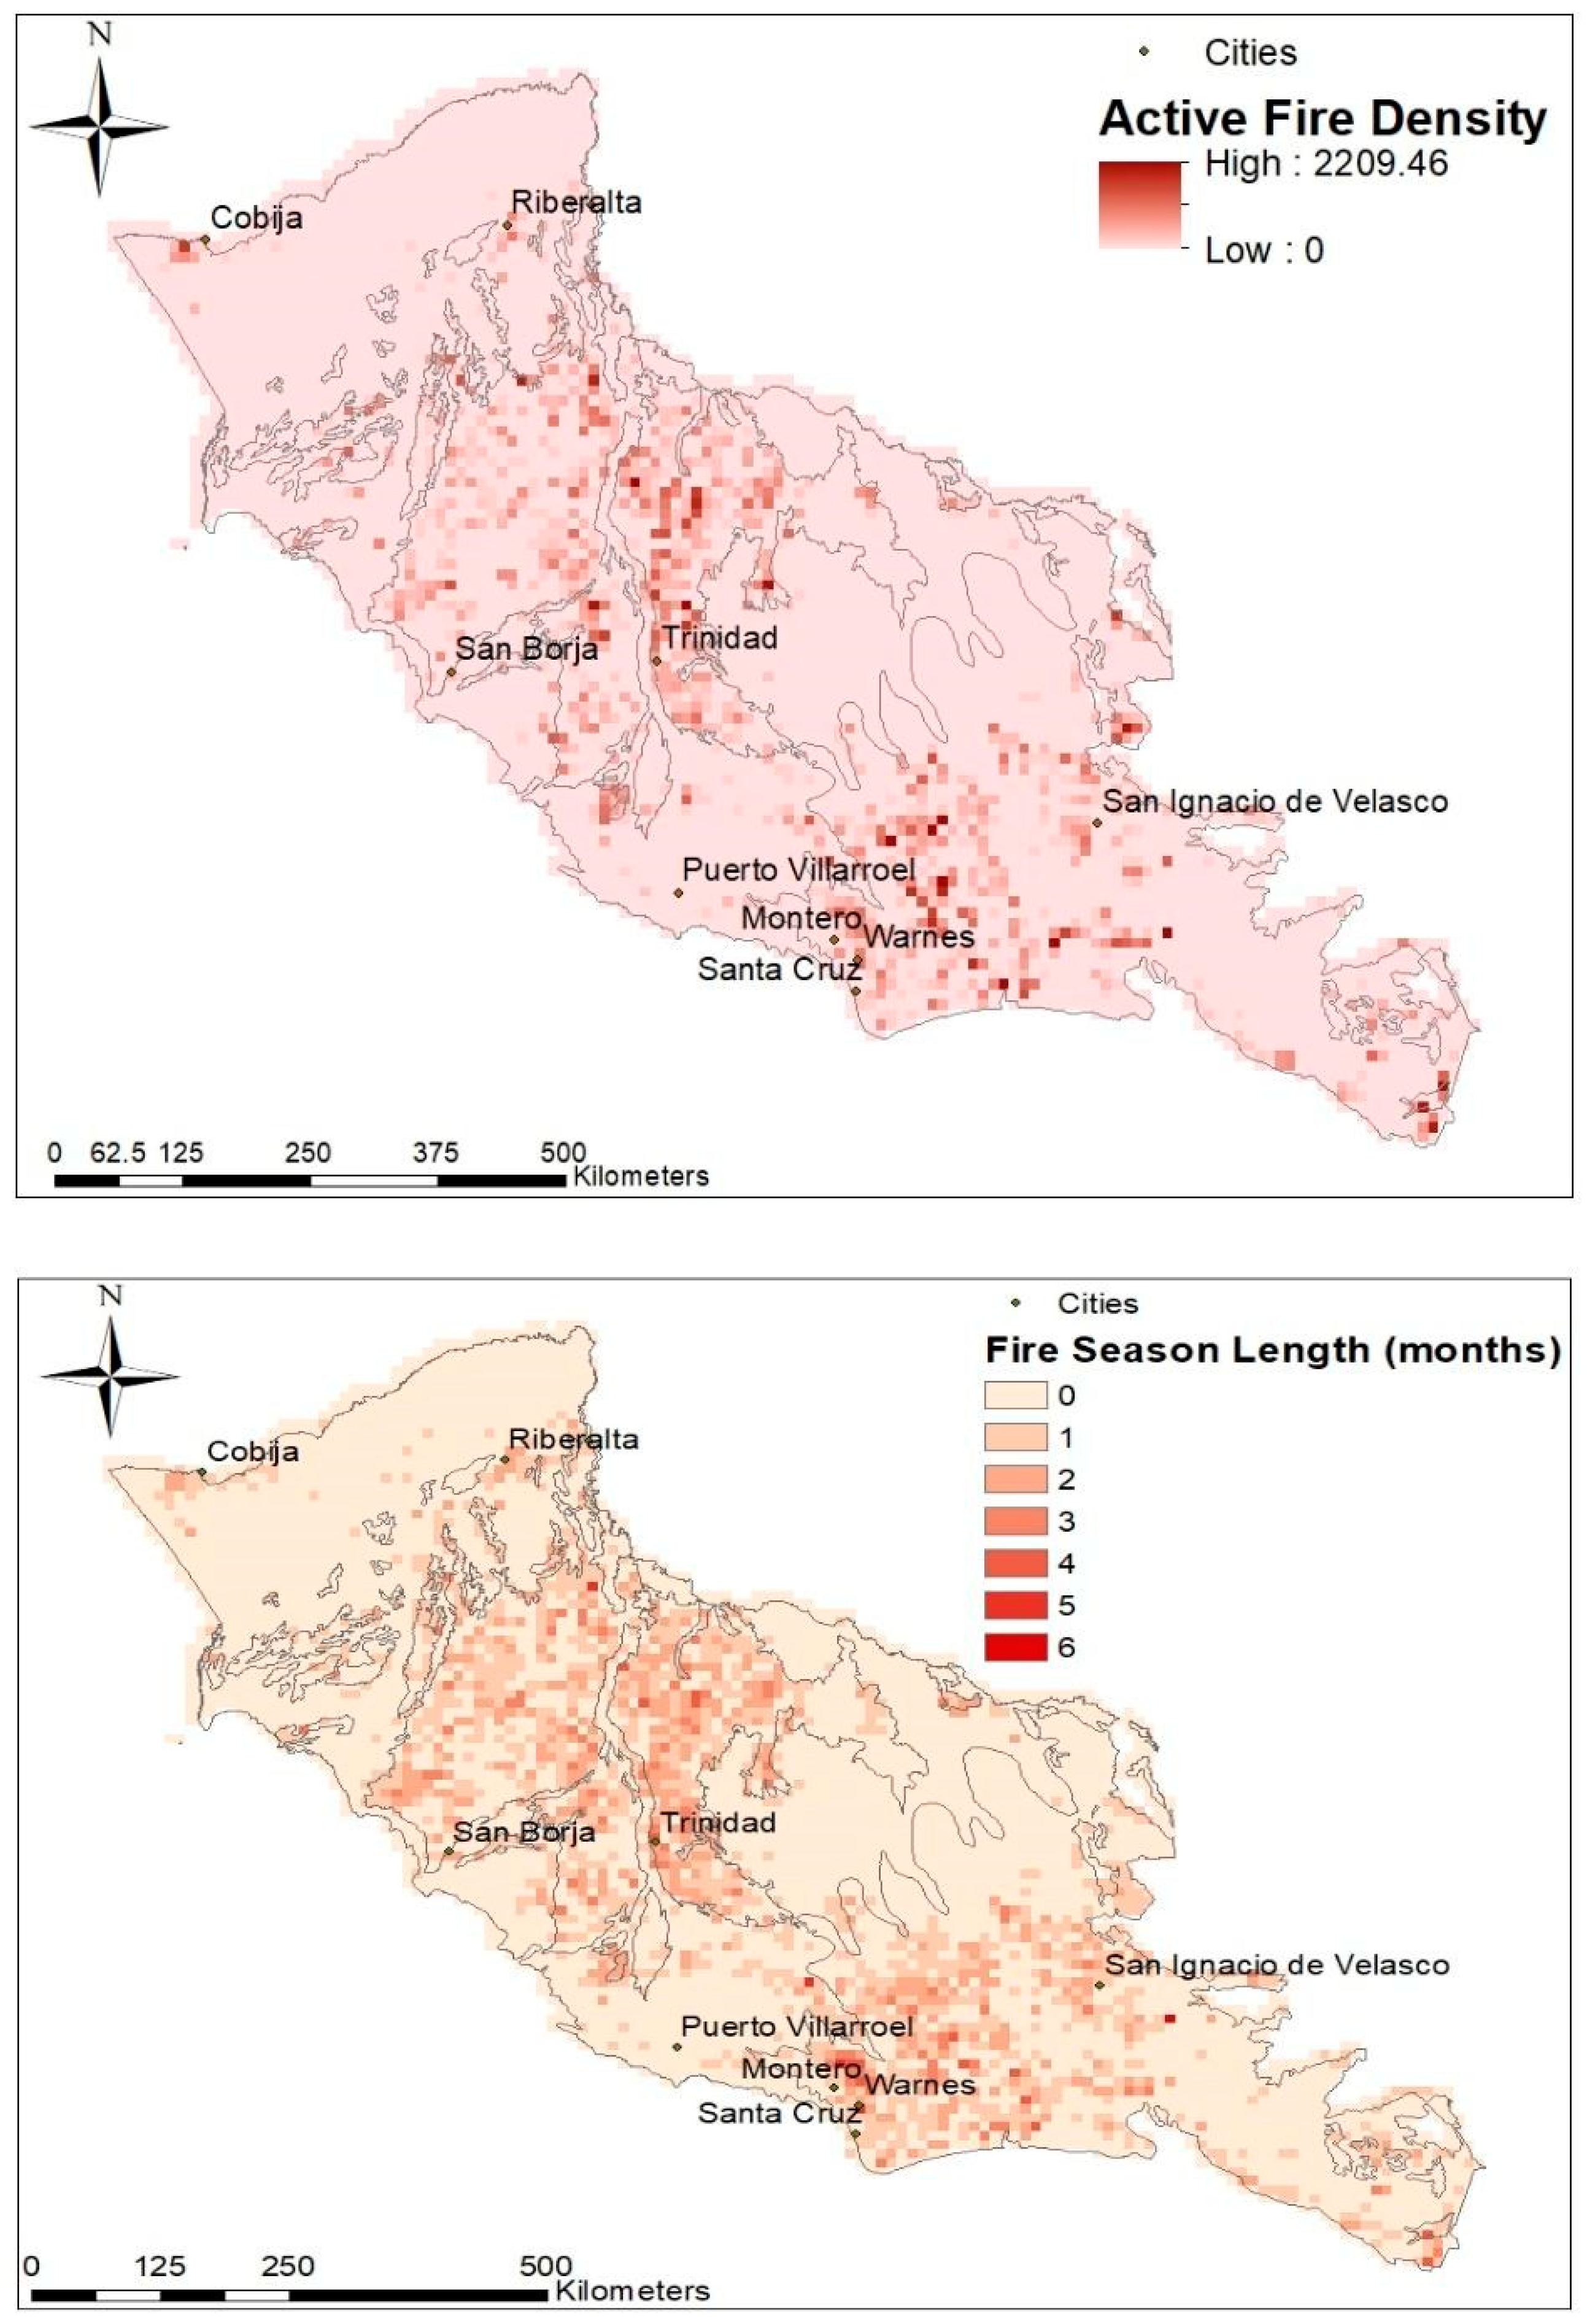
3.1. Spatial Distribution of Fire within the Bolivian Amazon Basin

The fire season lasts between 1 and 4 months for the majority of pixels within the Beni Savanna and has similar spatial variability to AFD with fire season length (FSL) typically decreasing as one moves northwest. In proximity to the major cities of Montero, Warnes and Santa Cruz, the fire density is the highest within the study area. The FSL of the Chiquitano SDTF also varies spatially (Figure 2). It is highest in the west where it can reach up to 6 months and is low in the south and southeast of the study area where AFD is also low.

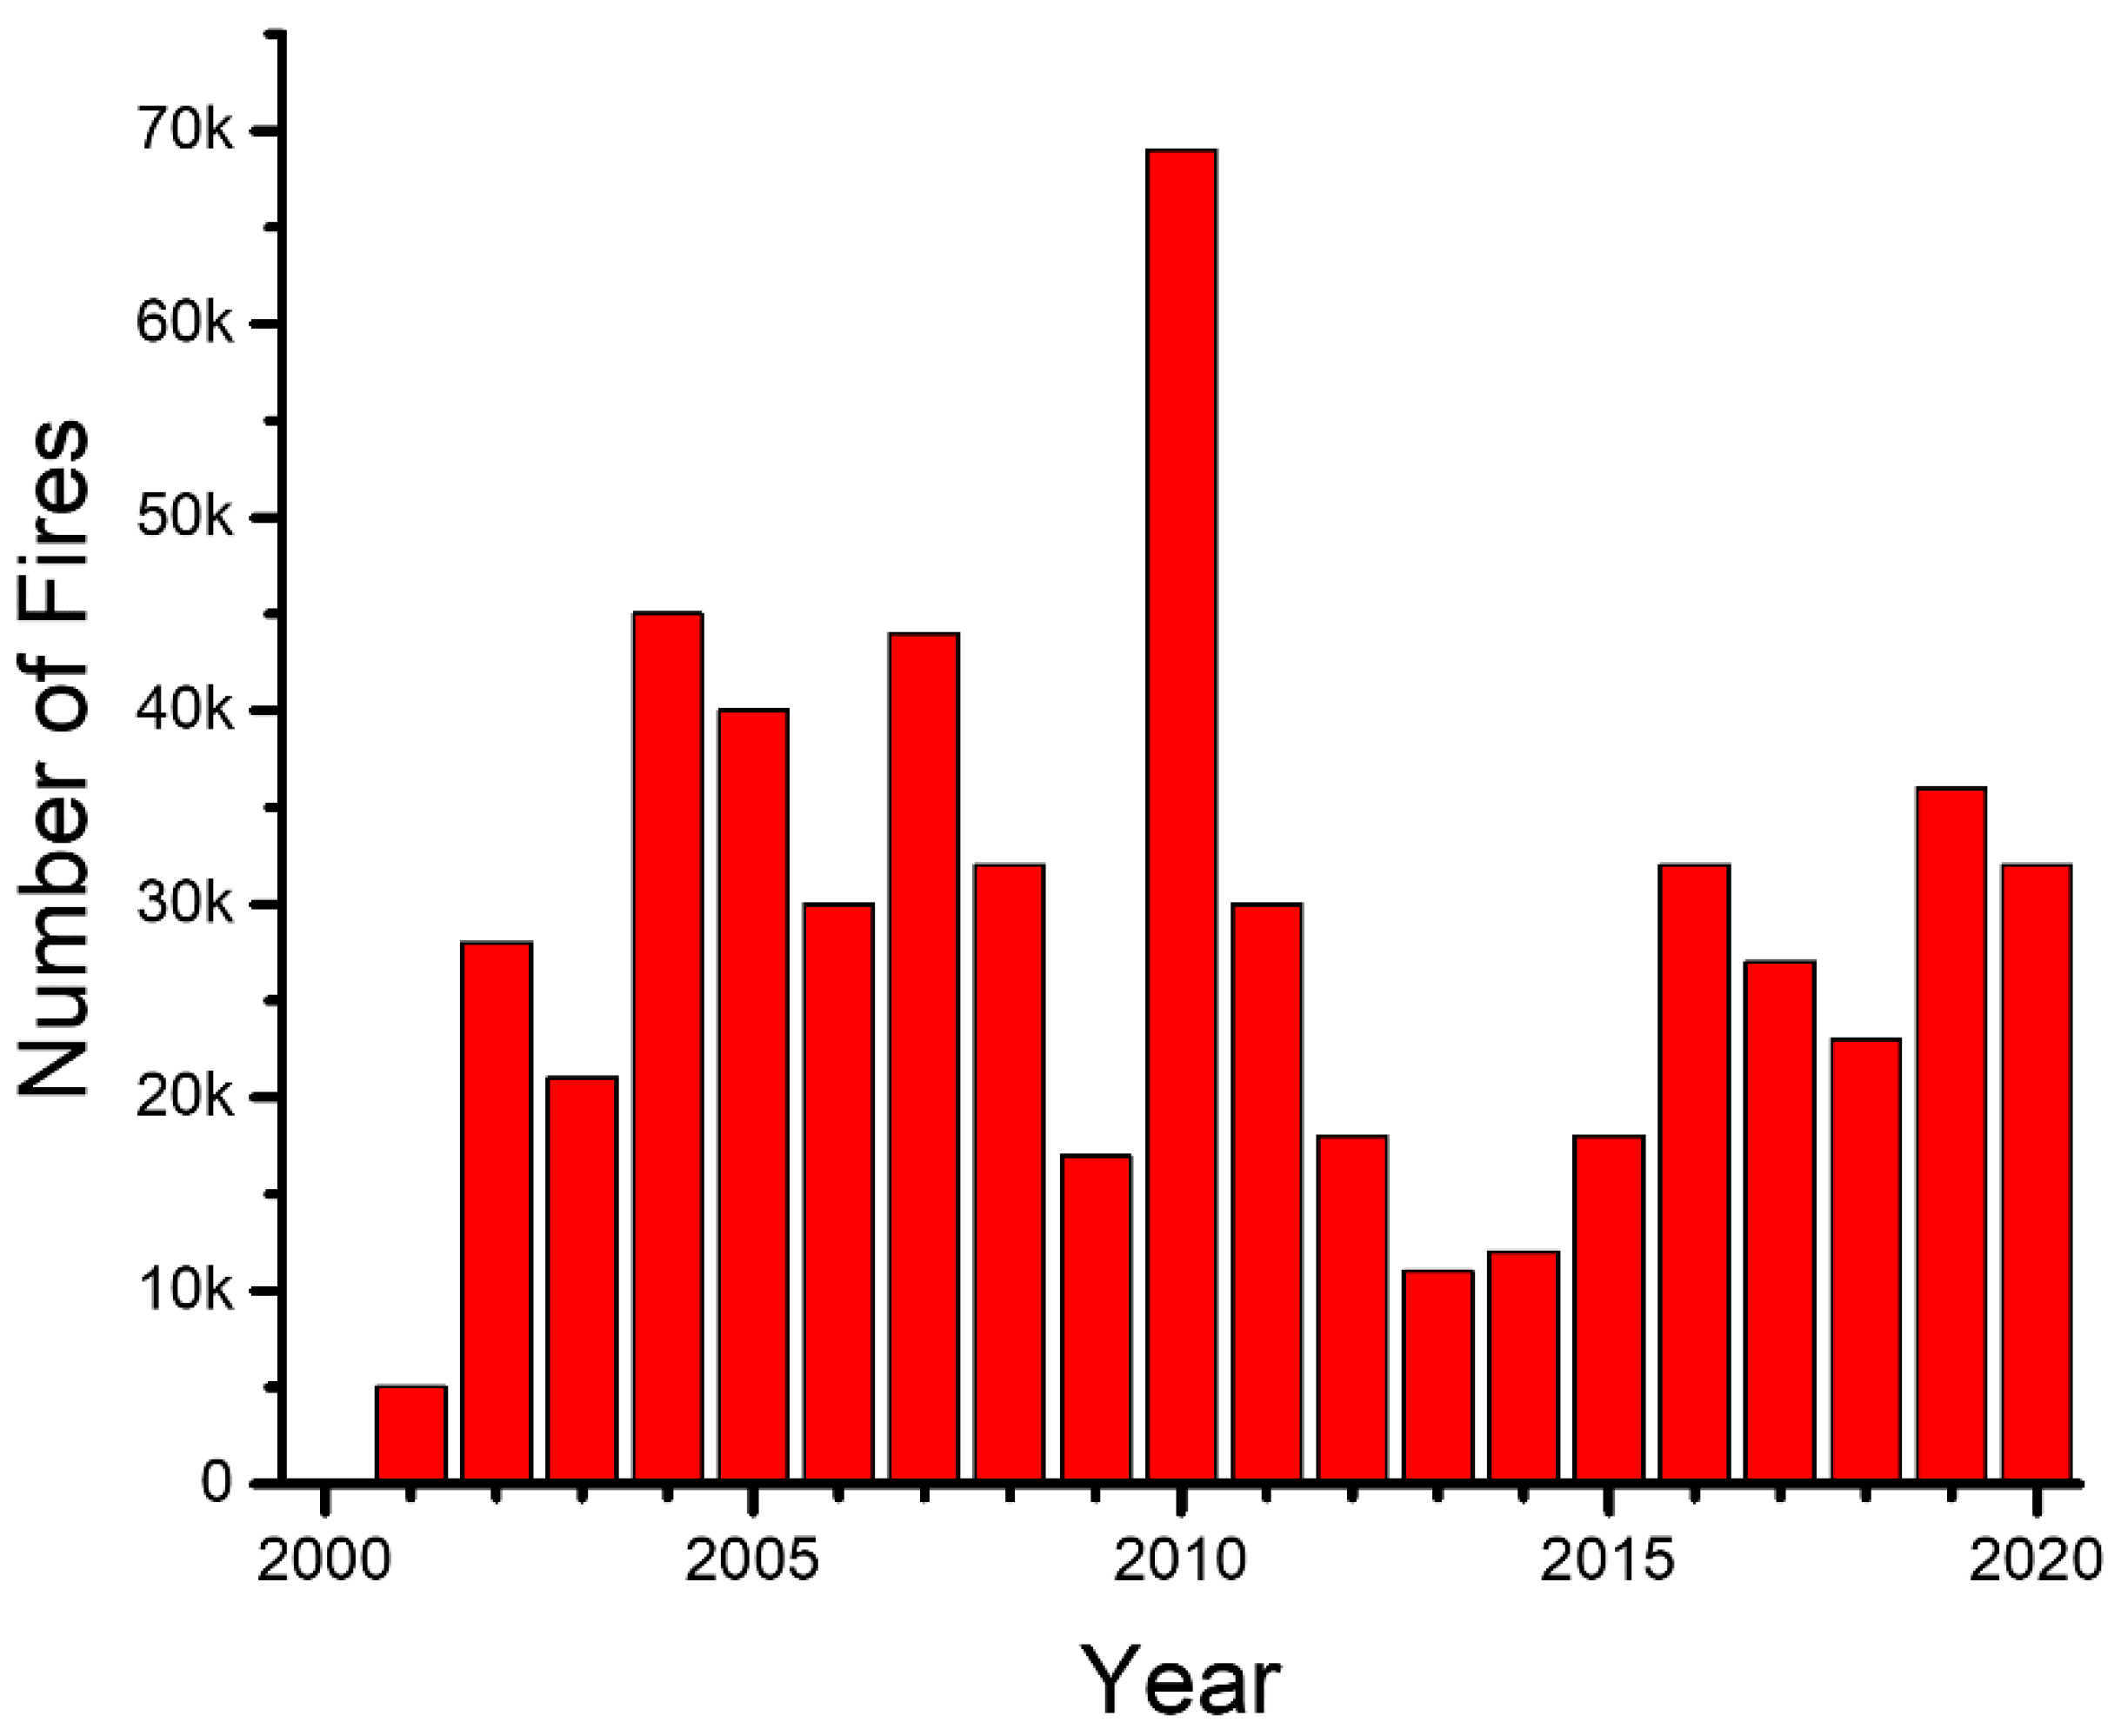
3.2. Temporal Variation in Fires

The number of fires rose between 2001 and 2010, when almost 70,000 hotspots were detected, then fell substantially until in 2015 fire numbers rose again (Figure 3). At ecoregion scale, the data point to little temporal change in fire pattern in the Bolivian Amazon whereas in the Beni Savanna and Chiquitano SDTF many pixels suggest a decreasing fire trend. The emerging hotspot analysis, shown in Figure 4, shows the occurrence of hot spots in both the Beni Savanna and Chiquitano, and cold spots in the Bolivian Amazon. This is a similar result to the spatial distribution of AFD with hotspots occurring in the Beni Savanna and Chiquitano SDTF, and cold spots in the Bolivian Amazon.

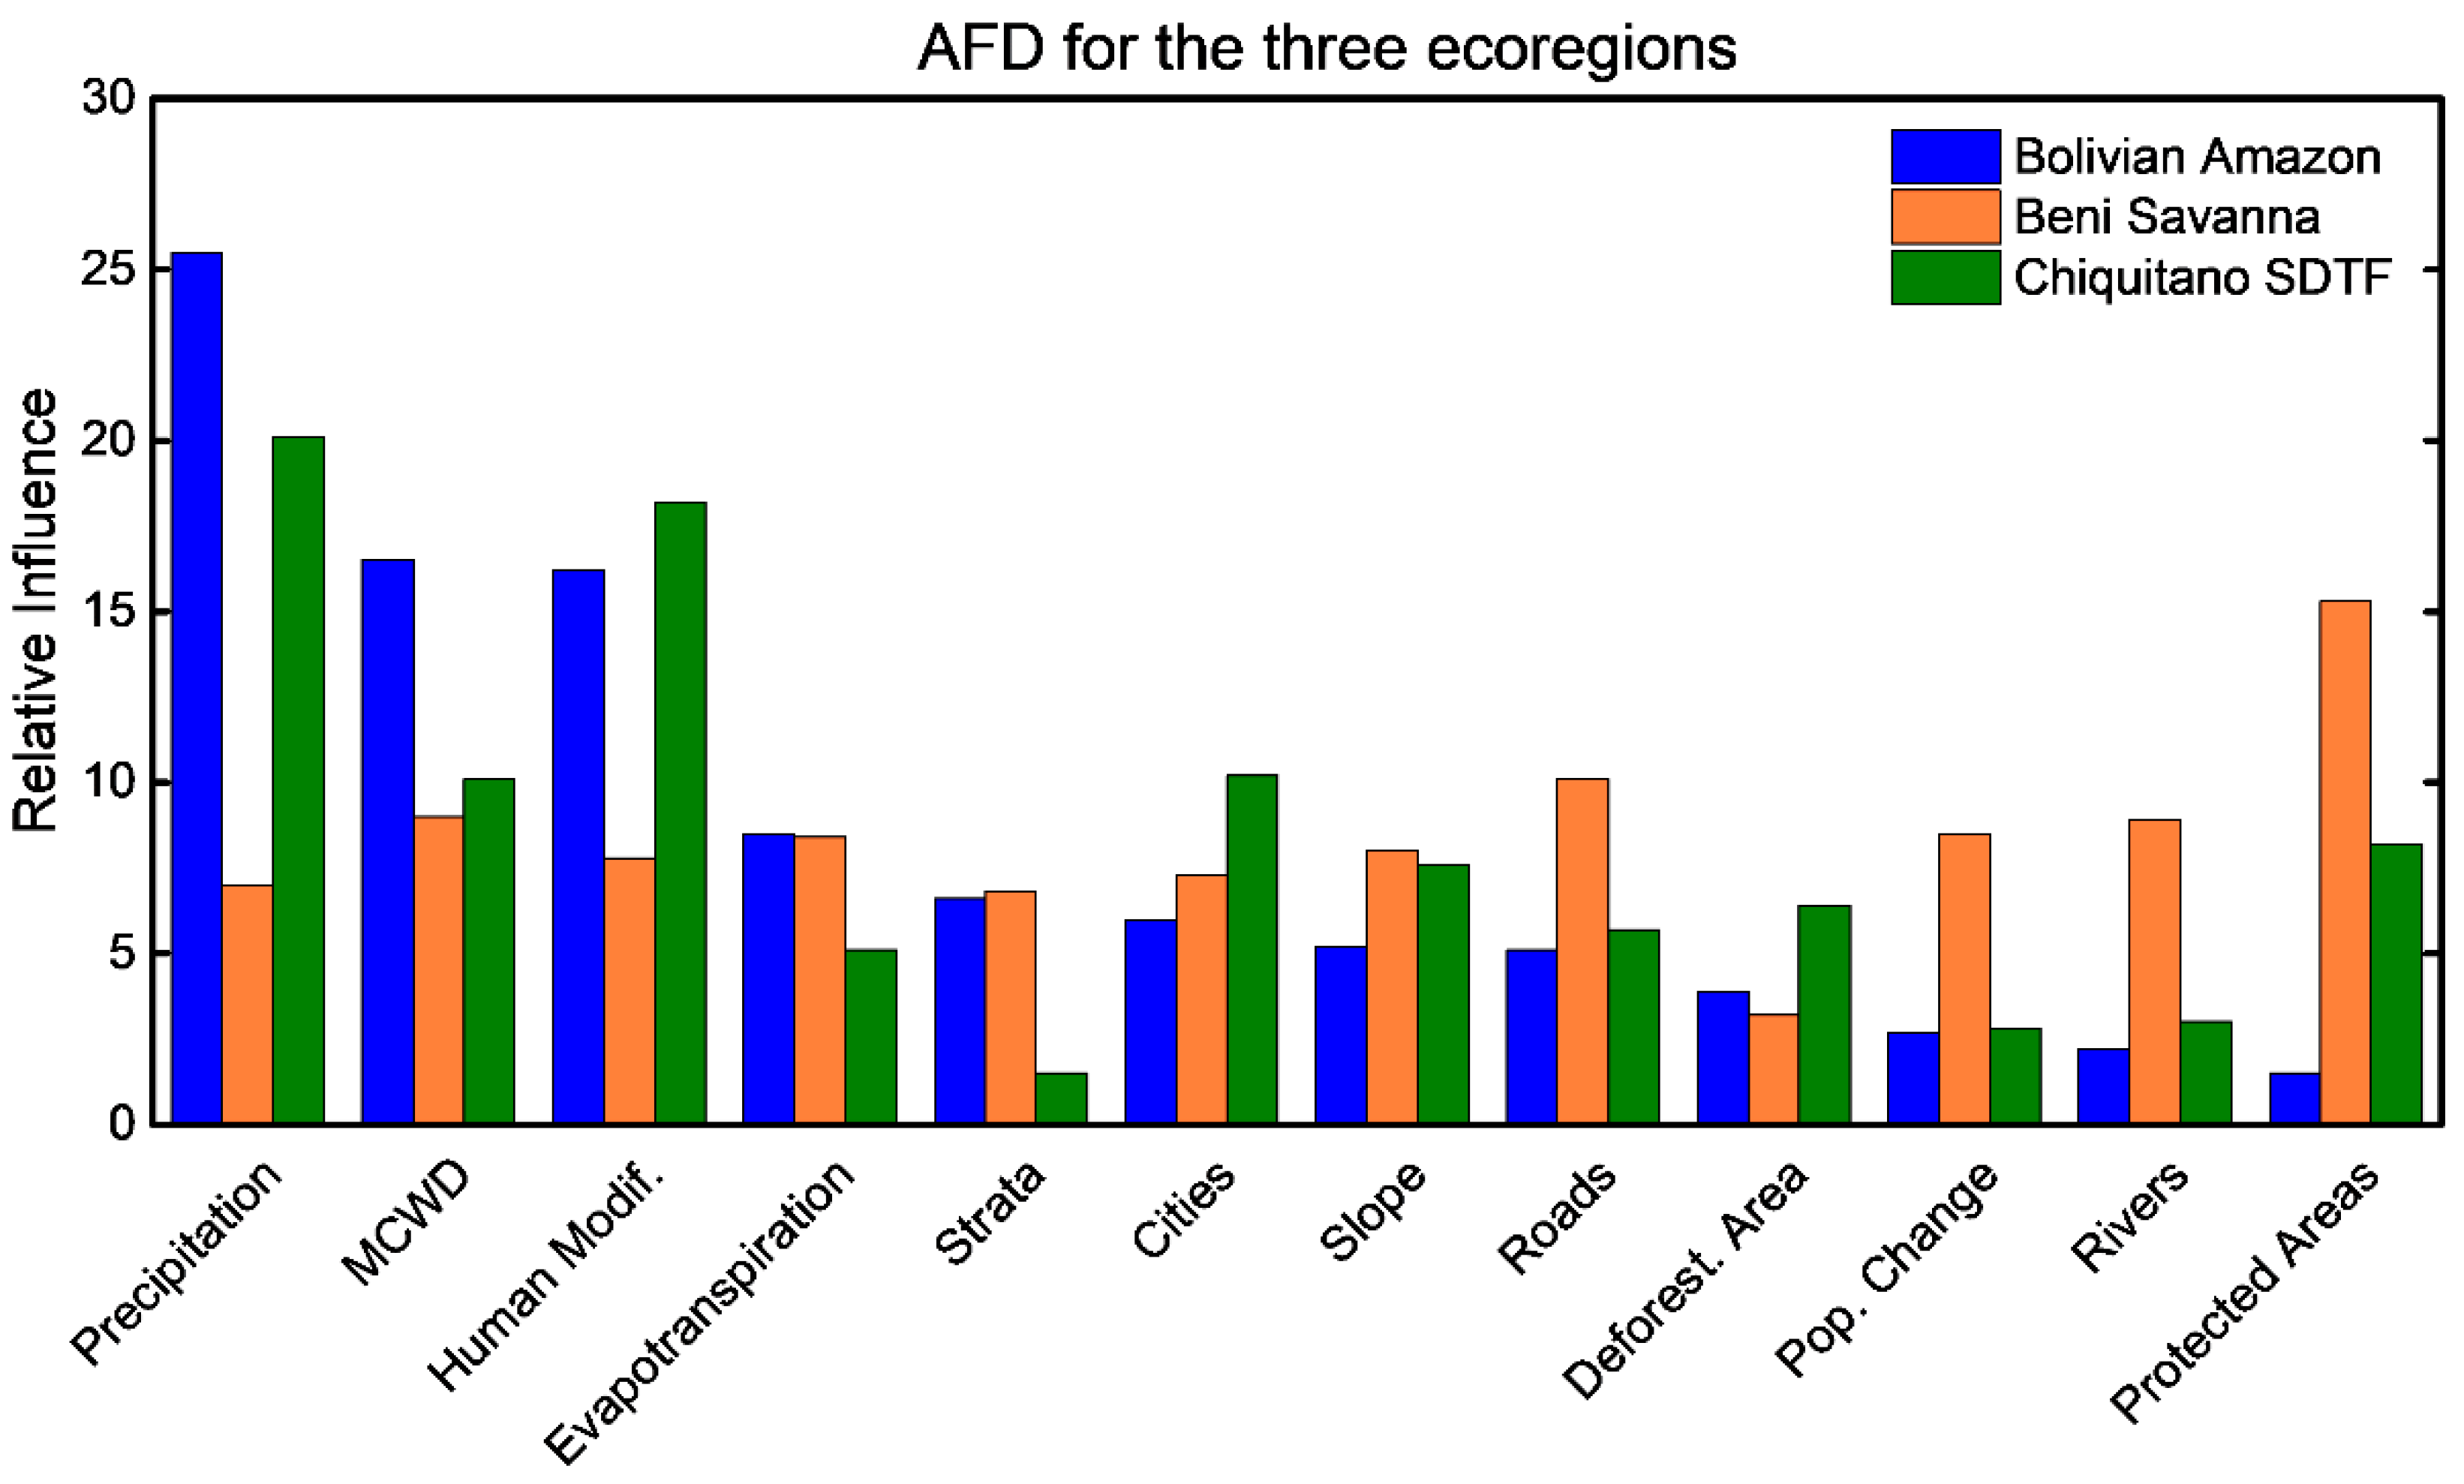
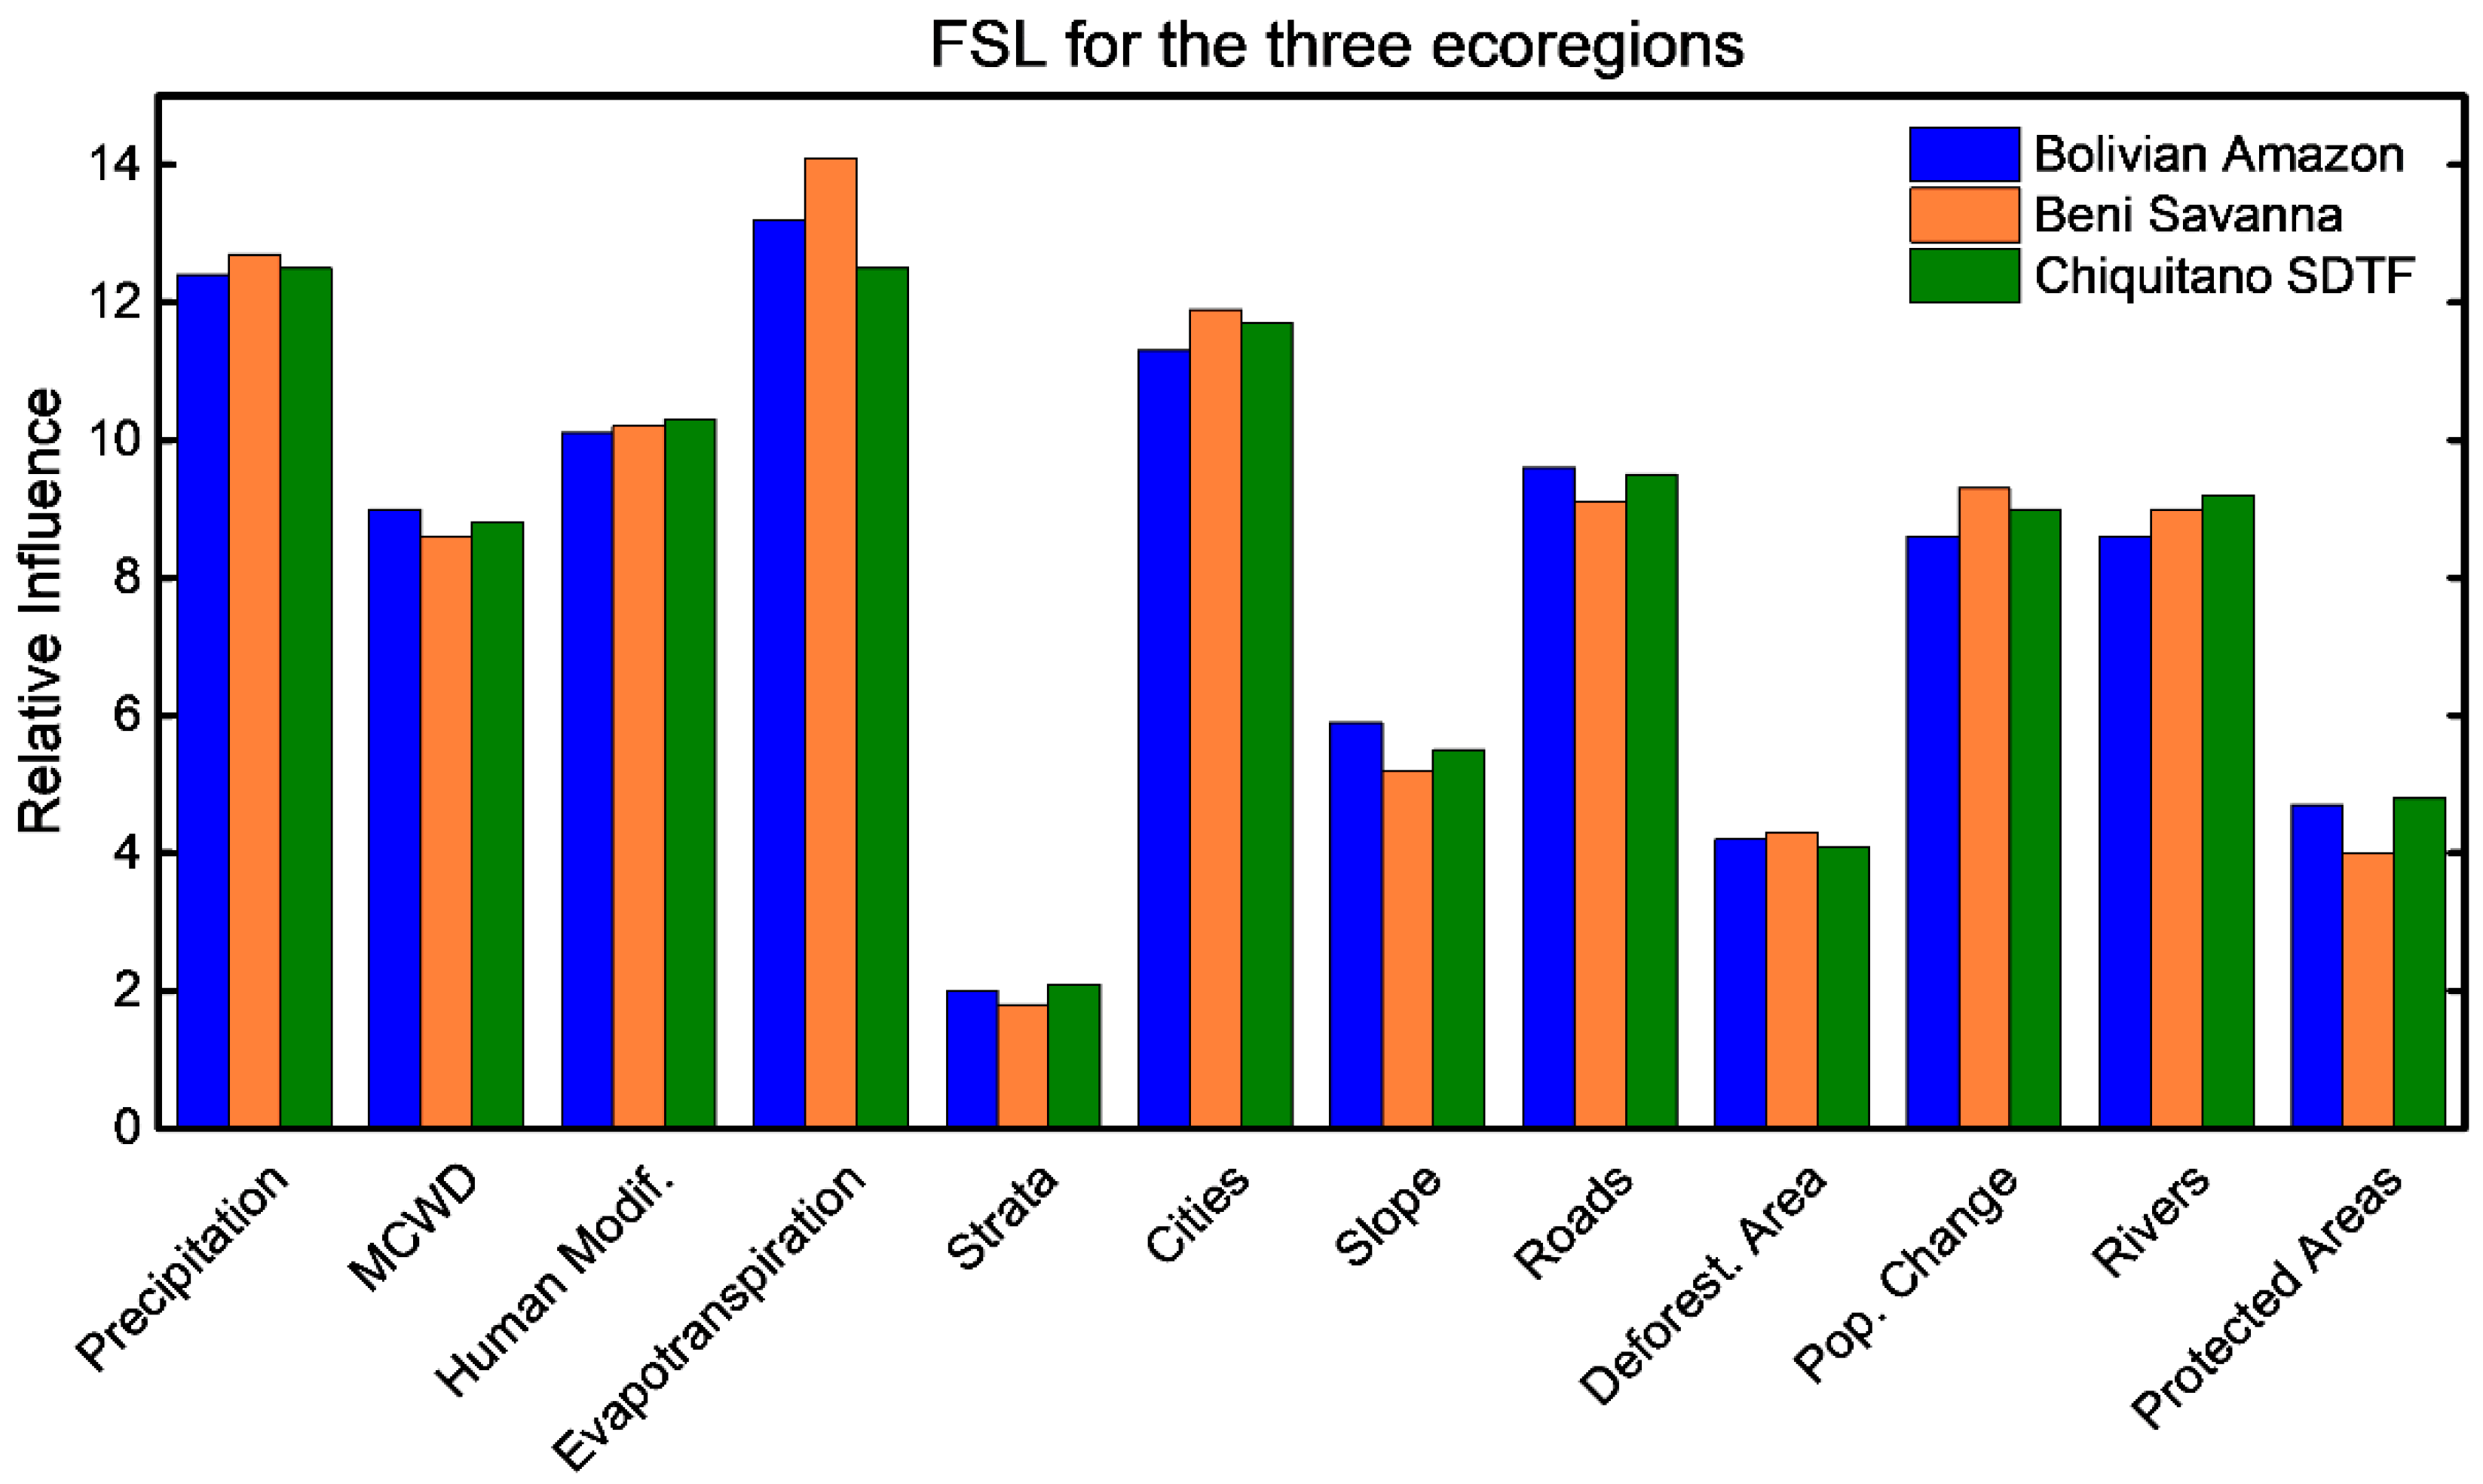
3.3. Drivers of Fire Dynamics

The model findings for drivers of AFD contrasted among the regions, particularly as the influence of drivers identified in the Beni Savannah differed substantially from the other two ecotypes considered (Figure 5). There was, however, broad congruence between the relative influence of variables on fire season length in the three ecoregions (Figure 6).

3.4. Fire Drivers of the Bolivian Amazon

The three climatic variables directly related to drought: precipitation, mean cumulative water deficit (MCWD) and potential evapotranspiration (PET) had a total relative importance of 50.6% on the AFD of the Bolivian Amazon (Figure 5). The more negative the MCWD and the lower the precipitation, the greater the AFD. Conversely, lower evapotranspiration values result in slightly elevated AFD. Human modification had a relative influence of 16.4% with AFD increasing as human modification increased. The type of forest strata also featured as the fifth most important variable for AFD in the Bolivian Amazon, regions with dense canopies had lower AFDs than those with low-mid canopies. Deforestation area, population change, distance to rivers and distance to protected areas all have a relative influence below 5% and are identified as important fire drivers in the Bolivian Amazon (see Supplementary Materials for details).
For FSL a similar trend is observed to AFD with precipitation, MCWD and PET accounting for 34% of the relative influence. A longer duration fire season occurred where precipitation was between 100–250 mm. FSL was higher for pixels with higher PET values and rose as the value of MCWD became more negative. Compared to AFD, anthropogenic variables have a greater relative importance with distance to cities, human modification and distance to roads being three of the top five variables with greatest relative influence. The forest strata, distance to protected areas, area deforested and slope all had a relative influence below 6% so have a limited impact on FSL in the Bolivian Amazon (Figure 6).

3.5. Fire Drivers of the Beni Savanna

Distance from protected areas had the highest relative influence on AFD in this ecotype (15.3%). The greater the distance from a protected area is the greater the AFD. Distance to roads, MCWD, distance to rivers and PET were the next most important identified drivers for AFD in the Beni Savanna. MCWD, PET and precipitation are less important here with a total relative influence of 24%. The area deforested had the lowest relative influence (3.2%) on AFD and forest strata type was also relatively unimportant (6.7%), though the pattern of dense canopy forest having lower AFD was like the Bolivian Amazon ecotype (see Supplementary Materials for details).
Potential evapotranspiration and total precipitation accounted for 27% of the relative influence driving FSL (Figure 6). Higher FSL is seen in regions with precipitation between 100 to 250 mm and with evapotranspiration values greater than 1150. Anthropogenic variables including distance to cities, distance to roads, population change and human modification are also important together accounting for 40% of the relative influence. The type of forest strata, distance to protected areas, area deforested and slope all had low relative influence (<6%).

3.6. Fire Drivers of the Chiquitano SDTF

Precipitation, human modification, distance to cities, MCWD and distance to protected areas are the five most influential variables for AFD in the Chiquitano SDTF, such as the Bolivian Amazon (see Supplementary Materials for details). Precipitation and MCWD together account for 30% of the relative influence; however, compared to the other ecoregions, evapotranspiration is much less important with a relative influence of 6.2%. The type of forest strata, population change and distance to rivers were less important here with relative influences below 5%.
For FSL, precipitation and PET are the two most influential variables followed by distance to cities, human modification and distance to roads. Protected areas, area deforested and strata types were not important variables in explaining the FSL in the Chiquitano SDTF. The forest strata, distance to protected areas, area deforested and slope were once again less important variables (<6%).

4. Discussion

4.1. Distribution of Fire

The spatial analysis conducted here shows that AFD and FSL are higher in both the Beni Savanna and Chiquitano SDTF than the Bolivian Amazon. This spatial trend is also observed by MAAP which analysed fire occurrence in Bolivia in 2019 and found that 54% of major fires occurred in the Beni Savanna and 38% occurred within the Chiquitano dry forests [68]. The difference in fire activity between both the Beni Savanna and Chiquitano SDTF, and the Bolivian Amazon is due to differences in vegetation, climate and agricultural trends. The Bolivian Amazon ecoregion is comprised predominantly of a moist, humid and dense canopy [44]. Fire across the different political boundaries of the Amazon rainforest is influenced by the interaction of climatic and landcover variables, including forest structure [41]. Interannual fire variability in Bolivia is especially influenced by drought conditions and exposure to anthropogenic disturbances amplifies fires under drought conditions [109]. Smaller forest fragments faced greater fire occurrences than unfragmented and contiguous forests [44].
Conversely, the Chiquitano SDTF is a much dryer ecoregion with more defined seasonality that results in extended periods of low rainfall during the austral winter [51]. As a result of the climate, the vegetation in the Chiquitano is mainly semi-deciduous, closed-canopy and dominated by thorns and succulent species [50]. These species are poorly fire adapted lacking fire adaptations such as thick, corky bark or protected buds, thus explaining the high active fire density; as fire dynamics can spread easily through the poorly fire adapted ecoregion. During the dry season of the austral winter, leaf fall is high in the Chiquitano SDTF [18], which increases solar insolation and provides a fuel source for fires so active fire density is higher during the dry season. The spread of fires, including fire speed are influenced by a variety of factors- with landcover being an important determinant. Amazon biome scale research discovered that fire speeds and spread were the highest in grass dominated ecosystems [41]. Severely dry weather conditions, especially in areas with elevated anthropogenic disturbance contributed to increased fire spread across all different landcover types [51]. Seasonality, too, influences fire spread across different ecosystems [41]. For instance, the seasonally wet and dry climate, with a June–October dry season, coupled with edaphic and hydrologic controls on vegetation composition and structure, support large wildfires in the Chiquitanía SDTF during the driest years, when there is abundant dry biomass [51]. Forest fragmentation, too, contributes to fire spread in these ecoregions [44]. The relative importance of the drivers of fire activity also varies across the three ecoregions.
The dry season peaks between August and September, but can extend up to 6 months during dry periods and often lasts as long as four months [110]. The period of the dry season is very similar to the FSL observed in this study for the Chiquitano SDTF (between 4 and 6 months) suggesting that fires in this region often only occur during the dry season [14,51].
The climate and vegetation of the Beni Savanna also provides more optimal conditions for the spread of fire than in the Bolivian Amazon. The Beni Savanna experiences an extended dry season during the austral winter which increases moisture stress and facilitates the spread of forest fire [14,111]. As this ecoregion is further north than the Chiquitano SDTF, and is seasonally flooded, the dry season does not last as long and is typically between 2 and 3 months.
The land around the Beni Savanna and Chiquitano SDTF is also more attractive for agricultural expansion than the Bolivian Amazon ecoregion [14,50]. The Beni Savanna and Chiquitano SDTF lie on fertile land with medium to high PH and nutrient status [50], which is ideal for many crops. The regions also lie close to the major municipalities of Santa Cruz and Chiquitano which contain important cities and have more developed infrastructure than the Bolivian Amazon [14]. This means that slash-and-burn is common for land management and clearance purposes [44,111] and that logging and animal pasturing is widespread [14]. Therefore, fires often become uncontrollable in these regions and during the dry season are able to spread rapidly [44], resulting in elevated fire activity. The greater presence of agriculture and infrastructure close to the major cities of Santa Cruz, Trinidad and Montero explains the longer fire season length observed in this region as fire ignition is more common over a longer period.
The temporal analysis of forest fire shows that the number of fire dynamics peaked in 2010 with approximately 70,000 fires and that most pixels within the study area display negative Mann–Kendall trends indicating subsequent decreasing fire activity. In front of is the figure of 70,000 append (0.0735 fires/km2). Every 35,000 append (0.037 fires/km2) includes fires/km2 as performed by other studies that have looked at ecoregion-scale fire dynamics across tropical South America and other tropical countries [106,112,113,114,115,116].
2010 was an El Nino year and strong winds coincided with the dry season facilitating the spread of fire and resulting in the destruction of over 1.5 million hectares of by fire dynamics in Bolivia [15]. The peak in fire intensity in 2010 was followed by a massive decrease in fire activity in the years following with 2019, for example, recording 35,000 fires. This decrease in number of fire dynamics since 2010 is the cause of the negative trends shown in the Mann–Kendall Analysis. The emerging hotspot analysis does confirm, however, that over the last twenty years fires have been quite common across the Beni Savanna and Chiquitano SDTF, hence they are shaded in red. The fire activity of these two regions is confirmed by Bolivia being one of the ten countries with the highest average annual burned area [14,62].

4.2. Role of Climatic Variables

For both the Bolivian Amazon and Beni Savanna precipitation, potential evapotranspiration and MCWD are identified as important drivers of fire dynamics. When precipitation is low, PET high and MCWD negative the moisture stress of a region is elevated and the region is experiencing drought conditions. During periods of drought, forest fire activity has been observed to be elevated across South America [24,36,110], hence the relationship between higher AFD and high moisture stress identified in this study is consistent with the previous literature. This result is also demonstrated by Argañaraz et al. [117] who deployed BRT models to analyse the fire regime in the Gran Chaco and observe annual precipitation and evapotranspiration having a high relative influence of 23.3%.
The lower influence of MCWD on fire season length in all three ecoregions is a surprising result as the literature on fire dynamics shows that fire season length is typically heavily influenced by moisture stress both globally and within South America [57,118]. The low influence of MCWD may be the result of intense fires in high moisture stress environments rapidly reducing the fuel load and inhibiting the ignition and spread of future fires in the same fire season [30,57].

4.3. Role of Protected Areas

The distance from protected areas is the most important variable accounting for fire activity in the Beni Savanna, but this was not identified as important for the Bolivian Amazon and was only slightly influential in the Chiquitano SDTF. Broadly, the literature shows that protected areas in the Amazon are effective at reducing the occurrence of fire dynamics [28,119], but this study confirms this in only one of the three forest types. Fire dynamics is caused by a complex series of interactions between both anthropogenic and climatic forcing’s. The existing body of literature has suggested that protected area locations, such as those in the Bolivian Amazon offer protection against fires [28,30,119,120]. For example, in 2020, 8500 hectares of land was burned in the Noel Kempff National Park that cuts through the Chiquitano SDTF, Bolivian Amazon and parts of the Beni Savanna. These fires are difficult to prevent because they spread quickly from agricultural sites during periods of high moisture stress, rather than being the result of inadequate management of protected areas [46]. This study only used IUCN categorized protected areas and only looked at distance from these; to make more precise inferences about the role of protected areas on fire activity other relevant variables should be considered and may provide more detailed insight on the role of protected and indigenous areas on forest fire activity and FSL.

4.4. Anthropogenic Variables

Anthropogenic variables, predominantly human modification, distance to cities, distance to roads and population change were found to have an important influence on fire season length and active fire density. This result is not unexpected as urbanisation and infrastructure development alter the natural fire regime of a region [30]. Increases to anthropogenic activity may increase ignition sources across a region as fires are ignited to clear land for urbanisation, and also for industry such as agriculture [121]. The effects of fire on an ecosystem depend on the ecosystem’s evolutionary background. From an ecological standpoint, grasslands and savannas, which are defined by the dominance of grasses, are called fire-dependent ecosystems because their plants and animals exhibit a variety of fire-related adaptations and synergies. The country’s tropical woods are not fire-adapted and do not often burn readily, unless they are experiencing severe drought or other environmental degradation, which may increase their flammability. These woods are regarded as fire-sensitive because when they do burn, fire may have a serious detrimental impact on their biodiversity. Overall, ecosystems that depend on fire for the maintenance of their biodiversity and ecological processes reap these benefits, whereas ecosystems that are sensitive to fire experience the reverse. The fire dynamics, which are the pattern of fire type, frequency, seasonality, severity and area, determine the effects of fire on a specific ecosystem and whether it is fire-dependent or fire-sensitive. Human activities have impacted natural fire dynamics, frequently in the direction of increasing frequency and extent as well as changing seasons. These modifications are typically connected to land use practices or owing to climate extremes associated to global warming and climate change. Such changed fire regimes often have detrimental consequences on ecosystem processes and services for human populations as well as biodiversity. Although the ecology is dependent on fire, most protected areas have banned fire, which will also cause significant ecological changes and frequently a very rapid loss of their natural characteristics [71].
Consequently, the fire activity and fire season length should be expected to increase as human activity increases across Bolivia and ignition sources rise. Greater human activity can be beneficial to ecoregions, however, as cities can aid in reducing the spread of fires as fuel required for fires to spread is replaced by human infrastructure [122]. A global scale analysis discovered that the increasing population density is associated with both increased and decreased in fire. The nature of the relationship depends on land-use: increasing population density is associated with increased burned are in rangelands but with decreased burned area in croplands. Overall, the relationship between population density and burned area is non-monotonic: burned area initially increases with population density and then decreases when population density exceeds a threshold. These thresholds vary regionally [123]. An examination of the spatial–temporal fire dynamics (2003-16) has been performed across the Amazon rainforest countries such as Brazil, Bolivia, Colombia, Ecuador, Guyana, Peru and Venezuela. Grass- and agriculture-dominated landscapes were discovered to be more vulnerable to fire outbreaks then undisturbed, closed-canopy forests [41]. Fires are used for land clearing, agriculture and grassland maintenance and the spillage of fires from adjoining pastures has become an important cause of fires within forested ecosystems of the Amazonian basin. Since forest structure is significantly influenced by anthropogenic activities, those variable acts as a proxy for anthropogenic impact. Creation of agricultural areas increased fire frequency in the adjacent forests [124]. High population density also results in low landscape defences against fires in many South American ecosystems [125]. The other population related attributes that contributed to fires also involved roads [126] and forest management regimes [71,127]. As mentioned previously, fire activity is the result of a complex interaction between anthropogenic and climatic forcing’s making it difficult to assess the exact impact of human activity on the forest fire regime of Bolivia. However, as fire dynamics in Bolivia have risen since 1980, coincident with mass urbanisation and the rise of the agricultural industry [8], one can confidently state that heightened human activity has had a significant role in altering the fire regime of Bolivia.

4.5. BRT Model

Overall the BRT models used in this study had relatively low cross-validated correlations when compared to other studies that have utilised Boosted Regression Trees; for example Dwomoh and Wimberly in 2017 had a cross-validated correlation of no lower than 0.64 for their four models assessing forest fire frequency in the Upper Guinean Region [57], and Argañaraz et al. [117] had a predictive deviance of 75.6%. The low cross-validated correlation of this study makes it difficult to fully draw conclusions from this study. Part of the reason for the low cross-validated correlation is due to a lack of datasets pertaining to anthropogenic and climatic activity within Bolivia [14]. This makes it difficult to fully identify drivers of fire dynamics in Bolivia using these methods as the lack of datasets means that not all desired variables can be included in the study. As, however, there is so little research relating to fire drivers and patterns within Bolivia [111] this study is useful as it provides a foundation for further research.
Future studies could also further asses the role of deforestation and agriculture on fire dynamics within Bolivia. This study identified no relationship between area deforested and fire activity or fire season length which is contrary to the findings of similar papers across Amazonia [6,24,60,128]. The study also found very little relationship between forest strata and fire dynamics: this is likely due to issues with the processing of the GLAD pan tropical forest strata dataset that contained a large number of points, particularly within the Beni Savanna and Chiquitano SDTF, that were categorised as no data or cloud cover [129]. This made it difficult to identify the exact strata present in each grid cell and reduce the effectiveness of the strata variable in analysing trends within the study area. Furthermore, as the Beni Savanna ecoregion is a mosaic of different sub-ecoregions [27] the technique used to identify the strata of each grid cell may have further limited the effectiveness of this variable (see Section 2) as the most common strata type was selected for each grid cell. Perhaps if the grid cells were smaller this would have more accurately represented the forest strata and this is an avenue for further research.
Finally, future studies could look to include a greater number of recorded hotspots from the MODIS dataset. As mentioned in section X, this study clipped all fires below a 70% confidence interval to ensure that only hotspots with a high likelihood of being a fire were included in the study [55]. If lower confidence interval fires were included in the study, perhaps by using a clip of 30% [3,57], greater insight could have been achieved. However, based on the processing times and processing ability of the computers utilised in this study, this was not possible. While FIRMS data were provided via GEE in raster form, the attributes that we worked with were only available in the Shapefiles format via their website. Using the vector form of FIRMS Shapefiles is one of the most common ways of using these data in research. Shapefile of FIRMS was previously used in some studies [130,131,132,133,134].

5. Conclusions

The Chiquitano SDTF and the Beni Savanna had higher active fire density and longer fire seasons than the Bolivian Amazon. Their vegetation, climate and agriculture all vary and warm weather, lengthy dry seasons and poorly fire-adapted flora characterize the Chiquitano SDTF and, to a lesser extent, the Beni Savana [18,50]. They also sit on rich soil ideal for agriculture which provides conditions for both the ignition and propagation of fire dynamics. The Bolivian Amazon, on the other hand, has a humid environment that serves to suppress tiny fires before they can grow in magnitude or travel far, resulting in a low active fire density. Most grid cells in this study displayed no temporal trend or saw a decrease in active fire density over the period of the study. This can largely be attributed to the exceptionally large fire dynamics that burned huge areas across Bolivia in 2010 as fire activity peaked and the number of fires recorded in a single year between 2011 and 2020 has not exceed half the number subsequently.
In general, water stress was the main driver of forest fire activity. This aligns well with the literature that identifies drought conditions as the primary determinant of fire dynamics within the broader Amazon basin [70]. It also presents an issue for the future preservation of the Beni Savanna, Chiquitano SDTF and Bolivian Amazon. As the impact of climate change increases, drought conditions and water stress will increase resulting in elevated forest fire occurrence across Bolivia. Anthropogenic variables including human modification, distance to cities, population change and distance to roads were also found to account for both active fire density and fire season length. Increased human activity increases the number of ignition sources for fire dynamics and land-use change can increase the flammability of forests.
The BRT models had low cross-validated correlations (<0.4) relative to similar studies [3,57]. In addition, the work was partially limited by a lack of available datasets containing useful anthropogenic and climatic variables: this is an issue observed by other researchers looking at the fire regime of Bolivia [14]. More datasets covering a greater variety of anthropogenic and climatic variables will improve insight into the drivers of fire dynamics.
There has been very little research performed into the contemporary and historical fire regimes of these ecoregions. Our study is the first of its kind that has carried out a systematic cross comparative analysis of the fire dynamics of this region [20,26,77,128,130]. Outside of the Brazilian Amazon, relatively fewer studies have examined the fire dynamics of other South American tropical ecosystems. This study is the first of its kind that has compared the fire dynamics of three distinct tropical South American ecosystems. Previous research on the Bolivian Chiquitania ecoregion revealed that while drier conditions increase fire risks, fire risks were significantly higher in human dominated regions, especially those with cattle ranching [51]. Fires in the Bolivian Amazon too are elevated as a consequence of anthropogenic impacts [44] and ENSO [125]. Chiquitano forests respond to recurrent fires through a shift in tree species composition with already-present fire-tolerant species becoming more dominant. This transition presented losses in biomass but increases in species richness [135]. Grass-dominated vegetation, not species-diverse natural savanna, replaces degraded tropical forests on the southern edge of the Amazon Basin [136]. Topographic and variables explain local fire incidences in many parts of the Amazon rainforest [137].
Overall, this study has provided information on the spatial and temporal patterns, as well as the causes, of fire dynamics in the Bolivian Amazon, Chiquitano SDTF and Beni Savanna. It has limitations, but it gives much needed insight into the fire regime of the Bolivian Amazon—a region that is vastly understudied. Future research will use these results to better constrain the patterns and causes of fire in Bolivia, assisting with conservation and climate change adaptation efforts.

Supplementary Materials

The following supporting information can be downloaded at: https://www.mdpi.com/article/10.3390/land11091436/s1. Figure S1: fitted functions for active fire density for the Bolivian Amazon; Figure S2: fitted functions for fire season length for the Bolivian Amazon; Figure S3: fitted functions for active fire density for the Beni Savanna; Figure S4: fitted functions for fire season length for the Beni Savanna; Figure S5: fitted functions for active fire density for the Chiquitano SDTF; Figure S6: fitted functions for fire season length for the Chiquitano SDTF.

Author Contributions

M.S.: Conceptualization, Methodology, Software Support, Writing; S.S.: Data Sourcing, Data Curation, Analysis, Draft Preparation; C.M.C.: Oversight, Analysis, Support and Guidance, Writing, Editing. All authors have read and agreed to the published version of the manuscript.

Funding

This research received no external funding.

Data Availability Statement

The data used in the analysis of fire dynamics in Bolivia can be obtained here: https://drive.google.com/drive/folders/1_DVtBIQZUQr-DfD3rDTmlXc3ekVh02CB. Accessed on 23 February 2022.

Acknowledgments

We would like to thank Maria Vinogradova, Mark Burgman and the CEP of Imperial College London for the supportive atmosphere that they provide.

Conflicts of Interest

The authors declare no conflict of interest.

References

  1. Kemp, D.B.; Eichenseer, K.; Kiessling, W. Maximum rates of climate change are systematically underestimated in the geological record. Nat. Commun. 2015, 6, 8890. [Google Scholar] [CrossRef] [PubMed]
  2. Ceballos, G.; Ehrlich, P.R.; Raven, P.H. Vertebrates on the brink as indicators of biological annihilation and the sixth mass extinction. Proc. Natl. Acad. Sci. USA 2020, 117, 13596–13602. [Google Scholar] [CrossRef] [PubMed]
  3. Silveira, M.V.F.; Petri, C.A.; Broggio, I.S.; Chagas, G.O.; Macul, M.S.; Leite, C.C.S.S.; Ferrari, E.M.M.; Amim, C.G.V.; Freitas, A.L.R.; Motta, A.Z.V.; et al. Drivers of fire anomalies in the Brazilian Amazon: Lessons learned from the 2019 fire crisis. Land 2020, 9, 516. [Google Scholar] [CrossRef]
  4. Saura, S.; Bastin, L.; Battistella, L.; Mandrici, A.; Dubois, G. Protected areas in the world’s ecoregions: How well connected are they? Ecol. Indic. 2017, 76, 144–158. [Google Scholar] [CrossRef] [PubMed]
  5. Brazilian Amazon Fires Scientifically Linked to 2019 Deforestation: Report. Available online: https://news.mongabay.com/2019/09/brazilian-amazon-fires-scientifically-linked-to-2019-deforestation-report/ (accessed on 15 July 2022).
  6. Bush, M.B.; Silman, M.R.; McMichael, C.; Saatchi, S. Fire, climate change and biodiversity in Amazonia: A Late-Holocene perspective. Philos. Trans. R. Soc. B Biol. Sci. 2008, 363, 1795–1802. [Google Scholar] [CrossRef]
  7. Dos Santos, J.F.C.; Gleriani, J.M.; Velloso, S.G.S.; de Souza, G.S.A.; do Amaral, C.H.; Torres, F.T.P.; Medeiros, N.D.G.; dos Reis, M. Wildfires as a major challenge for natural regeneration in Atlantic Forest. Sci. Total Environ. 2019, 650, 809–821. [Google Scholar] [CrossRef]
  8. Steininger, M.K.; Tucker, C.J.; Townshend, J.R.G.; Killeen, T.J.; Desch, A.; Bell, V.; Ersts, P. Tropical deforestation in the Bolivian Amazon. Environ. Conserv. 2001, 28, 127–134. [Google Scholar] [CrossRef]
  9. Peres, C. Arc of Deforestation, Brazil; Whitley Award: London, UK, 2020. [Google Scholar]
  10. Levy, M.C.; Lopes, A.V.; Cohn, A.; Larsen, L.G.; Thompson, S.E. Land Use Change Increases Streamflow Across the Arc of Deforestation in Brazil. Geophys. Res. Lett. 2018, 45, 3520–3530. [Google Scholar] [CrossRef]
  11. Fujisaka, S.; Bell, W.; Thomas, N.; Hurtado, L.; Crawford, E. Slash-and-burn agriculture, conversion to pasture, and deforestation in two Brazilian Amazon colonies. Agric. Ecosyst. Environ. 1996, 59, 115–130. [Google Scholar] [CrossRef]
  12. NASA Earth Observatory Deforestation Patterns in the Amazon. Available online: https://earthobservatory.nasa.gov/images/4385/deforestation-patterns-in-the-amazon (accessed on 31 August 2021).
  13. Portillo-Quintero, C.; Sanchez-Azofeifa, A.; Marcos do Espirito-Santo, M. Monitoring deforestation with MODIS Active Fires in Neotropical dry forests: An analysis of local-scale assessments in Mexico, Brazil and Bolivia. J. Arid Environ. 2013, 97, 150–159. [Google Scholar] [CrossRef]
  14. Bustillo Sánchez, M.; Tonini, M.; Mapelli, A.; Fiorucci, P. Spatial assessment of wildfires susceptibility in santa cruz (Bolivia) using random forest. Geoscience 2021, 11, 224. [Google Scholar] [CrossRef]
  15. Juárez-Orozco, S.M.; Siebe, C.; Fernández y Fernández, D. Causes and Effects of Forest Fires in Tropical Rainforests: A Bibliometric Approach. Trop. Conserv. Sci. 2017, 10, 1–14. [Google Scholar] [CrossRef]
  16. Romero-Muñoz, A.; Jansen, M.; Nuñez, A.; Toledo, M.; Vides-Almonacid, R.; Kuemmerle, T. Fires scorching Bolivia’s Chiquitano forest Misguided approach to dengue vaccine risk. Science (80-) 2019, 49, 7264. [Google Scholar]
  17. Kara, A.; Juan, M.D.; Maria, G.G.; Catherine, M.H.; David, M.; Camila, P.; Salgado-Negret, B.; Smith, C.M.; Trierweiler, A.; Van Bloem, S.J.; et al. Will seasonally dry tropical forests be sensitive or resistant to future changes in rainfall regimes. Environ. Res. Lett. 2017, 12, 1–15. [Google Scholar]
  18. Power, M.J.; Whitney, B.S.; Mayle, F.E.; Neves, D.M.; De Boer, E.J.; Maclean, K.S. Fire, climate and vegetation linkages in the Bolivian Chiquitano seasonally dry tropical forest. Philos. Trans. R. Soc. B Biol. Sci. 2016, 371, 20150165. [Google Scholar] [CrossRef] [PubMed]
  19. Hartung, M.; Carreño-Rocabado, G.; Peña-Claros, M.; van der Sande, M.T. Tropical Dry Forest Resilience to Fire Depends on Fire Frequency and Climate. Front. For. Glob. Change 2021, 4, 755104. [Google Scholar] [CrossRef]
  20. Alencar, A.A.; Brando, P.M.; Asner, G.P.; Putz, F.E. Landscape fragmentation, severe drought, and the new Amazon forest fire regime. Ecol. Appl. 2015, 25, 1493–1505. [Google Scholar] [CrossRef]
  21. Deforestation in Bolivia. Available online: https://www.esa.int/ESA_Multimedia/Images/2020/01/Deforestation_in_Bolivia (accessed on 15 July 2022).
  22. Morrison, P.H. Roads and Wildfires; Pacific Biodiversity Institute: Winthrop, WA, USA, 2007; p. 40. [Google Scholar]
  23. Müller, R.; Müller, D.; Schierhorn, F.; Gerold, G.; Pacheco, P. Proximate causes of deforestation in the Bolivian lowlands: An analysis of spatial dynamics. Reg. Environ. Change 2012, 12, 445–459. [Google Scholar] [CrossRef]
  24. dos Reis, M.; de Graça, P.M.L.A.; Yanai, A.M.; Ramos, C.J.P.; Fearnside, P.M. Forest fires and deforestation in the central Amazon: Effects of landscape and climate on spatial and temporal dynamics. J. Environ. Manag. 2021, 288, 112310. [Google Scholar] [CrossRef]
  25. Mertens, B.; Kaimowitz, D.; Puntodewo, A.; Vanclay, J.; Mendez, P. Modeling deforestation at distinct geographic scales and time periods in Santa Cruz, Bolivia. Int. Reg. Sci. Rev. 2004, 27, 271–296. [Google Scholar] [CrossRef]
  26. Nunes, A.N.; Lourenço, L.; Meira, A.C.C. Exploring spatial patterns and drivers of forest fires in Portugal (1980–2014). Sci. Total Environ. 2016, 573, 1190–1202. [Google Scholar] [CrossRef] [PubMed]
  27. Killeen, T.J.; Jardim, A.; Mamani, F.; Rojas, N. Diversity, composition and structure of a tropical semideciduous forest in the Chiquitania region of Santa Cruz, Bolivia. J. Trop. Ecol. 1998, 14, 803–827. [Google Scholar] [CrossRef] [Green Version]
  28. Nepstad, D.C.; Stickler, C.M.; Almeida, O.T. Globalization of the Amazon soy and beef industries: Opportunities for conservation. Conserv. Biol. 2006, 20, 1595–1603. [Google Scholar] [CrossRef] [PubMed]
  29. Biswas, S.; Vadrevu, K.P.; Lwin, Z.M.; Lasko, K.; Justice, C.O. Factors controlling vegetation fires in protected and non-protected areas of Myanmar. PLoS ONE 2015, 10, e0124346. [Google Scholar] [CrossRef]
  30. Price, O.F.; Pausas, J.G.; Govender, N.; Flannigan, M.; Fernandes, P.M.; Brooks, M.L.; Bird, R.B. Global patterns in fire leverage: The response of annual area burnt to previous fire. Int. J. Wildland Fire 2015, 24, 297–306. [Google Scholar] [CrossRef]
  31. Chen, L.; Wang, Y.; Ren, C.; Zhang, B.; Wang, Z. Optimal combination of predictors and algorithms for forest above-ground biomass mapping from Sentinel and SRTM data. Remote Sens. 2019, 11, 414. [Google Scholar] [CrossRef]
  32. Cochrane, M.A.; Alencar, A.; Schulze, M.D.; Souza, C.M.; Nepstad, D.C.; Lefebvre, P.; Davidson, E.A. Positive feedbacks in the fire dynamic of closed canopy tropical forests. Science (80-) 1999, 284, 1832–1835. [Google Scholar] [CrossRef]
  33. Cochrane, M.A.; Barber, C.P. Climate change, human land use and future fires in the Amazon. Glob. Change Biol. 2009, 15, 601–612. [Google Scholar] [CrossRef]
  34. Stein, T. How will climate change change El Niño and La Niña? NOAA Res. News 2020, c, 2020–2023. [Google Scholar]
  35. da Fonseca, G.A.B. The vanishing Brazilian Atlantic forest. Biol. Conserv. 1985, 34, 17–34. [Google Scholar] [CrossRef]
  36. Aragão, L.E.O.C.; Anderson, L.O.; Fonseca, M.G.; Rosan, T.M.; Vedovato, L.B.; Wagner, F.H.; Silva, C.V.J.; Silva Junior, C.H.L.; Arai, E.; Aguiar, A.P.; et al. 21st Century drought-related fires counteract the decline of Amazon deforestation carbon emissions. Nat. Commun. 2018, 9, 536. [Google Scholar] [CrossRef] [PubMed]
  37. Feng, X.; Porporato, A.; Rodriguez-Iturbe, I. Changes in rainfall seasonality in the tropics. Nat. Clim. Change 2013, 3, 811–815. [Google Scholar] [CrossRef]
  38. Olson, D.M.; Dinerstein, E. The Global 200: Priority ecoregions for global conservation. Ann. Missouri Bot. Gard. 2002, 89, 199–224. [Google Scholar] [CrossRef]
  39. Eva, H.; Huber, O.; Achard, F.; Balslev, H.; Beck, S.; Behling, H.; Belward, A.; Beuchle, R.; Cleef, A.; Colchester, M.; et al. A Proposal for Defining the Geographical Boundaries of Amazonia; European Commission: Luxembourg, 2005; ISBN 92-79-00012-8. [Google Scholar]
  40. Abatzoglou, J.T.; Dobrowski, S.Z.; Parks, S.A.; Hegewisch, K.C. TerraClimate, a high-resolution global dataset of monthly climate and climatic water balance from 1958–2015. Sci. Data 2018, 5, 170191. [Google Scholar] [CrossRef] [PubMed]
  41. Singh, M.; Zhu, X. Analysis of how the spatial and temporal patterns of fire and their bioclimatic and anthropogenic drivers vary across the Amazon rainforest in El Niño and non-El Niño years. PeerJ 2021, 9, e12029. [Google Scholar] [CrossRef]
  42. Guèze, M.; Paneque-Gálvez, J.; Luz, A.C.; Pino, J.; Orta-Martínez, M.; Reyes-García, V.; Macía, M.J. Determinants of tree species turnover in a southern Amazonian rain forest. J. Veg. Sci. 2013, 24, 284–295. [Google Scholar] [CrossRef]
  43. Killeen, T.J. Effect of grazing on native gramineae in Concepcion, Santa Cruz, Bolivia. Trop. Grasslands 1991, 25, 12–19. [Google Scholar]
  44. Maillard, O.; Vides-Almonacid, R.; Flores-Valencia, M.; Coronado, R.; Vogt, P.; Vicente-Serrano, S.M.; Azurduy, H.; Anívarro, R.; Cuellar, R.L. Relationship of forest cover fragmentation and drought with the occurrence of forest fires in the Department of Santa Cruz, Bolivia. Forests 2020, 11, 910. [Google Scholar] [CrossRef]
  45. Larrea-Alcázar, D.M.; Embert, D.; Aguirre, L.F.; Ríos-Uzeda, B.; Quintanilla, M.; Vargas, A. Spatial patterns of biological diversity in a neotropical lowland savanna of northeastern Bolivia. Biodivers. Conserv. 2011, 20, 1167–1182. [Google Scholar] [CrossRef]
  46. Harris, N.L.; Goldman, E.; Gabris, C.; Nordling, J.; Minnemeyer, S.; Ansari, S.; Lippmann, M.; Bennett, L.; Raad, M.; Hansen, M.; et al. Using spatial statistics to identify emerging hot spots of forest loss. Environ. Res. Lett. 2017, 12, 024012. [Google Scholar] [CrossRef]
  47. Multini, L.C.; de Souza, A.L.d.S.; Marrelli, M.T.; Wilke, A.B.B. The influence of anthropogenic habitat fragmentation on the genetic structure and diversity of the malaria vector Anopheles cruzii (Diptera: Culicidae). Sci. Rep. 2020, 10, 18018. [Google Scholar] [CrossRef] [PubMed]
  48. Maezumi, S.Y.; Elliott, S.; Robinson, M.; Betancourt, C.J.; de Souza, J.; Alves, D.; Grosvenor, M.; Hilbert, L.; Urrego, D.H.; Gosling, W.D.; et al. Legacies of Indigenous land use and cultural burning in the Bolivian Amazon rainforest ecotone. Philos. Trans. R. Soc. B 2022, 377, 20200499. [Google Scholar] [CrossRef] [PubMed]
  49. Gosling, W.D.; Maezumi, S.Y.; Heijink, B.M.; Nascimento, M.N.; Raczka, M.F.; van der Sande, M.T.; Bush, M.B.; McMichael, C.N.H. Scarce fire activity in north and north-western Amazonian forests during the last 10,000 years. Plant Ecol. Divers. 2021, 14, 143–156. [Google Scholar] [CrossRef]
  50. Pennington, R.T.; Lavin, M.; Oliveira-Filho, A. Woody plant diversity, evolution, and ecology in the tropics: Perspectives from seasonally dry tropical forests. Annu. Rev. Ecol. Evol. Syst. 2009, 40, 437–457. [Google Scholar] [CrossRef] [Green Version]
  51. Devisscher, T.; Anderson, L.O.; Aragão, L.E.O.C.; Galván, L.; Malhi, Y. Increased wildfire risk driven by climate and development interactions in the Bolivian Chiquitania, Southern Amazonia. PLoS ONE 2016, 11, e0161323. [Google Scholar] [CrossRef]
  52. Pennington, R.T.; Lavin, M.; Prado, D.E.; Pendry, C.A.; Pell, S.K.; Butterworth, C.A. Historical climate change and speciation: Neotropical seasonally dry forest plants show patterns of both Tertiary and Quaternary diversification. Philos. Trans. R. Soc. London Ser. B Biol. Sci. 2004, 359, 515–538. [Google Scholar] [CrossRef] [PubMed]
  53. Davies, D.K.; Ilavajhala, S.; Wong, M.M.; Justice, C.O. Fire information for resource management system: Archiving and distributing MODIS active fire data. IEEE Trans. Geosci. Remote Sens. 2009, 47, 72–79. [Google Scholar] [CrossRef]
  54. Hawbaker, T.J.; Radeloff, V.C.; Syphard, A.D.; Zhu, Z.; Stewart, S.I. Detection rates of the MODIS active fire product in the United States. Remote Sens. Environ. 2008, 112, 2656–2664. [Google Scholar] [CrossRef]
  55. Giglio, L.; Schroeder, W.; Hall, J.V.; Justice, C.O. Modis collection 6 active fire product user’s guide revision A. Dep. Geogr. Sci. Univ. Maryl. 2015, 9, 1–63. [Google Scholar]
  56. Giglio, L.; Descloitres, J.; Justice, C.O.; Kaufman, Y.J. An enhanced contextual fire detection algorithm for MODIS. Remote Sens. Environ. 2003, 87, 273–282. [Google Scholar] [CrossRef]
  57. Dwomoh, F.K.; Wimberly, M.C. Fire regimes and forest resilience: Alternative vegetation states in the West African tropics. Landsc. Ecol. 2017, 32, 1849–1865. [Google Scholar] [CrossRef]
  58. Chuvieco, E.; Giglio, L.; Justice, C. Global characterization of fire activity: Toward defining fire regimes from Earth observation data. Glob. Change Biol. 2008, 14, 1488–1502. [Google Scholar] [CrossRef]
  59. Aragão, L.E.O.C.; Malhi, Y.; Roman-Cuesta, R.M.; Saatchi, S.; Anderson, L.O.; Shimabukuro, Y.E. Spatial patterns and fire response of recent Amazonian droughts. Geophys. Res. Lett. 2007, 34, 1–5. [Google Scholar] [CrossRef]
  60. Fonseca, M.G.; Aragão, L.E.O.C.; Lima, A.; Shimabukuro, Y.E.; Arai, E.; Anderson, L.O. Modelling fire probability in the Brazilian Amazon using the maximum entropy method. Int. J. Wildland Fire 2016, 25, 955–969. [Google Scholar] [CrossRef]
  61. Funk, C.; Peterson, P.; Landsfeld, M.; Pedreros, D.; Verdin, J.; Shukla, S.; Husak, G.; Rowland, J.; Harrison, L.; Hoell, A.; et al. The climate hazards infrared precipitation with stations—A new environmental record for monitoring extremes. Sci. Data 2015, 2, 150066. [Google Scholar] [CrossRef] [Green Version]
  62. Zhang, T.; Tang, H. Evaluating the generalization ability of convolutional neural networks for built-up area extraction in different cities of China. Optoelectron. Lett. 2020, 16, 52–58. [Google Scholar] [CrossRef]
  63. Prestes, N.C.C.d.S.; Massi, K.G.; Silva, E.A.; Nogueira, D.S.; de Oliveira, E.A.; Freitag, R.; Marimon, B.S.; Marimon-Junior, B.H.; Keller, M.; Feldpausch, T.R. Fire effects on understory forest regeneration in southern Amazonia. Front. For. Glob. Change 2020, 3, 10. [Google Scholar] [CrossRef]
  64. Malhi, Y.; Aragão, L.E.O.C.; Galbraith, D.; Huntingford, C.; Fisher, R.; Zelazowski, P.; Sitch, S.; McSweeney, C.; Meir, P. Exploring the likelihood and mechanism of a climate-change-induced dieback of the Amazon rainforest. Proc. Natl. Acad. Sci. USA 2009, 106, 20610–20615. [Google Scholar] [CrossRef]
  65. Dwomoh, F.K.; Wimberly, M.C.; Cochrane, M.A.; Numata, I. Forest degradation promotes fire during drought in moist tropical forests of Ghana. For. Ecol. Manag. 2019, 440, 158–168. [Google Scholar] [CrossRef]
  66. De Faria, B.L.; Brando, P.M.; Macedo, M.N.; Panday, P.K.; Soares-Filho, B.S.; Coe, M.T. Current and future patterns of fire-induced forest degradation in Amazonia. Environ. Res. Lett. 2017, 12, 95005. [Google Scholar] [CrossRef]
  67. Staver, A.C.; Brando, P.M.; Barlow, J.; Morton, D.C.; Paine, C.E.T.; Malhi, Y.; Araujo Murakami, A.; del Aguila Pasquel, J. Thinner bark increases sensitivity of wetter Amazonian tropical forests to fire. Ecol. Lett. 2020, 23, 99–106. [Google Scholar] [CrossRef] [PubMed]
  68. Finer, M.; Ariñez, A. Fires in the Bolivian Amazon 2020: MAAP; Monutoring of the Andean Amazon Project: Washington, DC, USA, 2020. [Google Scholar]
  69. Tyukavina, A.; Baccini, A.; Hansen, M.C.; Potapov, P.V.; Stehman, S.V.; Houghton, R.A.; Krylov, A.M.; Turubanova, S.; Goetz, S.J. Aboveground carbon loss in natural and managed tropical forests from 2000 to 2012. Environ. Res. Lett. 2015, 10, 74002. [Google Scholar] [CrossRef]
  70. Armenteras, D.; Sebastian Barreto, J.; Tabor, K.; Molowny-Horas, R.; Retana, J. Changing patterns of fire occurrence in proximity to forest edges, roads and rivers between NW Amazonian countries. Biogeosciences 2017, 14, 2755–2765. [Google Scholar] [CrossRef]
  71. Pivello, V.R.; Vieira, I.; Christianini, A.V.; Ribeiro, D.B.; da Silva Menezes, L.; Berlinck, C.N.; Melo, F.P.L.; Marengo, J.A.; Tornquist, C.G.; Tomas, W.M.; et al. Understanding Brazil’s catastrophic fires: Causes, consequences and policy needed to prevent future tragedies. Perspect. Ecol. Conserv. 2021, 19, 233–255. [Google Scholar] [CrossRef]
  72. Kennedy, C.M.; Oakleaf, J.R.; Theobald, D.M.; Baruch-Mordo, S.; Kiesecker, J. Managing the middle: A shift in conservation priorities based on the global human modification gradient. Glob. Change Biol. 2019, 25, 811–826. [Google Scholar] [CrossRef]
  73. Theobald, D.M.; Kennedy, C.; Chen, B.; Oakleaf, J.; Baruch-Mordo, S.; Kiesecker, J. Earth transformed: Detailed mapping of global human modification from 1990 to 2017. Earth Syst. Sci. Data 2020, 12, 1953–1972. [Google Scholar] [CrossRef]
  74. Hijmans, R.J.; Cameron, S.E.; Parra, J.L.; Jones, P.G.; Jarvis, A. Very high resolution interpolated climate surfaces for global land areas. Int. J. Climatol. 2005, 25, 1965–1978. [Google Scholar] [CrossRef]
  75. Da Silva, R.G.; dos Santos, A.R.; Pelúzio, J.B.E.; Fiedler, N.C.; Juvanhol, R.S.; de Souza, K.B.; Branco, E.R.F. Vegetation trends in a protected area of the Brazilian Atlantic forest. Ecol. Eng. 2021, 162, 106180. [Google Scholar] [CrossRef]
  76. Rodrigues, M.; San-Miguel-Ayánz, J.; Oliveira, S.; Moreira, F.; Camia, A. An Insight into Spatial-Temporal Trends of Fire Ignitions and Burned Areas in the European Mediterranean Countries. J. Earth Sci. Eng. 2013, 3, 497–505. [Google Scholar]
  77. Ferreira Barbosa, M.L.; Delgado, R.C.; Forsad de Andrade, C.; Teodoro, P.E.; Silva Junior, C.A.; Wanderley, H.S.; Capristo-Silva, G.F. Recent trends in the fire dynamics in Brazilian Legal Amazon: Interaction between the ENSO phenomenon, climate and land use. Environ. Dev. 2021, 39, 100648. [Google Scholar] [CrossRef]
  78. De Oliveira-Júnior, J.F.; Teodoro, P.E.; da Silva Junior, C.A.; Baio, F.H.R.; Gava, R.; Capristo-Silva, G.F.; de Gois, G.; Correia Filho, W.L.F.; Lima, M.; Santiago, D. de B.; et al. Fire foci related to rainfall and biomes of the state of Mato Grosso do Sul, Brazil. Agric. For. Meteorol. 2020, 282–283, 107861. [Google Scholar] [CrossRef]
  79. Kendall, M.G. A New Measure of Rank Correlation. Biometrika 1938, 30, 81. [Google Scholar] [CrossRef]
  80. Brancalion, P.H.S.; Niamir, A.; Broadbent, E.; Crouzeilles, R.; Barros, F.S.M.; Almeyda Zambrano, A.M.; Baccini, A.; Aronson, J.; Goetz, S.; Reid, J.L.; et al. Global restoration opportunities in tropical rainforest landscapes. Sci. Adv. 2019, 5, eaav3223. [Google Scholar] [CrossRef] [PubMed]
  81. Chen, X.; Su, Z.; Ma, Y.; Trigo, I.; Gentine, P. Remote sensing of global daily evapotranspiration based on a surface energy balance method and reanalysis data. J. Geophys. Res. Atmos. 2021, 126, e2020JD032873. [Google Scholar] [CrossRef]
  82. Hansen, M.C.; Potapov, P.V.; Moore, R.; Hancher, M.; Turubanova, S.A.; Tyukavina, A.; Thau, D.; Stehman, S.V.; Goetz, S.J.; Loveland, T.R.; et al. High-resolution global maps of 21st-century forest cover change. Science (80-) 2013, 342, 850–853. [Google Scholar] [CrossRef] [PubMed]
  83. Jarvis, A.; Reuter, H.I.; Nelson, A.; Guevara, E. Hole-Filled Seamless SRTM Data V4, International Centre for Tropical Agriculture (CIAT). CGIARCSI SRTM. 2008. Available online: http://srtm.csi.cgiar.org (accessed on 15 July 2022).
  84. Ord, J.K.; Getis, A. Local spatial autocorrelation statistics: Distributional issues and an application. Geogr. Anal. 1995, 27, 286–306. [Google Scholar] [CrossRef]
  85. Getis, A.; Ord, J.K. The analysis of spatial association by use of distance statistics. In Perspectives on Spatial Data Analysis; Springer: Berlin/Heidelberg, Germany, 2010; pp. 127–145. [Google Scholar]
  86. Singh, M.; Yan, S. Spatial--temporal variations in deforestation hotspots in Sumatra and Kalimantan from 2001–2018. Ecol. Evol. 2021, 11, 7302–7314. [Google Scholar] [CrossRef]
  87. Patel, K.A.; Davis, S.D.; Johnson, R.; Esther, C.R., Jr. Disease Markers in the Exhaled Breath Condensate of Infants and Preschoolers. Am. Thorac. Soc. 2010, 27, A3288. [Google Scholar] [CrossRef]
  88. Gates, S. Emerging Hot Spot Analysis: Finding Patterns over Space and Time. Available online: https://www.azavea.com/blog/2017/08/15/emerging-hot-spot-spatial-statistics/ (accessed on 30 June 2022).
  89. Sanchez-Cuervo, A.M.; Aide, T.M. Identifying hotspots of deforestation and reforestation in Colombia (2001–2010): Implications for protected areas. Ecosphere 2013, 4, 143. [Google Scholar] [CrossRef]
  90. Dwomoh, F.K.; Wimberly, M.C. Fire regimes and their drivers in the Upper Guinean Region of West Africa. Remote Sens. 2017, 9, 1117. [Google Scholar] [CrossRef]
  91. Yadav, P. Decision Tree in Machine Learning. Available online: https://towardsdatascience.com/decision-tree-in-machine-learning-e380942a4c96 (accessed on 15 July 2022).
  92. Tehrany, M.S.; Jones, S.; Shabani, F.; Martínez-Álvarez, F.; Tien Bui, D. A novel ensemble modeling approach for the spatial prediction of tropical forest fire susceptibility using LogitBoost machine learning classifier and multi-source geospatial data. Theor. Appl. Climatol. 2019, 137, 637–653. [Google Scholar] [CrossRef]
  93. Friedman, J.H. Greedy function approximation: A gradient boosting machine. Ann. Stat. 2001, 29, 1189–1232. [Google Scholar] [CrossRef]
  94. Elith, J.; Leathwick, J.R.; Hastie, T. A working guide to boosted regression trees. J. Anim. Ecol. 2008, 77, 802–813. [Google Scholar] [CrossRef] [PubMed]
  95. Piao, S.; Huang, M.; Liu, Z.; Wang, X.; Ciais, P.; Canadell, J.G.; Wang, K.; Bastos, A.; Friedlingstein, P.; Houghton, R.A.; et al. Lower land-use emissions responsible for increased net land carbon sink during the slow warming period. Nat. Geosci. 2018, 11, 739–743. [Google Scholar] [CrossRef]
  96. Grömping, U. Relative importance for linear regression in R: The package relaimpo. J. Stat. Softw. 2007, 17, 1–27. [Google Scholar]
  97. Maclin, R.; Opitz, D. An empirical evaluation of bagging and boosting. AAAI/IAAI 1997, 1997, 546–551. [Google Scholar]
  98. Shabani, S.; Jaafari, A.; Bettinger, P. Spatial modeling of forest stand susceptibility to logging operations. Environ. Impact Assess. Rev. 2021, 89, 106601. [Google Scholar] [CrossRef]
  99. Leathwick, J.R.; Elith, J.; Hastie, T. Comparative performance of generalized additive models and multivariate adaptive regression splines for statistical modelling of species distributions. Ecol. Modell. 2006, 199, 188–196. [Google Scholar] [CrossRef]
  100. Schapire, R.E. The boosting approach to machine learning: An overview. Nonlinear Estim. Classif. 2003, 171, 149–171. [Google Scholar] [CrossRef]
  101. Abeare, S. Comparisons of Boosted Regression Tree, GLM and GAM Performance in the Standardization of Yellowfin Tuna Catch-Rate Data from the Gulf of Mexico Lonline [sic] Fishery. Master’s Theses, LSU, Baton Rouge, LA, USA, 2009. [Google Scholar]
  102. Dannouf, R.; Yong, B.; Ndehedehe, C.E.; Correa, F.M.; Ferreira, V. Boosted Regression Tree Algorithm for the Reconstruction of GRACE-Based Terrestrial Water Storage Anomalies in the Yangtze River Basin. Front. Environ. Sci. 2022, 10, 953. [Google Scholar] [CrossRef]
  103. Wagner, F.H.; Sanchez, A.; Tarabalka, Y.; Lotte, R.G.; Ferreira, M.P.; Aidar, M.P.M.; Gloor, E.; Phillips, O.L.; Aragão, L.E.O.C. Using the U-net convolutional network to map forest types and disturbance in the Atlantic rainforest with very high resolution images. Remote Sens. Ecol. Conserv. 2019, 5, 360–375. [Google Scholar] [CrossRef]
  104. Singh, M.; Friess, D.A.; Vilela, B.; De Alban, J.D.T.; Monzon, A.K.V.; Veridiano, R.K.A.; Tumaneng, R.D. Spatial relationships between above-ground biomass and bird species biodiversity in Palawan, Philippines. PLoS ONE 2017, 12, e0186742. [Google Scholar] [CrossRef] [PubMed]
  105. Cizungu, N.C.; Tshibasu, E.; Lutete, E.; Mushagalusa, C.A.; Mugumaarhahama, Y.; Ganza, D.; Karume, K.; Michel, B.; Lumbuenamo, R.; Bogaert, J. Fire risk assessment, spatiotemporal clustering and hotspot analysis in the Luki biosphere reserve region, western DR Congo. Trees For. People 2021, 5, 100104. [Google Scholar] [CrossRef]
  106. Frappier-Brinton, T.; Lehman, S.M. The burning island: Spatiotemporal patterns of fire occurrence in Madagascar. PLoS ONE 2022, 17, e0263313. [Google Scholar] [CrossRef] [PubMed]
  107. Monmany, A.C.; Gould, W.A.; Andrade-Núñez, M.J.; González, G.; Quiñones, M. Characterizing predictability of fire occurrence in tropical forests and grasslands: The case of Puerto Rico. For. Ecol. Conserv. 2017, 19, 77–95. [Google Scholar] [CrossRef]
  108. Bargali, H.; Calderon, L.P.P.; Sundriyal, R.C.; Bhatt, D. Impact of forest fire frequency on floristic diversity in the forests of Uttarakhand, western Himalaya. Trees For. People 2022, 9, 100300. [Google Scholar] [CrossRef]
  109. Heyer, J.P.; Power, M.J.; Field, R.D.; van Marle, M.J.E. The impacts of recent drought on fire, forest loss, and regional smoke emissions in lowland Bolivia. Biogeosciences 2018, 15, 4317–4331. [Google Scholar] [CrossRef]
  110. Devisscher, T.; Malhi, Y.; Boyd, E. Deliberation for wildfire risk management: Addressing conflicting views in the Chiquitania, Bolivia. Geogr. J. 2019, 185, 38–54. [Google Scholar] [CrossRef]
  111. Mayle, F.E.; Langstroth, R.P.; Fisher, R.A.; Meir, P. Long-term forest-savannah dynamics in the Bolivian Amazon: Implications for conservation. Philos. Trans. R. Soc. B Biol. Sci. 2007, 362, 291–307. [Google Scholar] [CrossRef]
  112. Sanabria, A.G. Examining the Potential of Using Remotely Sensed Fires and Socio-Economic Variables to Detect Coca Cultivation in Forest Areas in Colombia. Open Geogr. J. 2014, 6, 18–29. [Google Scholar]
  113. Gray, E.; Veit, P.; Altamirano, J.C.; Ding, H.; Rozwalka, P.; Zuniga, I.; Witkin, M.; Borger, F.G.; Pereda, P.; Lucchesi, A.; et al. The Economic Costs and Benefits of Securing Community Forest Tenure: Evidence from Brazil and Guatemala; World Resources Institute: Washington, DC, USA, 2015; Volume 40. [Google Scholar] [CrossRef]
  114. Soro, T.D.; Koné, M.; N’Dri, A.B.; N’Datchoh, E.T. Identified main fire hotspots and seasons in Cote d’lvoire (West Africa) using MODIS fire data. S. Afr. J. Sci. 2021, 117, 1–13. [Google Scholar] [CrossRef]
  115. Beringer, J.; Hutley, L.B.; Abramson, D.; Arndt, S.K.; Briggs, P.; Bristow, M.; Canadell, J.G.; Cernusak, L.A.; Eamus, D.; Edwards, A.C.; et al. Fire in Australian savannas: From leaf to landscape. Glob. Change Biol. 2015, 21, 62–81. [Google Scholar] [CrossRef] [PubMed]
  116. Guedes, B.J.; Massi, K.G.; Evers, C.; Nielsen-Pincus, M. Vulnerability of small forest patches to fire in the Paraiba do Sul River Valley, southeast Brazil: Implications for restoration of the Atlantic Forest biome. For. Ecol. Manag. 2020, 465, 118095. [Google Scholar] [CrossRef]
  117. Argañaraz, J.P.; Gavier Pizarro, G.; Zak, M.; Landi, M.A.; Bellis, L.M. Human and biophysical drivers of fires in Semiarid Chaco mountains of Central Argentina. Sci. Total Environ. 2015, 520, 1–12. [Google Scholar] [CrossRef]
  118. Malhi, Y.; Gardner, T.A.; Goldsmith, G.R.; Silman, M.R.; Zelazowski, P. Tropical forests in the anthropocene. Annu. Rev. Environ. Resour. 2014, 39, 125–159. [Google Scholar] [CrossRef]
  119. Silvestrini, R.A.; Soares-Filho, B.S.; Nepstad, D.; Coe, M.; Rodrigues, H.; Assunção, R. Simulating fire regimes in the Amazon in response to climate change and deforestation. Ecol. Appl. 2011, 21, 1573–1590. [Google Scholar] [CrossRef]
  120. Porter-Bolland, L.; Ellis, E.A.; Guariguata, M.R.; Ruiz-Mallén, I.; Negrete-Yankelevich, S.; Reyes-García, V. Community managed forests and forest protected areas: An assessment of their conservation effectiveness across the tropics. For. Ecol. Manag. 2012, 268, 6–17. [Google Scholar] [CrossRef]
  121. Liu, Z.; Wimberly, M.C. Climatic and Landscape Influences on Fire Regimes from 1984 to 2010 in the Western United States. PLoS ONE 2015, 10, e0140839. [Google Scholar] [CrossRef] [Green Version]
  122. Syphard, A.D.; Radeloff, V.C.; Keeley, J.E.; Hawbaker, T.J.; Clayton, M.K.; Stewart, S.I.; Hammer, R.B. Human influence on California fire regimes. Ecol. Appl. 2007, 17, 1388–1402. [Google Scholar] [CrossRef]
  123. Bistinas, I.; Oom, D.; Sá, A.C.L.; Harrison, S.P.; Prentice, I.C.; Pereira, J.M.C. Relationships between human population density and burned area at continental and global scales. PLoS ONE 2013, 8, e81188. [Google Scholar] [CrossRef]
  124. Di Bella, C.M.; Jobbágy, E.G.; Paruelo, J.M.; Pinnock, S. Continental fire density patterns in South America. Glob. Ecol. Biogeogr. 2006, 15, 192–199. [Google Scholar] [CrossRef]
  125. Armenteras-Pascual, D.; Retana-Alumbreros, J.; Molowny-Horas, R.; Roman-Cuesta, R.M.; Gonzalez-Alonso, F.; Morales-Rivas, M. Characterising fire spatial pattern interactions with climate and vegetation in Colombia. Agric. For. Meteorol. 2011, 151, 279–289. [Google Scholar] [CrossRef]
  126. Esmaeili Sharif, M.; Amoozad, M.; Shirani, K.; Gorgandipour, M. The Effect of Forest Road Distance on Forest Fire Severity (Case Study: Fires in the Neka County Forestry). ECOPERSIA 2016, 4, 1331–1342. [Google Scholar] [CrossRef]
  127. Andela, N.; Morton, D.C.; Giglio, L.; Chen, Y.; van der Werf, G.R.; Kasibhatla, P.S.; DeFries, R.S.; Collatz, G.J.; Hantson, S.; Kloster, S.; et al. A human-driven decline in global burned area. Science (80-) 2017, 356, 1356–1362. [Google Scholar] [CrossRef] [PubMed]
  128. Da Silva, S.S.; Fearnside, P.M.; Graça, P.M.L. de A.; Brown, I.F.; Alencar, A.; Melo, A.W.F. de Dynamics of forest fires in the southwestern Amazon. For. Ecol. Manage. 2018, 424, 312–322. [Google Scholar] [CrossRef]
  129. Hansen, M.C.; Wang, L.; Song, X.P.; Tyukavina, A.; Turubanova, S.; Potapov, P.V.; Stehman, S.V. The fate of tropical forest fragments. Sci. Adv. 2020, 6, eaax8574. [Google Scholar] [CrossRef]
  130. Singh, M.; Huang, Z. Analysis of Forest Fire Dynamics Its Distribution and Main Drivers in the Atlantic Forest. Sustainability 2022, 14, 992. [Google Scholar] [CrossRef]
  131. Li, P.; Xiao, C.; Feng, Z.; Li, W.; Zhang, X. Occurrence frequencies and regional variations in Visible Infrared Imaging Radiometer Suite (VIIRS) global active fires. Glob. Change Biol. 2020, 26, 2970–2987. [Google Scholar] [CrossRef]
  132. Gandhi, S.R.; Singh, T.P. Automatization of Forest Fire Detection Using Geospatial Technique. Open J. For. 2014, 2014, 47737. [Google Scholar] [CrossRef]
  133. Silva, P.S.; Nogueira, J.; Rodrigues, J.A.; Santos, F.L.M.; Pereira, J.M.C.; DaCamara, C.C.; Daldegan, G.A.; Pereira, A.A.; Peres, L.F.; Schmidt, I.B.; et al. Putting fire on the map of Brazilian savanna ecoregions. J. Environ. Manag. 2021, 296, 113098. [Google Scholar] [CrossRef]
  134. Wan, C.; Roy, S. Sen Geospatial characteristics of fire occurrences in southern hemispheric Africa and Madagascar during 2001–2020. J. For. Res. 2022, 1–11. [Google Scholar] [CrossRef]
  135. Devisscher, T.; Malhi, Y.; Landívar, V.D.R.; Oliveras, I. Understanding ecological transitions under recurrent wildfire: A case study in the seasonally dry tropical forests of the Chiquitania, Bolivia. For. Ecol. Manage. 2016, 360, 273–286. [Google Scholar] [CrossRef]
  136. Veldman, J.W.; Putz, F.E. Grass-dominated vegetation, not species-diverse natural savanna, replaces degraded tropical forests on the southern edge of the Amazon Basin. Biol. Conserv. 2011, 144, 1419–1429. [Google Scholar] [CrossRef]
  137. Ma, C.; Pu, R.; Downs, J.; Jin, H. Characterizing Spatial Patterns of Amazon Rainforest Wildfires and Driving Factors by Using Remote Sensing and GIS Geospatial Technologies. Geosciences 2022, 12, 237. [Google Scholar] [CrossRef]
Figure 1. The study area showing the location and extent of the three ecoregions defined by the WWF.
Land 11 01436 g001
Figure 2. The summative active fire occurrence density (AFOD) (upper panel) and the fire season length (FSL) (lower panel) within the study area of the Amazonian Basin region of Bolivia between 2001 and 2020. The units were taken from [105].
Land 11 01436 g002
Figure 3. The number of fires per year identified over the period evaluated (2001–2020). Bar graph of annual number of fires. Fires increase after 2001 peaking in 2010 and then fall rapidly until recovering to between 30,000 and 40,000 in 2019 and 2020. Fire frequency/number of fire occurrences have been previously reported in research [106,107,108].
Land 11 01436 g003
Figure 4. Emerging hotspots (upper panel) and Mann–Kendall trend assessments (lower panel).
Land 11 01436 g004aLand 11 01436 g004b
Figure 5. The relative influence (%) estimated by Boosted Regression Tree models of different variables on Active Fire Density (AFD) for each ecoregion modelled (Precip = annual precipitation; maximum cumulative water deficit (MCWD).
Land 11 01436 g005
Figure 6. The relative influence (%) estimated by Boosted Regression Tree models of different variables on Fire Season Length (FSL) for each ecoregion modelled (abbreviations as per Figure 5).
Land 11 01436 g006
Publisher’s Note: MDPI stays neutral with regard to jurisdictional claims in published maps and institutional affiliations.

