Article

The Influence of Urbanization to the Outer Boundary Ecological Environment Using Remote Sensing and GIS Techniques—A Case of the Greater Bay Area

1
School of Remote Sensing and Information Engineering, Wuhan University, Wuhan 430079, China
2
State Key Laboratory of Resources and Environmental Information System, Institute of Geographic Sciences and Natural Resources Research, Chinese Academy of Sciences, Beijing 100101, China
3
University of Chinese Academy of Sciences, Beijing 100049, China
*
Author to whom correspondence should be addressed.
These authors contributed equally to this work.
Land 2022, 11(9), 1426; https://doi.org/10.3390/land11091426
Submission received: 28 July 2022 / Revised: 9 August 2022 / Accepted: 26 August 2022 / Published: 29 August 2022

Abstract

:
Urbanization brings great enrichment to human production and life, but also has certain environmental impact on the area where the city is located. Many studies have revealed the negative effects of urbanization on the ecological environment of urban or urban agglomerations, especially in the early stage of urbanization, but there are few studies on the impact on the peripheral ecological space environment. Will the peripheral environment be better off with less human interference as people move to cities during urbanization? In order to answer this question, we took the Guangdong-Hong Kong-Macao Greater Bay Area, the most economically dynamic area in China, as an example to explore the relationship between impervious changes of urban agglomerations monitored by remote sensing in the Bay Area and ecological indicators of forest and grassland in Guangdong Province outside the Bay area. The results showed that:(1) in the past 30 years, the area of grassland outside the bay area did not change regularly, while the area of forest decreased year by year. The landscape indices of forest and grassland were gradually fragmented and discrete. Moreover, the distribution of Fraction Vegetation Coverage (FVC) of forest and grassland has changed since before urbanization. (2) Through correlation analysis, it is found that the changes in forest area and the landscape index of forest and grassland are strongly correlated with the development of urbanization in the Greater Bay Area. This shows that the process of urbanization in the Greater Bay Area will have a non-negligible impact on the peripheral environment. In the process of urban development, we should not only focus on the inner city but also consider the outer environment of the city.

1. Introduction

Urbanization is a process of social and economic change, including the deagriculturalization of the agricultural population, the continuous expansion of the urban population, the continuous expansion of urban land to the suburbs [1,2,3], the continuous increase in the number of cities, and the process of urban social, economic and technological change into the countryside. This process is also considered to be a process in which the average living standard of human beings improves and the economic level grows. This improvement usually means an increase in resource consumption [4,5,6], especially in the early stages of urbanization, and has a profound impact on the environment [7] and causes many environmental problems [8,9,10,11,12]. As an important part of the global ecosystem, vegetation plays an irreplaceable role in ecological protection, maintaining ecological stability and improving the social environment [13,14,15,16], which has become a major approach to studying the urbanization environment.
It is common to analyze the impacts of urbanization on vegetation ecosystems and to analyze vegetation encroachment by urban expansion through land use data. Many scholars have researched this issue: Zhou and Zhang [17] studied six metropolitan areas in China and pointed out that urban expansion is the main driving force of urban forest loss, and most of the newly developed land in cities is converted from forests. It is pointed out that the changes in the ecological environment with the process of urbanization are not linear, and most of them show a situation of “deterioration first and then improvement” [18]. Jeon and Olofsson [19] examine trends in forest change in England and suggest that we may be in the second phase of forest loss: the driving force of forest loss from agricultural expansion to urban growth. Zhou and Huang [20] studied forest cover in the Gwynn Falls Watershed in Baltimore, Maryland, USA, where highly variable locations of forest cover shifted from urban belts to suburban belts over time, coinciding with the spatial shift of urbanization. Gong and Chen [21] specifically studied Shenzhen, a typical area of urbanization, and found that urbanization did cause a sharp reduction of forest cover in the early stage, but after 2000, the level of forest cover increased significantly. This is primarily due to the resilience and regenerative capacity of natural vegetation in wilderness areas. More importantly, the recovery has been brought about by shifts in public policy and social needs. In recent years, as urban pollution has intensified, urban residents living in China’s developed cities, such as Shenzhen have increased their environmental awareness and preferred the ecological functions and services of forests over their products.
In addition to encroachment on vegetation ecosystems, the effects of suburban vegetation ecosystems within administrative boundaries during urbanization have also gained some attention. Nielsen and Hedblom [22] used the example of all cities in Sweden and Denmark with populations of more than 10,000 people to study the relationship between cities and forest cover. They found that forest cover was lowest within the city and higher on the edge of the city. Su and Xiao [23], taking Hangzhou as the scope, studied the impact of Hangzhou’s urbanization on the suburbs of Hangzhou and point out that the urbanization process will bring a great impact on the ecosystem service value of the suburbs, making the landscape inside the administrative region become fragmented and scattered. Cao and Liu [24] took Xishuangbanna as the study area and found that due to the rapid process of urbanization, the land use types outside the urban area changed significantly and the landscape pattern became more fragmented.
However, there are few studies on the impact of the vegetation ecological environment in adjacent ecological areas outside urban agglomerations. Urban agglomerations have different definitions in different countries and regions [25]. For China, it refers to an urban group with more than one mega-city as the core and more than three large cities as the constituent units, forming a compact spatial organization, close economic ties, and finally achieving a high degree of urban integration. It is the highest spatial organization form in the mature stage of urbanization. On the one hand, with the process of urbanization, a large amount of resources will be consumed, forcing people to ask for more resources from nature. When the technology is not fully developed, the disturbance to the natural ecosystem will be enhanced. On the other hand, with the process of urbanization, the population flows from the vast rural areas to the urban areas, especially the young people with a strong labor force. Migration of the population greatly reduces the disturbance of these areas to the natural vegetation areas. Who has the greater power? No studies have yet answered this question.
From a technical point of view, remote sensing and GIS are widely used to detect and analyze the relationship between cities and the ecological environment. Nowadays, remote sensing and GIS technology have become powerful tools for analyzing cities [26,27,28,29,30] and studying ecological environments [20,31,32,33]. Multi-spectral and multi-temporal images obtained by remote sensing technology can provide a lot of information for understanding urban land use and ground object recognition [34]. These images were studied by spectral classification [35,36], spectral reflection model [37,38], spectral index [39] and other technologies to obtain ground feature coverage and its change over time. Moreover, among the remote sensing image data from various sources, Landsat-MSS /TM/ETM and Landsat8 have high spectral and optical resolution and long on-orbit operation times. This advantage provides the possibility to study the land surface changes in the past 30 years. However, when analyzing the relationship between urbanization and vegetation, the existing remote sensing and GIS studies focus on land use types and their changes but ignore the quality of vegetation ecosystems. For example, some researchers [20,21,24] focused on the change of the area covered by vegetation; While some other researchers [12,17,19,40] focuses on landscape pattern changes in vegetation covered areas, but the factors of vegetation richness changes in vegetation covered areas are rarely considered.
In view of the above problems, this paper aims to deepen the understanding of the relationship between urbanization and the ecological environment. Both the area covered by vegetation and the quality of vegetation ecology is taken into account. This paper takes the Greater Bay Area of China as an example to calculate the changes in vegetation cover area, landscape index and Fraction Vegetation Coverage (FVC) in the peripheral Guangdong Province during the urbanization process from 1990 to 2020. By exploring the relationship between urban development and vegetation cover in the peripheral areas, this paper aims to deepen the understanding of the relationship between urbanization and the ecological environment.

2. Materials and Methods
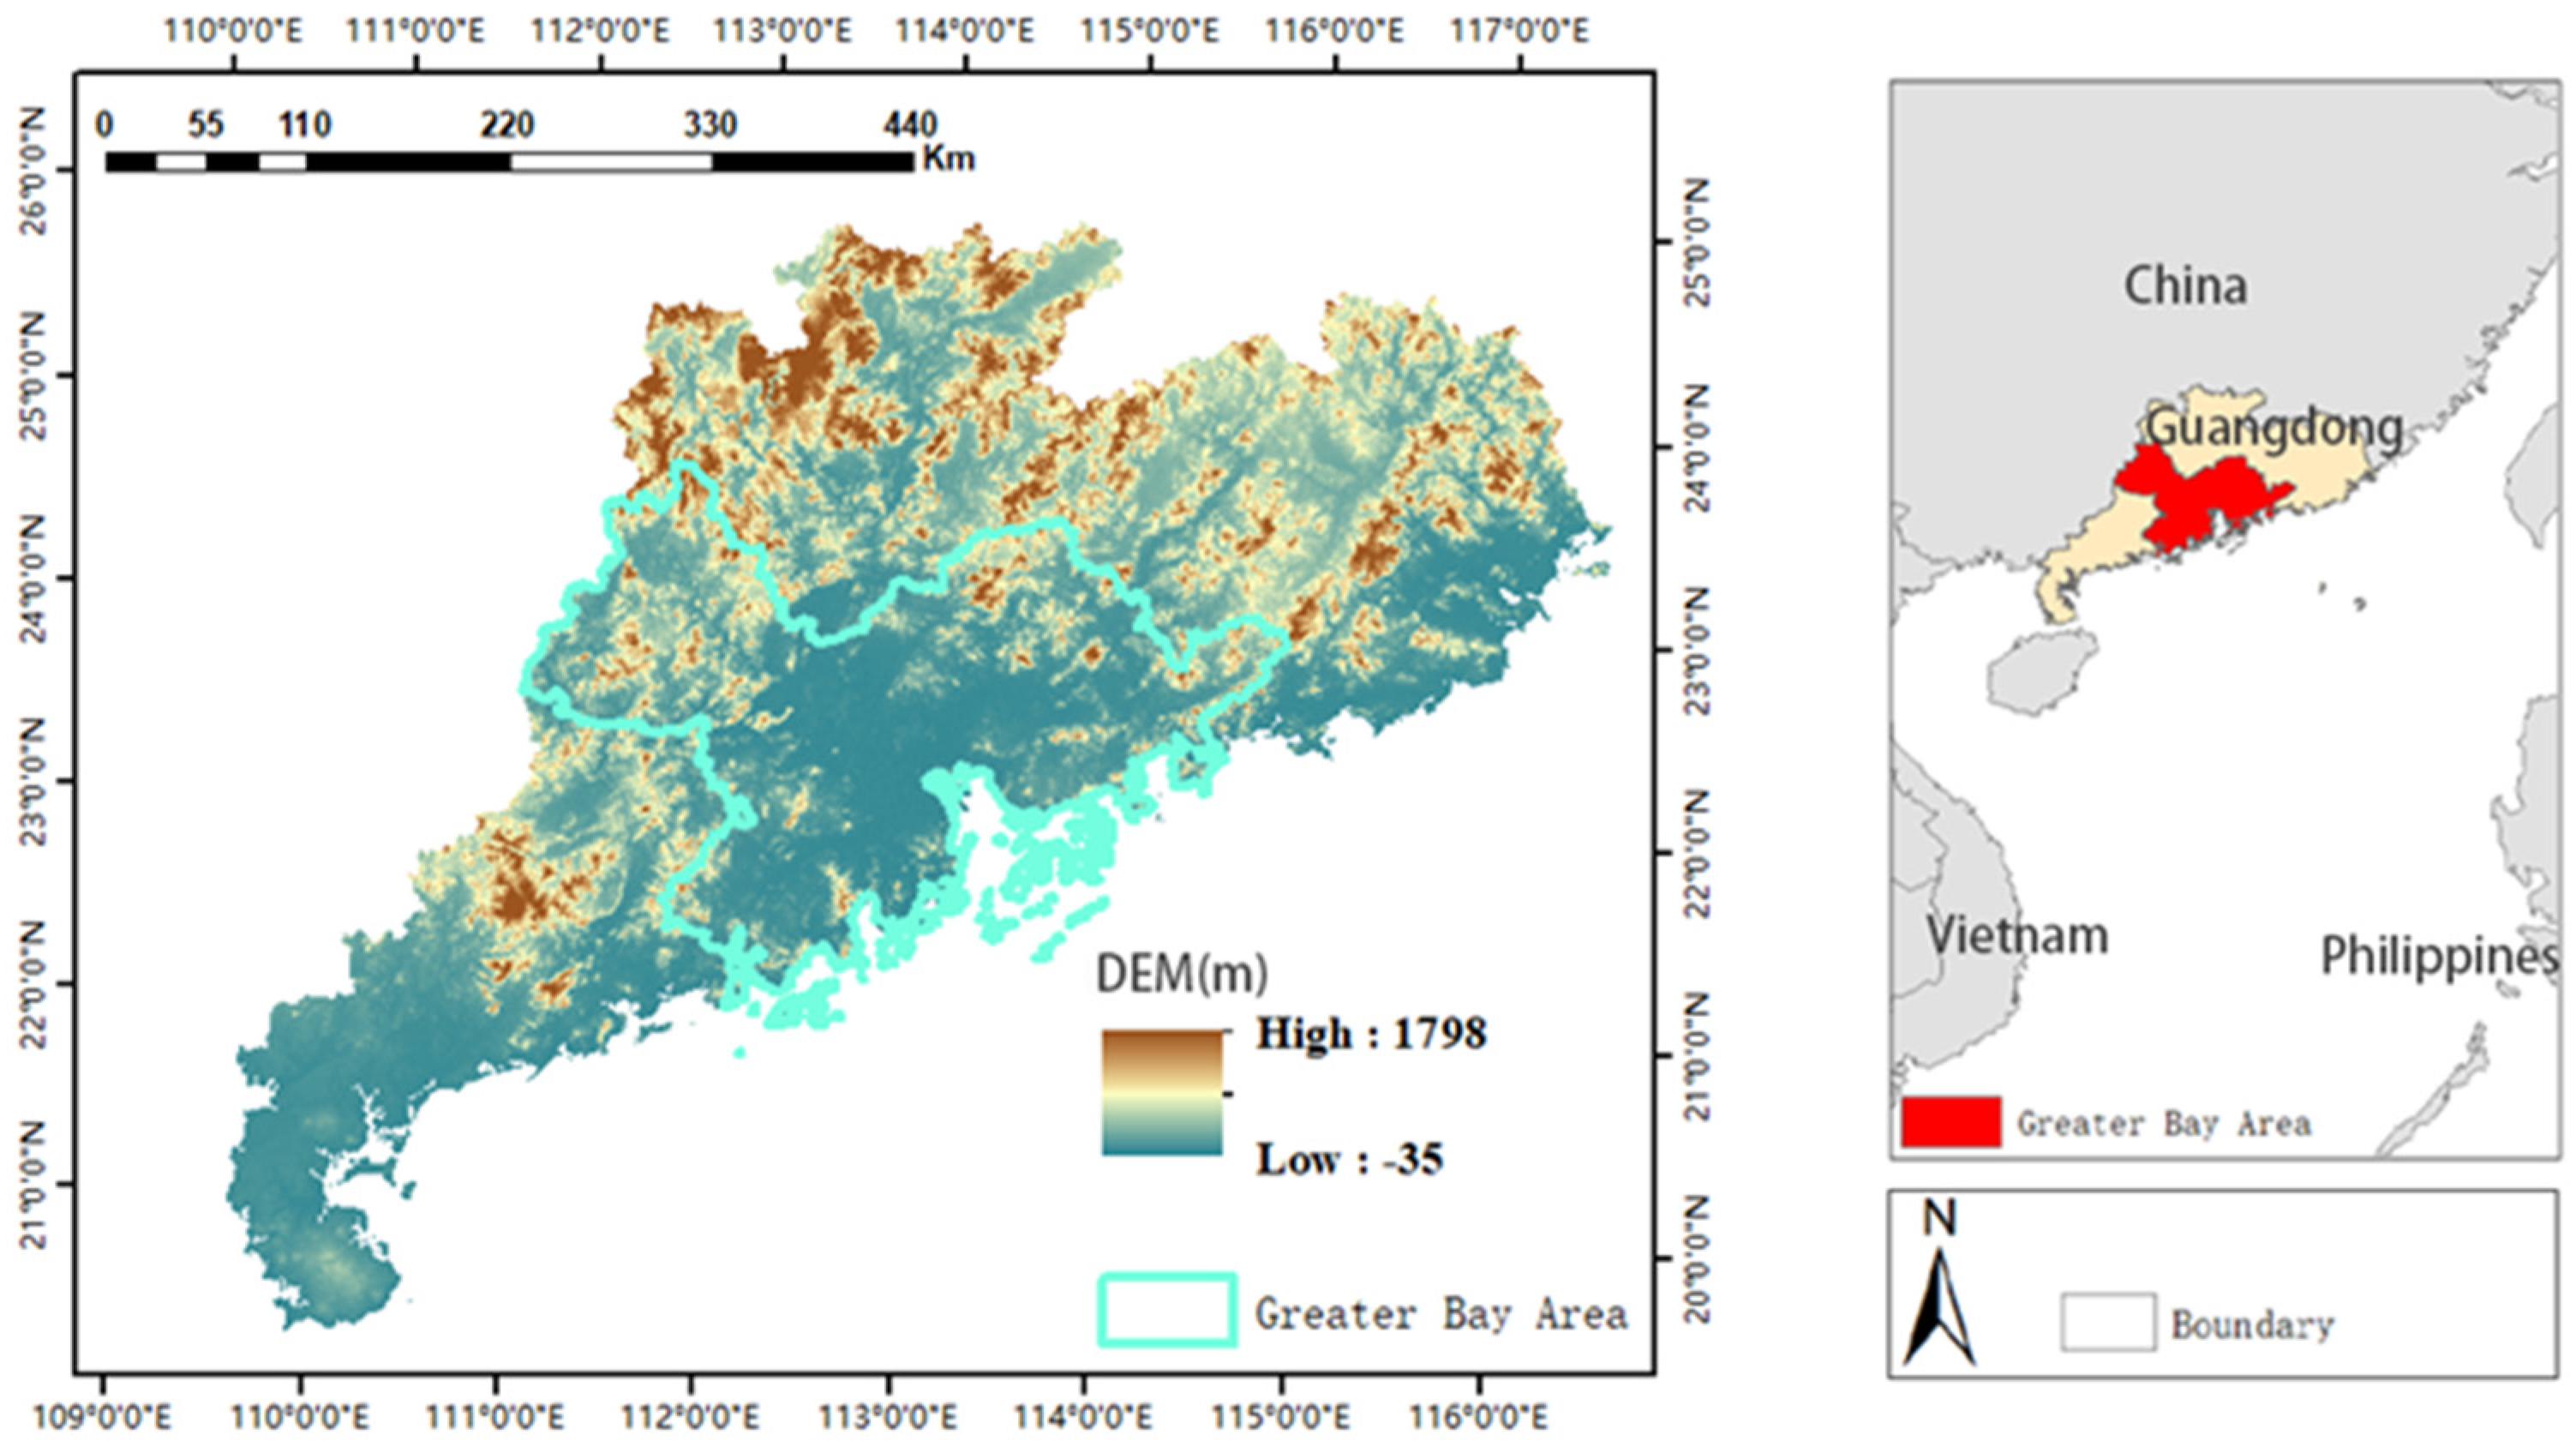
2.1. Study Area

As shown in Figure 1, Guangdong Province is located in the southernmost part of the Chinese mainland. It is bordered by Fujian to the east, Jiangxi and Hunan to the north, Guangxi to the west, and the South China Sea to the south. The pearl river estuary is bordered by the Hong Kong and Macao Special Administrative Regions on the east and west sides, Guangdong Province is bordered by the Hong Kong and Macao Special Administrative Regions on the east and west sides, and Hainan Province in the southwest. The whole territory is located between latitude 20° 09′~25° 31′north and longitude 109° 45′~117° 20′ east. The total land area of the province is 178,000 square kilometers.
The landforms of Guangdong Province are complex and diverse, including mountains, hills, terraces and plains, and their areas account for 33.7%, 24.9%, 14.2% and 21.7% of the total land area of the province, respectively. The terrain is generally high in the north and low in the south, mostly mountainous and high hills in the north, and plains and terraces in the south.
Guangdong Province belongs to the East Asian monsoon region, with a tropical South Asian and Central Subtropical climate from south to north. Soil types and native vegetation in Guangdong Province are distributed in bands with latitude, from north to south, transitioning from red soil to brick red soil. The typical vegetation in the northern Nanling area is subtropical mountain evergreen broad-leaved forest, the central part is subtropical evergreen monsoon rain forest, and the southern part is tropical evergreen monsoon rain forest, mainly coniferous forest, middle and young forest. The main crops in Guangdong are rice, sugarcane, peanuts, fruits, tea, vegetables, silkworm mulberry and so on.
Since the reform and opening up, China has attached great importance to the development of Guangdong’s coastal areas. In 1994, the Guangdong Provincial Party Committee proposed the construction of the Pearl River Delta Economic Zone. It includes nine cities including Guangzhou, Shenzhen, Foshan, Dongguan, Zhongshan, Zhuhai, Jiangmen, Zhaoqing and Huizhou. On 28 October 2009, the governments of Guangdong, Hong Kong and Macao proposed to jointly build a world-class urban agglomeration. Cities in the Pearl River Delta have strengthened cooperation with Hong Kong and Macao to form the Guangdong–Hong Kong–Macao Greater Bay Area.
The geographical conditions in the Greater Bay Area are superior. It is surrounded by Luohu Mountain, Yunwu Mountain, Luofu Mountain, and Lotus Mountain, and has the West River, North River and East River flowing through it. It can be described as “surrounded by mountains on three sides, three rivers converge” [41], with a long coastline, a good port group, and a vast sea area. The economic hinterland is vast, and it is the closest economically developed area to the South China Sea, and the bridgehead for China to pass through the South China Sea. It is close to the world’s first golden waterway, is the key to shipping in the Pacific and Indian Oceans, is an important transportation hub in Southeast Asia and even the world, and is the intersection of the Silk Road Economic Belt and the 21st Century Maritime Silk Road and is the closest economically developed area to the sea exchanges between China and countries along the Silk Road.
However, there is a huge imbalance in regional development in Guangdong Province. The strong economic development of the Greater Bay Area has not driven the common development of the mountainous areas of northern Guangdong and the eastern and western wings. According to the 2020 Guangdong Yearbook released by the Guangdong Provincial Bureau of Statistics, the development of the entire regional economy in Guangdong Province showed polarization. Guangdong’s GDP reached 9.73 trillion yuan in 2018, while the Pearl River Delta 8.1 trillion yuan contributed 80.2% of the province’s GDP. In contrast, Guangdong accounts for 70% of the province’s land and 45% of the population, but its GDP accounts for only about 20% of the province. The Greater Bay Area is a key area for China’s economic development. By the end of 2020, the total population of the Greater Bay Area was about 70 million. It is one of the regions with the highest degree of openness and the strongest economic vitality in China and has an important strategic position in the overall situation of national development. The GDP of the Bay Area exceeds 11 trillion yuan, accounting for about 1/7 of the country’s GDP.
In the process of urbanization in the Greater Bay Area, people and resources have poured into the Greater Bay Area from Guangdong Province and even all parts of the country. This will definitely affect not only the Greater Bay Area but also the environmental ecology of the entire Guangdong Province. The purpose of this paper is to further explore the impact of rapid urbanization on the environment of the outer areas of the city. This paper takes the Greater Bay Area and Guangdong Province as examples based on previous research. It helps to understand the coupling relationship between rapid urbanization and the people and places in the external region and has a guiding role in the formulation of urbanization and environmental policies.

2.2. Data

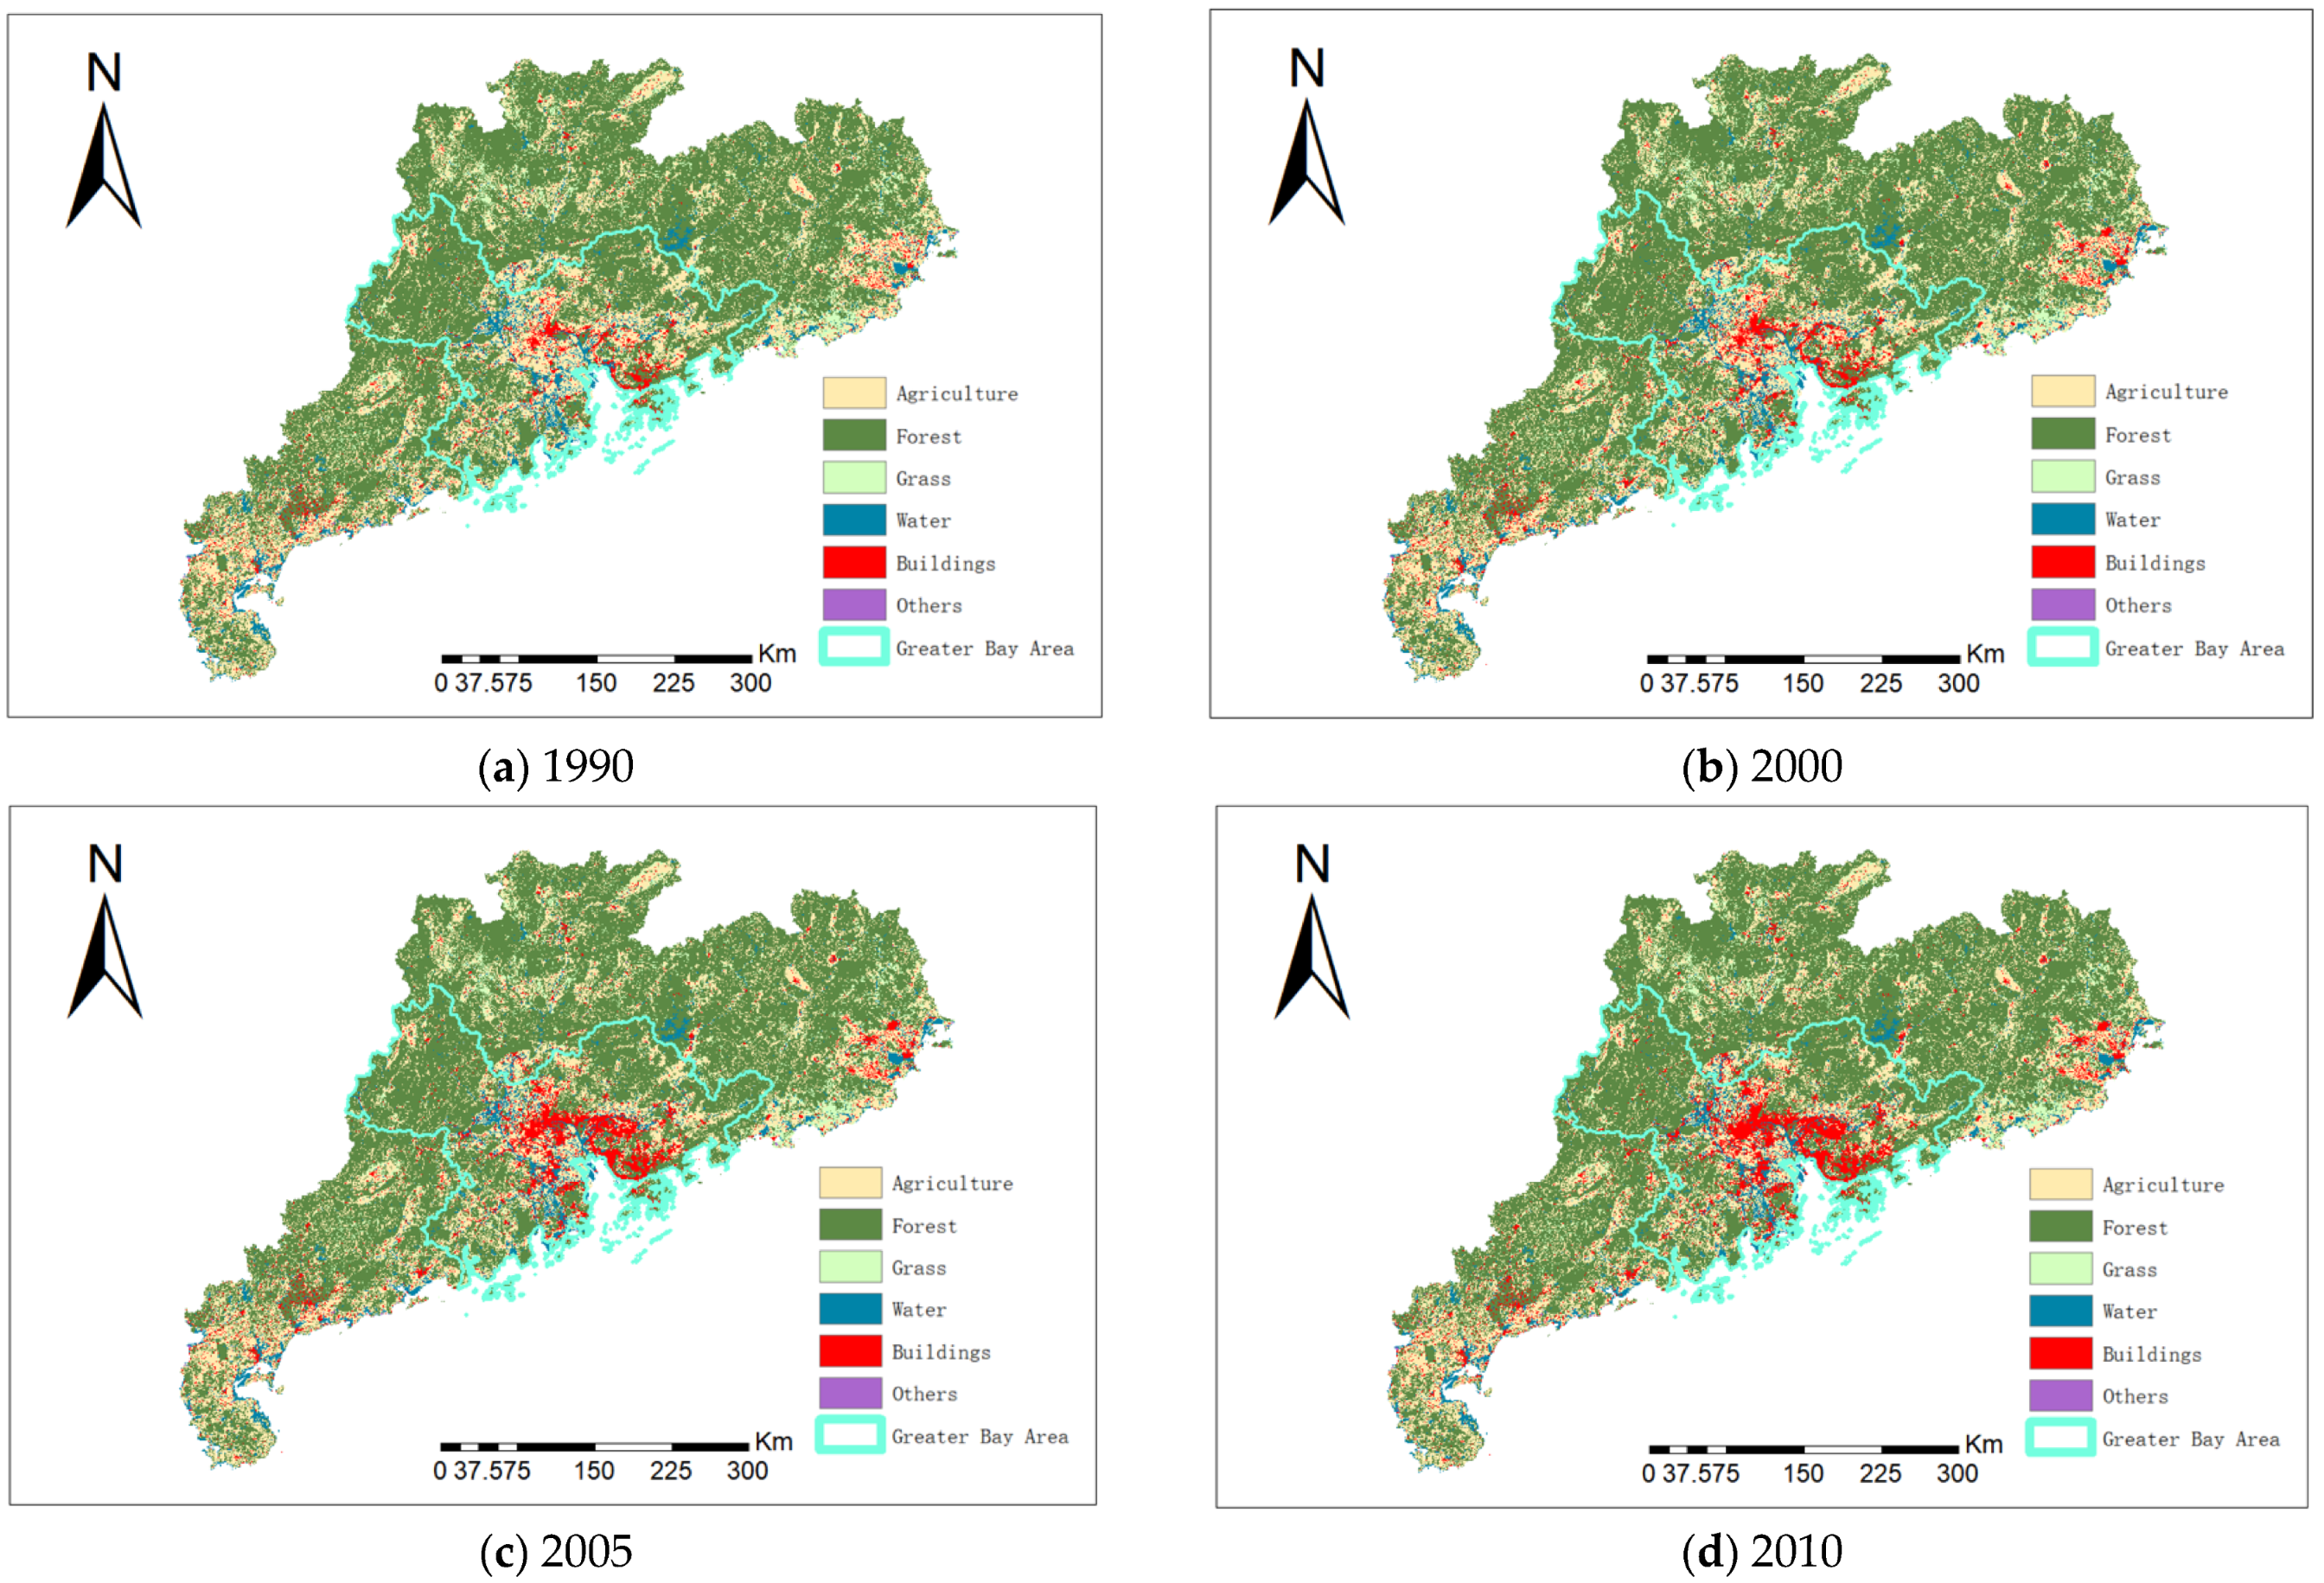
2.2.1. Land Use and Land Cover Change Data

This experiment used multi-period land use/land cover remote sensing monitoring data (CNLUCC) in China [42] from 1990, 2000, 2005, 2010 and 2020 (Figure 2). This data set is provided by the Data Center for Resources and Environmental Sciences, Chinese Academy of Sciences (RESDC)
The data adopt a three-level classification system, which is mainly divided into arable land, forest, grassland, water, construction land and unused land according to land resources and their use attributes. Among them, arable land is divided into paddy fields, and dryland; forest is divided into woodland, shrubland, sparsely forested land and other forests; grassland is divided into high cover grass, medium cover grass, and low cover grass; the waters are divided into canals, lakes, reservoir pits, permanent glacial snow, tidal flats, and beaches; construction land is divided into urban land, rural settlements, and other construction lands; unused land is divided into sandy land, Gobi, saline land, swampland, bare land, bare rock texture, and others.
The remote sensing information source used in the construction of CNLUCC is mainly Landsat-MSS/TM/ETM and Landsat8 images covering the whole country. Due to poor timing or missing time, it was supplemented by data from China–Pakistan resource satellites or small environmental satellites. CNLUCC remote sensing interpretation is based on the unified land use/cover classification system, combined with remote sensing image interpretation signs, in the ARCMAP software environment for human–computer interaction land use/cover type interpretation. Among them, the data collection of arable land in urban and rural settlements has a correct rate of not less than 95%, a correct rate of grassland, woodland, water areas, etc., is not less than 90%, and the accuracy rate of unused land is not less than 85%.

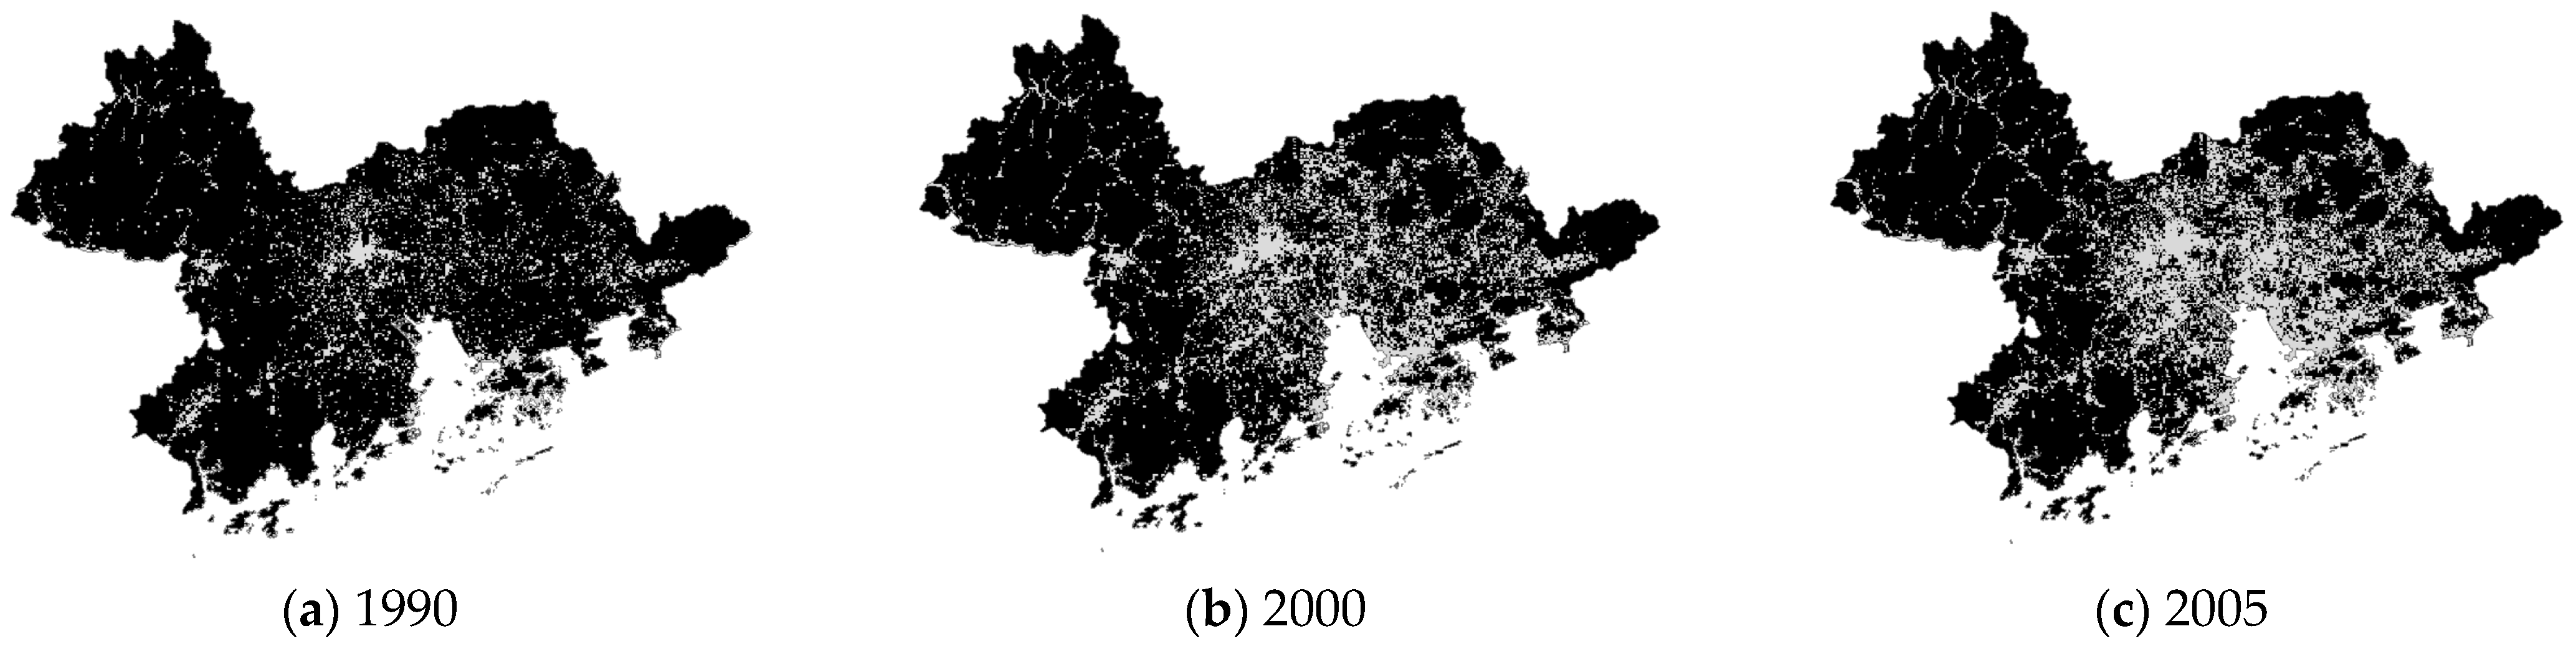
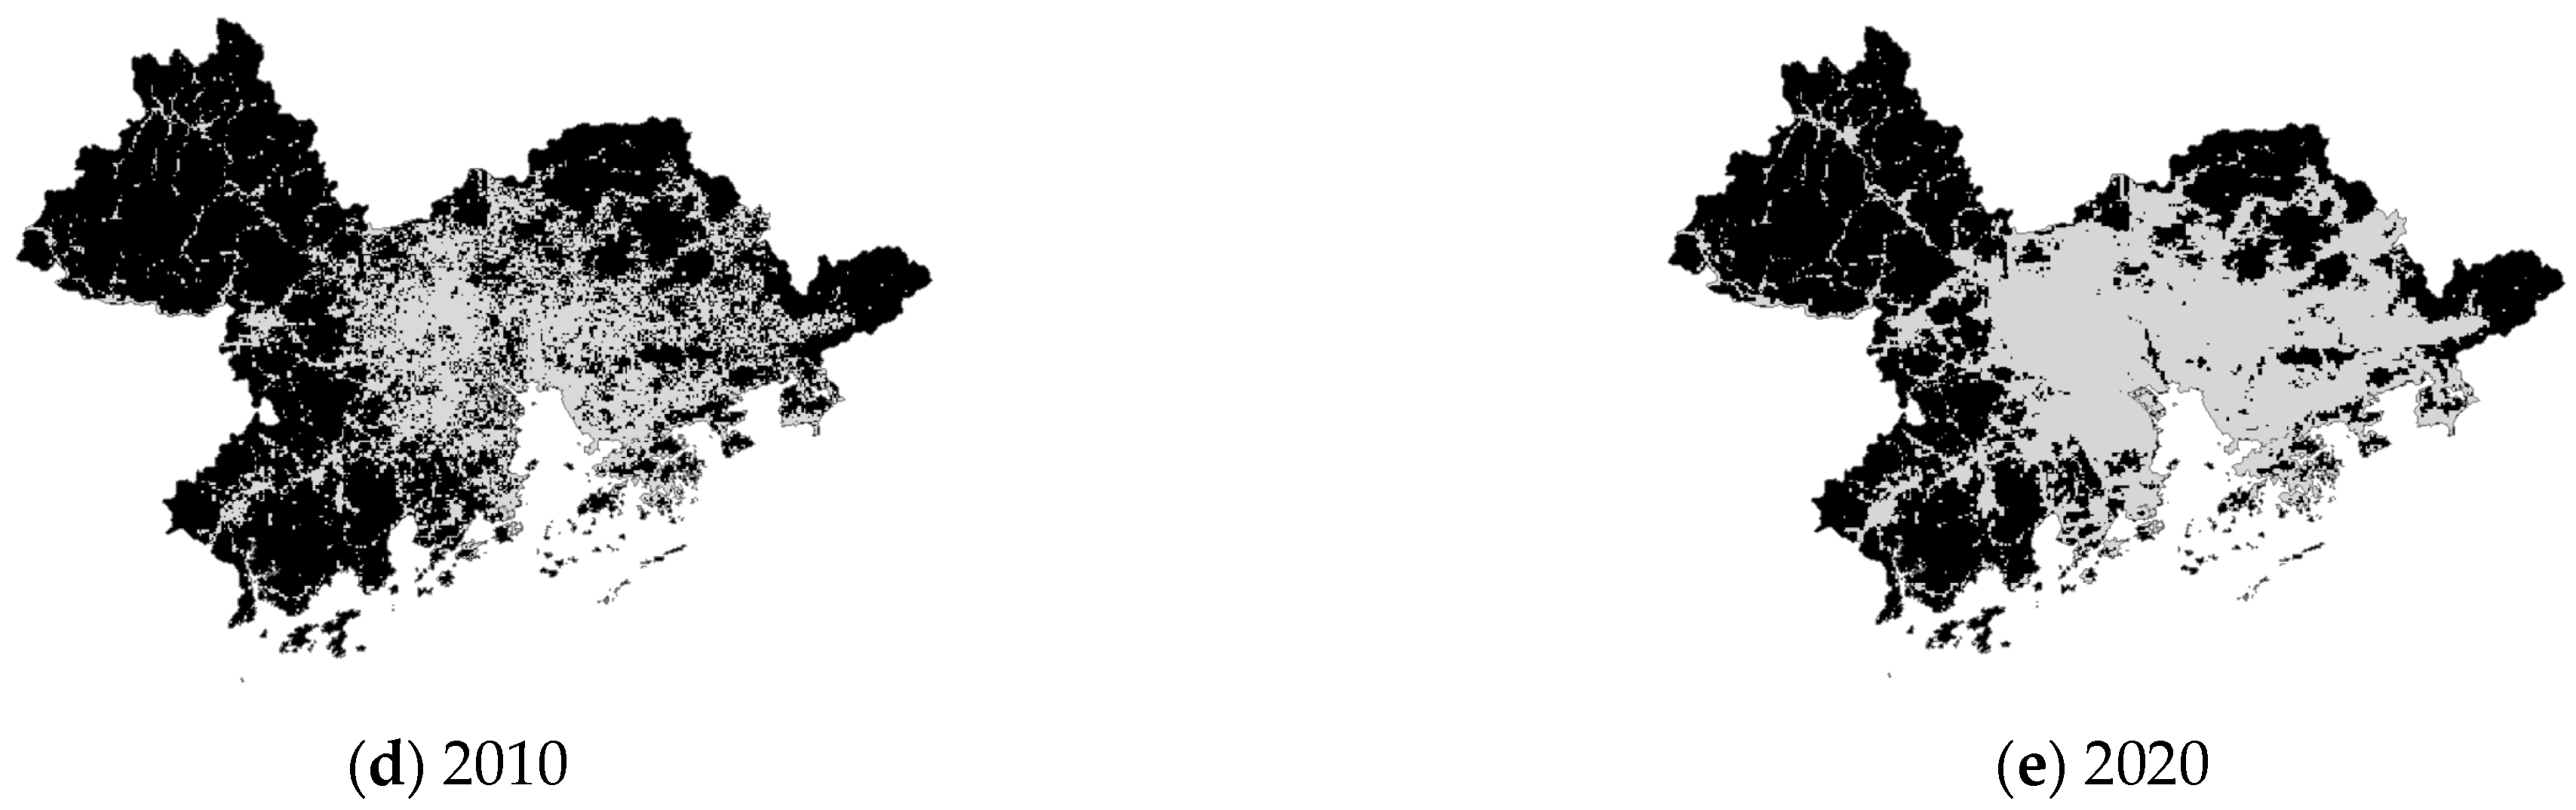
2.2.2. Impervious Surface Data of the Greater Bay Area

The GAIA data [43] are accessed from the Google Earth Engine cloud computing platform. It was developed by the research group led by Professor Gong Peng of Tsinghua University. The GAIA data plot the global 30-m resolution urban impervious water surface data year by year (1985–2018) (Figure 3). The study of long-time series-based Landsat optical images (nearly 1.5 million views) and other ancillary data (night light data and Sentinel-1 radar data), first through the spatial mask and Exclusion-Inclusion algorithm was conducted to achieve rapid mapping of impermeable water surfaces year by year, and then through the Temporal Consistency Check. The algorithm performs time domain filtering and transformation logic inference on the initial impervious water surface sequence, thus ensuring the rationality of the obtained impervious water surface sequence in space-time. In view of the difficulty of impermeable surface mapping in arid areas around the world, the research team introduced Sentinel-1 radar data and night light data, which significantly improved the mapping accuracy of products in arid areas compared with previous studies. Through the analysis of the accuracy evaluation of typical years, it can be seen that the average overall accuracy of GAIA exceeds 90%.

2.2.3. Landsat-MSS/TM/ETM and Landsat 8 Image

In this experiment, satellite remote sensing image data covering the research area were also selected. Among them, the images of 1990, 2000, 2005 and 2010 used the land reflectance data of Landsat-MSS/TM/ETM, and the images from May to September of that year were screened for stitching. Then the images of Guangdong Province were trimmed according to the administrative divisions of Guangdong Province, and the hyperspectral remote sensing images of Guangdong Province in 1990, 2000, 2005 and 2010 were obtained. In 2020, the surface reflectance data of landsat8 images were used, and the images from May to September of the same year and May to September of the following year were also screened for stitching and cropping. Finally, the hyperspectral remote sensing image data of Guangdong Province for six years, i.e., 1990, 2000, 2005, 2010 and 2020 were obtained.

2.3. Analysis Methods

Our experiment is divided into four main parts, which are data collection, data processing, index calculation, and correlation analysis. The flow is shown in Figure 4.

2.3.1. Urbanization Measuring

Impervious surface area (ISA) refers to the surface covered by impervious material, often including less permeable surfaces, such as roofs, parking lots and roads, and is the most significant feature of urbanization. In many studies, cities are defined as impermeable surface areas [30,44,45,46]. The formula for calculating the average annual growth rate of impervious surfaces is as follows:
V = S n e w S o l d S o l d   ·   T
Among them, it refers to the impervious water surface area after the change and the impervious water surface area before the change, and T refers to the time of change. In this experiment, GAIA data were used to extract the impervious area of the Greater Bay Area and calculate the average annual growth rate to reflect the speed of urbanization.
The urbanization rate is a measure of urbanization, generally using demographic indicators in China. The specific calculation formula is as follows:
R = C u C t
Among them, Cu is the urban population, and Ct is the total population. The urbanization rate is an important reflection of the level of urbanization, which can well reflect the demographic structure of the study area: if the urbanization rate is getting higher and higher, it means that the population is becoming more and more concentrated in the city. This experiment uses the city rate of Guangdong Province to reflect the population distribution changes in Guangdong Province.

2.3.2. Ecological Environment Quality Measuring

Vegetation area is the most intuitive indicator of ecological quality, in this experiment, this paper calculated the area of forest and grassland outside the Greater Bay Area in the study year based on CNLUCC data. In addition, the area of forest and grassland outside the Greater Bay Area is used as the basic index to evaluate the external environment of the Greater Bay Area.
Landscape indices are used to describe and quantify the structure and configuration of landscape patterns to assess and monitor changes in landscape patterns. This experiment selected two commonly used indicators: average plaque area (AREA_MN) and plaque density (PD). It is used to reflect the patch area and the degree of plaque fragmentation in the vegetation area, respectively. This experiment uses LUCC data to calculate the landscape quality of the external environment of the Greater Bay Area by calculating the two landscape indices of the forest and grassland outside the Greater Bay Area.
Fraction Vegetation Coverage (FVC) is usually defined as the vertical projection area of vegetation (including leaves, stems and branches) on the ground as a percentage of the total area of the statistical area, which is an important parameter for depicting surface vegetation cover. FVC plays an important role in the study of vegetation change, ecological environment research, soil and water conservation, and urban livability. Vegetation coverage can intuitively reflect the lushness of vegetation in an area, which is an important indicator of the growth state of vegetation. In remote sensing, the degree of vegetation cover is usually calculated by the cell dichotomy, as follows:
FVC = N D V I N D V I s o i l N D V I v e g N D V I s o i l
In this experiment, the NDVI values with a cumulative probability of 0.5% and 99.5% in the influence are taken as the NDVIsoil and NDVIveg, and the NDVI values outside this interval are regarded as pure soil and pure vegetation. In this experiment, the vegetation areas of each period were extracted from CNLUCC data as masks. Then a number of Landsat-MSS/TM/ETM hyperspectral images covering the study area were selected to calculate the vegetation coverage of the vegetation areas. So, the ecological quality of the external environment of the Greater Bay Area can be reflected.

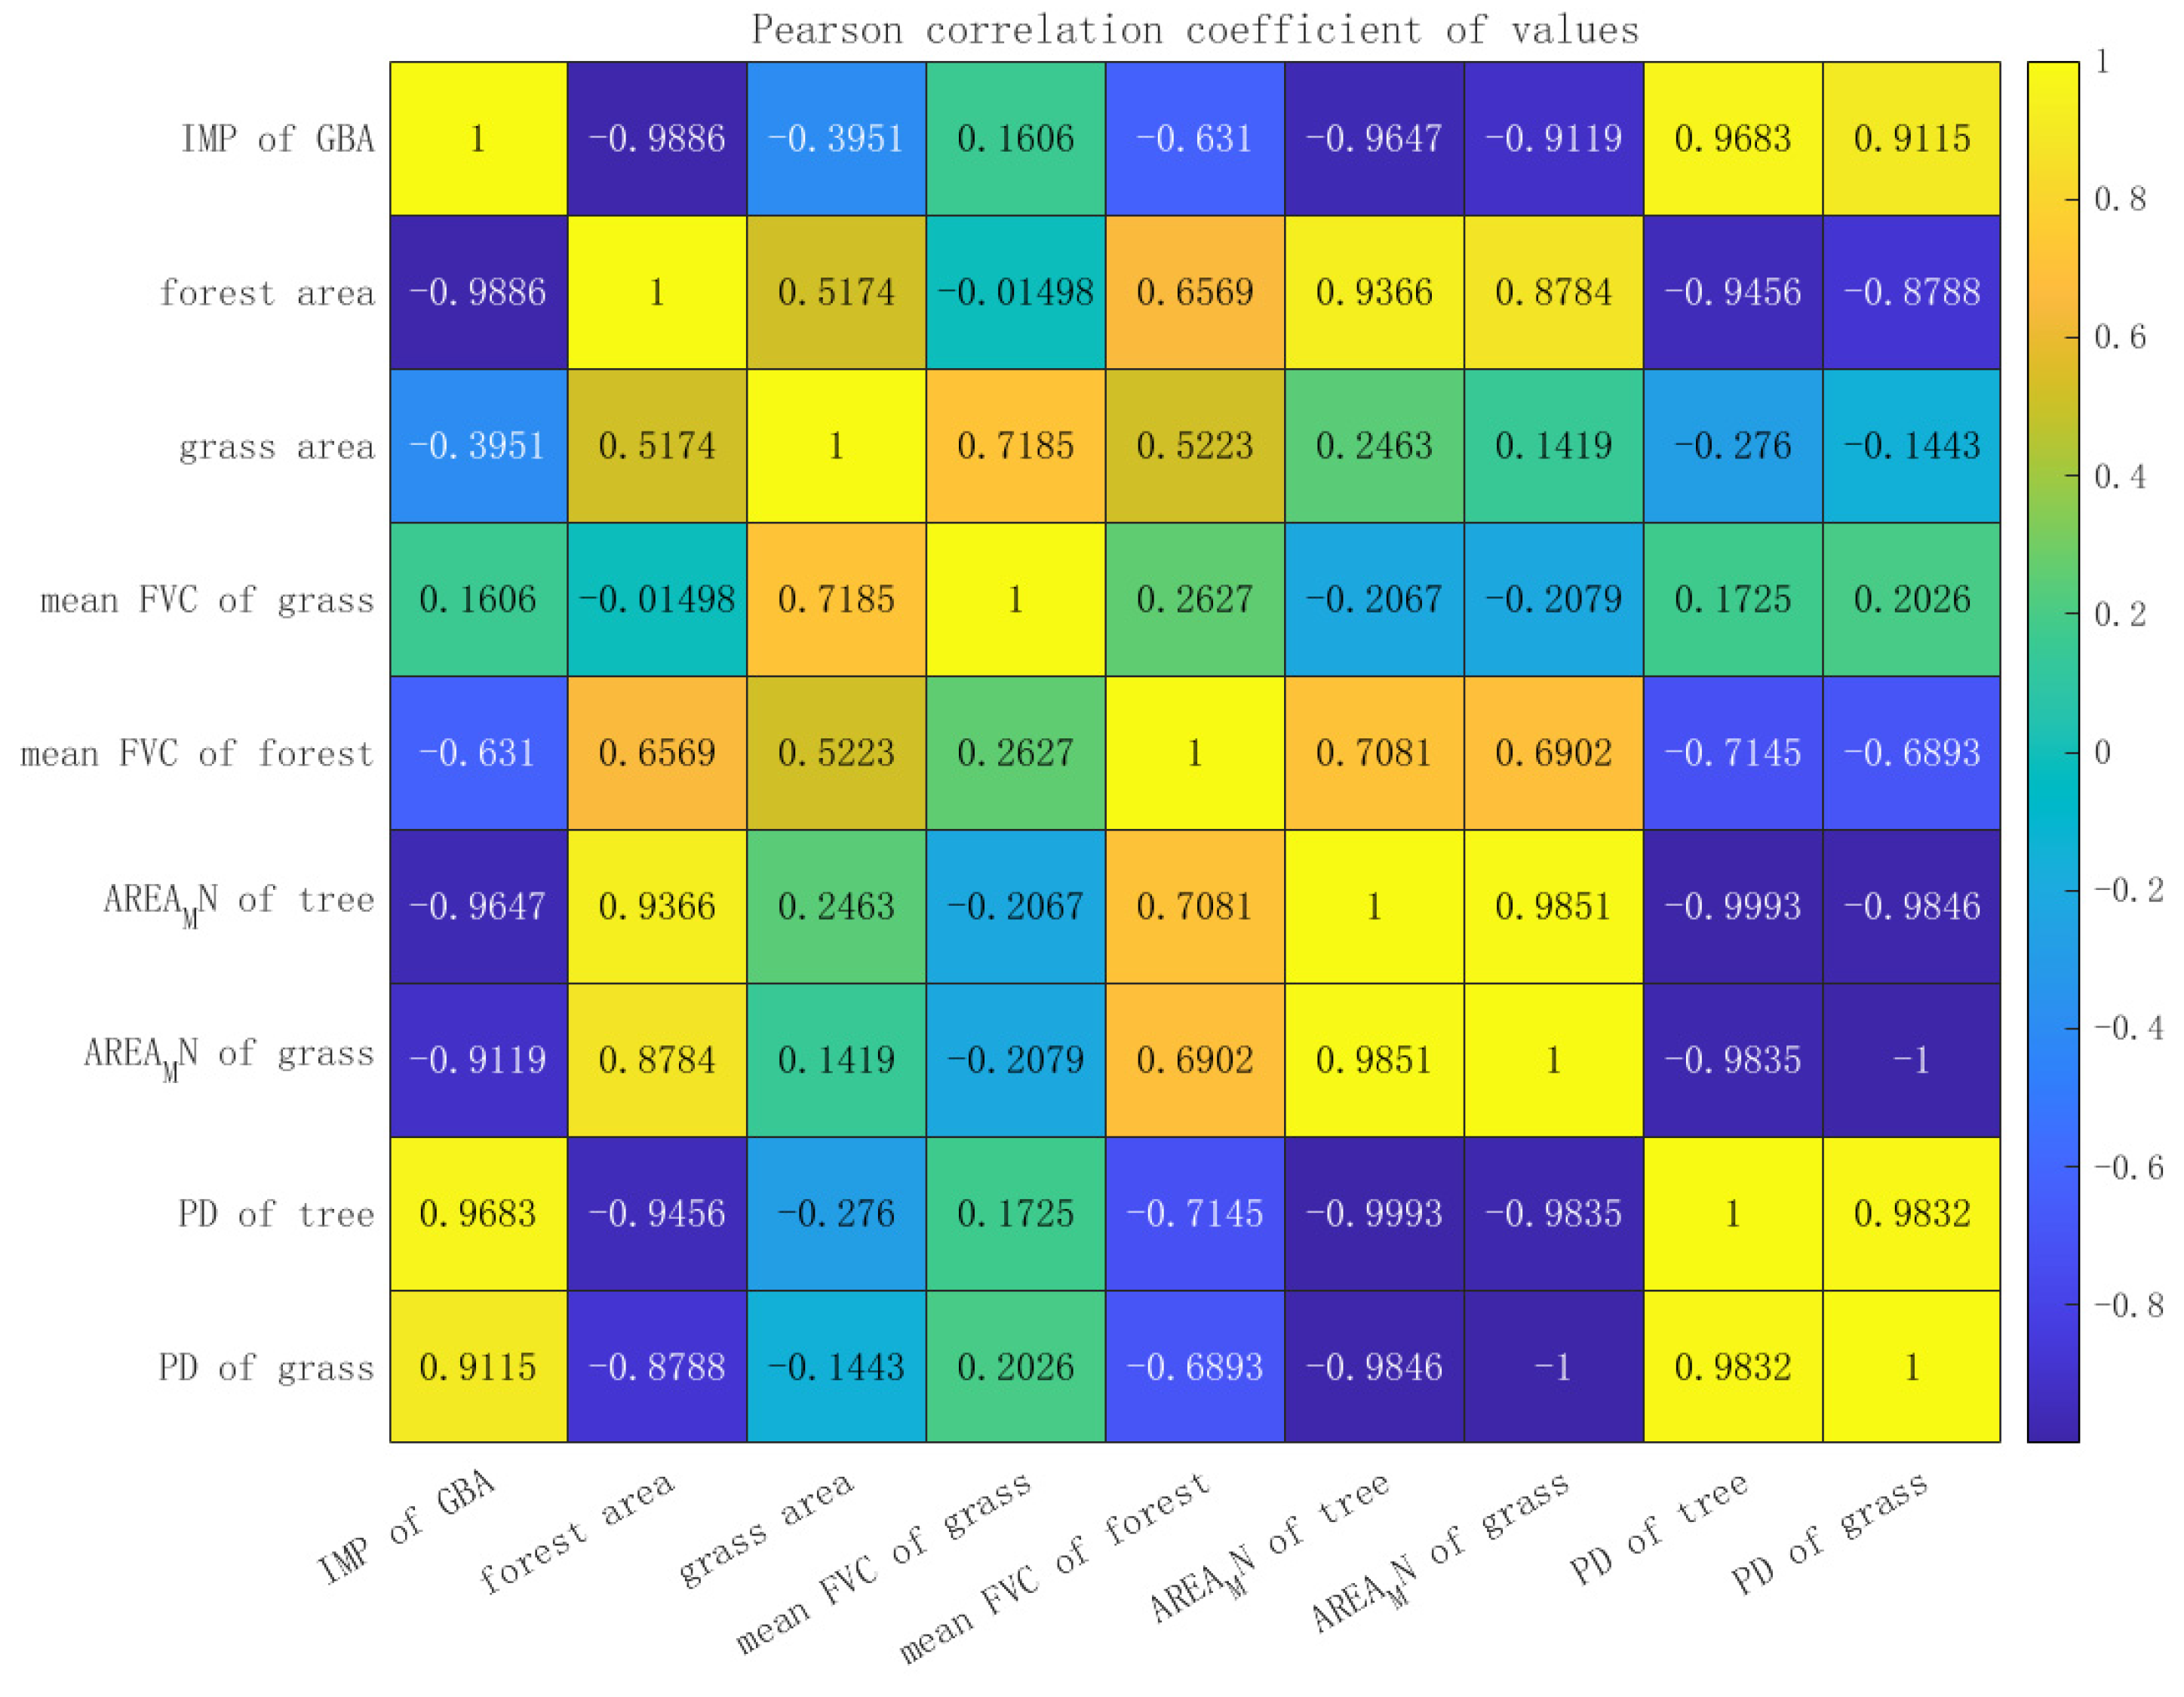
2.3.3. Correlation Analysis between Ecological Quality Indicators and Urbanization Indicators

The relationship between two variables includes two types of relationships: deterministic and nondeterministic. The former refers to the relationship between two variables as a functional relationship, that is, the value of one variable is known, and the value of the other variable can be calculated precisely by the functional relationship. The latter refers to the relationship between two variables macroscopically, but not precisely enough to be expressed by a functional relationship, which is both necessary and uncertain and is called correlation. Correlations are divided into linear and nonlinear correlations, and Pearson correlation analysis is a method for analyzing linear correlations between two variables. Suppose there are m objects and n indicators that can form a matrix X. Let the correlation coefficient between column a and column b in the matrix be rho(a, b), then the formula is as follows:
rho a , b = i = 1 m X a , i X ¯ a X b , i X ¯ b i = 1 m X a , i X ¯ a 2 · j = 1 m X b , j X ¯ b 2
The value of rho ranges from (−1,1), with a value of −1 indicating a perfectly negative correlation, a value of 1 indicating a perfectly positive correlation, and a value of 0 indicating no correlation.
This experiment will take the area of the impervious surface outside the Greater Bay Area, environmental indicators outside the Greater Bay including area, average vegetation cover and landscape index as dependent variables, and calculate the Pearson correlation coefficient between them as a way to test whether the change of external environment is related to urbanization. All calculations will be conducted using MATLAB.

3. Results

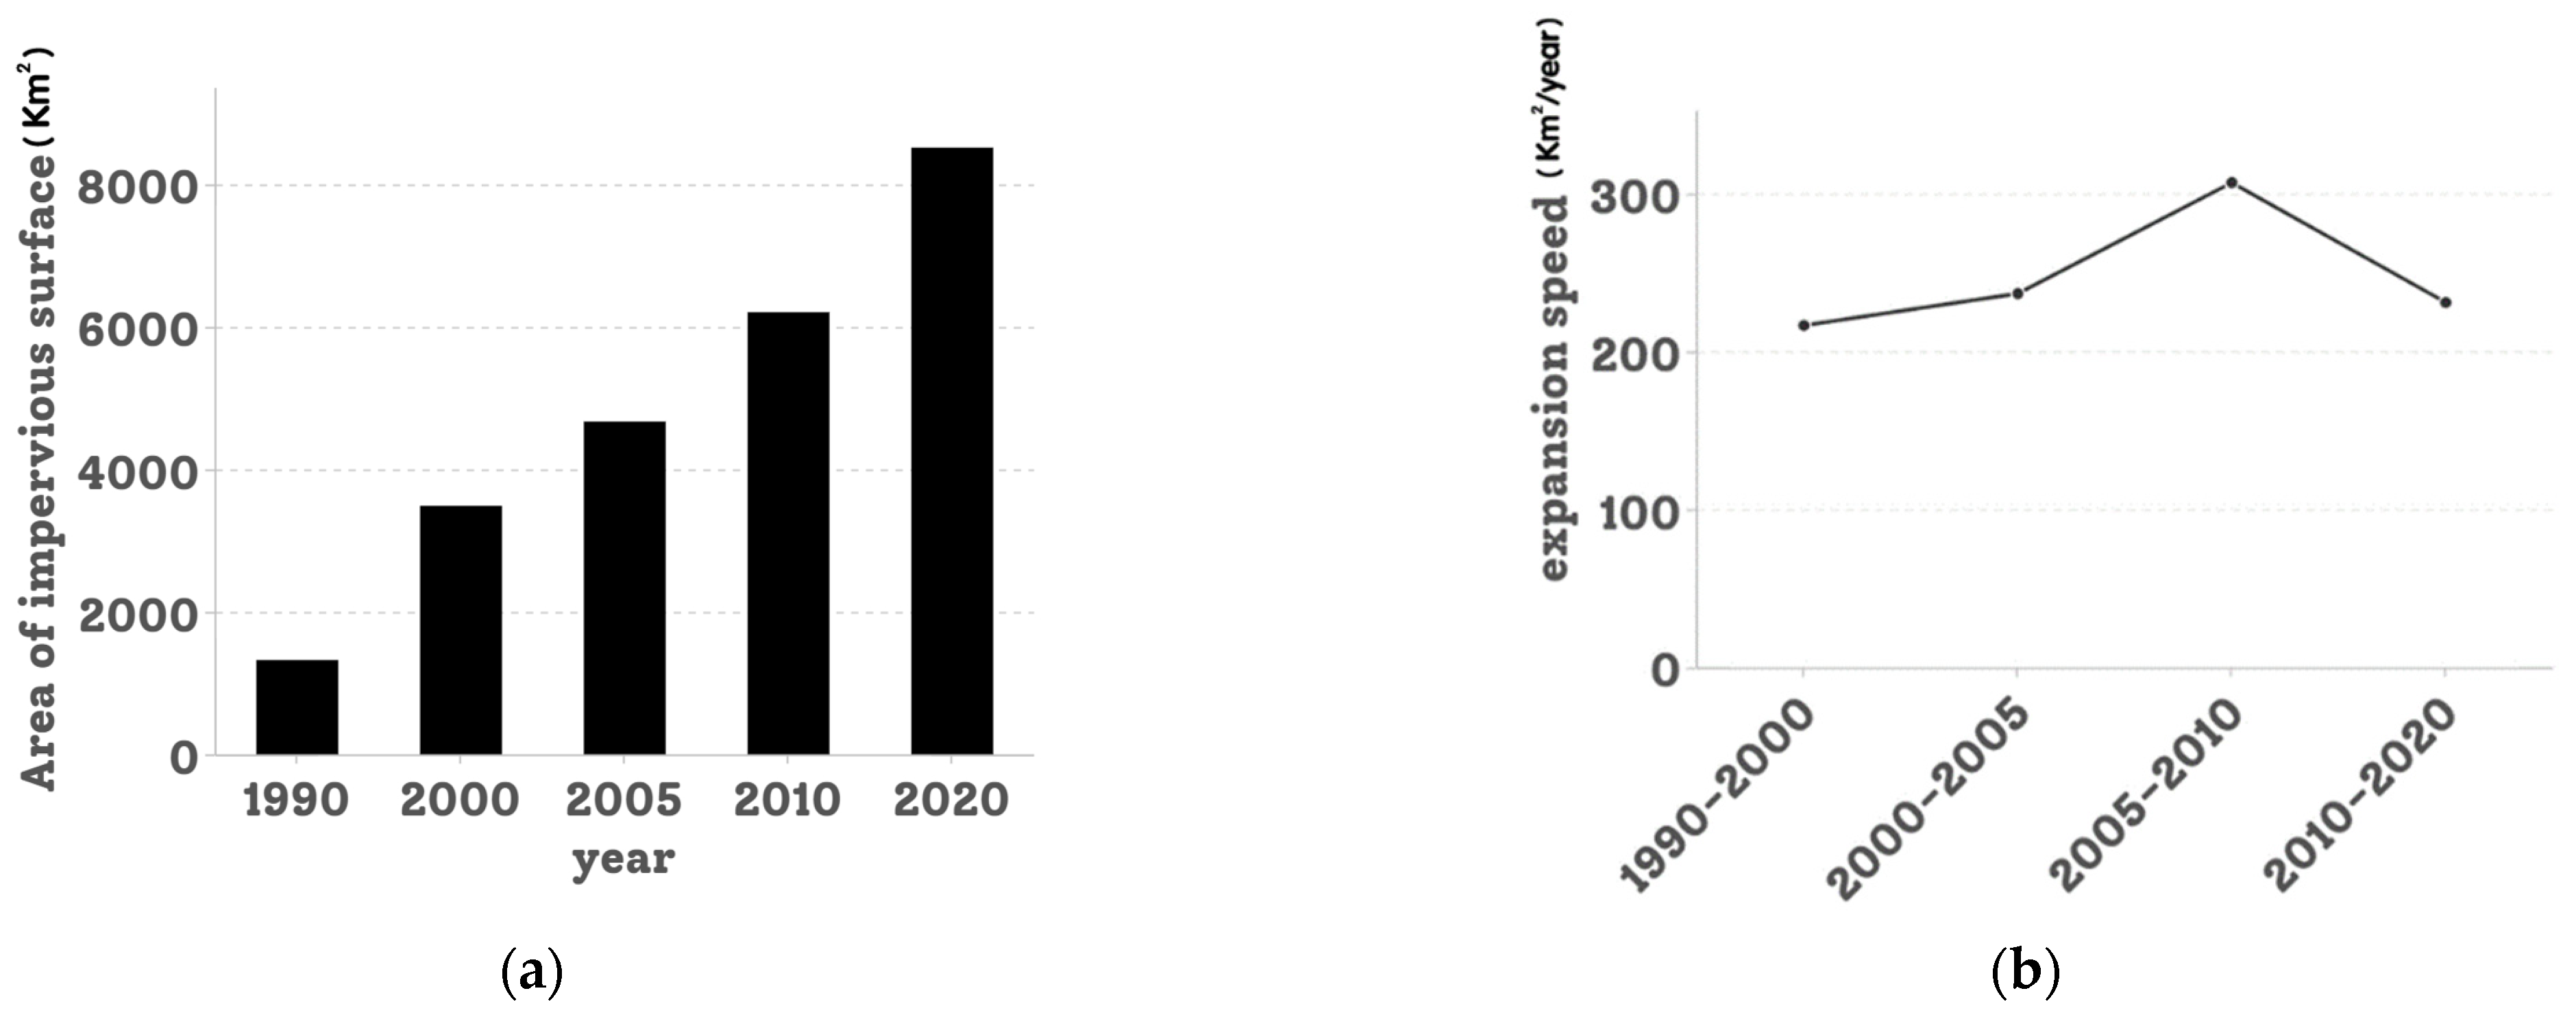
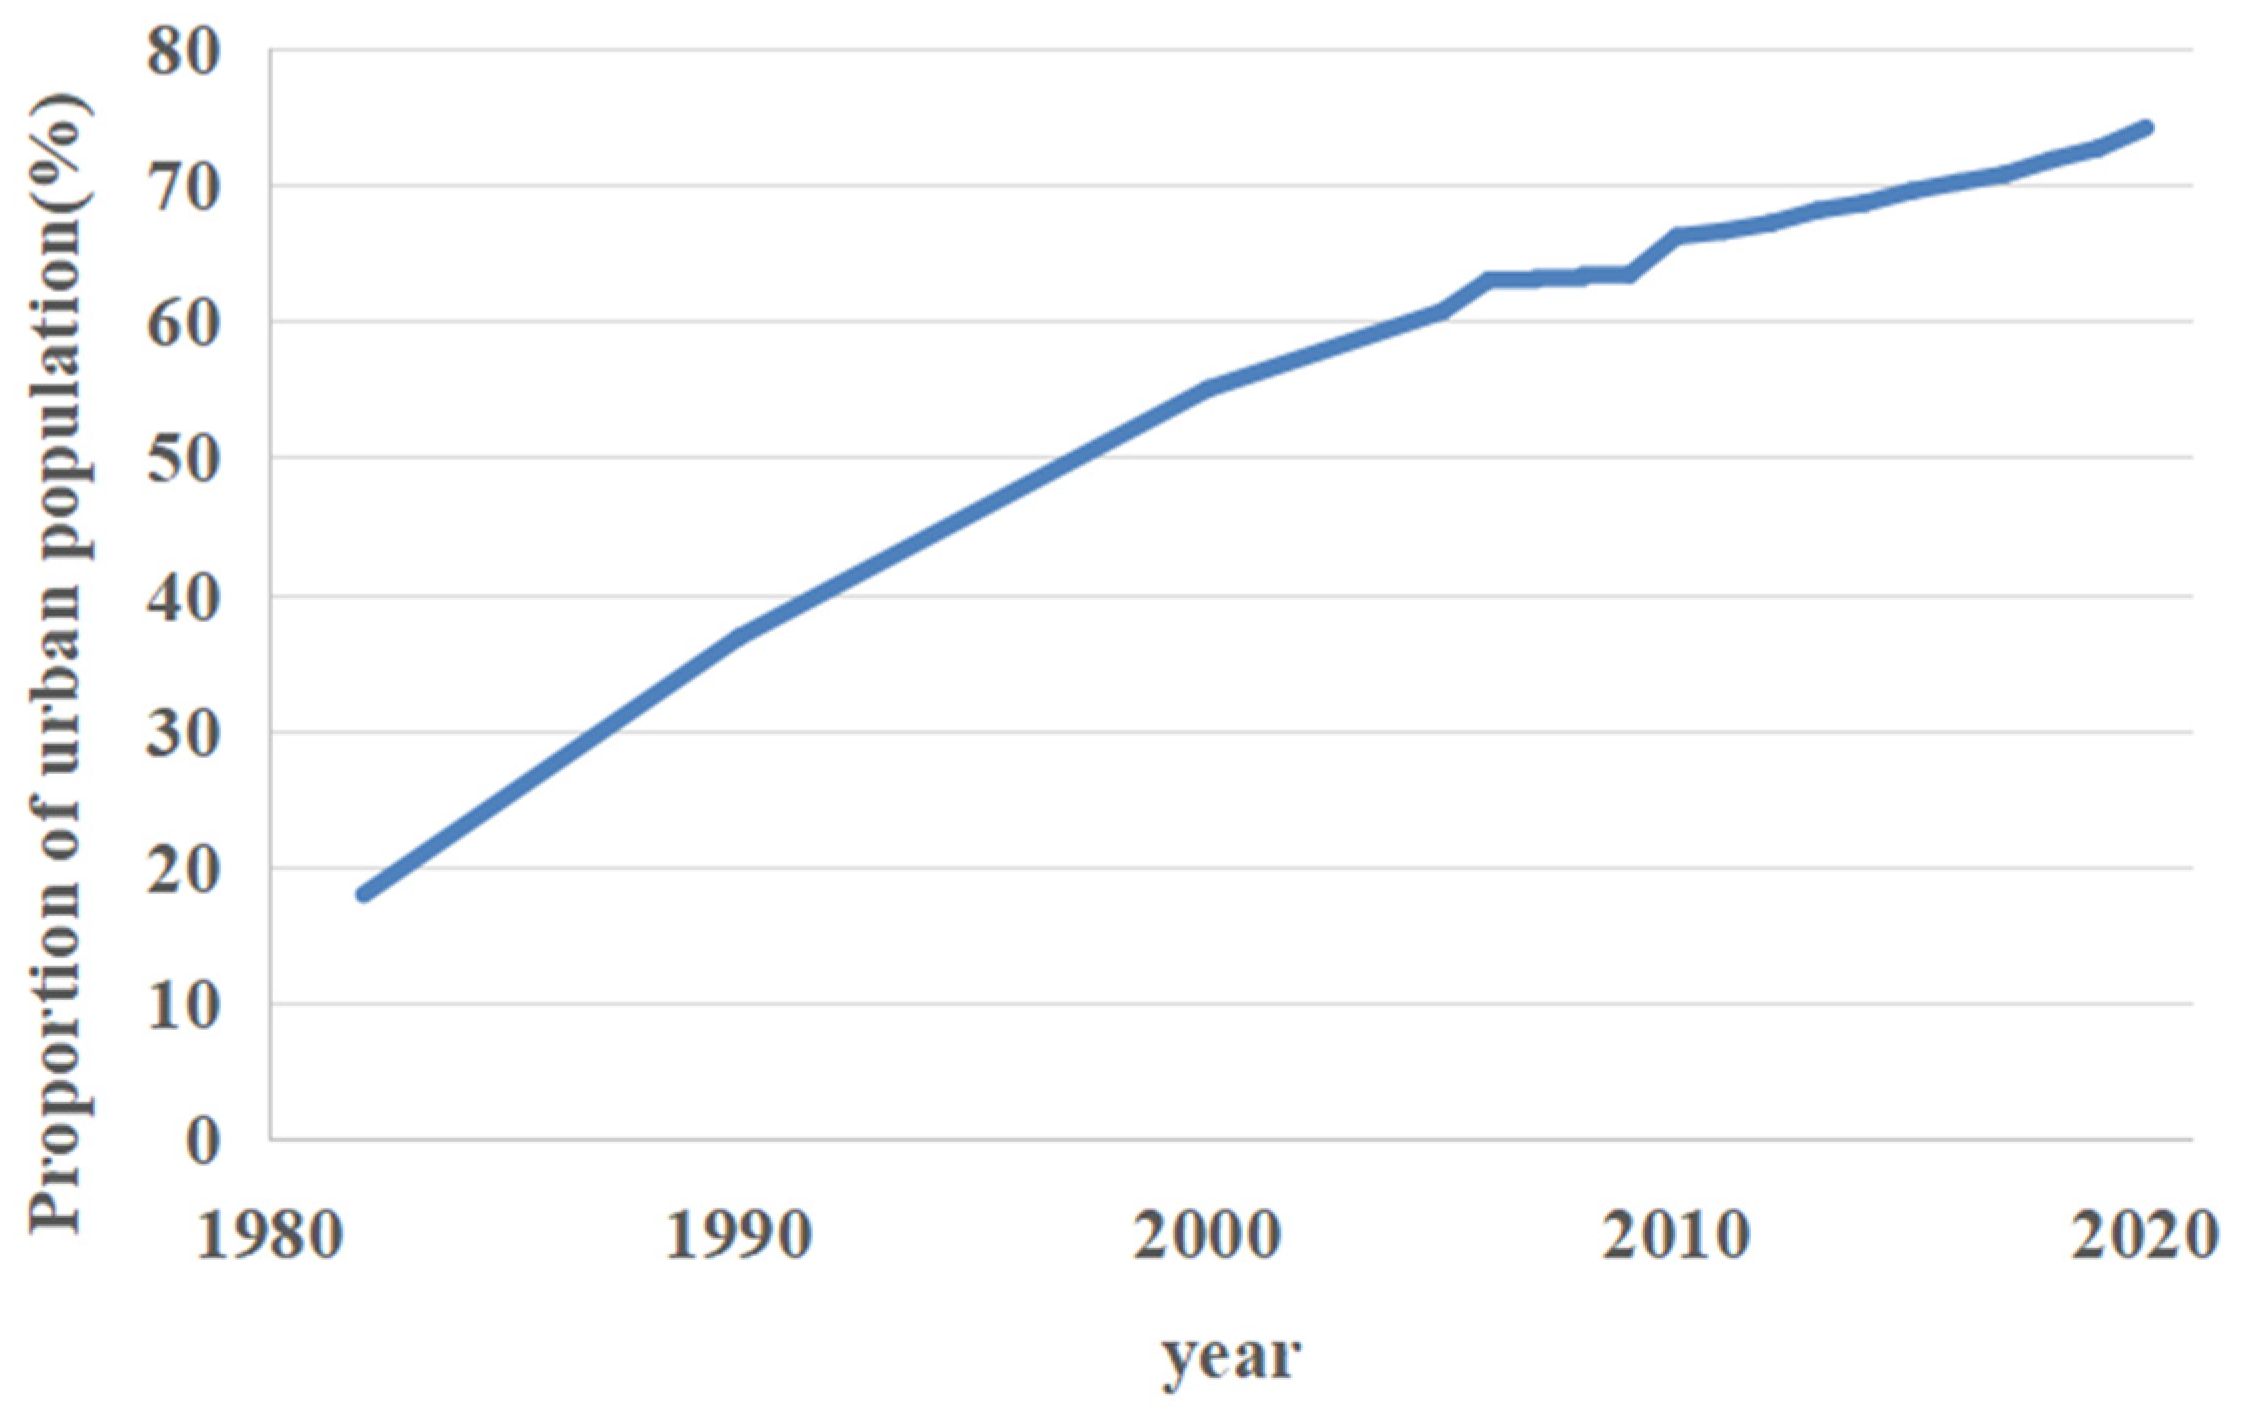
3.1. Urban Expansion of the Greater Bay Area from 1990 to 2020

According to calculations, the impervious surface area of the Greater Bay Area increased from 1323.9 square kilometers in 1990 to 7962.6 square kilometers in 2020, an increase of 480% year on year. This is equivalent to adding the land area of a Guangzhou city. From the perspective of the average growth rate, the impervious surface of the Greater Bay Area keeps a high growth rate, and the peak period of impervious surface from 2005 to 2010 is an increase of 307 square kilometers per year on average. The area of the impervious surface is shown in Figure 5.
Simultaneously, as shown in Figure 6, the urbanization rate of Guangdong Province is also increasing. In 1980 only about 17% of the population of Guangdong Province was concentrated in cities, and by 2020, Guangdong’s urban population accounted for 74% of the total number of people in Guangdong Province. In the large mountainous areas outside the cities, only 26% of the rural population remains.

3.2. Changes in Ecological Indicators Outside the Greater Bay Area from 1990 to 2020

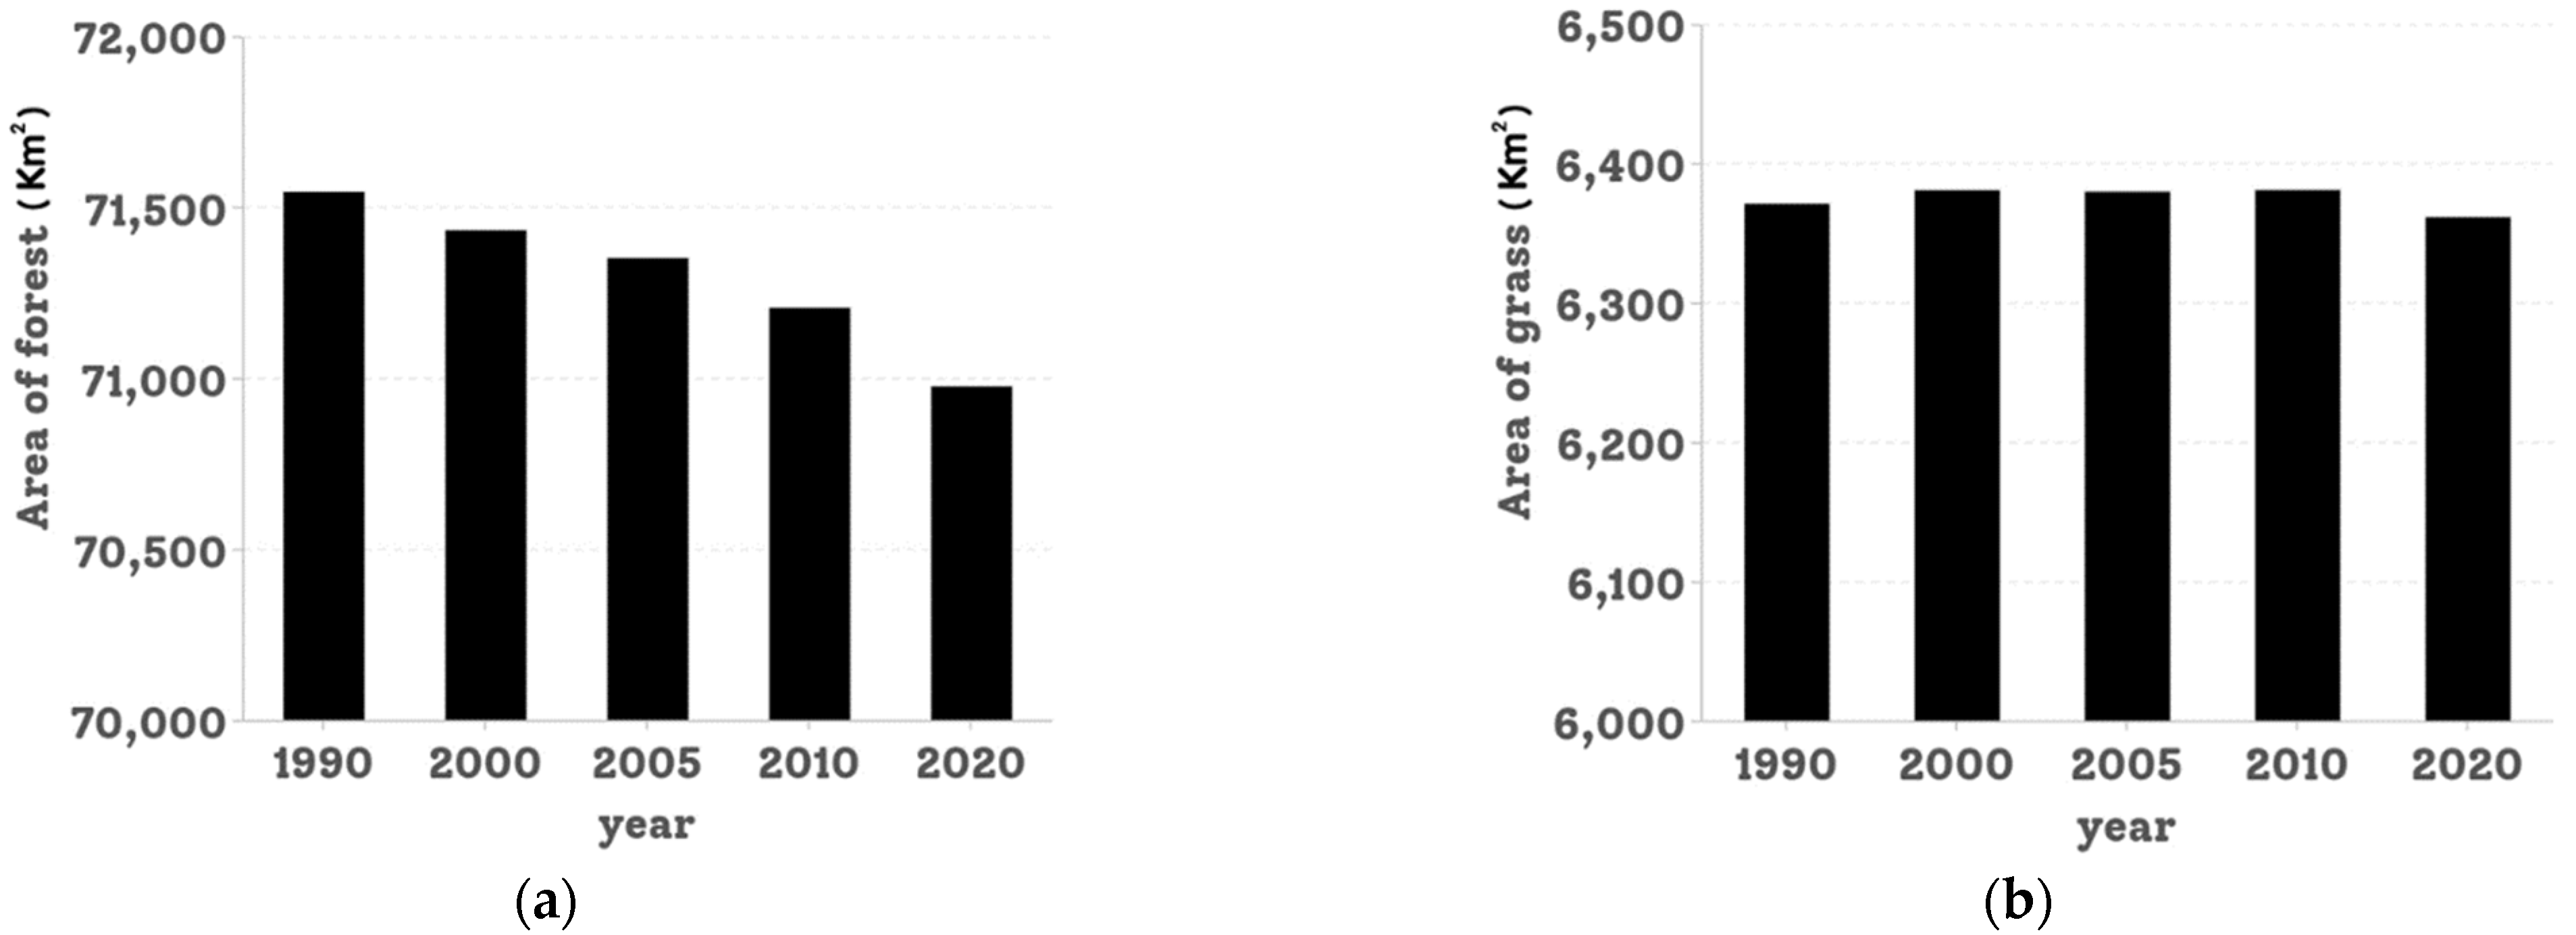
3.2.1. Changes in Forest and Grassland Area

Forests and grasslands are affected differently by urbanization. Since 1990, the forest area outside the Greater Bay Area has continued to decrease, from 71,544 square kilometers in 1990 to 70,975 square kilometers in 2020. It is worth noting that the decline rate was the fastest from 2005 to 2010, with an average annual loss of 29 square kilometers of forest, equivalent to the area of one Macao. The area of the grassland increases and then decreases, but only by a small margin. The area of forest and grassland is shown in Figure 7.

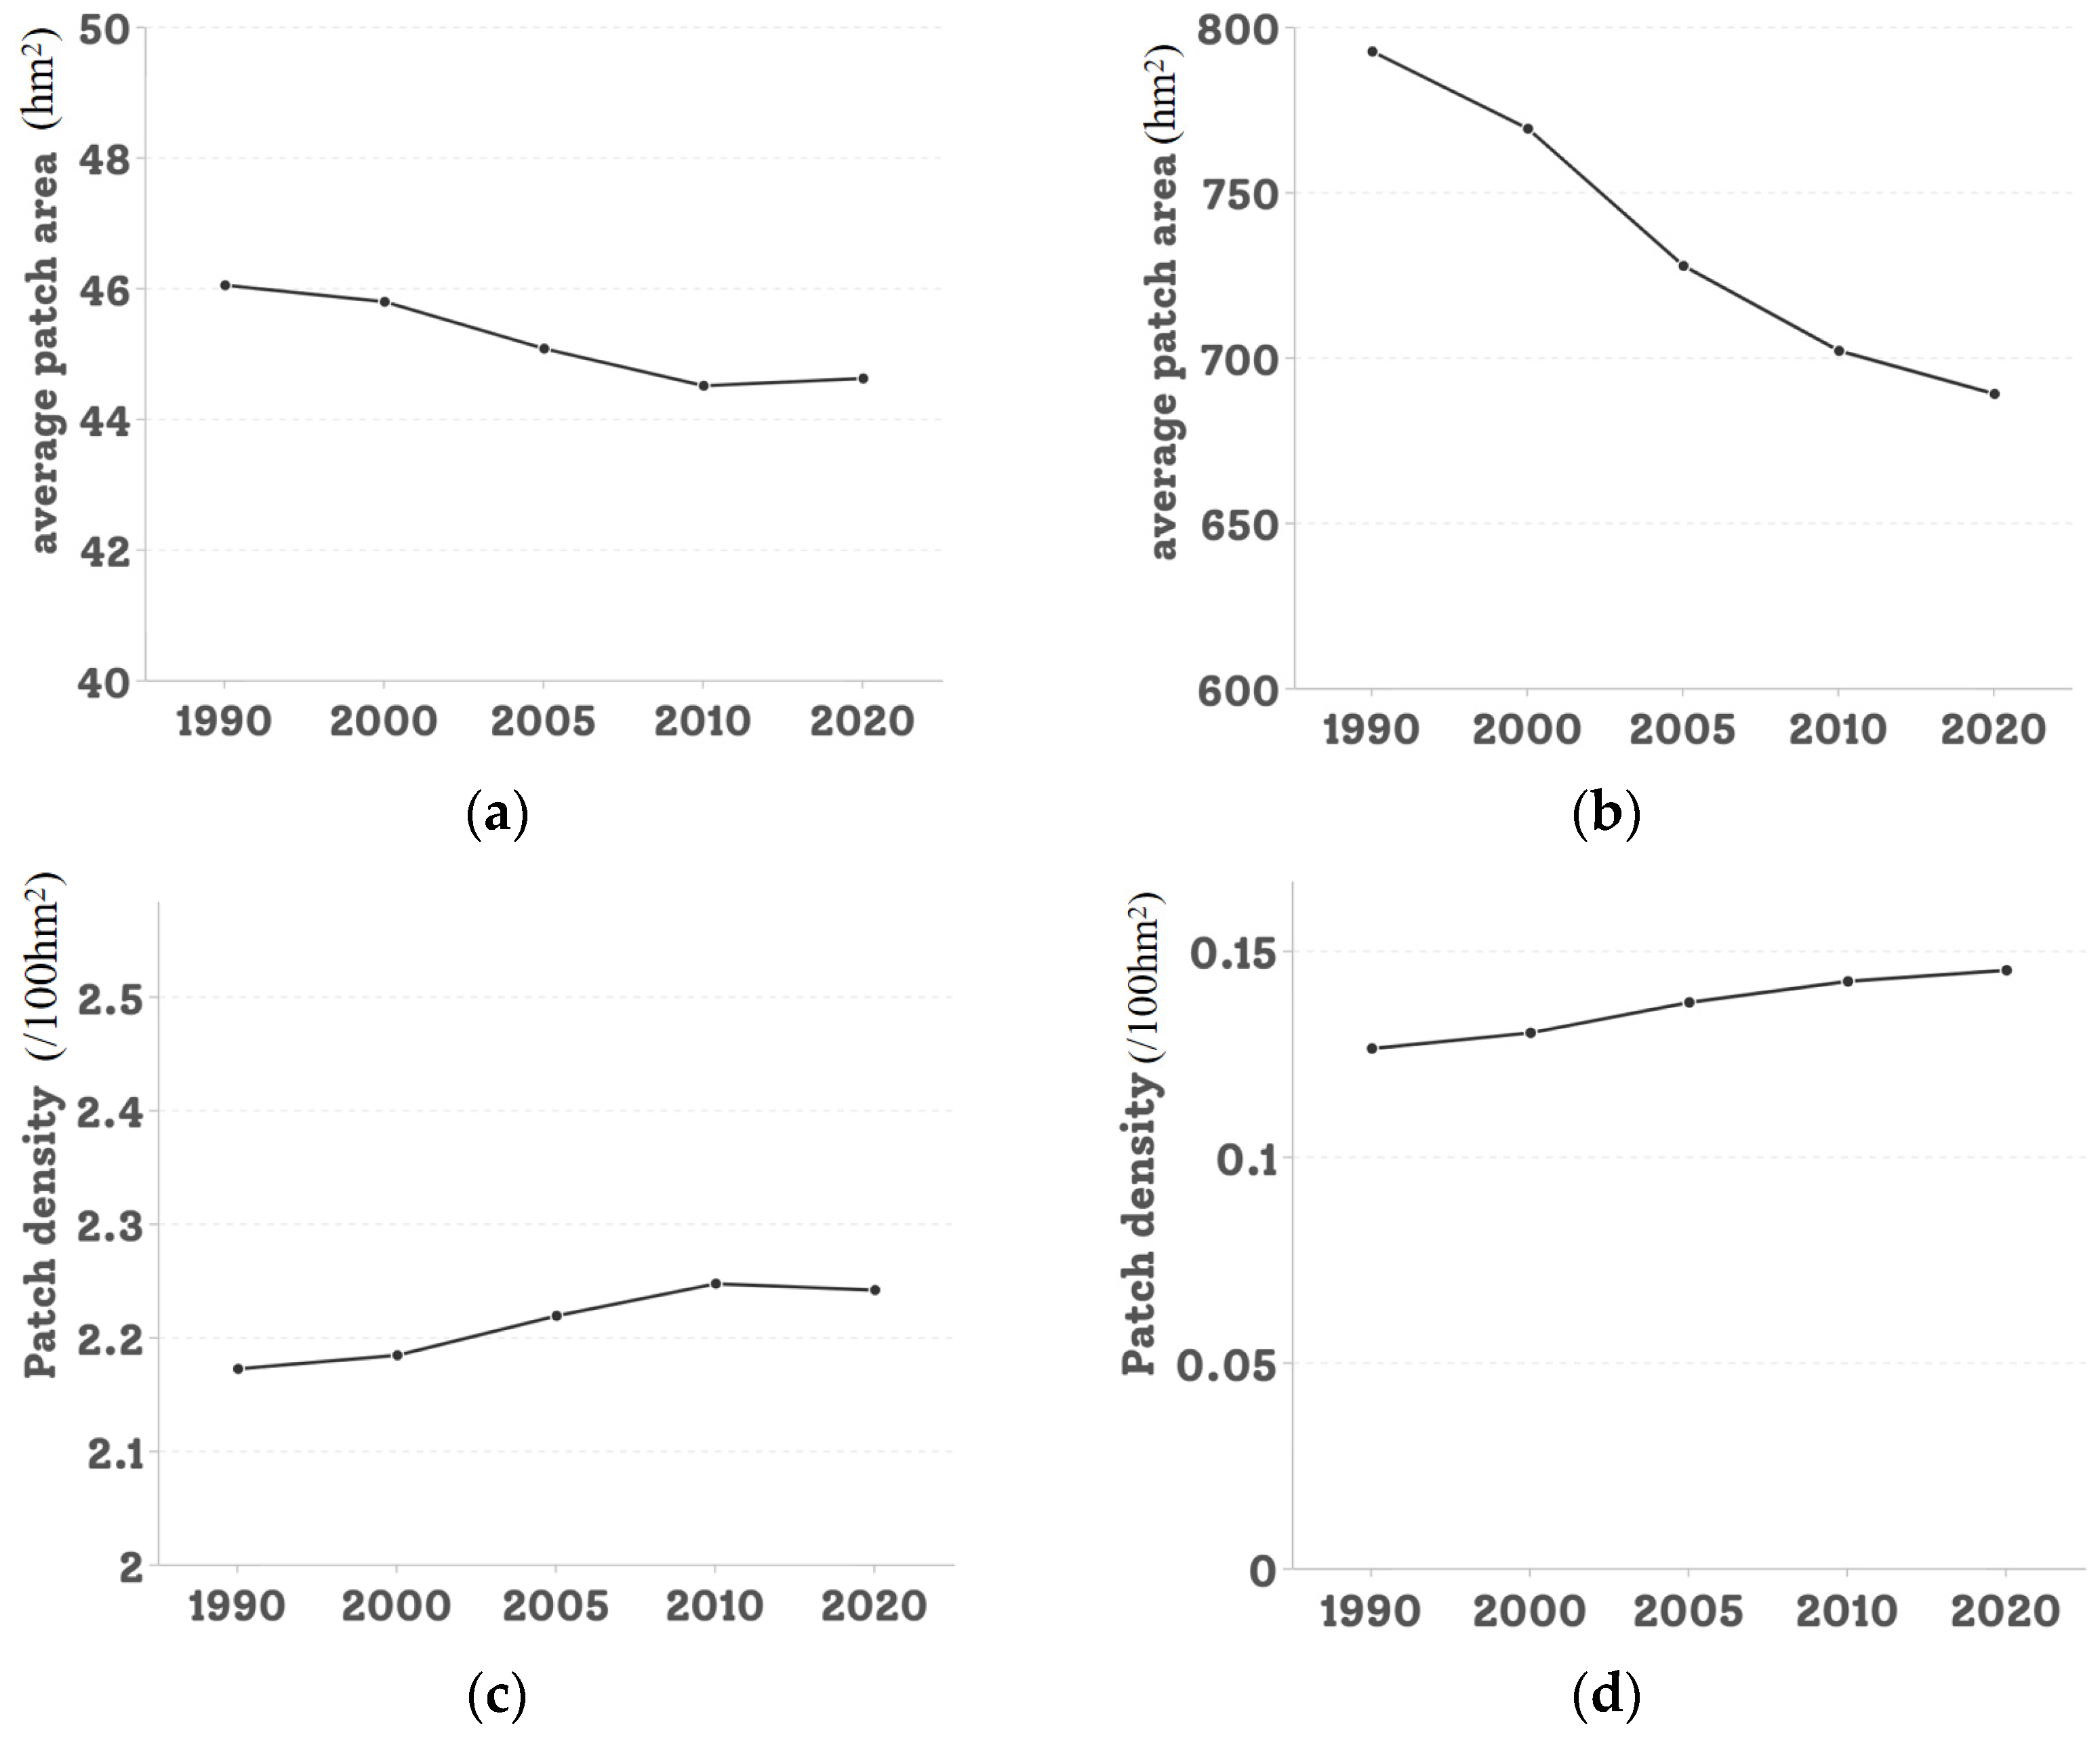
3.2.2. Changes in the Forest and Grassland Landscape Index

The impact of urbanization on the landscape index of forests and grasslands outside the Greater Bay Area is very obvious: the average patch area of forests and grasslands decreased from 792 and 46 in 1990 to 688 and 44 in 2020. The patch density of forests and grasslands increased from 0.13 and 2.17 in 1990 to 0.15 and 2.24. The reflection of the landscape is that the patches of forests and grasslands outside the Greater Bay Area are gradually fragmented and densely packed, and the original large forests and grasslands are gradually divided into small, fragmented landscapes. The landscape index is shown in Figure 8.

3.2.3. Changes in Vegetation Cover in Grasslands and Forest

The impact of urbanization on the FVC of grassland and forest outside the Greater Bay Area (Figure 9) is not easy to find. From the average coverage alone, the average coverage of grassland and forest fluctuates between 0.56 and 0.62, and there is no obvious law. A computational study of the FVC distribution of grasslands and forests outside the Greater Bay Area shows that: For grasslands, it was roughly distributed on both sides of the middle coverage in 1990. After urbanization began to accelerate, the center of the vegetation coverage distribution moves in the direction of high coverage, and the distribution law was more dispersed and less concentrated. For the distribution of forest vegetation cover, the distribution of forest cover after 1990 has become strange: in 1990, the vegetation cover of the forest was concentrated near the middle and high areas, and the FVC of the forest became discrete after the urbanization process began, and even deviated from the normal distribution curve in 2010 and 2020, and gradually changed from the “inverted bell” distribution to a “hump-type” distribution with less in the middle and more on both sides. The distributions of FVC are shown in Figure 10 and Figure 11.
The correlation matrix between the impervious surface area of the city and the ecological indicators of its peripheral areas was calculated as follows (Figure 12).
From Figure 12, it can be seen that impervious surface area has a strong correlation with forest area and the landscape index of forest and grassland. There is also a negative correlation between the impervious surface area and the FVC of the forest. From the above, it can be seen that urbanization has a negative impact on the peripheral environment in general, while it has a greater impact on forests than on grasslands.

4. Discussion

4.1. The Fact That the Peripheral Ecological Environment of the Greater Bay Area Is Declining

Our experiments show that the impact of the rapid development of the Guangdong-Hong Kong–Macao Greater Bay Area on the ecological environment outside the Greater Bay Area is generally negative. In terms of urbanization, the impervious water surface of the Greater Bay Area has been increasing rapidly. In terms of ecological environment, the landscape index of woodland and grassland reflects the increasing fragmentation of woodland and grassland outside the Greater Bay Area; the area of forests is decreasing year by year, while the area of grassland is relatively stable and has not changed much. The vegetation cover distribution of both has changed: The vegetation cover of grassland has gradually moved to the area of high vegetation cover, while the areas with low coverage increased and areas with high coverage decreased slightly.
According to our statistical results, the urbanization development within the Greater Bay Area is rapid and large-scale. The impervious surface area within the Greater Bay Area changed from 1323.9 square kilometers in 1990 to 7962.6 square kilometers in 2020. In addition, the urbanization rate in Guangdong Province is also increasing, which shows that more and more people are flocking from the countryside to the cities. So, are they mostly in the Greater Bay Area? This can be seen from the population flow data: according to the Guangdong Provincial Bureau of Statistics, the speed of population movement in Guangdong Province has been growing rapidly in the past two decades: in 2000, the net inflow of people in the Greater Bay Area was 84 thousand, by 2010 it was 105 thousand, and by 2020, this number surged to 336 thousand (http://stats.gd.gov.cn/). At the same time, various cities outside the Greater Bay Area are also aware of the population loss. Shanwei, for example, is a city located in Guangdong Province and outside the Greater Bay Area. The Shanwei Municipal People’s Government mentioned in the Shanwei City Population Development Plan (2020–2035)[47] that the net outflow of the population in Shanwei City is relatively large, and most of the population has moved to the Guangdong–Hong Kong–Macao Greater Bay Area. From the perspective of upward population flow, the net outflow of population to the Greater Bay Area will continue to exist. This further supports our view that in the process of urbanization in Guangdong Province, a large number of people are moving from the outer areas of the Greater Bay Area to the Greater Bay Area. This is also reasonable: The Greater Bay Area has very effective industrial clusters. There are both relatively traditional labor-intensive industries and high-tech and emerging industries, which provide a basic guarantee for the employment of the population. Moreover, the rapid development of transportation networks, such as high-speed rail and expressways has eliminated obstacles to the influx of people into the Guangdong-Hong Kong-Macao Greater Bay Area. In addition, cities in the Greater Bay Area have successively introduced talent introduction plans to provide employment subsidies, housing subsidies and other benefits for outstanding talents. Therefore, we can see the rapid urbanization of the Greater Bay Area and a large number of people are pouring into the Greater Bay Area from the outer areas of the Greater Bay Area. The former consumes a lot of natural resources, while the latter reduces people’s impact on the environment. So, under the superposition of these two factors, what kind of change trend will the ecological environment outside the Greater Bay Area show?
On the basis of previous studies showing that urban expansion leads to forest fragmentation, this research further shows that the impact of urbanization is not only inside the city but also causes the fragmentation of vegetation landscape in the outer area of the city. Although with the process of urbanization, the population flows from rural areas to urban areas, the urbanization of the Greater Bay Area demands more natural resources from the peripheral areas. The impacts of the latter are greater than that of the former. This leads to the fragmentation and fragmentation of the landscape in the external areas.
Simultaneously, during the process of urbanization in Guangdong Province, a large number of people move from the surrounding areas to the Greater Bay Area. It seems to lead to a decrease in the impact of human actions on these areas. This is indeed reflected in the grassland: the area of the grassland only shows random fluctuations, without regular decline. From the perspective of the distribution of FVC, the grassland becomes lusher overall, that is, the distribution of FVC moves in a higher direction. However, woodlands show no such signs. On the contrary, the forest area outside the Greater Bay Area is decreasing with the development of urbanization in the Greater Bay Area, and the distribution of FVC is changing from the original “bell” normal distribution to a “hump” distribution. The difference between forest and grassland may be due to their different utilization values for human beings. The most important value of grassland is ecological service value, but forests are different. According to statistics, in 2017, the output value of the forestry industry in Guangdong Province reached 802.3 billion yuan, accounting for about 12% of the national output value of the forestry industry. In 2017, there were more than 20,000 wood processing enterprises in Guangdong Province, and the production enterprises employed more than 3 million people. It can be seen that the forestry industry is one of the main industries in Guangdong Province, and the important pillar supporting the development of the forestry industry is the wood output of Guangdong Province: from 2005 to 2017, the wood output of Guangdong Province increased from 3.6215 million cubic meters to 7.93667 million cubic meters, and the main wood output comes from the area outside the Greater Bay Area. Therefore, the variation of FVC distribution in a forest can also be well explained: In 1998, the Chinese government issued the “Natural Forest Protection Project”. This project strictly controlled and protected the forests classified as ecological public welfare forests and resolutely stopped cutting and greatly reduced the amount of forest harvesting for the forests classified as general ecological public welfare forests. Finally, the regional vegetation coverage of the natural forest remained at a high level. The vegetation coverage of commercial forests and general ecological public welfare forests decreased. Simultaneously, the project of returning farmland to forest and planting trees in Guangdong Province is also continuing, and new woodlands are constantly appearing. The comprehensive effect of various policies leads to the “hump-shaped” distribution of vegetation coverage outside the Greater Bay Area, which is “high at both ends and low in the middle”.

4.2. Outer Green Space Influences Vs. Inner Green Space Influences

Zhou and Zhang [17] showed that the degree of forest fragmentation within cities increased with the urbanization process. Combined with this research, this conclusion can be extended to the ecology of the urban periphery, that is, urbanization will bring a great impact on the environment of both the inner and outer areas of the city. In the interior, the landscape is fragmented, the area is sharply reduced, and the forest cover is transformed into an impervious surface. On the outside, the situation is more complex and the utilization value is not high. Non-resource vegetation, such as grassland, will be improved to a certain extent due to the reduction of human disturbance. However, vegetation as a resource will be worsened by the rapid development of urbanization.
In this study, it can be found that the urbanization process in Guangdong has a strong correlation with the deterioration of the ecological environment outside the city. According to the theory of Jeon and Olofsson [19], Guangdong is now in the second phase of environmental degradation: the driving force has shifted from the initial agricultural expansion to the increase in urban housing and commercial development. On this basis, this paper has shown that the impact of urbanization on forests is not only manifested in explicit factors, such as urban encroachment on forest space. In the peripheral areas of urbanization, although there is no large amount of forest conversion into cities, due to the rapid development of the Greater Bay Area, people have asked for forest resources from the periphery, and ultimately caused a decrease in the area of forests. Such an implicit factor is also something that should be considered. However, it can also be seen that both the reduction in the area and the change in the vegetation coverage distribution show a trend of improvement. Fang and Liu [18] theorized that in the process of urbanization, the urban ecological environment follows the “U” trend, that is, the ecological environment quality will deteriorate first and then improve. Then we may be optimistic to believe that: with the urbanization process, people pay more attention to the ecological environment, and the ecological environment is expected to be restored and improved in the future.
Due to the limited data selected for this experiment, there are some other interferences that cannot be excluded. Since we believe that the reduction of forests in the external environment of the Greater Bay Area is related to the developed forestry in the Greater Bay Area, there may be different results for other cities with different economic composition types. At present, we find that urbanization has a strong correlation with the degradation of the peripheral environment, but it cannot be asserted that the degradation of the peripheral environment is only caused by urbanization. For example, the decline in vegetation levels observed through remote sensing data may also be linked to global climate degradation. Further investigation of the interference factors is recommended.

4.3. Challenges and Opportunities of RS and GIS

In this study, remote sensing and GIS play an important role in our research. There is a certain lack of statistics in Guangdong from decades ago, but researchers could take images from that time and get the information we needed from them. Researchers can compare and analyze images from multiple time points. The important data source of this study, LUCC data, was also obtained from the interpretation of remote sensing images by X.L. and J.Y. [42]. The accuracy of the data interpreted based on remote sensing images depends on the statistical methods used and is not affected by statistical subjective factors. This paper provides a quantitative application of remote sensing imagery. This paper not only calculates the change in vegetation area but also pays attention to the abundance of vegetation cover. For example, this paper found that between 1990 and 2020, there was no significant change in grassland cover in the outer areas of the Greater Bay Area, but grassland vegetation cover increased, that is, grassland became lusher.
In future studies, more questions can be considered to make the result more accurate. For example, when using LUCC data, we found that there were many classification errors in the land use data of 2015, which seriously affected our judgment. So, the 2015 data had to be removed from the study. At the same time, due to the different classification standards of different data sets, this study cannot use other data instead. Therefore, in the future, how to intelligently and accurately classify and improve the inversion accuracy is an urgent problem to be solved. In addition, different standards are used for different data, which also brings difficulties to the horizontal comparative study of remote sensing data. Therefore, the interpretation consistency between different data and different time series also needs special study, otherwise, it will bring great trouble to the analysis.

5. Conclusions

Previous studies have shown that urban development has reduced vegetation cover and fragmented vegetation landscapes within urban areas. At the same time, some scholars have further studied the impact of urbanization development on the urban–suburban environment and found similar effects. However, little research has been conducted on the impact of urbanization on the wider environment outside the city. Here, this paper takes the Greater Bay Area as an example to study the impact of the urbanization process in the Greater Bay Area on the ecological environment of the areas outside the Greater Bay Area in Guangdong Province from 1990 to 2020. For the evaluation of the ecological environment, this paper used the vegetation cover area as the basic evaluation of the ecological environment. In addition, this paper also calculated the landscape index and vegetation coverage of the vegetation area, so as to study the spatial distribution of vegetation and the quality of vegetation growth. The results showed that the area of grassland did not change regularly during the process of urbanization. However, the spatial distribution became more fragmented, and the vegetation coverage distribution moved toward a lusher direction. For forestland, in the process of urbanization, the area decreases year by year and has a significant correlation with the urbanization level. The spatial distribution becomes more fragmented, and the vegetation coverage changes from the natural normal distribution shape to the “hump shape” of human intervention. The results provide insights for a better understanding of urban expansion and its impact on environmental change outside the city.

Author Contributions

Conceptualization, Q.Z. and X.C.; methodology, X.C.; validation, Q.Z., X.C. and X.L.; formal analysis, Q.Z.; investigation, Q.Z.; resources, Z.W.; data curation, X.L.; writing—original draft preparation, X.C.; writing—review and editing, Q.Z.; visualization, Q.Z.; supervision, Z.W. and X.Y.; project administration, Z.W.; funding acquisition, X.Y. All authors have read and agreed to the published version of the manuscript.

Funding

This research was funded by the National Natural Science Foundation of China (Grant No. 41890854; 41901354) and the Innovation Project of LREIS (Grant No. O88RAA01YA).

Institutional Review Board Statement

Not applicable.

Informed Consent Statement

Not applicable.

Data Availability Statement

Not applicable.

Conflicts of Interest

The authors declare no conflict of interest.

References

  1. Seto, K.C.; Fragkias, M. Quantifying Spatiotemporal Patterns of Urban Land-use Change in Four Cities of China with Time Series Landscape Metrics. Landsc. Ecol. 2005, 20, 871–888. [Google Scholar] [CrossRef]
  2. Weng, Y.-C. Spatiotemporal changes of landscape pattern in response to urbanization. Landsc. Urban Plan. 2007, 81, 341–353. [Google Scholar] [CrossRef]
  3. Wei, Y.D.; Li, H.; Yue, W. Urban land expansion and regional inequality in transitional China. Landsc. Urban Plan. 2017, 163, 17–31. [Google Scholar] [CrossRef]
  4. Bren d’Amour, C.; Reitsma, F.; Baiocchi, G.; Barthel, S.; Guneralp, B.; Erb, K.H.; Seto, K.C. Future urban land expansion and implications for global croplands. Proc. Natl. Acad. Sci. USA 2017, 114, 8939–8944. [Google Scholar] [CrossRef] [PubMed]
  5. Liu, X.; Pei, F.; Wen, Y.; Li, X.; Wang, S.; Wu, C.; Liu, Z. Global urban expansion offsets climate-driven increases in terrestrial net primary productivity. Nat. Commun. 2019, 10, 5558. [Google Scholar] [CrossRef]
  6. van Vliet, J. Direct and indirect loss of natural area from urban expansion. Nat. Sustain. 2019, 2, 755–763. [Google Scholar] [CrossRef]
  7. Bai, X.; McPhearson, T.; Cleugh, H.; Nagendra, H.; Tong, X.; Zhu, T.; Zhu, Y.G. Linking Urbanization and the Environment: Conceptual and Empirical Advances. Annu. Rev. Environ. Resour. 2017, 42, 215–240. [Google Scholar] [CrossRef]
  8. Matteucci, S.D.; Morello, J. Environmental consequences of exurban expansion in an agricultural area: The case of the Argentinian Pampas ecoregion. Urban Ecosyst. 2009, 12, 287–310. [Google Scholar] [CrossRef]
  9. Alig, R.J.; Kline, J.D.; Lichtenstein, M. Urbanization on the US landscape: Looking ahead in the 21st century. Landsc. Urban Plan. 2004, 69, 219–234. [Google Scholar] [CrossRef]
  10. MacDonald, K.; Rudel, T.K. Sprawl and forest cover: What is the relationship? Appl. Geogr. 2005, 25, 67–79. [Google Scholar] [CrossRef]
  11. Zhang, X.; Brandt, M.; Tong, X.; Ciais, P.; Yue, Y.; Xiao, X.; Fensholt, R. A large but transient carbon sink from urbanization and rural depopulation in China. Nat. Sustain. 2022, 5, 321–328. [Google Scholar] [CrossRef]
  12. Zhou, W.; Yu, W.; Qian, Y.; Han, L.; Pickett, S.T.; Wang, J.; Ouyang, Z. Beyond city expansion: Multi-scale environmental impacts of urban megaregion formation in China. Natl. Sci. Rev. 2022, 9, nwab107. [Google Scholar] [CrossRef] [PubMed]
  13. Seto, K.C.; Guneralp, B.; Hutyra, L.R. Global forecasts of urban expansion to 2030 and direct impacts on biodiversity and carbon pools. Proc. Natl. Acad. Sci. USA 2012, 109, 16083–16088. [Google Scholar] [CrossRef] [PubMed]
  14. Fujita, A.; Maeto, K.; Kagawa, Y.; Ito, N. Effects of forest fragmentation on species richness and composition of ground beetles (Coleoptera: Carabidae and Brachinidae) in urban landscapes. Entomol. Sci. 2008, 11, 39–48. [Google Scholar] [CrossRef]
  15. McKinney, M.L. Effects of urbanization on species richness: A review of plants and animals. Urban Ecosyst. 2008, 11, 161–176. [Google Scholar] [CrossRef]
  16. Ng, C.N.; Xie, Y.J.; Yu, X.J. Measuring the spatio-temporal variation of habitat isolation due to rapid urbanization: A case study of the Shenzhen River cross-boundary catchment, China. Landsc. Urban Plan. 2011, 103, 44–54. [Google Scholar] [CrossRef]
  17. Zhou, W.; Zhang, S.; Yu, W.; Wang, J.; Wang, W. Effects of Urban Expansion on Forest Loss and Fragmentation in Six Megaregions, China. Remote Sens. 2017, 9, 991. [Google Scholar] [CrossRef]
  18. Fang, C.; Liu, H.; Wang, S. The coupling curve between urbanization and the eco-environment: China’s urban agglomeration as a case study. Ecol. Indic. 2021, 130, 108107. [Google Scholar] [CrossRef]
  19. Jeon, S.B.; Olofsson, P.; Woodcock, C.E. Land use change in New England: A reversal of the forest transition. J. Land Use Sci. 2013, 9, 105–130. [Google Scholar] [CrossRef]
  20. Zhou, W.; Huang, G.; Pickett, S.T.; Cadenasso, M.L. 90 years of forest cover change in an urbanizing watershed: Spatial and temporal dynamics. Landsc. Ecol. 2011, 26, 645–659. [Google Scholar] [CrossRef]
  21. Gong, C.; Chen, J.; Yu, S. Spatiotemporal dynamics of urban forest conversion through model urbanization in Shenzhen, China. Int. J. Remote Sens. 2011, 32, 9071–9092. [Google Scholar] [CrossRef]
  22. Nielsen, A.B.; Hedblom, M.; Olafsson, A.S.; Wistrom, B. Spatial configurations of urban forest in different landscape and socio-political contexts: Identifying patterns for green infrastructure planning. Urban Ecosyst. 2016, 20, 379–392. [Google Scholar] [CrossRef]
  23. Su, S.; Xiao, R.; Jiang, Z.; Zhang, Y. Characterizing landscape pattern and ecosystem service value changes for urbanization impacts at an eco-regional scale. Appl. Geogr. 2012, 34, 295–305. [Google Scholar] [CrossRef]
  24. Cao, H.; Liu, J.; Fu, C.; Zhang, W.; Wang, G.; Yang, G.; Luo, L. Urban Expansion and Its Impact on the Land Use Pattern in Xishuangbanna since the Reform and Opening up of China. Remote Sens. 2017, 9, 137. [Google Scholar] [CrossRef]
  25. Fang, C.; Yu, D. Urban agglomeration: An evolving concept of an emerging phenomenon. Landsc. Urban Plan. 2017, 162, 126–136. [Google Scholar] [CrossRef]
  26. Tv, R.; Aithal, B.H.; Sanna, D.D. Insights to urban dynamics through landscape spatial pattern analysis. Int. J. Appl. Earth Obs. Geoinf. 2012, 18, 329–343. [Google Scholar] [CrossRef]
  27. Liu, F.; Zhang, Z.; Wang, X. Forms of Urban Expansion of Chinese Municipalities and Provincial Capitals, 1970s–2013. Remote Sens. 2016, 8, 930. [Google Scholar] [CrossRef]
  28. Shao, Z.; Fu, H.; Fu, P.; Yin, L. Mapping Urban Impervious Surface by Fusing Optical and SAR Data at the Decision Level. Remote Sens. 2016, 8, 945. [Google Scholar] [CrossRef]
  29. Kuang, W.; Huo, Y.; Duo, Y.; Lu, D.; Yang, S. Mapping Global Urban Impervious Surface and Green Space Fractions Using Google Earth Engine. Remote Sens. 2021, 13, 4187. [Google Scholar] [CrossRef]
  30. Liu, F.; Zhao, Y.; Muhammad, R.; Liu, X.; Chen, M. Impervious Surface Expansion: A Key Indicator for Environment and Urban Agglomeration—A Case Study of Guangdong-Hong Kong-Macao Greater Bay Area by Using Landsat Data. J. Sens. 2020, 2020, 3896589. [Google Scholar] [CrossRef]
  31. Tao, H.; Nan, Y.; Liu, Z.-F. Spatiotemporal Patterns of Forest in the Transnational Area of Changbai Mountain from 1977 to 2015: A Comparative Analysis of the Chinese and DPRK Sub-Regions. Sustainability 2017, 9, 1054. [Google Scholar] [CrossRef]
  32. Peng, J.; Liu, Y.; Shen, H.; Han, Y.; Pan, Y. Vegetation coverage change and associated driving forces in mountain areas of Northwestern Yunnan, China using RS and GIS. Env. Monit. Assess. 2012, 184, 4787–4798. [Google Scholar] [CrossRef] [PubMed]
  33. Qian, Y.; Zhou, W.; Li, W.; Han, L. Understanding the dynamic of greenspace in the urbanized area of Beijing based on high resolution satellite images. Urban For. Urban Green. 2015, 14, 39–47. [Google Scholar] [CrossRef]
  34. Yu, W.; Zhou, W.; Qian, Y.; Yan, J. A new approach for land cover classification and change analysis: Integrating backdating and an object-based method. Remote Sens. Environ. 2016, 177, 37–47. [Google Scholar] [CrossRef]
  35. Kaufmann, R.K.; Seto, K.C. Change detection, accuracy, and bias in a sequential analysis of Landsat imagery in the Pearl River Delta, China: Econometric techniques. Agric. Ecosyst. Environ. 2001, 85, 95–105. [Google Scholar] [CrossRef]
  36. Hu, Z. Using NDVI Differencing and Temporal Logic to Enhance ISODATA Classification in Urban Environments. GIScience Remote Sens. 2013, 44, 48–67. [Google Scholar] [CrossRef]
  37. Madhavan, B.B.; Kubo, S.; Kurisaki, N.; Sivakumar, T.V.L.N. Appraising the anatomy and spatial growth of the Bangkok Metropolitan area using a vegetation-impervious-soil model through remote sensing. Int. J. Remote Sens. 2010, 22, 789–806. [Google Scholar] [CrossRef]
  38. Phinn, S.; Stanford, M.; Scarth, P.; Murray, A.T.; Shyy, P.T. Monitoring the composition of urban environments based on the vegetation-impervious surface-soil (VIS) model by subpixel analysis techniques. Int. J. Remote Sens. 2010, 23, 4131–4153. [Google Scholar] [CrossRef]
  39. Yuan, F.; Bauer, M.E. Comparison of impervious surface area and normalized difference vegetation index as indicators of surface urban heat island effects in Landsat imagery. Remote Sens. Environ. 2007, 106, 375–386. [Google Scholar] [CrossRef]
  40. Boentje, J.P.; Blinnikov, M.S. Post-Soviet forest fragmentation and loss in the Green Belt around Moscow, Russia (1991–2001): A remote sensing perspective. Landsc. Urban Plan. 2007, 82, 208–221. [Google Scholar] [CrossRef]
  41. Zhao, Y. Remote sensing survey and proposal for protection of the natural resources in Guangdong—Hong Kong—Macao Greater Bay Area. Remote Sens. Land Resour. 2018, 30, 9. [Google Scholar]
  42. Xu, X.L.; Liu, J.Y.; Zhang, S.W.; Li, R.D.; Yan, C.Z.; Wu, S.X. Multi-Period Land Use Land Cover Remote Sensing Monitoring Dataset in China (CNLUCC); Chinese Academy of Sciences: Beijing, China, 2018. [Google Scholar]
  43. Gong, P.; Li, X.; Wang, J.; Bai, Y.; Chen, B.; Hu, T.; Zhou, Y. Annual maps of global artificial impervious area (GAIA) between 1985 and 2018. Remote Sens. Environ. 2020, 236, 111510. [Google Scholar] [CrossRef]
  44. Wang, S.; Pu, Y.; Li, S.; Li, R.; Li, M. Spatio-Temporal Analysis of Impervious Surface Expansion in the Qinhuai River Basin, China, 1988–2017. Remote Sens. 2021, 13, 4494. [Google Scholar] [CrossRef]
  45. Zhang, M.; Du, H.; Zhou, G.; Mao, F.; Li, X.; Zhou, L.; Huang, Z. Spatiotemporal Patterns and Driving Force of Urbanization and Its Impact on Urban Ecology. Remote Sens. 2022, 14, 1160. [Google Scholar] [CrossRef]
  46. Xu, J.; Zhao, Y.; Zhong, K.; Zhang, F.; Liu, X.; Sun, C. Measuring spatio-temporal dynamics of impervious surface in Guangzhou, China, from 1988 to 2015, using time-series Landsat imagery. Sci. Total Environ. 2018, 627, 264–281. [Google Scholar] [CrossRef]
  47. S.M.P.s. Government (Ed.) Shanwei City Population Development Plan (2020–2035), Shanwei Municipal People's Government: Shanwei Municipal People's Government Portal. 2022. Available online: http://www.shanwei.gov.cn/shanwei/zwgk/jcxx/zfwj/qt/content/post_797329.html (accessed on 21 August 2022).
Figure 1. Location and DEM of the study areas.
Land 11 01426 g001
Figure 2. Multi-period land use/land cover remote sensing monitoring data.
Land 11 01426 g002aLand 11 01426 g002b
Figure 3. Impervious surface area of the Greater Bay Area.
Land 11 01426 g003aLand 11 01426 g003b
Figure 4. The workflow of this study.
Land 11 01426 g004
Figure 5. The expansion of impervious surface in the Greater Bay Area (a) The impervious surface area of the Greater Bay Area varies with the year (b) The growth rate of impervious water area in the Greater Bay Area in different years.
Land 11 01426 g005
Figure 6. Changes in the proportion of urban population in Guangdong Province.
Land 11 01426 g006
Figure 7. Vegetation area varies with year (a) changes in forest (b) changes in grass.
Land 11 01426 g007
Figure 8. FVC outside the Greater Bay Area; (a) AREA_MN of grassland; (b) AREA_MN of forest; (c) PD of grassland; (d) PD of forest.
Land 11 01426 g008
Figure 9. FVC outside the Greater Bay Area.
Land 11 01426 g009
Figure 10. Vegetation coverage of grassland in different years. (a) In 1990; (b) In 2000; (c) In 2005; (d) In 2010; (e) In 2020.
Land 11 01426 g010
Figure 11. Vegetation coverage of forest in different years. (a) In 1990; (b) In 2000; (c) In 2005; (d) In 2010; (e) In 2020.
Land 11 01426 g011
Figure 12. The correlation matrix.
Land 11 01426 g012
Publisher’s Note: MDPI stays neutral with regard to jurisdictional claims in published maps and institutional affiliations.

